dbms phase ii report final - …wria1project.whatcomcounty.org/uploads/usu/dbms phase ii...
TRANSCRIPT

DBMS Phase II Report 1 Utah State University
Geodatabase Management System - Phase II Report 1 Robert T. Pack, Utah State University, Utah Water Research Laboratory 2 Final Report Dated December 1, 2001 3 4 I. Introduction 5 6 This report summarizes Phase II activities associated with Geodatabase Management 7 System work as defined in "Statement of Work for Technical Studies Prepared for WRIA 8 1 Watershed Management Project by the Utah Water Research Laboratory, Utah State 9 University" dated July 21, 2000. 10 11 II. WRIA 1 Metadata Catalog 12 13 Besides summarizing the metadata catalog that has been developed (Deliverable 1), this 14 section of the report summarizes activities associated with Tasks 1, 2 & 3 of the 15 geodatabase management system (DBMS) portion of the SOW. 16 17 Data Catalog Assembly 18 19 This task has focused on the collection of all decision-relevant data associated with the 20 WRIA 1 Watershed Management Project. The type of information USU is gathering has 21 three categories: (1) references to data, reports, papers, etc. (2) information about data 22 including sources, quality, definitions, etc. (metadata); and (3) the data, reports, papers, 23 etc. themselves. Separate databases are being developed that deal with each of these 24 three categories. The first category of information is being handled by a reference 25 databases popular among researchers called "Endnote". This database structure is 26 facilitating the cataloging of relevant reports or data and the subsequent attachment of 27 these references in report bibliographies. Once a reference to a report or paper is 28 discovered and located, the actual report (category 3 information) can be obtained and 29 read. 30 31 If, on the other hand, relevant data (rather than a report) is discovered in the reference 32 database, further information about the data must (hopefully) be obtained by reading a 33 detailed metadata record (category 2 information) found in a separate database. For this 34 reason a metadata catalog is being developed. 35 36 A data cataloging procedure has been implemented at USU. Following is a summary of 37 how different types of data are being handled: 38 39 1. References to Data or Reports - 40
• Reports, papers, etc. - Endnote Database on USU data server; a standard style has 41 been customized to include a "location" field 42
• Geographic data - Endnote Database on USU data server; a custom style has been 43 developed that includes a "location" field and "metadata file" field. 44
• Non-geographic data - Endnote Database on USU data server; a custom style has 45 been created that includes a "location" field and "metadata file" field. 46
DBMS Phase II Report 2 Utah State University
47 48 2. Data about the data (metadata) - 49
• Geographic data - FGDC metadata format through the RTSE SMMS 3oh! Spatial 50 GIS metadata/Data Manager posted on USU data server 51
• Non geographic data (less common) - FGDC format metadata format with 52 geographic references left blank. 53
54 3. The data or reports themselves 55
• Hardcopy reports, papers, etc. - Libraries at USU and in WRIA1; personal offices 56 when checked out 57
• Electronic reports, papers, etc. - USU data server 58 • Geographic data - USU data server 59 • Non-geographic data - USU data server 60
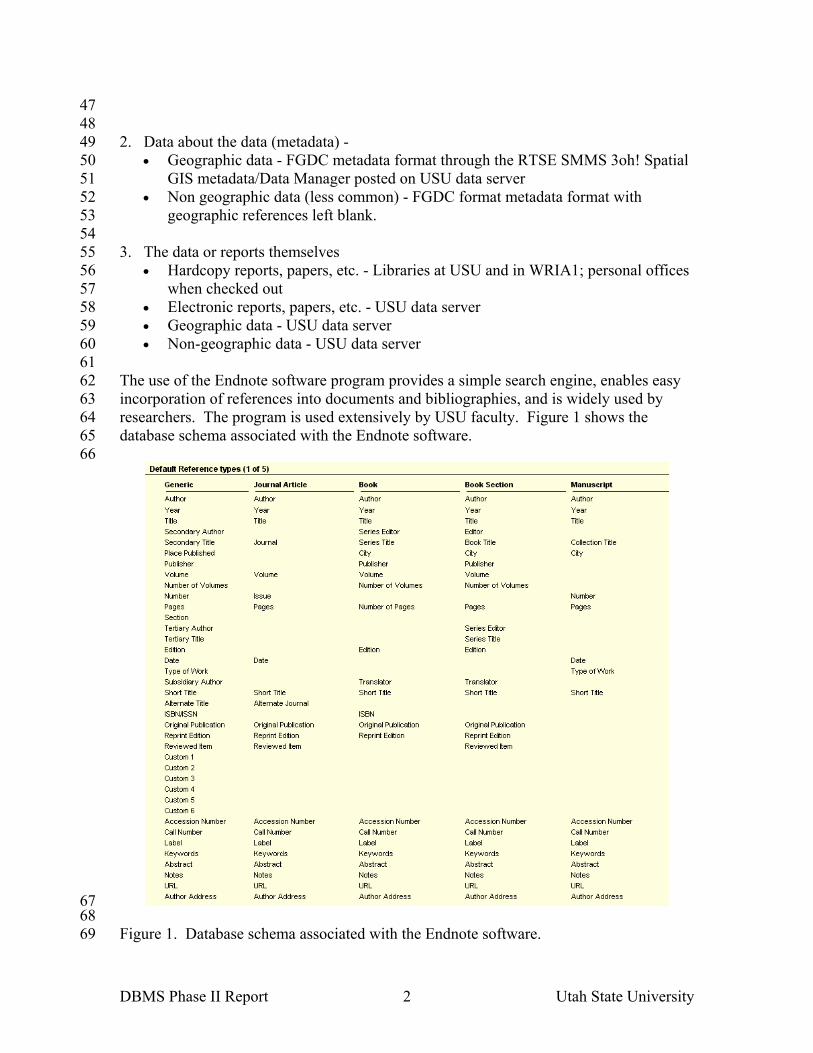
61 The use of the Endnote software program provides a simple search engine, enables easy 62 incorporation of references into documents and bibliographies, and is widely used by 63 researchers. The program is used extensively by USU faculty. Figure 1 shows the 64 database schema associated with the Endnote software. 65 66
67 68 Figure 1. Database schema associated with the Endnote software. 69
DBMS Phase II Report 3 Utah State University
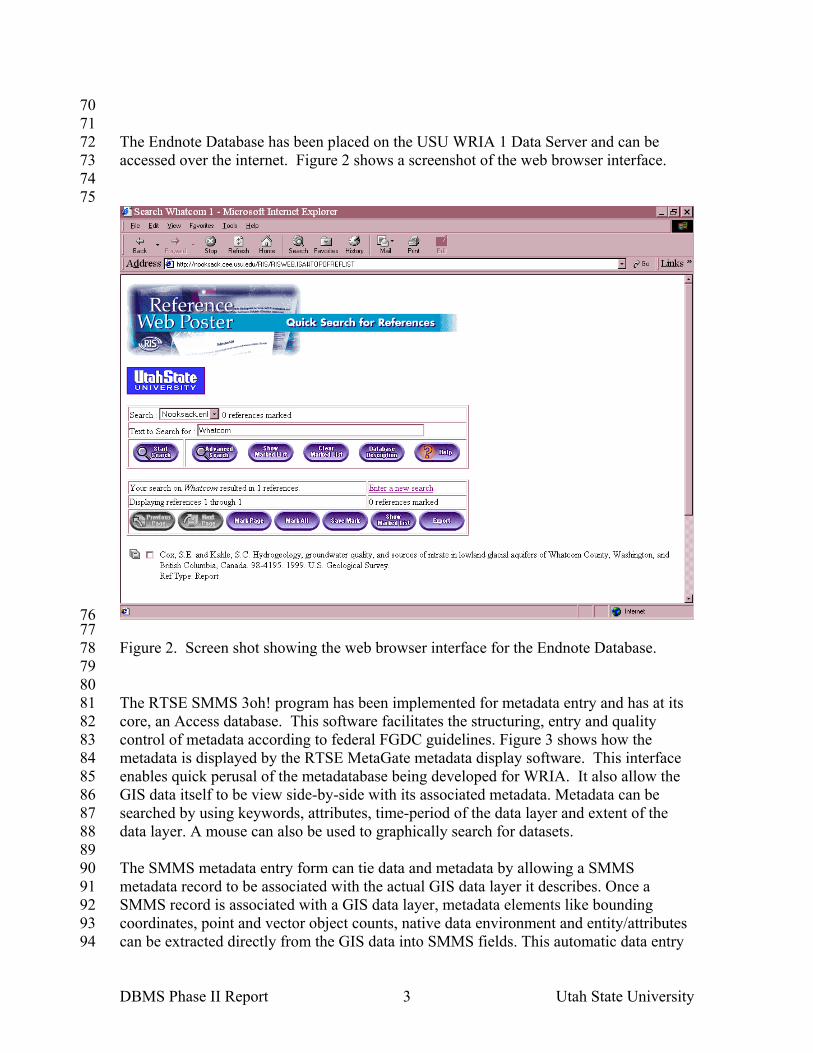
70 71 The Endnote Database has been placed on the USU WRIA 1 Data Server and can be 72 accessed over the internet. Figure 2 shows a screenshot of the web browser interface. 73 74 75
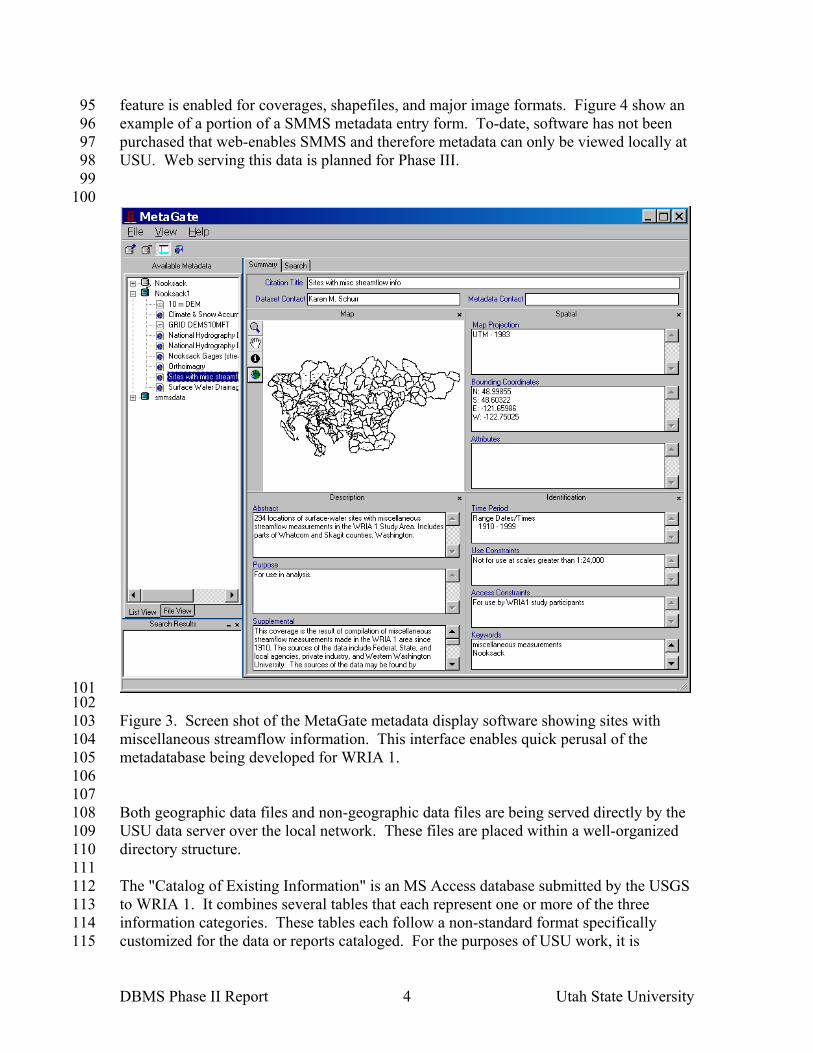
76 77 Figure 2. Screen shot showing the web browser interface for the Endnote Database. 78 79 80 The RTSE SMMS 3oh! program has been implemented for metadata entry and has at its 81 core, an Access database. This software facilitates the structuring, entry and quality 82 control of metadata according to federal FGDC guidelines. Figure 3 shows how the 83 metadata is displayed by the RTSE MetaGate metadata display software. This interface 84 enables quick perusal of the metadatabase being developed for WRIA. It also allow the 85 GIS data itself to be view side-by-side with its associated metadata. Metadata can be 86 searched by using keywords, attributes, time-period of the data layer and extent of the 87 data layer. A mouse can also be used to graphically search for datasets. 88 89 The SMMS metadata entry form can tie data and metadata by allowing a SMMS 90 metadata record to be associated with the actual GIS data layer it describes. Once a 91 SMMS record is associated with a GIS data layer, metadata elements like bounding 92 coordinates, point and vector object counts, native data environment and entity/attributes 93 can be extracted directly from the GIS data into SMMS fields. This automatic data entry 94
DBMS Phase II Report 4 Utah State University
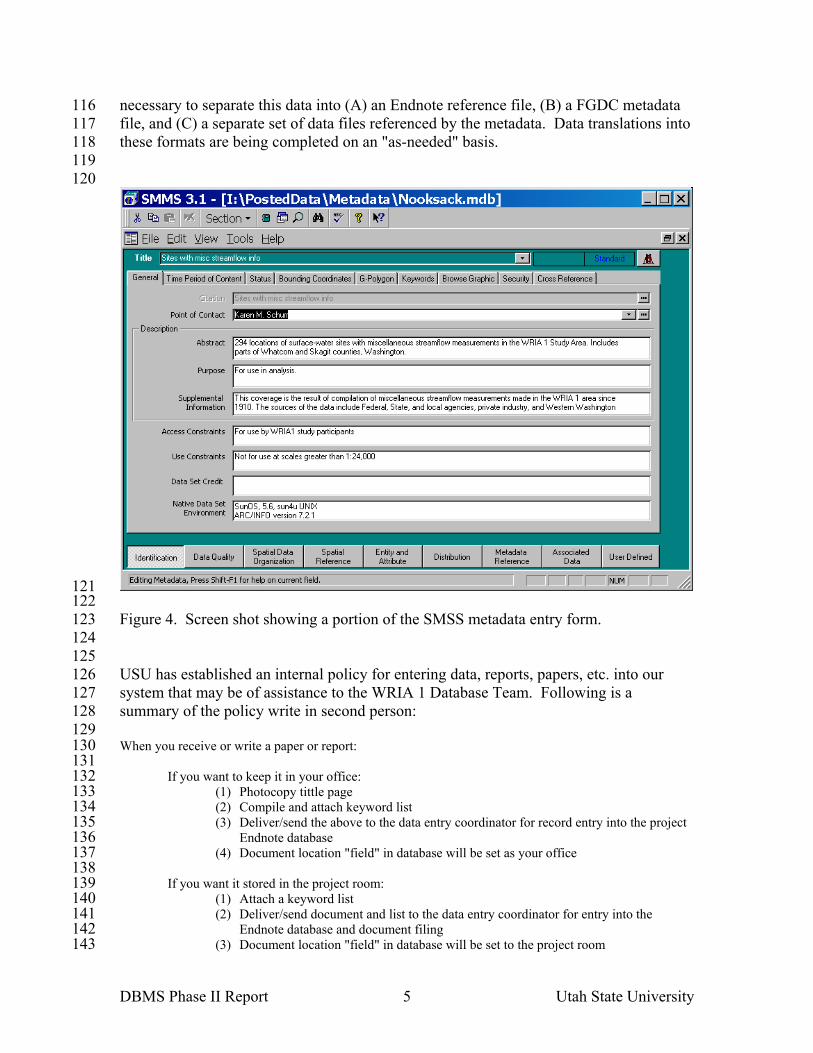
feature is enabled for coverages, shapefiles, and major image formats. Figure 4 show an 95 example of a portion of a SMMS metadata entry form. To-date, software has not been 96 purchased that web-enables SMMS and therefore metadata can only be viewed locally at 97 USU. Web serving this data is planned for Phase III. 98 99 100
101 102 Figure 3. Screen shot of the MetaGate metadata display software showing sites with 103 miscellaneous streamflow information. This interface enables quick perusal of the 104 metadatabase being developed for WRIA 1. 105 106 107 Both geographic data files and non-geographic data files are being served directly by the 108 USU data server over the local network. These files are placed within a well-organized 109 directory structure. 110 111 The "Catalog of Existing Information" is an MS Access database submitted by the USGS 112 to WRIA 1. It combines several tables that each represent one or more of the three 113 information categories. These tables each follow a non-standard format specifically 114 customized for the data or reports cataloged. For the purposes of USU work, it is 115
DBMS Phase II Report 5 Utah State University
necessary to separate this data into (A) an Endnote reference file, (B) a FGDC metadata 116 file, and (C) a separate set of data files referenced by the metadata. Data translations into 117 these formats are being completed on an "as-needed" basis. 118 119 120
121 122 Figure 4. Screen shot showing a portion of the SMSS metadata entry form. 123 124 125 USU has established an internal policy for entering data, reports, papers, etc. into our 126 system that may be of assistance to the WRIA 1 Database Team. Following is a 127 summary of the policy write in second person: 128 129 When you receive or write a paper or report: 130
131 If you want to keep it in your office: 132
(1) Photocopy tittle page 133 (2) Compile and attach keyword list 134 (3) Deliver/send the above to the data entry coordinator for record entry into the project 135
Endnote database 136 (4) Document location "field" in database will be set as your office 137
138 If you want it stored in the project room: 139
(1) Attach a keyword list 140 (2) Deliver/send document and list to the data entry coordinator for entry into the 141
Endnote database and document filing 142 (3) Document location "field" in database will be set to the project room 143

DBMS Phase II Report 6 Utah State University
144 When you find out about a paper or report and you only want it entered in the database: 145 146
(1) Write down reference information and keywords as well as the document location 147 (2) Send/email to the data entry coordinator for entry into the database 148 (3) Document location "field" will be set to the location specified. 149
150 When you find out about a paper or report and you want it ordered: 151 152
(1) Write down reference information and keywords 153 (2) Send/email to the data entry coordinator for entry into the database 154 (3) Document location "field" in database will be set to "on-order" 155 (4) Burgandy will then forward the order request to the appropriate individual or organization 156
157 When you receive or create digital data and you want it on the server: 158 159
(1) Compile and attach metadata including keyword list. Metadata must conform to metadata 160 standard of the Federal Geographic Data Committee (FGDC). The RTSE software should be 161 used in filling out the metadata. 162
(2) Deliver the data and metadata files to Bob Pack or his assistant. 163 (3) Metadata will be sent to the data entry coordinator for insertion into the FGDC-compliant 164
metadatabase and a metadata html page will be generated 165 (4) Data and metadata will be posted on the data server and you will be informed where to 166
retrieve it. 167 (5) Reference to the data will be entered in the Endnote database and the document location 168
"field" in Endnote database that points to the metadata will be set to "server" 169 170
When you receive or create digital data and you don't want it on the server: 171 172
(1) Compile metadata including keyword list. Metadata must conform to metadata standard of 173 the Federal Geographic Data Committee (FGDC). A computer program will be made 174 available to assist in filling out the metadata. 175
(2) Send metadata directly to the data entry coordinator for insertion into the database. A 176 metadata html page will then be generated. 177
(3) Metadata html page will be posted on the data server 178 (4) Data location "field" in the Endnote database will be set to your office 179
180 181 This data catalog assembly task is to be completed during Phase III. The work completed 182 to date is on schedule insofar as the data needs of the USU Technical Teams is concerned 183 and the intent of the Phase II Task 1. The assembly of database information is well ahead 184 of the data entry process and hence there is a large backlog of data that still requires input 185 (in the 100’s of entries). This lag in entry is large due to the need to allocate resources to 186 the Watershed Characterization viewer at the request of the WRIA 1 technical teams. 187 This backlog will be taken care of during Phase III. 188
189 190
Data Collection 191 192 In support of the USU science team, all GIS data relevant to the modeling system as well 193 as the decision support system (DSS) has been assembled. Geographic data has been 194
DBMS Phase II Report 7 Utah State University
transformed to a common UTM Zone 10 NAD 83 projection and datum as required. To 195 date, no transformations of vertical (3D) data have been required. 196 197 Databases that have been developed in support of the USU team activities include: 198 199 a) groundwater data from existing sources including: surficial aquifers; public water 200
supply wells including well depth, water treatment type, well capacity, and resident 201 population; surficial aquifer depth to water contours based on well information; 202 water table contours based on selected wells and surface water elevations; USGS 203 wells from ground water site information; surficial aquifer thickness based on well 204 information (Sumas – Blaine); land use/land cover created from the USGS GIRAS 205 files; Washington state major shorelines and state boundaries; critical aquifer 206 recharge areas as designated by Whatcom County; potential ground water 207 contamination sources; wellhead protection zones for Washington state; recent well 208 head protection zones including both circular and non-circular from WCHHSD; 209 locations and dates of miscellaneous streamflow measurements done by USGS, 210 WWU, DOE, WCCD, etc.; NRCS soil GIS vector files; public water system well 211 locations; Whatcom County Health and Humans Services Department (WCHHSD) 212 well log database; USGS pdf maps on project area ground water system & surface 213 water system downloaded from the USGS site; USGS National Water Information 214 System (NWIS) well database; Washington DOE well database files from Aquifer 215 Vulnerability Project; Washington DOH public drinking water supply database; 216 Whatcom Water Division database; well log data from WCHHSD with 3200 records 217
218 b) groundwater data generated by the groundwater group including: well-location layers 219
prepared from well data/attributes; water elevation layers were interpolated for years 220 of records with the most wells (1971, 1972, 1990, 1991, 1994, 1995); surficial and 221 non-surficial hydraulic conductivity layers interpolated for the LENS area; depth of 222 impermeable layer interpolated for the LENS study area. 223
224 c) surface water quantity-related data collected from external sources is given in the 225
following table: 226 227
Data Type Details Source
Measured Streamflow 29 stations - historic daily flow in electronic format USGS
Measured Streamflow 7 stations – digitized historic daily flow Published Reports
Measured Streamflow 10 stations – hard copy of daily flows – seasonal coverage only
Published Reports
Climate Data (precipitation, temperature, all other available parameters)
14 gages – at highest level of resolution (daily, monthly) NOAA/NWS
Wind Speed/Direction Various sites in Whatcom County
Northwest Air Pollution Authority (NWAPA)
Spatial Estimate of 1961-1990 Average Precipitation
Generated using the PRISM methodology. (preliminary version that includes Canadian
Chris Daly, Oregon State University
DBMS Phase II Report 8 Utah State University
portions so covers all of WRIA 1 )
Spatial Estimate of 1961-1990 Average Minimum and Maximum Temperature
Generated using the PRISM methodology. (preliminary version that includes Canadian portions so covers all of WRIA 1 )
Chris Daly, Oregon State University
Snow Water Equivalent 13 Manual Snow Course, 2 SnoTel at highest resolution available
NRCS
228 d) surface water quantity-related data generated internally is given in the following 229
table: 230 231
Data Type Details Source
Statistics of Measured Streamflow
Monthly and annual averages and standard deviation
USU Surface Water Quantity (SWQN) Task 1 report
Delineation of Gauged Watersheds
Watersheds for Gages with electronic streamflow data delineated from digital elevation models using TARDEM software.
USU SWQN Task 2 report
Hydrologic Stratification of Gauged Watersheds
Rainfall driven or Glacial/Snowmelt driven or both
USU SWQN Task 1 report
Naturalized Streamflow
Estimates of long-term mean monthly streamflow at 32 gages with at least 1 year of record
USU SWQN Task 2 report
Naturalized Runoff
Estimates of long-term mean monthly runoff at 176 drainages with complete DEM data
USU SWQN Task 2 report
Standard Error of Naturalized Runoff Estimates
At 176 drainages with complete DEM data USU SWQN Task 2 report
Present-day Runoff
Estimates of present-day long-term mean monthly runoff at 176 drainages with complete DEM data
USU SWQN Task 2 report
Diversion Volume Estimate of Middle Fork Nooksack R. to Lake Whatcom
USU SWQN Task 2 report
Statistics of Gauged Precipitation Data
Monthly averages and standard deviation USU SWQN Task 1 report
Statistics of Snow Water Equivalent
Monthly averages and standard deviation USU SWQN Task 1 report
Categorized Water Use (agriculture, residential, commercial/industrial, public water supply systems)
Estimated surface and ground water use by drainage – for 128 drainages with detailed Tax Parcel information
USU SWQN Task 3 report and Public Utility District 1 (PUD)
Estimate of Net Consumptive Water Use
Estimated increase in evapotranspiration over natural land-use conditions by
USU SWQN Task 3 report and PUD

DBMS Phase II Report 9 Utah State University
drainage – for 128 drainages with detailed Tax Parcel information
Water Balance Error For 176 drainages with full DEM data USU SWQN Task 3 report
232 233 e) surface water quality-related data from existing sources including: Washington DOW 234
ambient water quality database; Washington DOE environmental information 235 management database; USGS national water quality assessment data warehouse; 236 Whatcom County Shellfish Protection Districts Water Quality Database; Western 237 Washington University Institute for Watershed Studies Lake Whatcom Monitoring 238 Project long-term monitoring data; Lummi Nation Natural Resources temperature 239 data; Lummi Nation Skookum Creek Hatchery monitoring reports; Nooksack Indian 240 Tribe Water Quality Department water quality data; Western Washington University 241 Institute for Watershed Studies Kamm Creek Watershed monitoring project; 242 Whatcom Conservation District Acme Watershed water quality monitoring project 243 Phase I: 1998-1999; City of Bellingham Middle Fork Nooksack temperature data 244
245 f) surface water quality data collected during the Utah State University field study. 246 247 These data holdings are found on the Nooksack Project data server and are easily 248 accessible to the team. Where needed transformations into the project UTM Zone 10 249 NAD83 map projection has been made. Metadata files are in development and will 250 continue as a part of Phase III. Many of these data are directly linked to the tools 251 described in the following sections. 252 253 This task is to be completed during Phase III. This work is on schedule insofar as the data 254 needs of the USU Technical Teams is concerned. 255 256 257 Computer Server 258 259 A Windows NT based computer server with approximately 500 GB of RAID 5 storage 260 has been assembled. The server has RAID 5 redundancy so as to ensure down-times of 261 no more than 24 hours in the event of a disk failure. All DSS-relevant data sets are also 262 loaded on the server. Concurrent with the data assembly and loading, a web server has 263 been established. Our analysis indicates that Citrix Application Server software will 264 provide the most flexibility for browser-based interfacing with the DSS. This software 265 could not be purchased under the Phase II budget and has been deferred to Phase III. 266 Web links have not been established with stakeholder dynamic data sets because no such 267 datasets have yet been identified. ArcView Shape and Grid formats have been set as the 268 primary geographic exchange format. However, Arc/Info coverages are another 269 convenient format that has been incorporated as a primary format. 270 271 272 273

DBMS Phase II Report 10 Utah State University
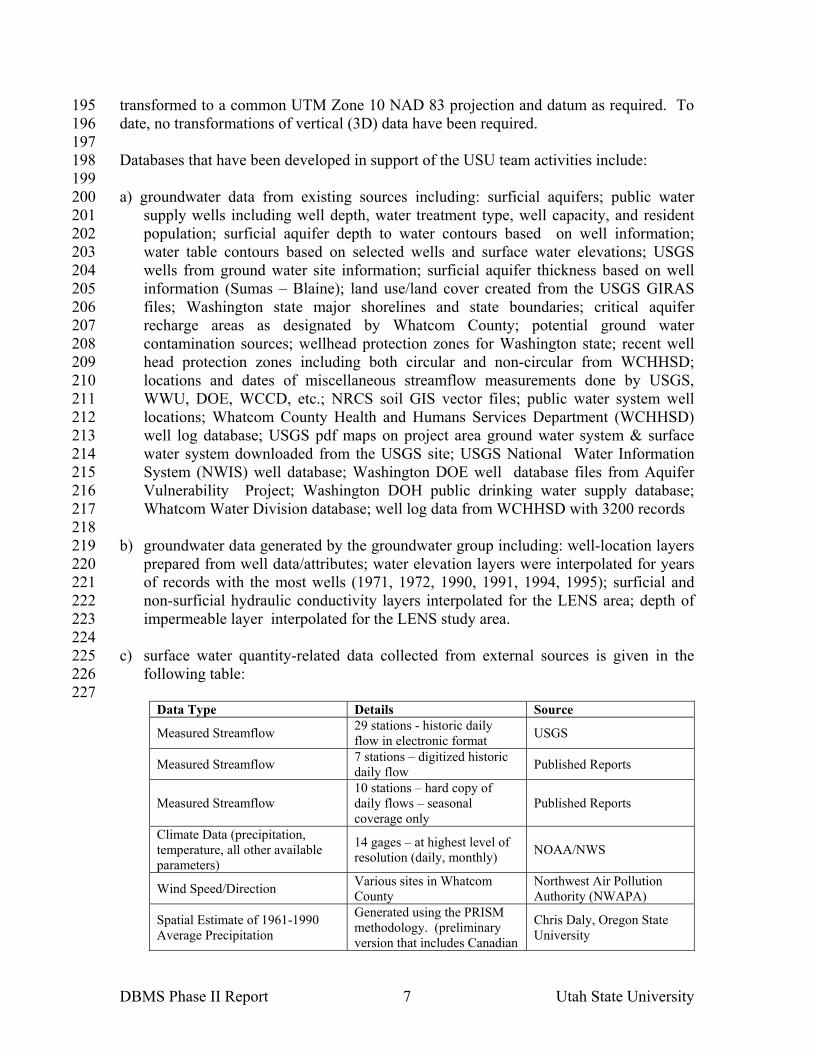
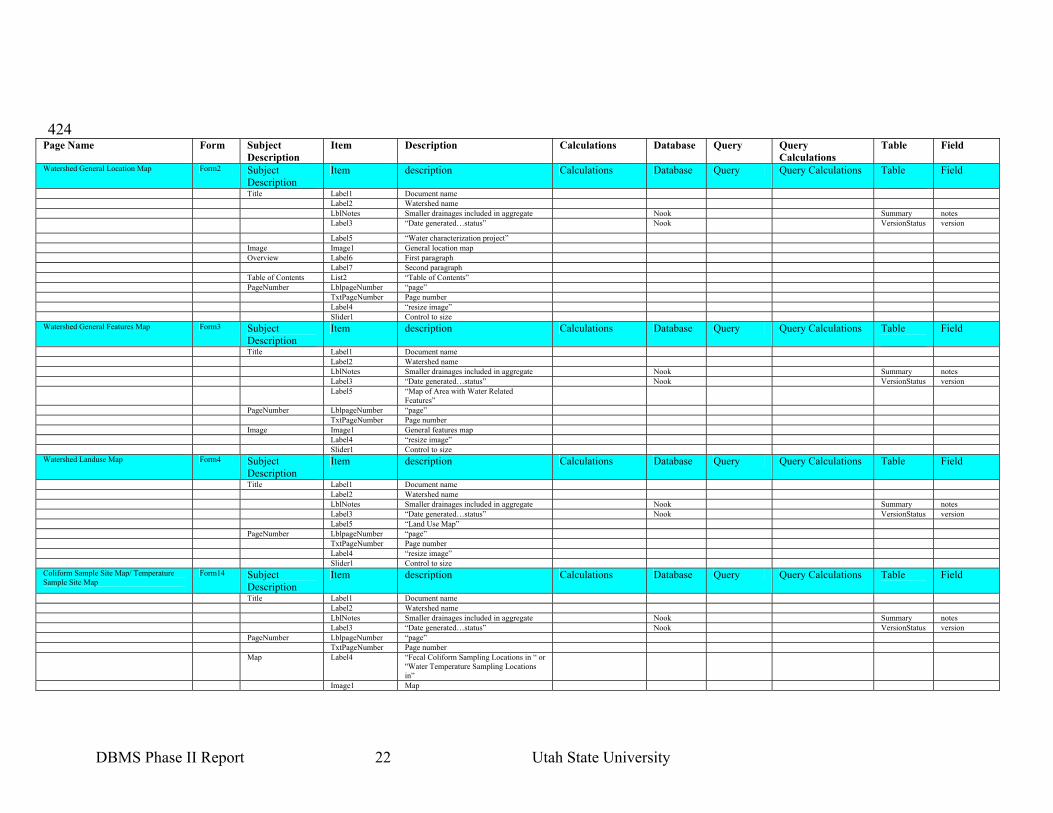
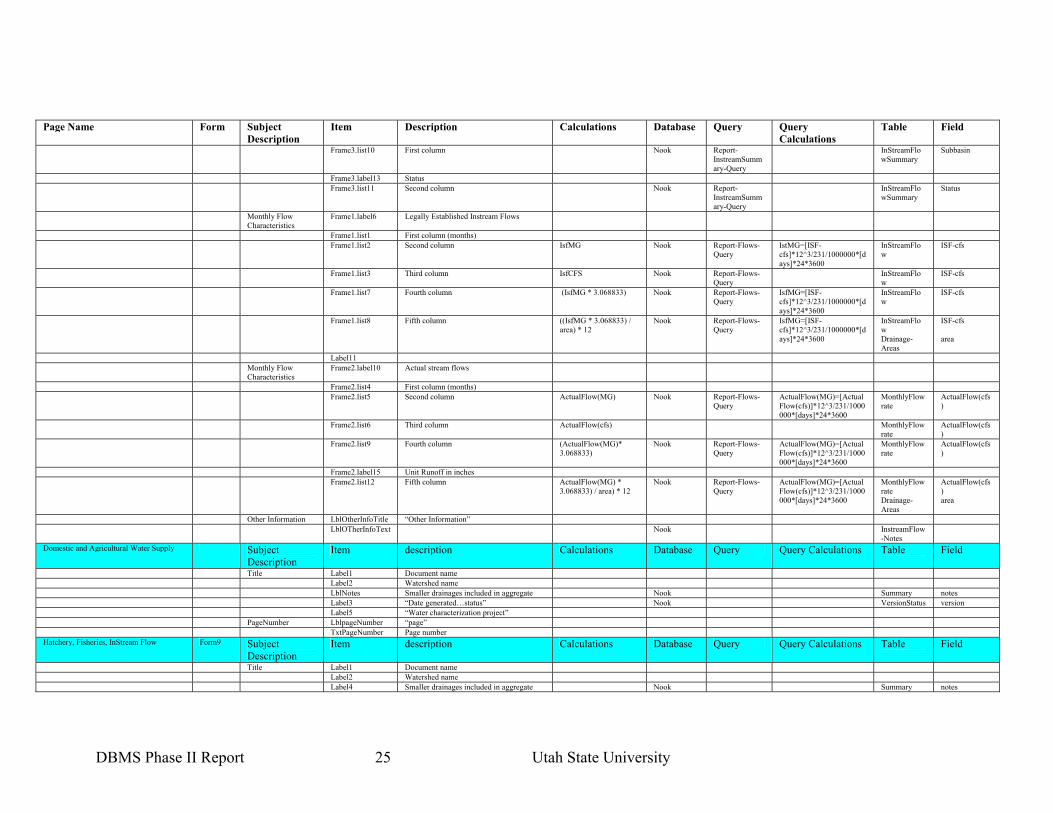
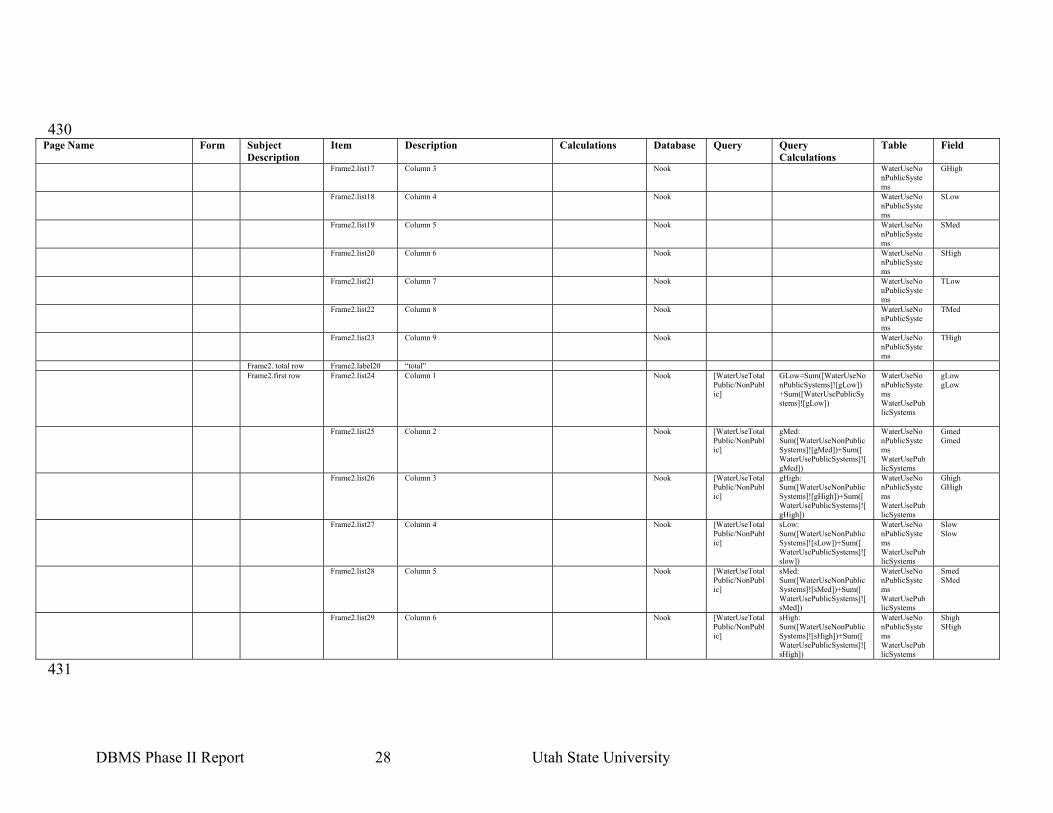
III. DBMS Management and Visualization Software Development 274 275 This section summarizes work associated with Deliverables 2 & 3 and the associated 276 Tasks 4 and 5 of the DBMS portion of the SOW. 277 278 The design and coding of the database management system (DBMS) system has 279 progressed in parallel with the design and coding of the DSS system discussed in a 280 separate DSS Phase II report. Sequential Query Language (SQL) queries and reports have 281 been designed in Access 2000 along with data translation and data distillation modules. 282 A program interface that will eventually be a part of the DSS will also be designed and 283 implemented. Developer tools used include Visual Basic, Visual Basic for Applications, 284 and Access 2000. 285 286 Although this work was identified as a focus for Phase III activities, USU provided 287 technical assistance to develop a geodatabase exploration tool that provides the linkage 288 between the project databases and a broad scale summary overview of WRIA 1 289 watershed characteristics. Sue Blake from Whatcom County Water Resources and Becky 290 Peterson from Public Utility District # 1 have developed a general WRIA 1 wide 291 summary (see Summary Characterization for Water Resource Inventory Area # 1) for use 292 by the Technical Teams and caucus members involved in the WRIA 1 Watershed 293 Management Project. 294 295 Our efforts involved the development of an analytical tool to provide detailed summary 296 capabilities based on design concepts provided by WRIA 1 staff team and technical 297 teams. This tool was developed in Visual Basic and allows the user to select one of 298 twenty watersheds (these are fixed aggregates of the 170 delineated basins) and then 299 generate 16 different summary reports and/or six different summary maps on a wide 300 array of watershed characteristics. Figures 5 through 22 illustrate some of the data 301 display formats. 302
DBMS Phase II Report 11 Utah State University
303 Figure 5. For a given watershed, many data summary tables can be generated. 304 305 306
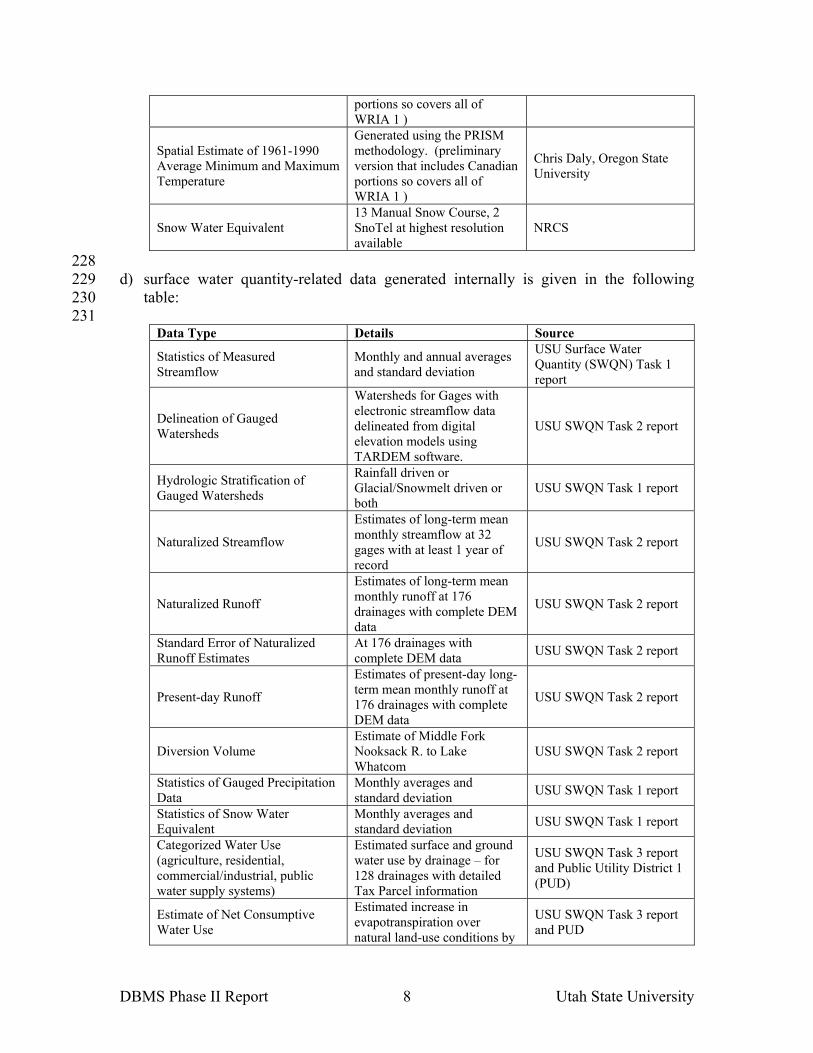
307 308 Figure 6. The software includes a help file system. 309
DBMS Phase II Report 12 Utah State University
310
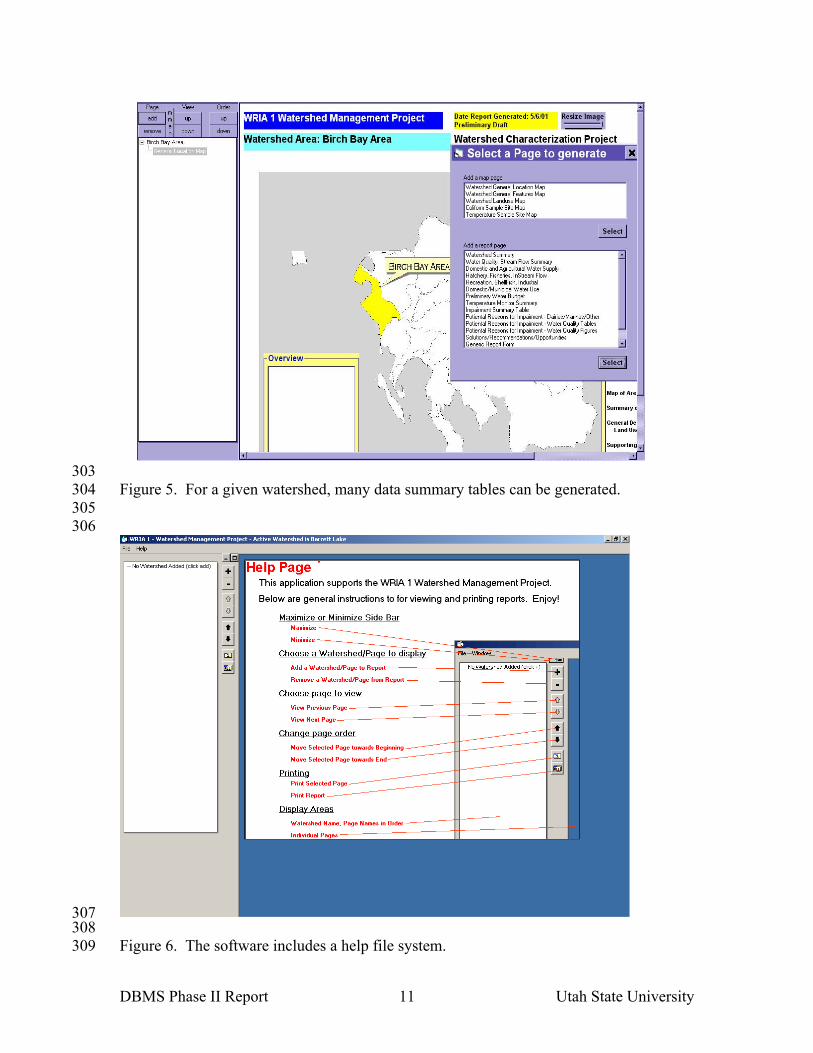
311 312 Figure 7. Watershed overview window. 313 314 315
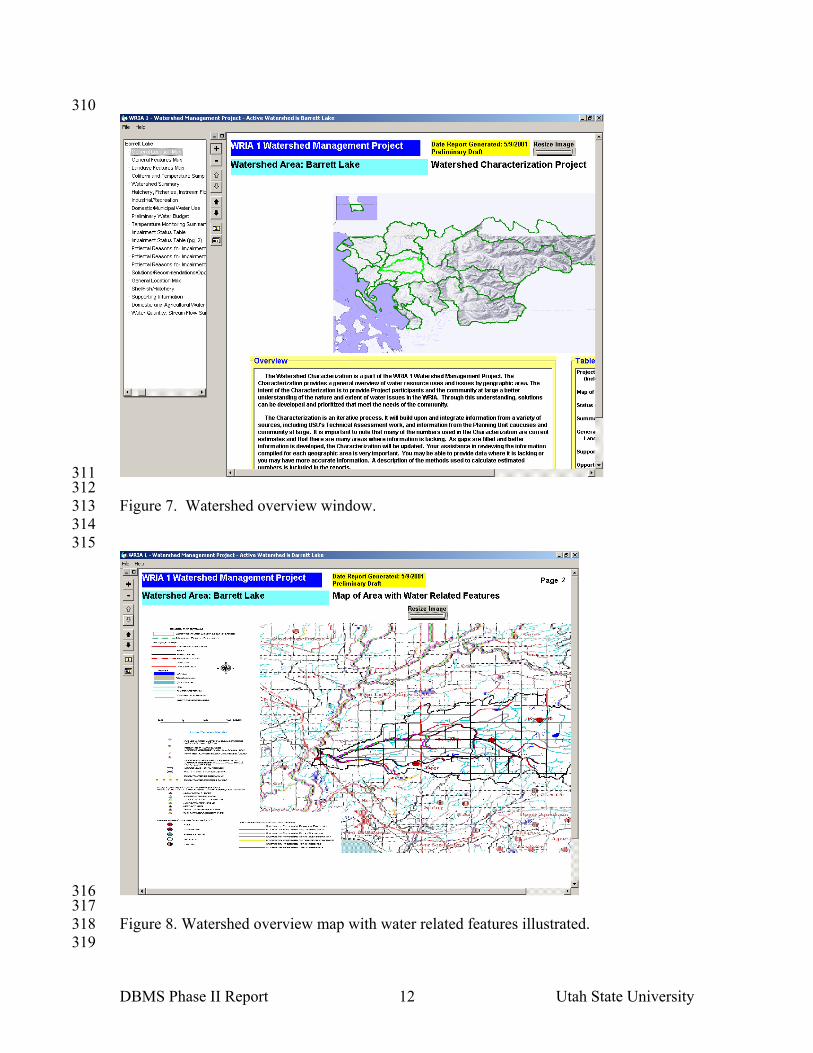
316 317 Figure 8. Watershed overview map with water related features illustrated. 318 319

DBMS Phase II Report 13 Utah State University
320 321 Figure 9. Watershed landuse map. 322 323
324 325 Figure 10. General description of watershed zoning characteristics and cover types. 326

DBMS Phase II Report 14 Utah State University
327
328 329 Figure 11. Fisheries beneficial use summary. 330 331
332 333 Figure 12. Beneficial use summary for industrial water use and recreation. In this 334 particular watershed, there is no data. 335 336

DBMS Phase II Report 15 Utah State University
337 338 Figure 13. Beneficial use summary for domestic-municipal water use. 339 340
341 342 Figure 14. Preliminary water budget. 343 344

DBMS Phase II Report 16 Utah State University
345 346 Figure 15. Temperature monitoring data summary (no data for this watershed). 347 348
349 350 Figure 16. Status of beneficial uses (screen 1). 351 352
DBMS Phase II Report 17 Utah State University
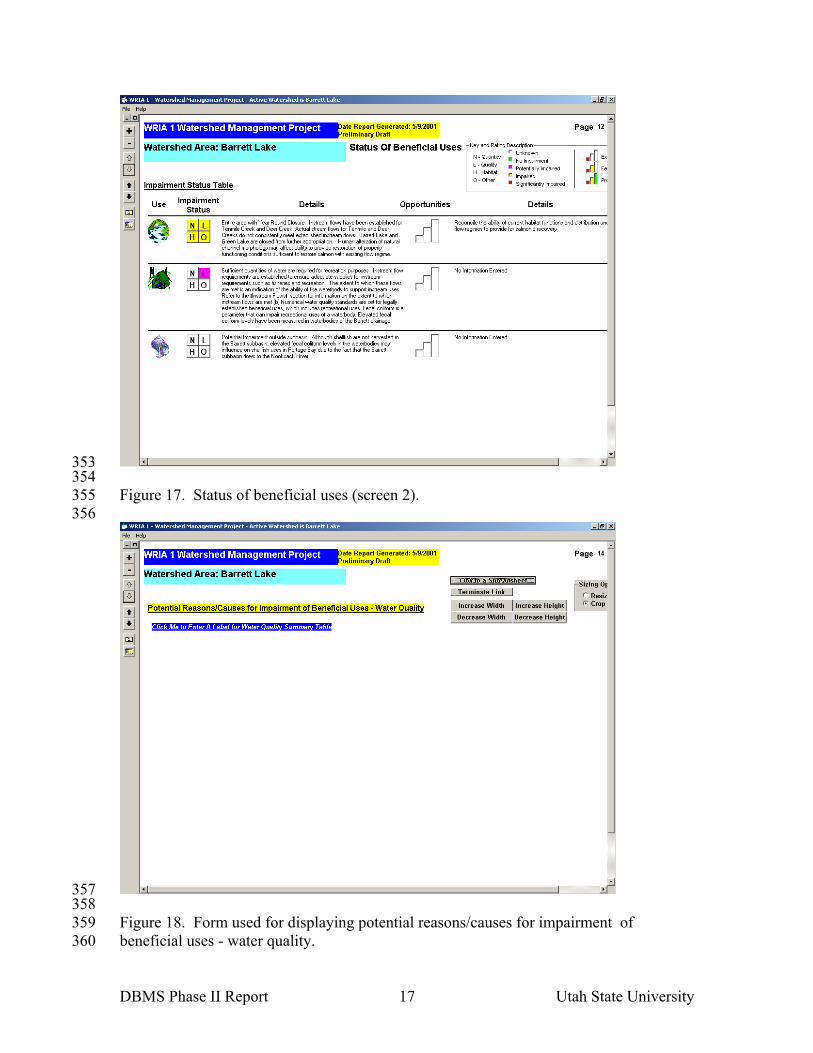
353 354 Figure 17. Status of beneficial uses (screen 2). 355 356
357 358 Figure 18. Form used for displaying potential reasons/causes for impairment of 359 beneficial uses - water quality. 360
DBMS Phase II Report 18 Utah State University
361
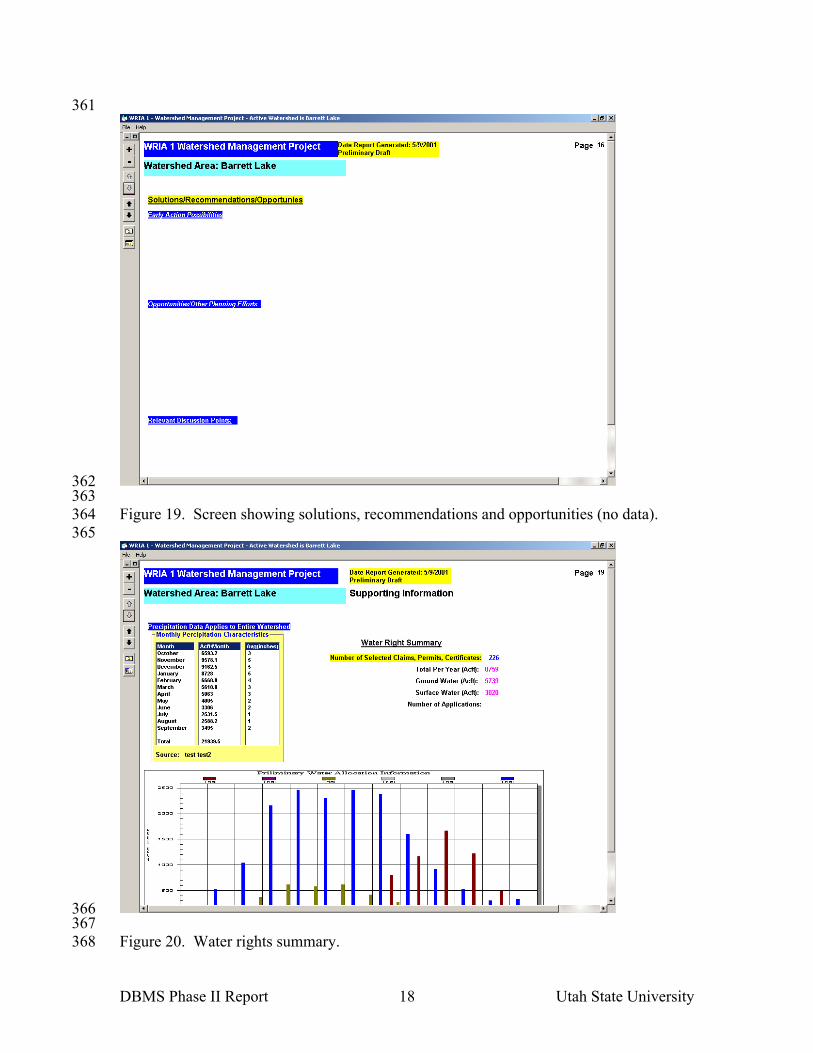
362 363 Figure 19. Screen showing solutions, recommendations and opportunities (no data). 364 365
366 367 Figure 20. Water rights summary. 368
DBMS Phase II Report 19 Utah State University
369
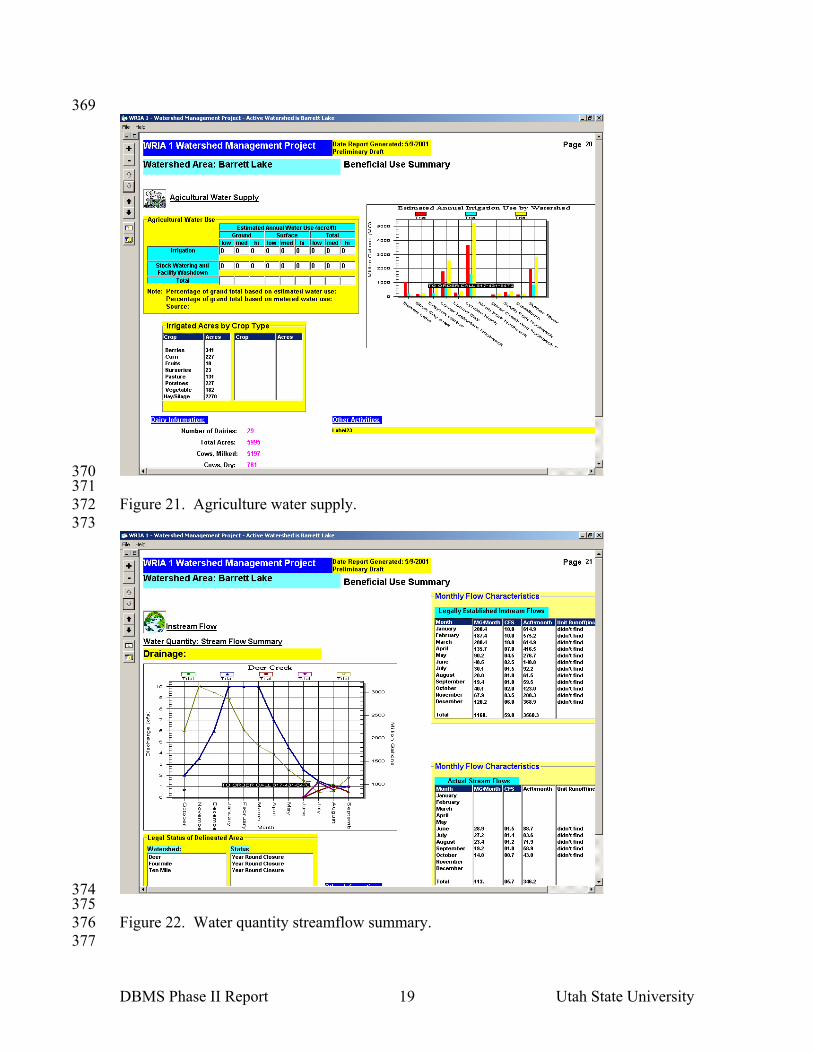
370 371 Figure 21. Agriculture water supply. 372 373
374 375 Figure 22. Water quantity streamflow summary. 376 377
DBMS Phase II Report 20 Utah State University
378 The tool will automatically generate these report pages, allow the user to reorder or select 379 any combination of reports, produce a table of contents, and print all report pages. 380 381 The underlying database can be updated with new or revised information without the 382 need to update the interface software system. Although the system was initially 383 implemented to aggregate information for the twenty pre-defined watersheds, the 384 underlying database and software is designed to allow this summary information to be 385 generated for each of the 170 drainages independently, or arbitrary combinations of these 386 drainages. This later feature is proposed to be fully implemented as part of Phase III 387 work from within the prototype data viewer and analysis tool described next. The 388 existing watershed characterization tool is essentially intended to provide an example of 389 the ‘top’ layer of summary data access and visualization capabilities. 390 391 The database structure and SQL queries associated with this system are complex and 392 reflects a variety of data visualization needs. Appendix A tabulates in detail the database 393 and query schema associated with this software. 394 395 This task is to be completed during Phase III. This task is further along than it was 396 anticipated it would be at this time in terms of actual computer coding. Though this data 397 view is not yet implemented on the internet, it will be during Phase III. 398 399 400 IV. Outline of Geodatabase Portion of DSS Technical Manuals 401 402 At this stage of the study, it is premature to provide a DBMS documentation outline that 403 will stand at the time a draft technical manual is produced during Phase III. This work is 404 on-going and is integrated with DSS development activities. The reader is refered to Part 405 III of the Decision Support System Phase II Report for more information. 406 407 408 409
410
DBMS Phase II Report 21 Utah State University
410 411 412 413 414 415 416 417 418 419 420
APPENDIX A 421 422
DBMS DATA AND QUERY STRUCTURE FOR VISUALIZATION SOFTWARE 423
DBMS Phase II Report 22 Utah State University
424 Page Name Form
Subject Description
Item Description Calculations Database Query Query Calculations
Table
Field
Watershed General Location Map Form2 Subject Description
Item description Calculations Database Query Query Calculations Table
Field
Title Label1 Document name Label2 Watershed name LblNotes Smaller drainages included in aggregate Nook Summary notes Label3 “Date generated…status” Nook VersionStatus version
Label5 “Water characterization project” Image Image1 General location map Overview Label6 First paragraph Label7 Second paragraph Table of Contents List2 “Table of Contents” PageNumber LblpageNumber “page” TxtPageNumber Page number Label4 “resize image” Slider1 Control to size Watershed General Features Map Form3 Subject
Description Item description Calculations Database Query Query Calculations Table
Field
Title Label1 Document name Label2 Watershed name LblNotes Smaller drainages included in aggregate Nook Summary notes Label3 “Date generated…status” Nook VersionStatus version Label5 “Map of Area with Water Related
Features”
PageNumber LblpageNumber “page” TxtPageNumber Page number Image Image1 General features map Label4 “resize image” Slider1 Control to size Watershed Landuse Map Form4 Subject
Description Item description Calculations Database Query Query Calculations Table
Field
Title Label1 Document name Label2 Watershed name LblNotes Smaller drainages included in aggregate Nook Summary notes Label3 “Date generated…status” Nook VersionStatus version Label5 “Land Use Map” PageNumber LblpageNumber “page” TxtPageNumber Page number Label4 “resize image” Slider1 Control to size Coliform Sample Site Map/ Temperature Sample Site Map
Form14 Subject Description
Item description Calculations Database Query Query Calculations Table
Field
Title Label1 Document name Label2 Watershed name LblNotes Smaller drainages included in aggregate Nook Summary notes Label3 “Date generated…status” Nook VersionStatus version PageNumber LblpageNumber “page” TxtPageNumber Page number Map Label4 “Fecal Coliform Sampling Locations in “ or
"Water Temperature Sampling Locations in”
Image1 Map

DBMS Phase II Report 23 Utah State University
425 Page Name Form
Subject Description
Item Description Calculations Database Query Query Calculations
Table
Field
Notes Label6 “Notes:”
Label5 Nook Quality-FecalMapNotes or Quality-TempMapNotes
notes
Data1 CommonDiolag1 Used to get map file location Watershed Summary Form5 Subject
Description Item description Calculations Database Query Query Calculations Table
Field
Title Label1 Document name Label2 Watershed name Label4 Smaller drainages included in aggregate Nook Summary notes Label3 “Date generated…status” Nook VersionStatus version Label17 “General Description of Area” PageNumber LblpageNumber “page” TxtPageNumber Page number Summary
descriptions Lavbel5 “Summary descriptions”
Label6 Watershed Area: ____ Square Miles areaacres/ 640 Nook Summary Areaacres Label6 (cont.) (_____ Acres) Nook Summary Areaacres Zoning
characteristics Frame2.list1 zoning Zoning WCPLAN
Frame2.list2 (TotalArea) * (3.8610216 * 10 ^ -7)
Zoning TotalArea = sum(area) Zoning WCPLAN AREA
Frame2.list3 (TotalArea / ZoneTotalArea) * 100
Zoning TotalArea = sum(area) ZoneTotalArea = sum(TotalArea)
Zoning WCPLAN AREA
Cover types Frame1.list7 Cover Cover LEVEL1 Frame1.list8 (TotalArea *
(3.8610216 * 10 ^ -7) Cover TotalArea = sum(area) Cover TotalArea
Frame1.list9 (TotalArea/ TotalCoverArea) * 100)
Cover TotalCoverArea = sum(sum(AREA))
Cover AREA
Zoning Characteristics graph
OLE1.pepcoa1 Zoning TotalArea = sum(AREA) Zoning AREA WCPLAN
Cover types graph OLE3.peopcoa3 Cover TotalArea = sum(AREA) Cover LEVEL1 AREA
Last Estimated Census Count:
Label7 Text
Label12 Value Nook Population Census Year of Census
Count: Label8 Text
Label13 value Nook Population Year Assumed Annual
Population Growth (%):
Label9 Text
Label14 value Nook Summary Popadj Estimated Population Label10 Text Label15 value (1 + PopAdj) ^
(Format(Now(), "yyyy") - Year) * census
Nook Summary Population Population
Popadj Year census

DBMS Phase II Report 24 Utah State University
426 Page Name Form
Subject Description
Item Description Calculations Database Query Query Calculations
Table
Field
Estimated Year Population Density (#/sq mile):
Label11 Text
Label16 value (1 + PopAdj) ^ (Format(Now(), "yyyy") - Year) * Census/ (areaacres / 640)
Nook Summary Population Population Summary
Popadj Year Census areaacres
Economic Indicators: Annual Average
Household Income: Label19 Text
Label18 value Nook EconomicIndicators
AnnualAve
Residents per Household:
Label21 Text
Label20 Value Nook EconomicIndicators
Residents
Annual Gross Economic Product:
Label23 Text
Label22 Value Nook EconomicIndicators
AGP
Population Demographics:
Label25 Text
Label24 Value Nook EconomicIndicators
PopDemo
Economic Sector Composition:
Label27 Text
Label26 Value Nook EconomicIndicators
SectorComp
Water Quality: Stream Flow Summary Form6 Subject Description
Item description Calculations Database Query Query Calculations Table
Field
Title Label1 Document name Label2 Watershed name Label4 Smaller drainages included in aggregate Nook Summary notes Label3 “Date generated…status” Nook VersionStatus version Label16 “Beneficial Use Summary” PageNumber LblpageNumber “page” TxtPageNumber Page number Icon Picture1 Label17 Instream Flow Label5 Water Quantity: Stream Flow Summary Label8 Nook Report-Flows-
Query Watersheds-
Locations Location
OLE1.pepcoa1 Nook Report-Flows-Query
MonthlyFlowrate InStreamFlow MonthlyFlowrate MonthlyFlowrate
ActualFlow(cfs) ISF-cfs HighFlow(cfs) LowFlow(cfs)
Instream flow summary
Frame3.label9 Subbasin InstreamFlow-Notes
Notes
427
DBMS Phase II Report 25 Utah State University
Page Name Form
Subject Description
Item Description Calculations Database Query Query Calculations
Table
Field
Frame3.list10 First column Nook Report-InstreamSummary-Query
InStreamFlowSummary
Subbasin
Frame3.label13 Status Frame3.list11 Second column Nook Report-
InstreamSummary-Query
InStreamFlowSummary
Status
Monthly Flow Characteristics
Frame1.label6 Legally Established Instream Flows
Frame1.list1 First column (months) Frame1.list2 Second column IsfMG Nook Report-Flows-
Query IstMG=[ISF-cfs]*12^3/231/1000000*[days]*24*3600
InStreamFlow
ISF-cfs
Frame1.list3 Third column IsfCFS Nook Report-Flows-Query
InStreamFlow
ISF-cfs
Frame1.list7 Fourth column (IsfMG * 3.068833) Nook Report-Flows-Query
IsfMG=[ISF-cfs]*12^3/231/1000000*[days]*24*3600
InStreamFlow
ISF-cfs
Frame1.list8 Fifth column ((IsfMG * 3.068833) / area) * 12
Nook Report-Flows-Query
IsfMG=[ISF-cfs]*12^3/231/1000000*[days]*24*3600
InStreamFlow Drainage-Areas
ISF-cfs area
Label11 Monthly Flow
Characteristics Frame2.label10 Actual stream flows
Frame2.list4 First column (months) Frame2.list5 Second column ActualFlow(MG) Nook Report-Flows-
Query ActualFlow(MG)=[ActualFlow(cfs)]*12^3/231/1000000*[days]*24*3600
MonthlyFlowrate
ActualFlow(cfs)
Frame2.list6 Third column ActualFlow(cfs) MonthlyFlowrate
ActualFlow(cfs)
Frame2.list9 Fourth column (ActualFlow(MG)* 3.068833)
Nook Report-Flows-Query
ActualFlow(MG)=[ActualFlow(cfs)]*12^3/231/1000000*[days]*24*3600
MonthlyFlowrate
ActualFlow(cfs)
Frame2.label15 Unit Runoff in inches Frame2.list12 Fifth column ActualFlow(MG) *
3.068833) / area) * 12 Nook Report-Flows-
Query ActualFlow(MG)=[ActualFlow(cfs)]*12^3/231/1000000*[days]*24*3600
MonthlyFlowrate Drainage-Areas
ActualFlow(cfs) area
Other Information LblOtherInfoTitle “Other Information” LblOTherInfoText Nook InstreamFlow
-Notes
Domestic and Agricultural Water Supply Subject Description
Item description Calculations Database Query Query Calculations Table
Field
Title Label1 Document name Label2 Watershed name LblNotes Smaller drainages included in aggregate Nook Summary notes Label3 “Date generated…status” Nook VersionStatus version Label5 “Water characterization project” PageNumber LblpageNumber “page” TxtPageNumber Page number Hatchery, Fisheries, InStream Flow Form9 Subject
Description Item description Calculations Database Query Query Calculations Table
Field
Title Label1 Document name Label2 Watershed name Label4 Smaller drainages included in aggregate Nook Summary notes

DBMS Phase II Report 26 Utah State University
428 Page Name Form
Subject Description
Item Description Calculations Database Query Query Calculations
Table
Field
Label3 “Date generated…status” Nook VersionStatus version Label18 “Beneficial Use Summary” PageNumber LblpageNumber “page” TxtPageNumber Page number Icon Picture1 Label6 Fisheries Label22 “Known or Presumed Presence” Fish Species Frame1.label10 “Existing” Frame1.list1 First column Nook [Report-
FisheriesCurrent-Query]
Historic checked Fisheries Species
Frame1.label11 “Historical” Frame1.list2 Second column Nook [Report-
FisheriesHistoric-Query]
Known checked Fisheries Species
Other information Label7 “Other Information” Frame4.Label23 Priority Fisheries
Areas Frame3.label16 “Waterbody”
Frame3.list5 First column Nook InStreamFlowPFA
Waterbody
Frame3.label15 “Priority Area” Frame3.list6 Second column Nook InStreamFlo
wPFA PriorityArea
Frame3.label14 “Purpose” Frame3.list7 Third Nook InStreamFlo
wPFA Purpose
Recreation, ShellFish, Industial Form10 Subject Description
Item description Calculations Database Query Query Calculations Table
Field
Title Label1 Document name Label2 Watershed name Label4 Smaller drainages included in aggregate Nook Summary notes Label3 “Date generated…status” Nook VersionStatus version Label11 “Beneficial Use Summary” PageNumber LblpageNumber “page” TxtPageNumber Page number Icon Picture3 Label18 “Industrial Water Use” Other Information Label9 “Other Information” Frame6.label8 Icon Picture2 Label6 “Recreation” Recreation Activity
Summary Frame3.label16 “Location”
Frame3.list5 First column Nook Quality-ImpairMarinas
Marina
Frame3.label15 “Activities” Frame3.list6 Second column Nook Recreation Activities Frame3.label14 “Contact” Frame3.list7 Third column Nook Recreation contact Frame3.label10 “Noncontact” Frame3.list1 Fourth column Nook Recreation noncontact Data1

DBMS Phase II Report 27 Utah State University
429 Page Name Form
Subject Description
Item Description Calculations Database Query Query Calculations
Table
Field
Domestic/Municipal Water Use Form11 Subject Description
Item description Calculations database Query Query Calculations Table
Field
Title Label1 Document name Label2 Watershed name LblNotes Smaller drainages included in aggregate Nook Summary notes Label3 “Date generated…status” Nook VersionStatus version Label12 “Beneficial Use Summary” PageNumber LblpageNumber “page” TxtPageNumber Page number Icon Picture1 Label5 “Domestic/Municipal Water Use” Frame2 Frame2.label “Estimated Annual Water Use (acre/ft)” Frame2.top labels Frame2.label15 “Ground” Frame2.label16 “Surface” Frame2.label17 “Total” Frame2.label21 “low” Frame2.label24 “med” Frame2.label25 “hi” Frame2.label26 “low” Frame2.label27 “med” Frame2.label28 “hi” Frame2.label29 “low” Frame2.label30 “med” Frame2.label31 “hi” Frame2. Public
Water Systems (Group A and B) row
Frame2.label18 Public Water Systems (Group A and B)”
Frame2.list6 Column 1 Nook WaterUsePublicSystems
Glow
Frame2.list7 Column 2 Nook WaterUsePublicSystems
GMed
Frame2.list8 Column 3 Nook WaterUsePublicSystems
GHigh
Frame2.list9 Column 4 Nook WaterUsePublicSystems
SLow
Frame2.list10 Column 5 Nook WaterUsePublicSystems
SMed
Frame2.list11 Column 6 Nook WaterUsePublicSystems
SHigh
Frame2.list12 Column 7 Nook WaterUsePublicSystems
TLow
Frame2.list13 Column 8 Nook WaterUsePublicSystems
TMed
Frame2.list14 Column 9 Nook WaterUsePublicSystems
THigh
Frame2. Non-Public Systems (e.g. private wells) row
Frame2.label19 “Non-Public Systems (e.g. private wells)”
Frame2.list15 Column 1 Nook WaterUseNonPublicSystems
Glow
Frame2.list16 Column 2 Nook WaterUseNonPublicSystems
GMed
DBMS Phase II Report 28 Utah State University
430 Page Name Form
Subject Description
Item Description Calculations Database Query Query Calculations
Table
Field
Frame2.list17 Column 3 Nook WaterUseNonPublicSystems
GHigh
Frame2.list18 Column 4 Nook WaterUseNonPublicSystems
SLow
Frame2.list19 Column 5 Nook WaterUseNonPublicSystems
SMed
Frame2.list20 Column 6 Nook WaterUseNonPublicSystems
SHigh
Frame2.list21 Column 7 Nook WaterUseNonPublicSystems
TLow
Frame2.list22 Column 8 Nook WaterUseNonPublicSystems
TMed
Frame2.list23 Column 9 Nook WaterUseNonPublicSystems
THigh
Frame2. total row Frame2.label20 “total” Frame2.first row Frame2.list24 Column 1 Nook [WaterUseTotal
Public/NonPublic]
GLow=Sum([WaterUseNonPublicSystems]![gLow])+Sum([WaterUsePublicSystems]![gLow])
WaterUseNonPublicSystems WaterUsePublicSystems
gLow gLow
Frame2.list25 Column 2 Nook [WaterUseTotalPublic/NonPublic]
gMed: Sum([WaterUseNonPublicSystems]![gMed])+Sum([WaterUsePublicSystems]![gMed])
WaterUseNonPublicSystems WaterUsePublicSystems
Gmed Gmed
Frame2.list26 Column 3 Nook [WaterUseTotalPublic/NonPublic]
gHigh: Sum([WaterUseNonPublicSystems]![gHigh])+Sum([WaterUsePublicSystems]![gHigh])
WaterUseNonPublicSystems WaterUsePublicSystems
Ghigh GHigh
Frame2.list27 Column 4 Nook [WaterUseTotalPublic/NonPublic]
sLow: Sum([WaterUseNonPublicSystems]![sLow])+Sum([WaterUsePublicSystems]![slow])
WaterUseNonPublicSystems WaterUsePublicSystems
Slow Slow
Frame2.list28 Column 5 Nook [WaterUseTotalPublic/NonPublic]
sMed: Sum([WaterUseNonPublicSystems]![sMed])+Sum([WaterUsePublicSystems]![sMed])
WaterUseNonPublicSystems WaterUsePublicSystems
Smed SMed
Frame2.list29 Column 6 Nook [WaterUseTotalPublic/NonPublic]
sHigh: Sum([WaterUseNonPublicSystems]![sHigh])+Sum([WaterUsePublicSystems]![sHigh])
WaterUseNonPublicSystems WaterUsePublicSystems
Shigh SHigh
431
DBMS Phase II Report 29 Utah State University
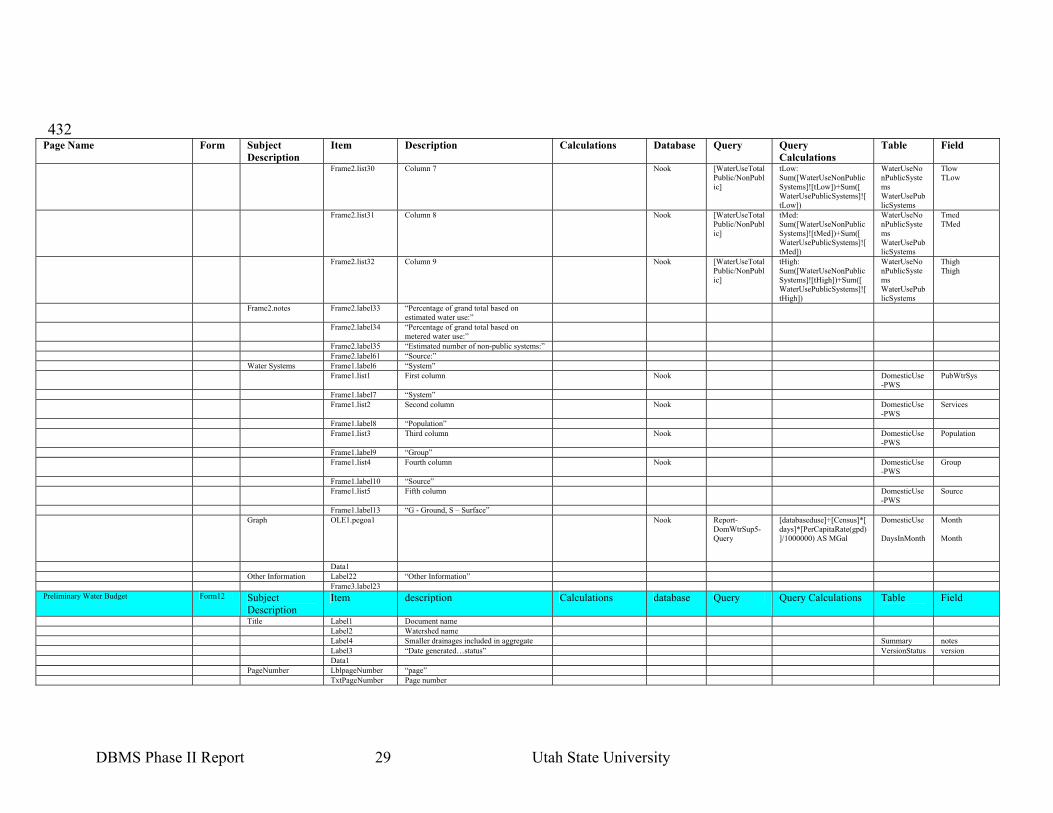
432 Page Name Form
Subject Description
Item Description Calculations Database Query Query Calculations
Table
Field
Frame2.list30 Column 7 Nook [WaterUseTotalPublic/NonPublic]
tLow: Sum([WaterUseNonPublicSystems]![tLow])+Sum([WaterUsePublicSystems]![tLow])
WaterUseNonPublicSystems WaterUsePublicSystems
Tlow TLow
Frame2.list31 Column 8 Nook [WaterUseTotalPublic/NonPublic]
tMed: Sum([WaterUseNonPublicSystems]![tMed])+Sum([WaterUsePublicSystems]![tMed])
WaterUseNonPublicSystems WaterUsePublicSystems
Tmed TMed
Frame2.list32 Column 9 Nook [WaterUseTotalPublic/NonPublic]
tHigh: Sum([WaterUseNonPublicSystems]![tHigh])+Sum([WaterUsePublicSystems]![tHigh])
WaterUseNonPublicSystems WaterUsePublicSystems
Thigh Thigh
Frame2.notes Frame2.label33 “Percentage of grand total based on estimated water use:”
Frame2.label34 “Percentage of grand total based on metered water use:”
Frame2.label35 “Estimated number of non-public systems:” Frame2.label61 “Source:” Water Systems Frame1.label6 “System” Frame1.list1 First column Nook DomesticUse
-PWS PubWtrSys
Frame1.label7 “System” Frame1.list2 Second column Nook DomesticUse
-PWS Services
Frame1.label8 “Population” Frame1.list3 Third column Nook DomesticUse
-PWS Population
Frame1.label9 “Group” Frame1.list4 Fourth column Nook DomesticUse
-PWS Group
Frame1.label10 “Source” Frame1.list5 Fifth column DomesticUse
-PWS Source
Frame1.label13 “G - Ground, S – Surface” Graph OLE1.pegoa1 Nook Report-
DomWtrSup5-Query
[databaseduse]+[Census]*[days]*[PerCapitaRate(gpd)]/1000000) AS MGal
DomesticUse DaysInMonth
Month Month
Data1 Other Information Label22 “Other Information” Frame3.label23 Preliminary Water Budget Form12 Subject
Description Item description Calculations database Query Query Calculations Table
Field
Title Label1 Document name Label2 Watershed name Label4 Smaller drainages included in aggregate Summary notes Label3 “Date generated…status” VersionStatus version Data1 PageNumber LblpageNumber “page” TxtPageNumber Page number
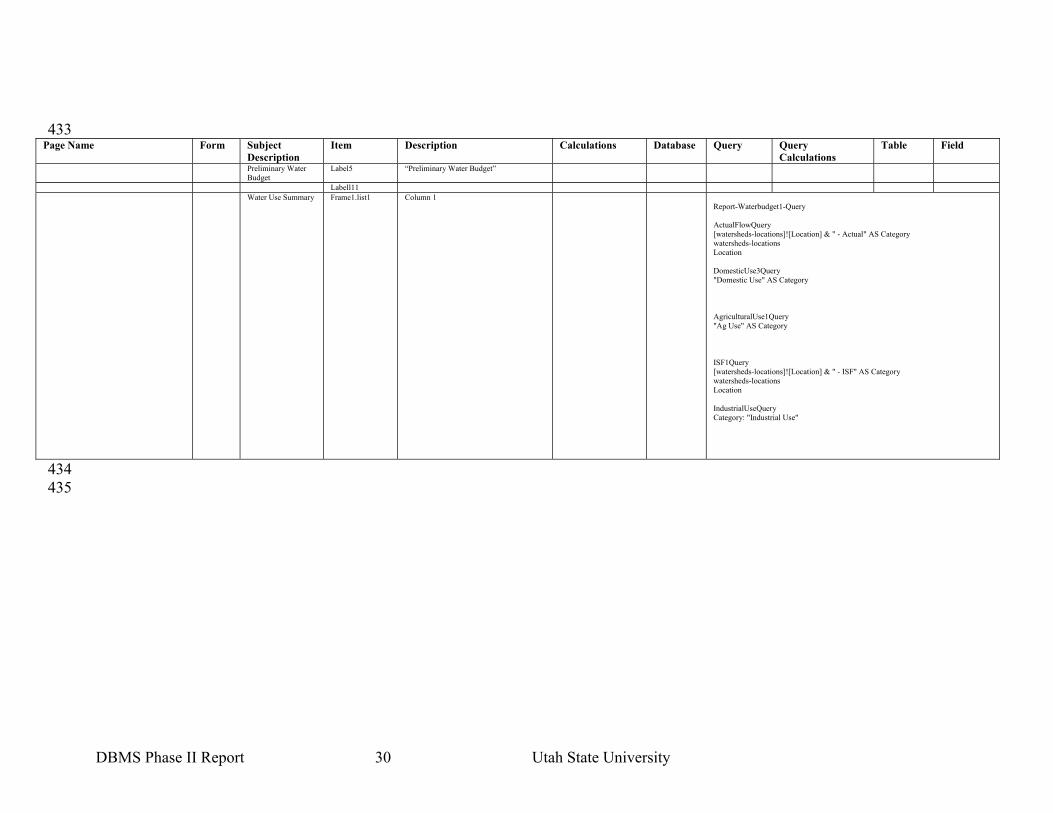
DBMS Phase II Report 30 Utah State University
433 Page Name Form
Subject Description
Item Description Calculations Database Query Query Calculations
Table
Field
Preliminary Water Budget
Label5 “Preliminary Water Budget”
Labell11 Water Use Summary Frame1.list1 Column 1
Report-Waterbudget1-Query ActualFlowQuery [watersheds-locations]![Location] & " - Actual" AS Category watersheds-locations Location DomesticUse3Query "Domestic Use" AS Category AgriculturalUse1Query "Ag Use" AS Category ISF1Query [watersheds-locations]![Location] & " - ISF" AS Category watersheds-locations Location IndustrialUseQuery Category: "Industrial Use"
434 435
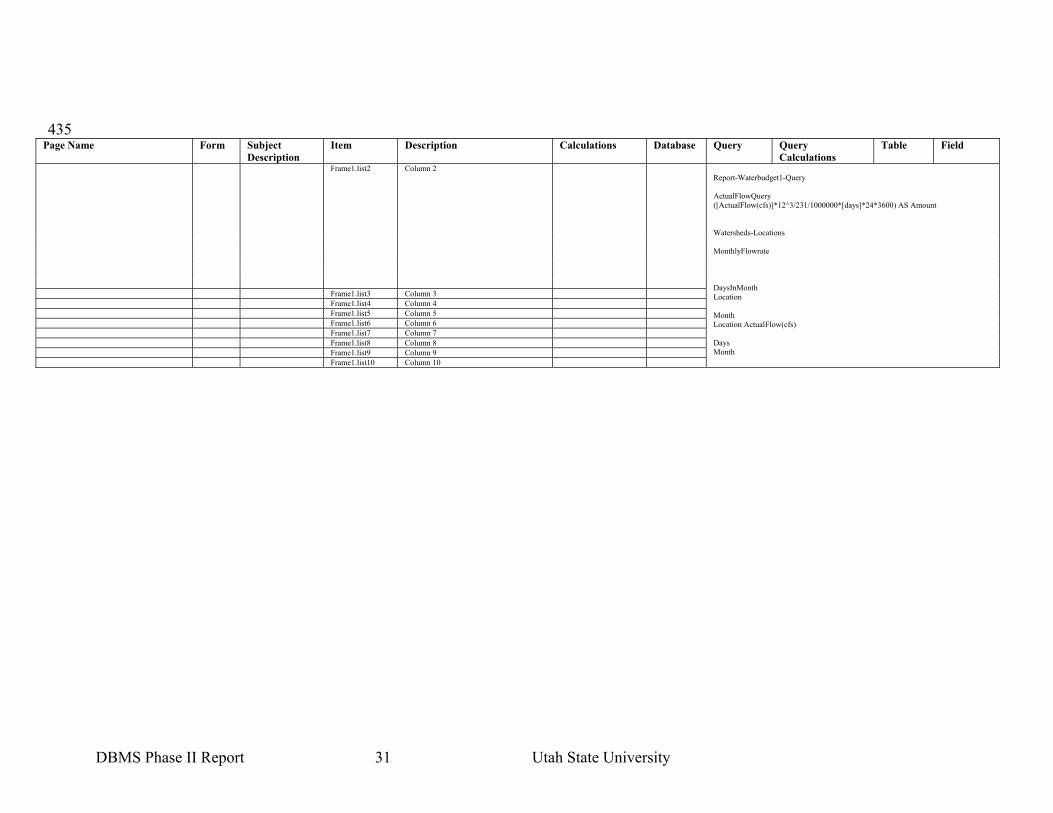
DBMS Phase II Report 31 Utah State University
435 Page Name Form
Subject Description
Item Description Calculations Database Query Query Calculations
Table
Field
Frame1.list2 Column 2
Frame1.list3 Column 3 Frame1.list4 Column 4 Frame1.list5 Column 5 Frame1.list6 Column 6 Frame1.list7 Column 7 Frame1.list8 Column 8 Frame1.list9 Column 9 Frame1.list10 Column 10
Report-Waterbudget1-Query ActualFlowQuery ([ActualFlow(cfs)]*12^3/231/1000000*[days]*24*3600) AS Amount Watersheds-Locations MonthlyFlowrate DaysInMonth Location Month Location ActualFlow(cfs) Days Month
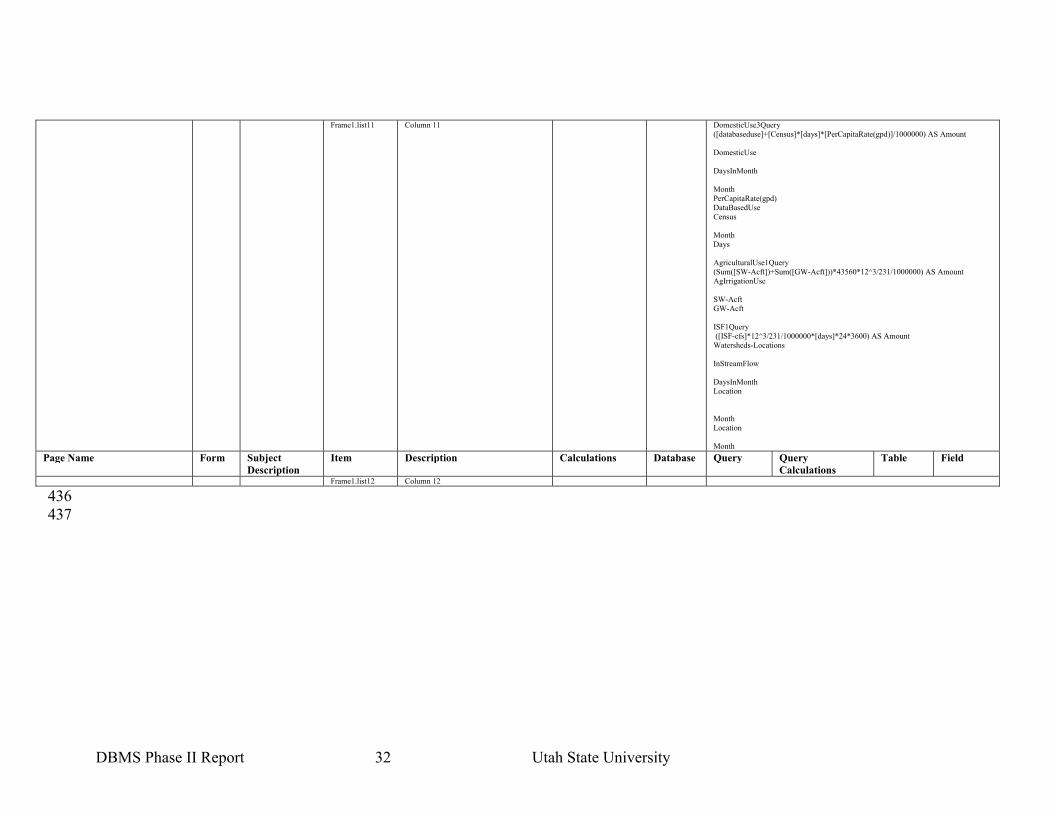
DBMS Phase II Report 32 Utah State University
Frame1.list11 Column 11 DomesticUse3Query ([databaseduse]+[Census]*[days]*[PerCapitaRate(gpd)]/1000000) AS Amount DomesticUse DaysInMonth Month PerCapitaRate(gpd) DataBasedUse Census Month Days AgriculturalUse1Query (Sum([SW-Acft])+Sum([GW-Acft]))*43560*12^3/231/1000000) AS Amount AgIrrigationUse SW-Acft GW-Acft ISF1Query ([ISF-cfs]*12^3/231/1000000*[days]*24*3600) AS Amount Watersheds-Locations InStreamFlow DaysInMonth Location Month Location Month
Page Name Form
Subject Description
Item Description Calculations Database Query Query Calculations
Table
Field
Frame1.list12 Column 12
436 437
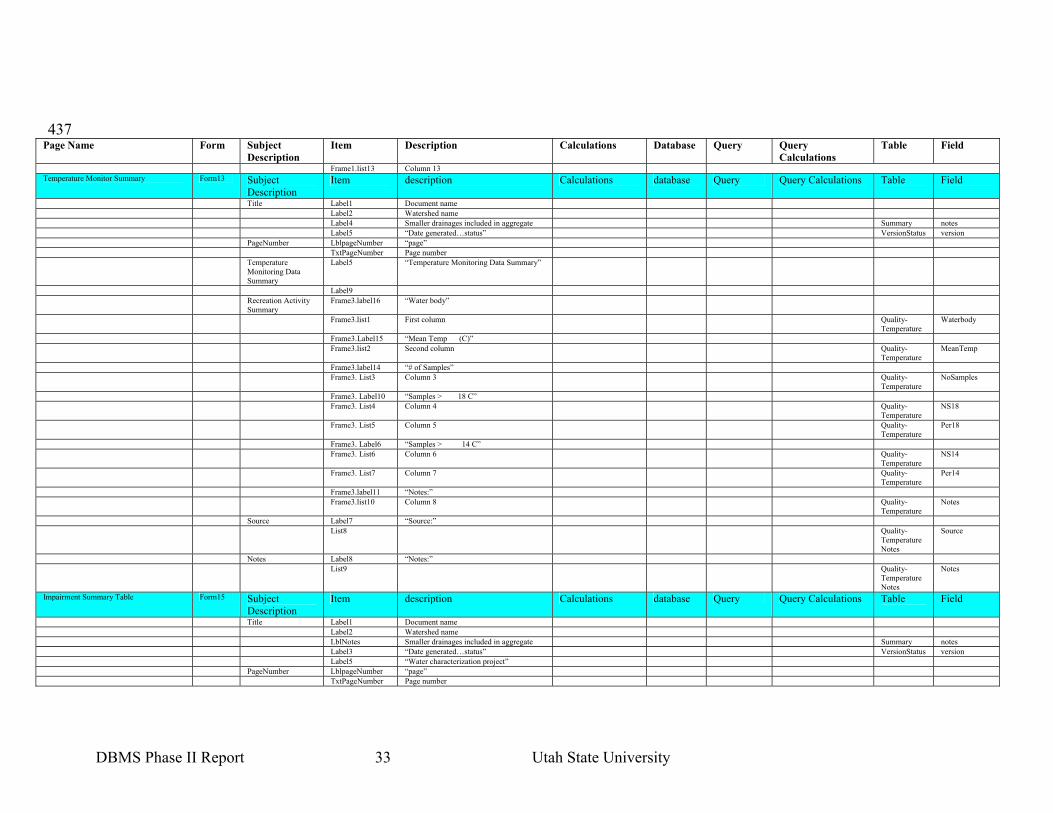
DBMS Phase II Report 33 Utah State University
437 Page Name Form
Subject Description
Item Description Calculations Database Query Query Calculations
Table
Field
Frame1.list13 Column 13 Temperature Monitor Summary Form13 Subject
Description Item description Calculations database Query Query Calculations Table
Field
Title Label1 Document name Label2 Watershed name Label4 Smaller drainages included in aggregate Summary notes Label5 “Date generated…status” VersionStatus version PageNumber LblpageNumber “page” TxtPageNumber Page number Temperature
Monitoring Data Summary
Label5 “Temperature Monitoring Data Summary”
Label9 Recreation Activity
Summary Frame3.label16 “Water body”
Frame3.list1 First column Quality-Temperature
Waterbody
Frame3.Label15 “Mean Temp (C)” Frame3.list2 Second column Quality-
Temperature MeanTemp
Frame3.label14 “# of Samples” Frame3. List3 Column 3 Quality-
Temperature NoSamples
Frame3. Label10 “Samples > 18 C” Frame3. List4 Column 4 Quality-
Temperature NS18
Frame3. List5 Column 5 Quality-Temperature
Per18
Frame3. Label6 “Samples > 14 C” Frame3. List6 Column 6 Quality-
Temperature NS14
Frame3. List7 Column 7 Quality-Temperature
Per14
Frame3.label11 “Notes:” Frame3.list10 Column 8 Quality-
Temperature Notes
Source Label7 “Source:” List8 Quality-
TemperatureNotes
Source
Notes Label8 “Notes:” List9 Quality-
TemperatureNotes
Notes
Impairment Summary Table Form15 Subject Description
Item description Calculations database Query Query Calculations Table
Field
Title Label1 Document name Label2 Watershed name LblNotes Smaller drainages included in aggregate Summary notes Label3 “Date generated…status” VersionStatus version Label5 “Water characterization project” PageNumber LblpageNumber “page” TxtPageNumber Page number
DBMS Phase II Report 34 Utah State University
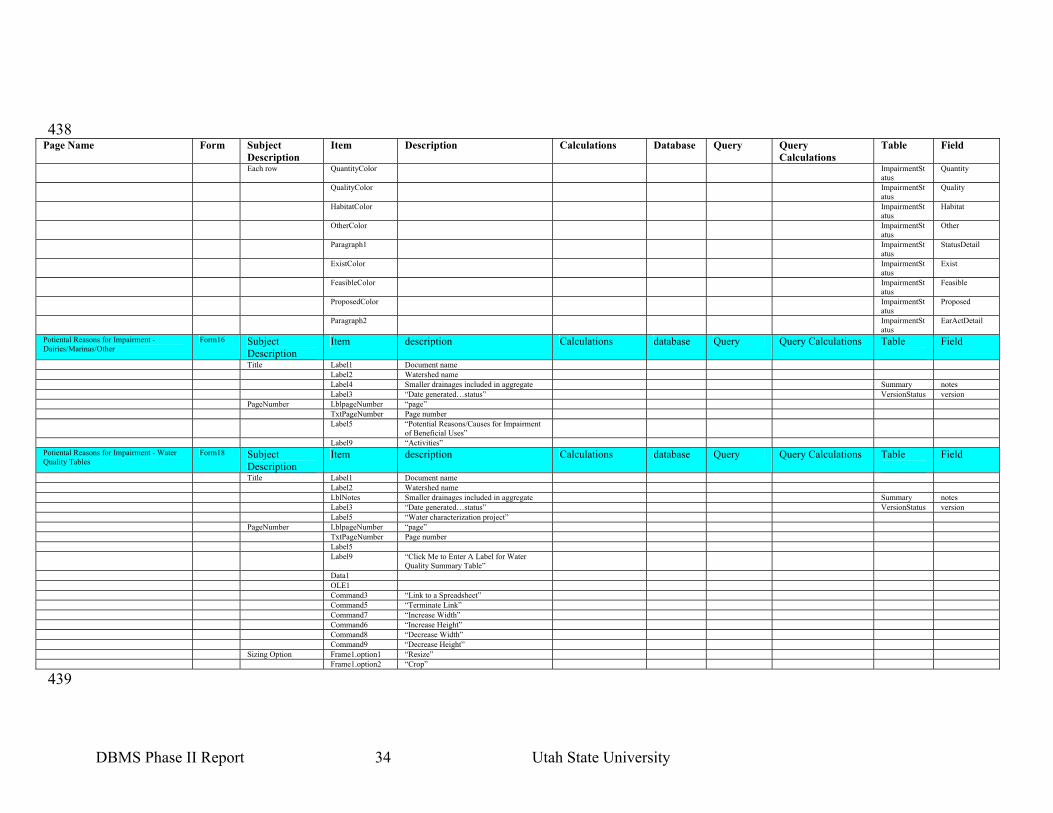
438 Page Name Form
Subject Description
Item Description Calculations Database Query Query Calculations
Table
Field
Each row QuantityColor ImpairmentStatus
Quantity
QualityColor ImpairmentStatus
Quality
HabitatColor ImpairmentStatus
Habitat
OtherColor ImpairmentStatus
Other
Paragraph1 ImpairmentStatus
StatusDetail
ExistColor ImpairmentStatus
Exist
FeasibleColor ImpairmentStatus
Feasible
ProposedColor ImpairmentStatus
Proposed
Paragraph2 ImpairmentStatus
EarActDetail
Potiental Reasons for Impairment - Dairies/Marinas/Other
Form16 Subject Description
Item description Calculations database Query Query Calculations Table
Field
Title Label1 Document name Label2 Watershed name Label4 Smaller drainages included in aggregate Summary notes Label3 “Date generated…status” VersionStatus version PageNumber LblpageNumber “page” TxtPageNumber Page number Label5 “Potential Reasons/Causes for Impairment
of Beneficial Uses”
Label9 “Activities” Potiental Reasons for Impairment - Water Quality Tables
Form18 Subject Description
Item description Calculations database Query Query Calculations Table
Field
Title Label1 Document name Label2 Watershed name LblNotes Smaller drainages included in aggregate Summary notes Label3 “Date generated…status” VersionStatus version Label5 “Water characterization project” PageNumber LblpageNumber “page” TxtPageNumber Page number Label5 Label9 “Click Me to Enter A Label for Water
Quality Summary Table”
Data1 OLE1 Command3 “Link to a Spreadsheet” Command5 “Terminate Link” Command7 “Increase Width” Command6 “Increase Height” Command8 “Decrease Width” Command9 “Decrease Height” Sizing Option Frame1.option1 “Resize” Frame1.option2 “Crop”
439

DBMS Phase II Report 35 Utah State University
Page Name Form
Subject Description
Item Description Calculations Database Query Query Calculations
Table
Field
Potiental Reasons for Impairment - Water Quality Figures
Form19 Subject Description
Item description Calculations database Query Query Calculations Table
Field
Title Label1 Document name Label2 Watershed name Label4 Smaller drainages included in aggregate Summary notes Label3 “Date generated…status” VersionStatus version PageNumber LblpageNumber “page” TxtPageNumber Page number Label5 “Potential Reasons/Causes for Impairment
of Beneficial Uses - Water Quality”
Command3 “Link to a Spreadsheet” Command5 “Terminate Link” Command7 “Increase Width” Command6 “Increase Height” Command8 “Decrease Width” Command9 “Decrease Width” Command4 “Hide Figure” Command10 “Show Figure” Select Figure Frame1.option1 “Fig 1” Frame1.option2 “Fig 2” Frame1.option3 “Fig 3” Frame1.option4 “Fig 4” Label9 “Click Me to Enter A Label for Water
Quality Summary Figure”
OLE1 Label8 “Click Me to Enter A Label for Water
Quality Summary Figure”
OLE2 Label6 “Click Me to Enter A Label for Water
Quality Summary Figure”
OLE3 Label7 “Click Me to Enter A Label for Water
Quality Summary Figure”
OLE4 Solutions/Recommendations/Opportunities Form17 Subject
Description Item description Calculations database Query Query Calculations Table
Field
Title Label1 Document name Label2 Watershed name Label4 Smaller drainages included in aggregate Summary notes Label3 “Date generated…status” VersionStatus version PageNumber LblpageNumber “page” TxtPageNumber Page number Label5 “Solutions/Recommendations/Opportunies” Early Action
Possibilities Label9 “Early Action Possibilities”
Frame1.label8 EarlyAction EarlyAction Opportunities/Other
Planning Efforts Label6 “Opportunities/Other Planning Efforts”
Frame2.label10 Opportunities Opportunities Relevant Discussion
Points Label7 “Relevant Discussion Points:”
Frame3.label1 Discussion Discussion Data1
440

DBMS Phase II Report 36 Utah State University
Page Name Form
Subject Description
Item Description Calculations Database Query Query Calculations
Table
Field
Generic Report Form Form20 Subject Description
Item description Calculations database Query Query Calculations Table
Field
Title Label1 Document name Label2 Watershed name LblNotes Smaller drainages included in aggregate Summary notes Label3 “Date generated…status” VersionStatus version PageNumber LblpageNumber “page” TxtPageNumber Page number Button Command4 “Delete ActiveX Control” OLEControls ShellFish/Hatchery Form23 Subject
Description Item description Calculations database Query Query Calculations Table
Field
Title Label1 Document name Label2 Watershed name LblNotes Smaller drainages included in aggregate Summary notes Label3 “Date generated…status” VersionStatus version Label7 “Beneficial Use Summary” PageNumber LblpageNumber “page” TxtPageNumber Page number Data1 Icon Picture1 Label5 “Shellfish” Other Information: Label17 “Other Information:” Frame5.label19 Shellfish-
Notes Notes
Icon Picture2 Label6 “Hatchery” Annual Volume
Withdrawn from Watershed (MG):
Label8 “Annual Volume Withdrawn from Watershed (MG):”
Label9 Report-HatcheriesFlow-Query
Hatcheries-Flow
Flow(MG)
Number of Hatcheries:
Label20 “Number of Hatcheries:”
Label21 Summary Report-Description-Query
NumHatch
Other Information: Label4 “Other Information:” Frame1.label3 Supporting Information Form24 Subject
Description Item description Calculations database Query Query Calculations Table
Field
Title Label1 Document name Label2 Watershed name LblNotes Smaller drainages included in aggregate Summary notes Label3 “Date generated…status” VersionStatus version Label5 “Supporting Information” PageNumber LblpageNumber “page” TxtPageNumber Page number Precipitation Data
Applies to Entire Watershed
Label12 “Precipitation Data Applies to Entire Watershed”
441

DBMS Phase II Report 37 Utah State University
Page Name Form
Subject Description
Item Description Calculations Database Query Query Calculations
Table
Field
Monthly Percipitation Characteristics
Frame2.list7 First column (month)
Frame2.list8 Second column (MGal) / (43560 * 12 ^ 3 / 231 / 1000000)
Nook Report-Precipitation-Query
Mgal=([precipitation]*[areaacres]*43560*12^2/231/1000000)
Precipitation Summary
Precipitation AreaAcres
Frame2.list9 Third column Report-Precipitation-Query
Inches=Precipitation Precipitation Precipitation
LblSourceTitle “Source:” LblSourceText Value Water Right
Summary Label31 “Water Right Summary”
Label32 “Number of Claims, Permits, Certificates:” Label33 Value Report-
WtrRtsSummary-Query
WaterRights Num-WR
Label34 “Total Per Year (MG):” Label35 Value Report-
WtrRtsSummary-Query
TotalWithdrawal(Acft)=Sum([WaterRights]![GW-Acft])+Sum([WaterRights]![SW-Acft]))
WaterRights WaterRights
GW-Acft SW-Acft
Label36 “Ground Water (MG):” Label38 Value WaterRights GW-Acft Label37 “Surface Water (MG):” Label39 Value Nook Report-
WtrRtsSummary-Query
WaterRights NumApplications
Lablel3 “Number of Applications:” WaterRights numApplications
Label4 Value OLE1.Pegoa1 Report-
Waterbudget1-Query
Flow
Agricultural Water Use Form8 Subject Description
Item description Calculations database Query Query Calculations Table
Field
Title Label1 Document name Label2 Watershed name LblNotes Smaller drainages included in aggregate Summary notes Label3 “Date generated…status” VersionStatus version Label5 “Water characterization project” PageNumber LblpageNumber “page” TxtPageNumber Page number Frame2 Frame2.label59 “Estimated Annual Water Use (acre/ft)” Icon Picture2 Label20 “Agricultural Water Supply” Frame2.top labels Frame2.label58 “Ground” Frame2.label57 “Surface” Frame2.label56 “Total” Frame2.label52 “low” Frame2.label51 “med” Frame2.label50 “hi” Frame2.label49 “low” Frame2.label48 “med” Frame2.label47 “hi” Frame2.label46 “low”

DBMS Phase II Report 38 Utah State University
442 Page Name Form
Subject Description
Item Description Calculations Database Query Query Calculations
Table
Field
Frame2.label45 “med” Frame2.label44 “hi” Frame2. Irrigation
row Frame2.label155 “Irrigation”
Frame2.list6 Column 1 WaterUseIrrigation
Glow
Frame2.list7 Column 2 WaterUseIrrigation
GMed
Frame2.list8 Column 3 WaterUseIrrigation
GHigh
Frame2.list9 Column 4 WaterUseIrrigation
SLow
Frame2.list10 Column 5 WaterUseIrrigation
SMed
Frame2.list11 Column 6 WaterUseIrrigation
SHigh
Frame2.list12 Column 7 WaterUseIrrigation
TLow
Frame2.list13 Column 8 WaterUseIrrigation
TMed
Frame2.list14 Column 9 WaterUseIrrigation
THigh
Frame2Stock Watering and Facility Washdown row
Frame2.label54 “Stock Watering and Facility Washdown”
Frame2.list15 Column 1 WaterUseStockWatering
Glow
Frame2.list16 Column 2 WaterUseStockWatering
GMed
Frame2.list17 Column 3 WaterUseStockWatering
GHigh
Frame2.list18 Column 4 WaterUseStockWatering
SLow
Frame2.list19 Column 5 WaterUseStockWatering
SMed
Frame2.list20 Column 6 WaterUseStockWatering
SHigh
Frame2.list21 Column 7 WaterUseStockWatering
TLow
Frame2.list22 Column 8 WaterUseStockWatering
TMed
Frame2.list23 Column 9 WaterUseStockWatering
THigh
Frame2. total row Frame2.label53 “total” Frame2.list24 Column 1 [WaterUseTotal
Irrigation/Stock]
GLow=Sum([WaterUseIrrigation]![gLow])+Sum([WaterUseStockWatering]![gLow])
WaterUseIrrigation WaterUseStockWatering
gLow gLow
Frame2.list25 Column 2 [WaterUseTotalPublic/NonPublic]
gMed: Sum([WaterUseIrrigation]![gMed])+Sum([WaterUseStockWatering]![gMed])
WaterUseIrrigation WaterUseStockWatering
Gmed Gmed
DBMS Phase II Report 39 Utah State University
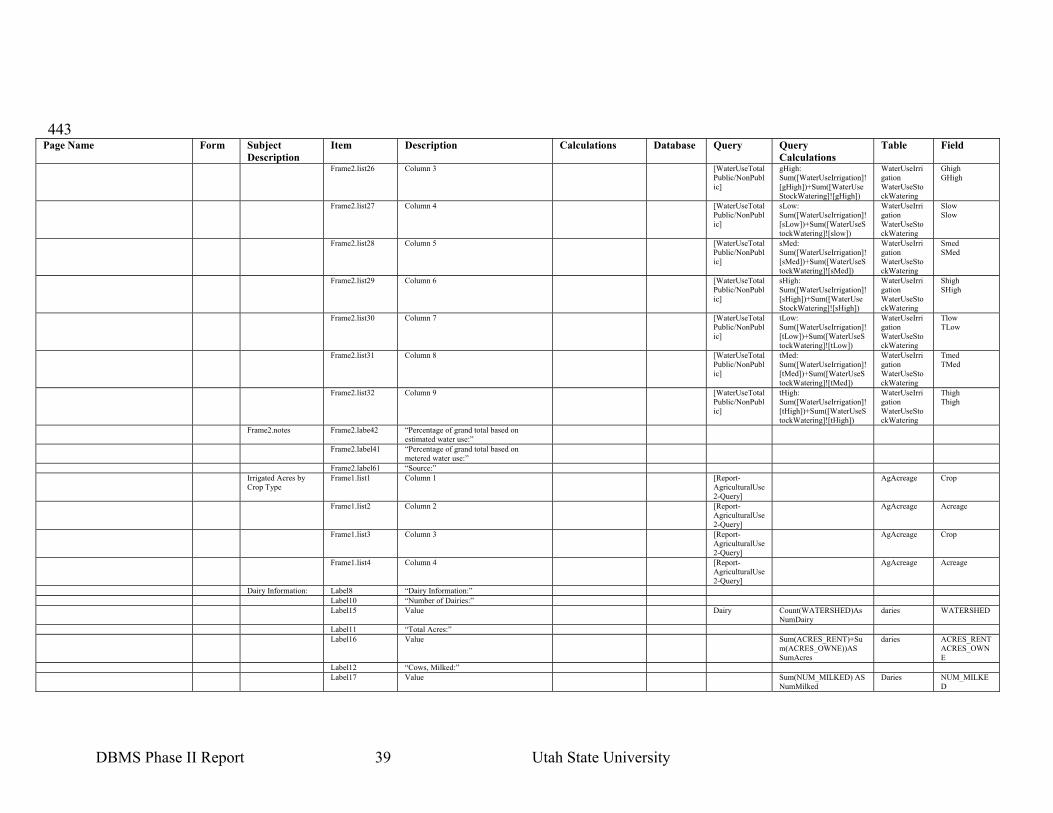
443 Page Name Form
Subject Description
Item Description Calculations Database Query Query Calculations
Table
Field
Frame2.list26 Column 3 [WaterUseTotalPublic/NonPublic]
gHigh: Sum([WaterUseIrrigation]![gHigh])+Sum([WaterUseStockWatering]![gHigh])
WaterUseIrrigation WaterUseStockWatering
Ghigh GHigh
Frame2.list27 Column 4 [WaterUseTotalPublic/NonPublic]
sLow: Sum([WaterUseIrrigation]![sLow])+Sum([WaterUseStockWatering]![slow])
WaterUseIrrigation WaterUseStockWatering
Slow Slow
Frame2.list28 Column 5 [WaterUseTotalPublic/NonPublic]
sMed: Sum([WaterUseIrrigation]![sMed])+Sum([WaterUseStockWatering]![sMed])
WaterUseIrrigation WaterUseStockWatering
Smed SMed
Frame2.list29 Column 6 [WaterUseTotalPublic/NonPublic]
sHigh: Sum([WaterUseIrrigation]![sHigh])+Sum([WaterUseStockWatering]![sHigh])
WaterUseIrrigation WaterUseStockWatering
Shigh SHigh
Frame2.list30 Column 7 [WaterUseTotalPublic/NonPublic]
tLow: Sum([WaterUseIrrigation]![tLow])+Sum([WaterUseStockWatering]![tLow])
WaterUseIrrigation WaterUseStockWatering
Tlow TLow
Frame2.list31 Column 8 [WaterUseTotalPublic/NonPublic]
tMed: Sum([WaterUseIrrigation]![tMed])+Sum([WaterUseStockWatering]![tMed])
WaterUseIrrigation WaterUseStockWatering
Tmed TMed
Frame2.list32 Column 9 [WaterUseTotalPublic/NonPublic]
tHigh: Sum([WaterUseIrrigation]![tHigh])+Sum([WaterUseStockWatering]![tHigh])
WaterUseIrrigation WaterUseStockWatering
Thigh Thigh
Frame2.notes Frame2.labe42 “Percentage of grand total based on estimated water use:”
Frame2.label41 “Percentage of grand total based on metered water use:”
Frame2.label61 “Source:” Irrigated Acres by
Crop Type Frame1.list1 Column 1 [Report-
AgriculturalUse2-Query]
AgAcreage Crop
Frame1.list2 Column 2 [Report-AgriculturalUse2-Query]
AgAcreage Acreage
Frame1.list3 Column 3 [Report-AgriculturalUse2-Query]
AgAcreage Crop
Frame1.list4 Column 4 [Report-AgriculturalUse2-Query]
AgAcreage Acreage
Dairy Information: Label8 “Dairy Information:” Label10 “Number of Dairies:” Label15 Value Dairy Count(WATERSHED)As
NumDairy daries WATERSHED
Label11 “Total Acres:” Label16 Value Sum(ACRES_RENT)+Su
m(ACRES_OWNE))AS SumAcres
daries ACRES_RENT ACRES_OWNE
Label12 “Cows, Milked:” Label17 Value Sum(NUM_MILKED) AS
NumMilked Daries NUM_MILKE
D

DBMS Phase II Report 40 Utah State University
444 Page Name Form
Subject Description
Item Description Calculations Database Query Query Calculations
Table
Field
Label13 “Cows, Dry:” Label18 Value Sum(NUM_DRY) AS
NumDry daries NUM_DRY
Label14 “Total Density (cows/acre):” Label19 Value DomesticUse
-PWS-Notes Notes
Other Information: Label6 “Other Information:” Label9 Value Graph OLE1. Pegoa1 Point labels Report-Flows-
Query Watersheds-
Locations Location
Point labels Report-AgriculturalUse4-Query
AgIrrigationUse
WaterShed
YData Sum(IsfMG) Report-Flows-Query
ISF(MG)=[ISF-cfs]*12^3/231/1000000*[days]*24*3600
DaysInMonth InStreamFlow
Days ISF-cfs
Ydata Report-AgriculturalUse4-Query
TotalWithdrawal(MG)= Sum([SW-Acft])+Sum([GW-Acft]))*43560*12^3/231/1000000
AgIrrigationUse
SW-Acft GW-Acft
Ydata Report-AgriculturalUse4-Query
SW(MG):= Sum([SW-Acft])*43560*12^3/231/1000000
SW(Acft)
YData Report-AgriculturalUse4-Query
GW(MG)= Sum([GW-Acft])*43560*12^3/231/1000000
GW(Acft)
Other Activities: Label7 “Other Activities:” Frame2.label23 ImpairmentOt
herActivitiesNotes
notes
445 446