davos bationo full pc
TRANSCRIPT
Bationo A., Dougbedji F., Kapran
I.; Vlek P., Naab J., Zougmore R.,
Ouattara M., Tabo R., Mando A.,
Agricultural risks linked to soil, water
and climate in Sub-Saharan Africa
Contents
Introduction
Risk: links to inherent low soil fertility and low use of inputs
Risk: links to water and climate
Risk mitigation
Conclusion
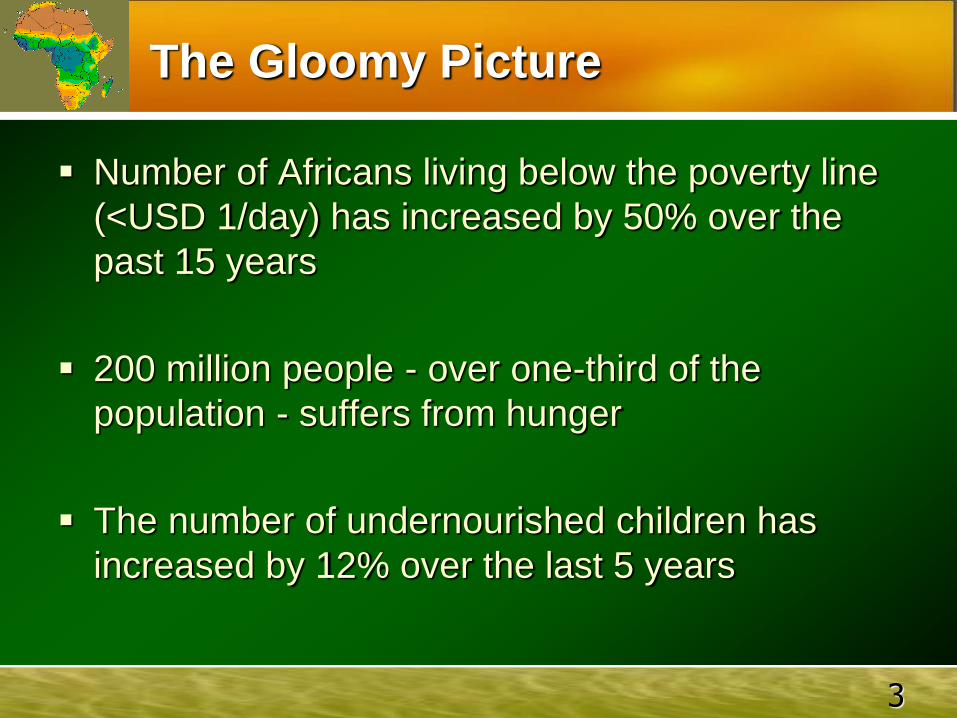
The Gloomy Picture
Number of Africans living below the poverty line
(<USD 1/day) has increased by 50% over the
past 15 years
200 million people - over one-third of the
population - suffers from hunger
The number of undernourished children has
increased by 12% over the last 5 years
3
Low Investment by Banks
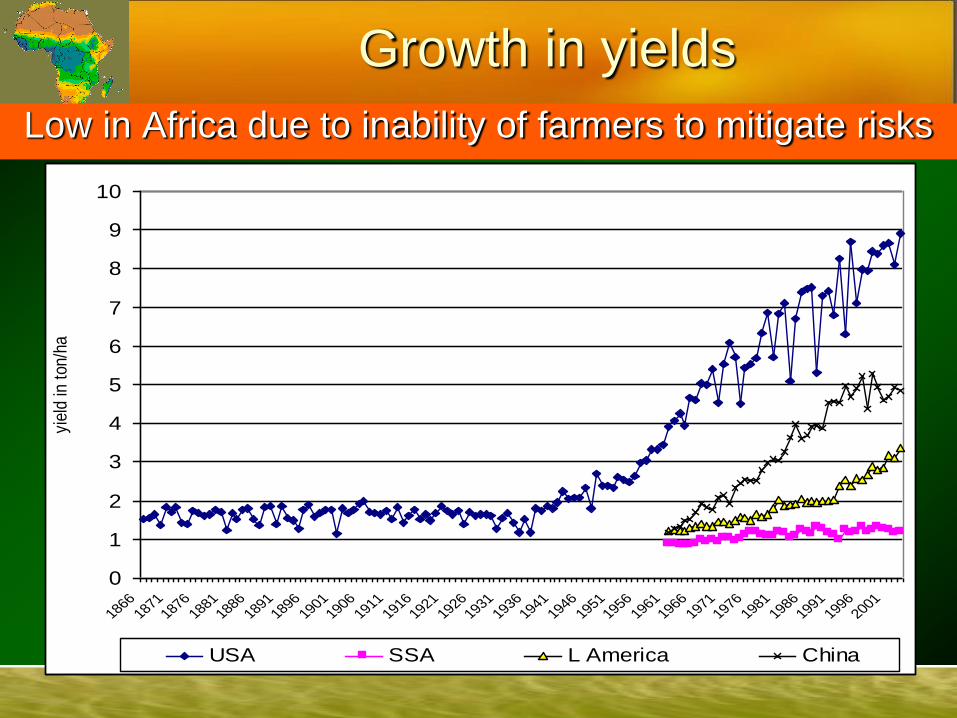
Growth in yields
0
1
2
3
4
5
6
7
8
9
10
1866
1871
1876
1881
1886
1891
1896
1901
1906
1911
1916
1921
1926
1931
1936
1941
1946
1951
1956
1961
1966
1971
1976
1981
1986
1991
1996
2001
yiel
d in
ton
/ha
USA SSA L America China
Low in Africa due to inability of farmers to mitigate risks

Cereal production per capita in SSA
Source: FAOSTATS (2010)
y = -0.6484x + 176.83 R² = 0.3695
100
120
140
160
180
200
220
196
1
196
3
196
5
196
7
196
9
197
1
197
3
197
5
197
7
197
9
198
1
198
3
198
5
198
7
198
9
199
1
199
3
199
5
199
7
199
9
200
1
200
3
200
5
200
7
Pro
du
cti
o (
Kg
)

Africa is spending 50 billion
dollars annually on food import
Afr
ica P
opula
tion (
Bill
ion)
0.30
0.35
0.39
0.44
0.48
77 78 79 80 81 82 83 84 85 86 87 88
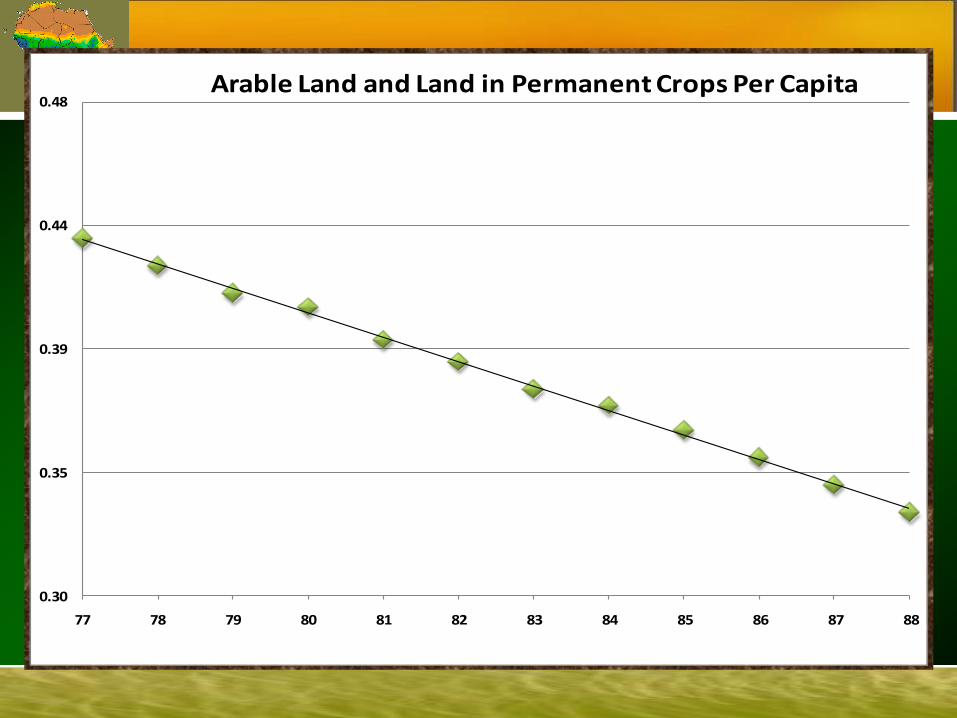
Arable Land and Land in Permanent Crops Per Capita
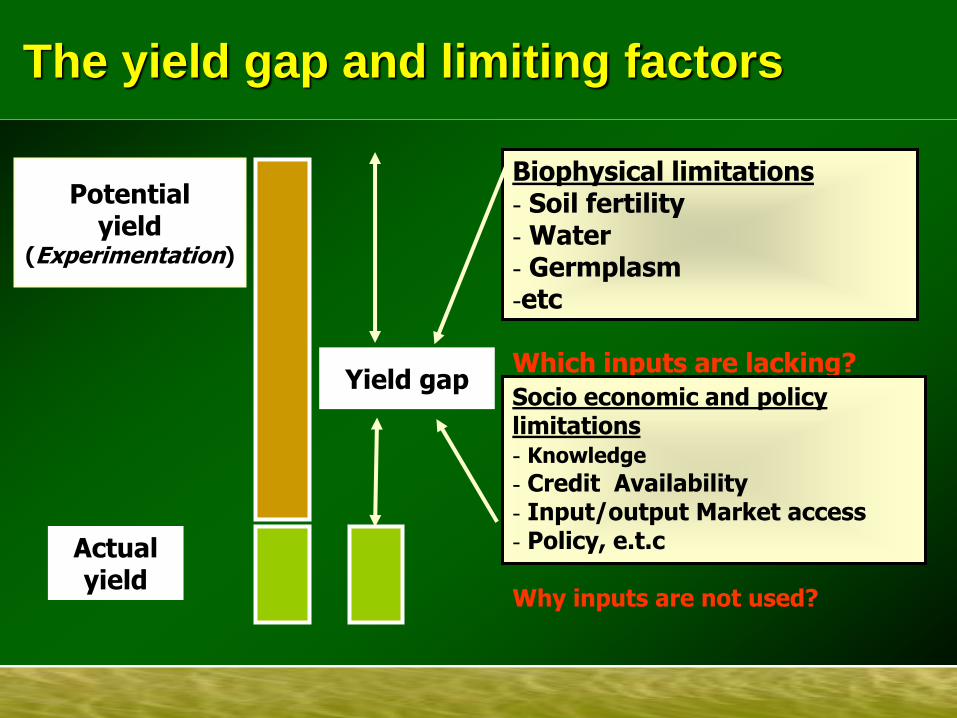
The yield gap and limiting factors
Potential yield
(Experimentation)
Actual yield
Yield gap
Biophysical limitations - Soil fertility - Water - Germplasm -etc Which inputs are lacking?
Socio economic and policy limitations - Knowledge
- Credit Availability - Input/output Market access - Policy, e.t.c Why inputs are not used?
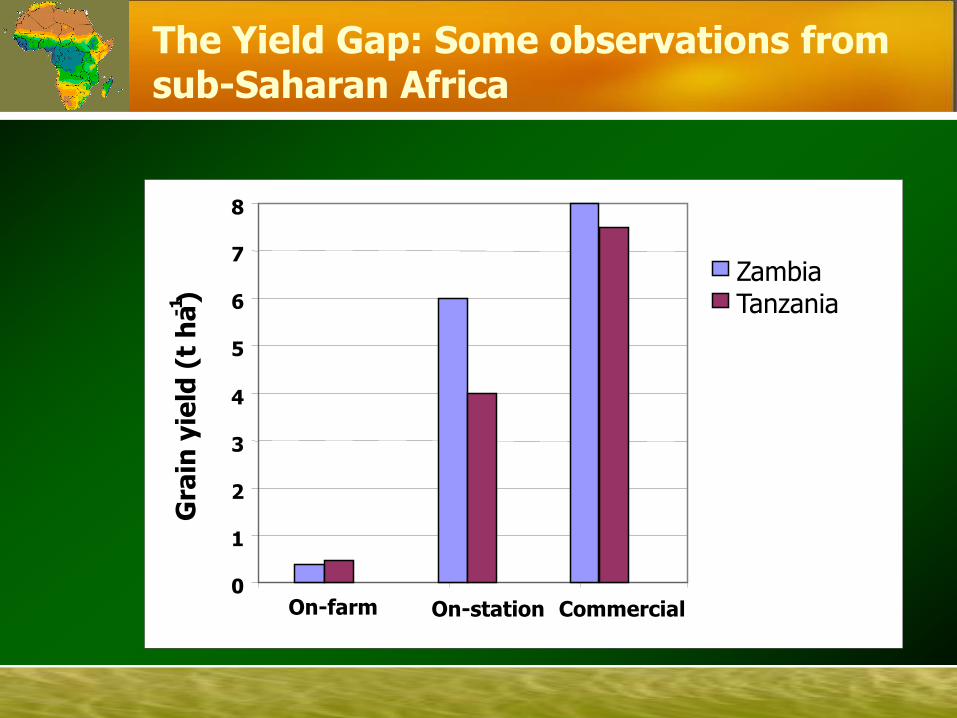
The Yield Gap: Some observations from sub-Saharan Africa
0
1
2
3
4
5
6
7
8
On-farm On-station Commercial
Gra
in y
ield
(t
ha
-1 )
Zambia Tanzania
Risk: link to inherent low
soil fertility and low use of
fertilizers

12
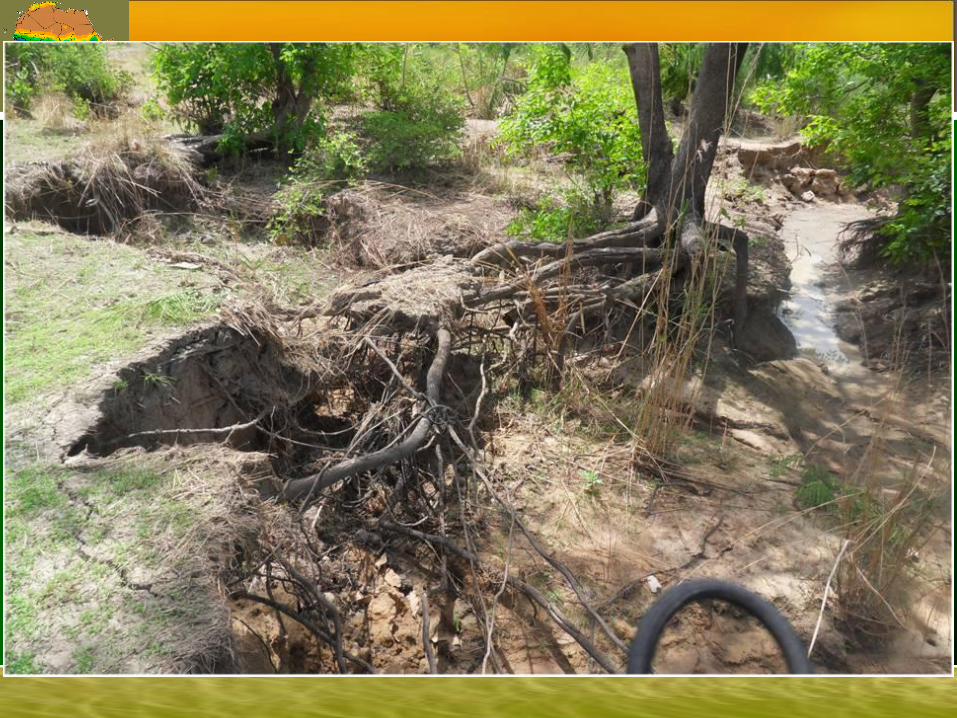
Land degradation
Africa loses equivalent of $4b per year due to soil nutrient mining
An estimated $42b in income are lost and 6 million hectares of productive land threatened every year due to land degradation
Despite about U$ 20b of commercial imports and U$ 2b of food aid, 26% of the people are undernourished
Unsustainable soils for crop production occupy 55%, prime 9.6%, high potential 6.7% and medium and low potential 28.3%

Vent de sable
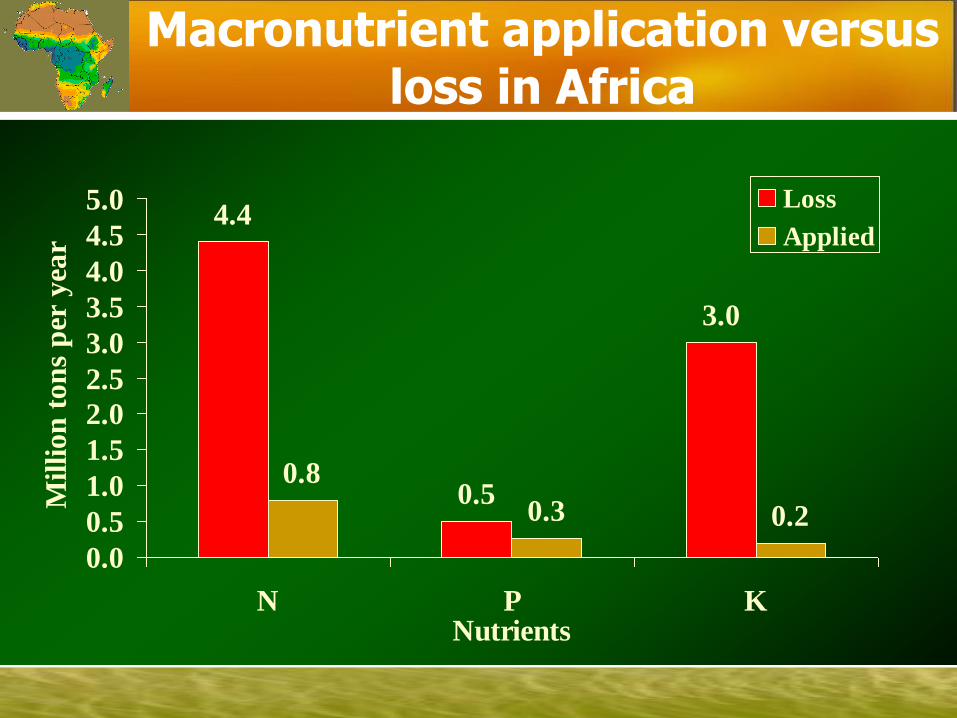
Macronutrient application versus loss in Africa
4.4
0.5
3.0
0.8
0.3 0.2
0.0
0.5
1.0
1.5
2.0
2.5
3.0
3.5
4.0
4.5
5.0
N P KNutrients
Mil
lion
ton
s p
er y
ear
Loss
Applied

202
175
146
102
98
93
84
80
78
72
69
61
60
59
20
20
8Sub-Saharan Africa
Eurasia
Africa
Oceania
Central America
South Africa
North Africa
West Asia
Latin America
Eastern Europe
South America
World
North America
South Asia
Asia
Western Europe
East Asia
Per Hectare Fertilizer Use by Markets, 2002/03
(kg/ha)
Developing Markets Developed Markets
Transitional Markets World

Depleted soils reduce payoffs on
agricultural investments and ecosystem services
• Efficiency of fertilizer and water inputs is reduced
• Profitability and returns on labour are reduced
• Vegetative cover is reduced
• Water quality is reduced
• Natural habitats are encroached upon
• Above and below ground biodiversity is reduced
• Carbon storage is reduced
Risk: Link to water and climate
19
-10
-5
0
5
10
15
20
1979 1982 1985 1988 1991 1994 1997
GD
P g
row
th (
%)
-2.5
-1.5
-0.5
0.5
1.5
2.5
3.5
Rain
fall v
ari
abilit
y (
%)
GDP growth (annual %) Rainfall
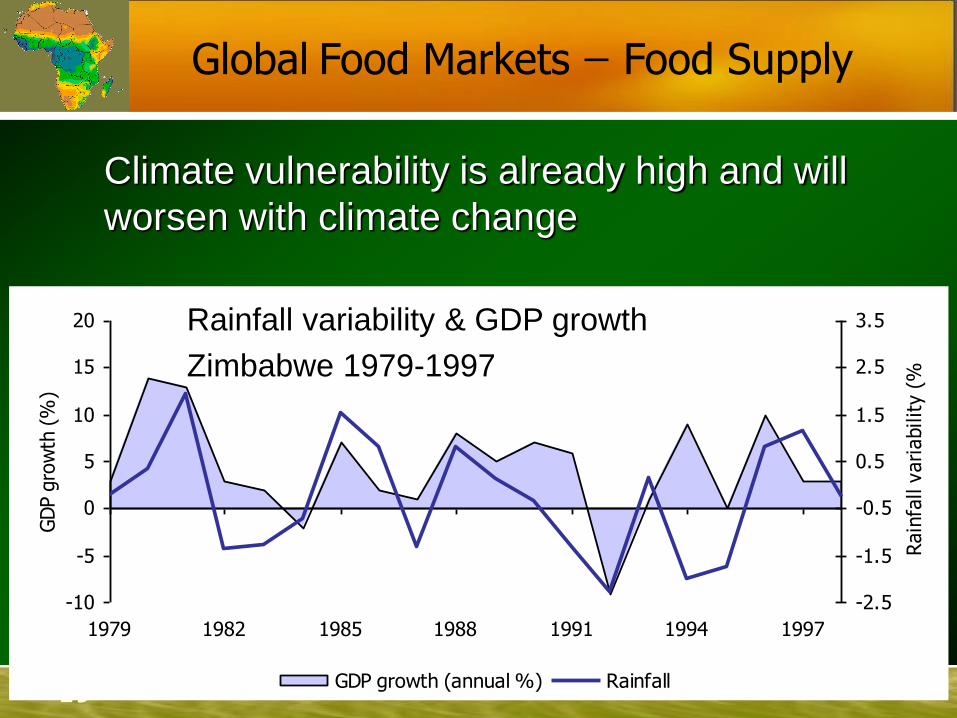
Climate vulnerability is already high and will
worsen with climate change
Rainfall variability & GDP growth
Zimbabwe 1979-1997
Global Food Markets ̶ Food Supply

-250
-200
-150
-100
-50
0
50
100
150
200
250
1960 1970 1980 1990 2000
Years
Nati
on
al
rain
fall
in
dex:
Vari
ati
on
fro
m t
ren
d (
mm
)
-800
-600
-400
-200
0
200
400
600
800
To
tal
cere
al
pro
du
cti
on
- V
ari
ati
on
fro
m t
ren
d (
'000 t
on
s)
National rainfall index
Cereal production
Burkina Faso: Relation between rainfall and cereal production
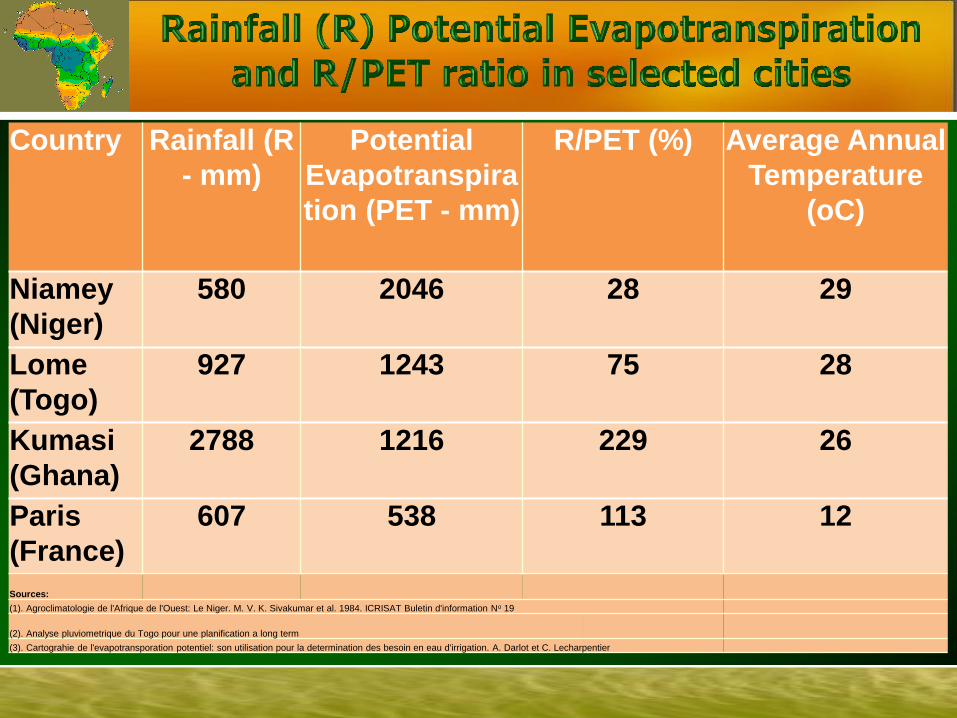
Country Rainfall (R
- mm)
Potential
Evapotranspira
tion (PET - mm)
R/PET (%) Average Annual
Temperature
(oC)
Niamey
(Niger)
580 2046 28 29
Lome
(Togo)
927 1243 75 28
Kumasi
(Ghana)
2788 1216 229 26
Paris
(France)
607 538 113 12
Sources:
(1). Agroclimatologie de l'Afrique de l'Ouest: Le Niger. M. V. K. Sivakumar et al. 1984. ICRISAT Buletin d'information No 19
(2). Analyse pluviometrique du Togo pour une planification a long term
(3). Cartograhie de l'evapotransporation potentiel: son utilisation pour la determination des besoin en eau d'irrigation. A. Darlot et C. Lecharpentier
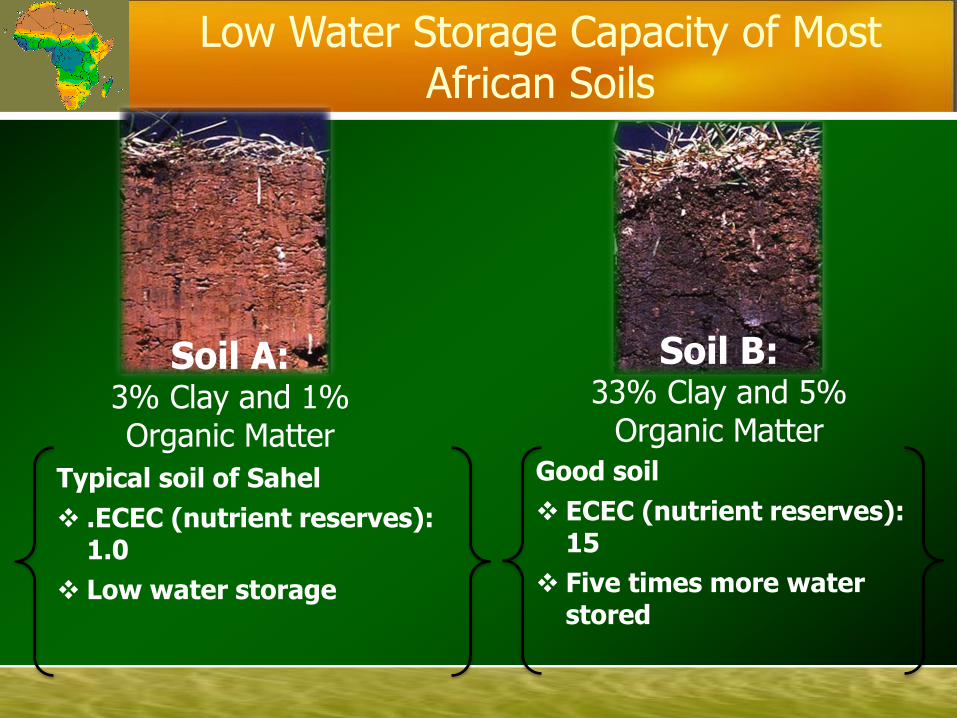
Good soil
ECEC (nutrient reserves): 15
Five times more water stored
Typical soil of Sahel
.ECEC (nutrient reserves): 1.0
Low water storage
Soil B: 33% Clay and 5%
Organic Matter
Soil A: 3% Clay and 1% Organic Matter
Low Water Storage Capacity of Most African Soils

Risk of recurrent drought
• Endemic droughts & floods: 5%-25% GDP losses
• High temporal rainfall
variability and high spatial soil nutrient heterogeneity
Africa’s natural legacy: extreme rainfall variability which reduces hydrological security
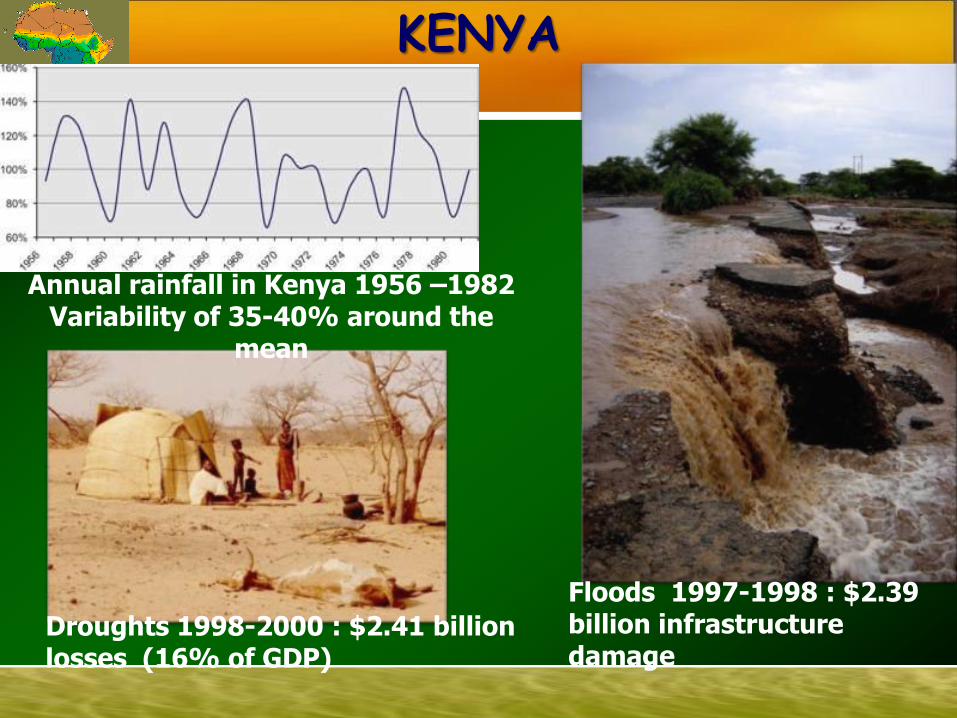
KENYA
Floods 1997-1998 : $2.39 billion infrastructure damage
Droughts 1998-2000 : $2.41 billion losses (16% of GDP)
Annual rainfall in Kenya 1956 –1982 Variability of 35-40% around the
mean

IPCC PROJECTIONS FOR AFRICA
CO2 enrichment
Temperature rise of 1.5 to 4 ⁰C this century
Fewer colder days and nights
Frequent hot days and nights
Arid areas will get drier, humid areas wetter
Increase in droughts and floods
Sea-level rise
Major desertification and soil salinization in
some countries

Risk – mitigation and adaptation
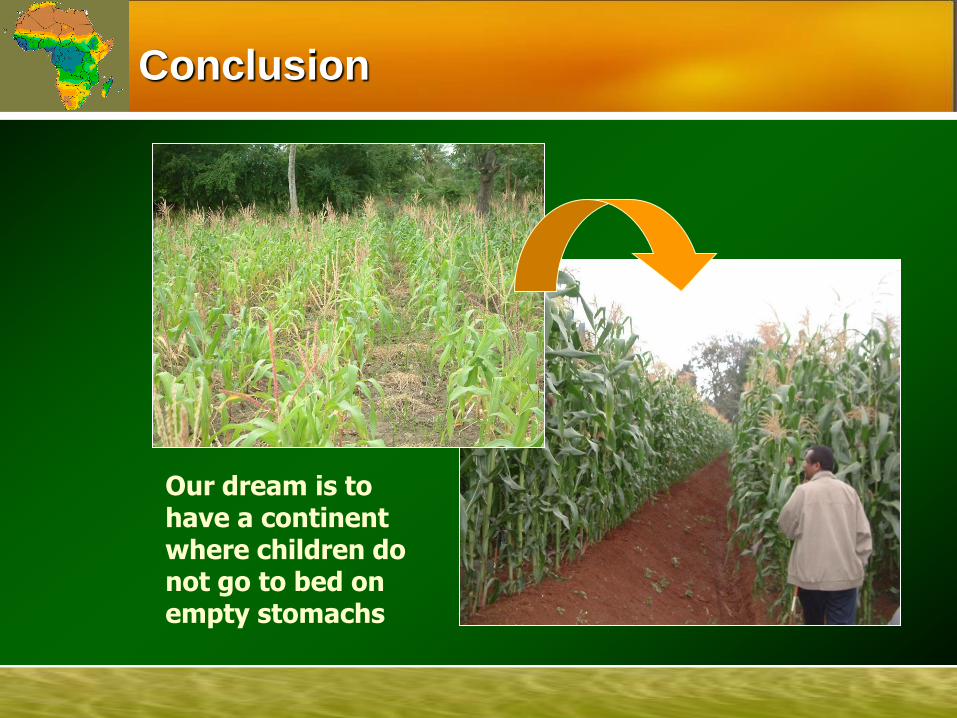
Conclusion
Our dream is to have a continent where children do not go to bed on empty stomachs
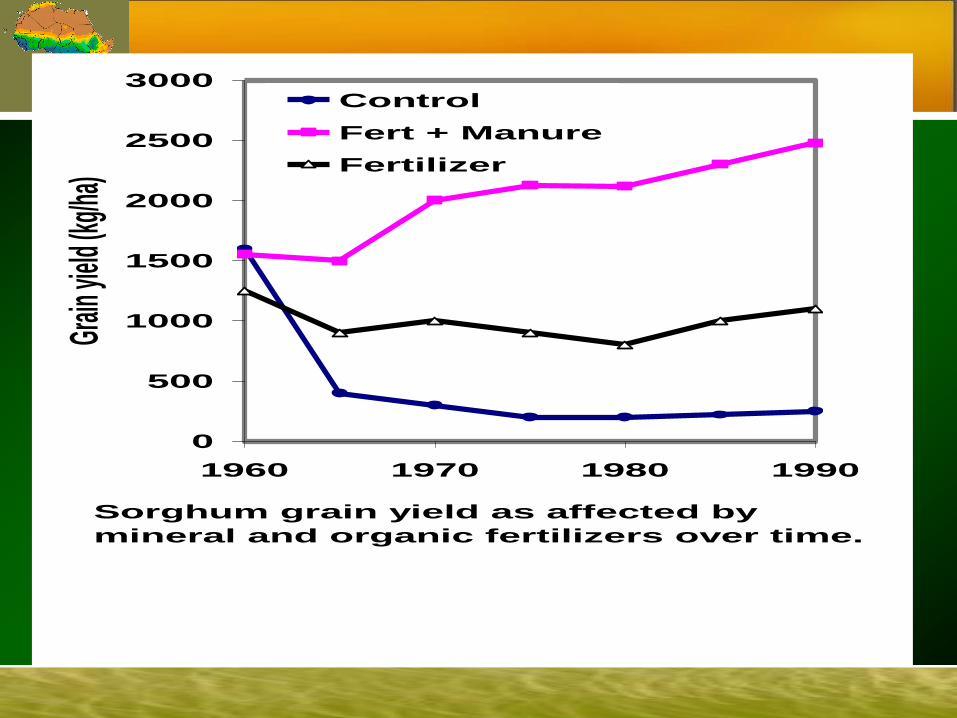
0
500
1000
1500
2000
2500
3000
1960 1970 1980 1990
Grain
yield
(kg/h
a)Control
Fert + Manure
Fertilizer
Sorghum grain yield as affected by
mineral and organic fertilizers over time.

Grain yield (GY) and water use efficiency (WUE) for millet in Niger
Improved soil fertility enhances the water use efficiency of crops in the Sahel
4.25 1700 4.14 1570 +Fertilizers
2.04 780 1.25 460 - Fertilizers
WUE GY WUE GY
DOSSO SADORE Treatments

Signs of Hope:
Rehabilitation, Prevention,
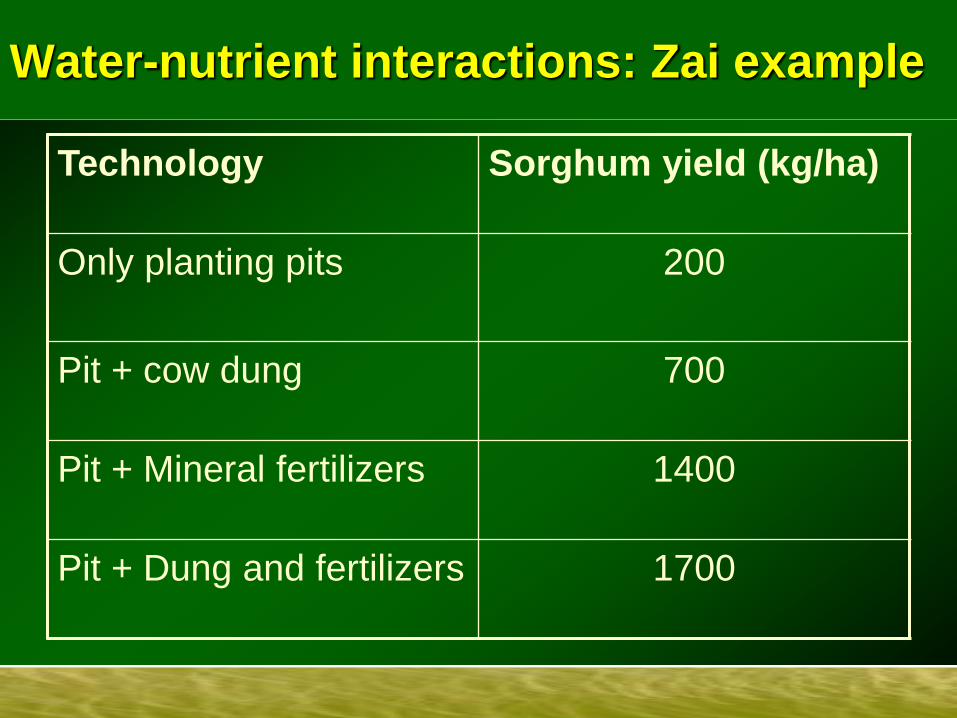
Water-nutrient interactions: Zai example
Technology Sorghum yield (kg/ha)
Only planting pits
200
Pit + cow dung
700
Pit + Mineral fertilizers
1400
Pit + Dung and fertilizers
1700

Field multiplying of hybrid sorghum seeds
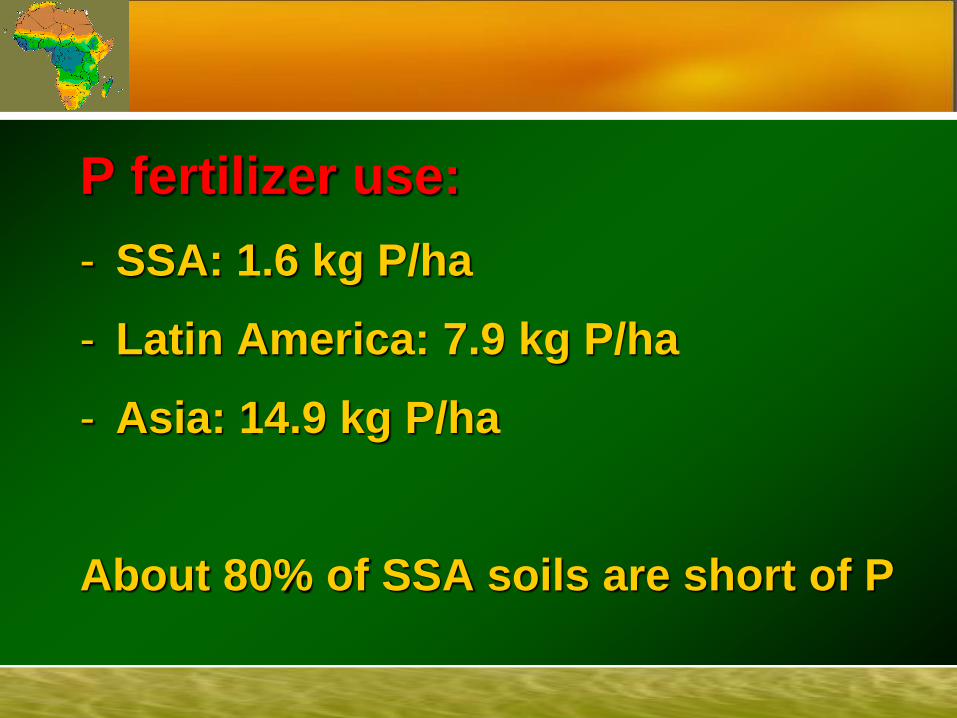
P fertilizer use:
- SSA: 1.6 kg P/ha
- Latin America: 7.9 kg P/ha
- Asia: 14.9 kg P/ha
About 80% of SSA soils are short of P

Phosphate rock deposits in SSA
80% of World Reserves