datatypes explanation
DESCRIPTION
Curso LabviewTRANSCRIPT

ni.com/students/learnlabview
Data Types and Structures: Detailed Explanation
String Data Type
A string is a sequence of displayable or nondisplayable ASCII characters. Strings provide a platform-independent format for information and data. Some of the more common applications of strings include the following:
Creating simple text messages.■■
Controlling instruments by sending text commands to the instrument and returning data values in the form ■■
of either ASCII or binary strings, which you then convert to numeric values.
Storing numeric data to disk. To store numeric data in an ASCII file, you must first convert numeric data to ■■
strings before writing the data to a disk file.
Instructing or prompting the user with dialog boxes.■■
On the front panel, strings appear as tables, text entry boxes, and labels. LabVIEW includes built-in VIs and functions you can use to manipulate strings, including formatting strings, parsing strings, and other editing. LabVIEW represents string data with the color pink.
Numeric Data Type
LabVIEW represents numeric data as floating-point numbers, fixed-point numbers, integers, unsigned integers, and complex numbers. Double and Single precision as well as Complex numeric data is represented with the color orange in LabVIEW. All Integer numeric data is represented with the color blue.
Note: The difference among the numeric data types is the number of bits they use to store data and the data values they represent.
Certain data types also provide extended configuration options. For example, you can associate physical units of measure with floating-point data, including complex numbers, and you can configure the encoding and range for fixed-point data.
Boolean Data Type
LabVIEW stores Boolean data as 8-bit values. A Boolean can be used in LabVIEW to represent a 0 or 1, or a TRUE or FALSE. If the 8-bit value is zero, the Boolean value is FALSE. Any nonzero value represents TRUE. Common applications for Boolean data include representing digital data and serving as a front panel control that acts as a switch that has a mechanical action often used to control an execution structure such as a Case structure. A Boolean control is typically used as the conditional statement to exit a While Loop. In LabVIEW, the color green represents Boolean data.

ni.com/students/learnlabview
Dynamic Data Type
Most Express VIs accept and/or return the dynamic data type, which appears as a dark blue terminal.
Using the Convert to Dynamic Data and Convert from Dynamic Data VIs, you can convert floating-point numeric or Boolean data of the following data types :
1D array of waveforms ■■
1D array of scalars■■
1D array of scalars – most recent value■■
1D array of scalars – single channel■■
2D array of scalars – columns are channels■■
2D array of scalars – rows are channels■■
Single scalar■■
Single waveform■■
Wire the dynamic data type to an indicator that can best present the data. Indicators include a graph, chart, or numeric, or Boolean indicator. However, because dynamic data undergoes an automatic conversion to match the indicator to which it is wired, Express VIs can slow down the block diagram execution speed.
The dynamic data type is for use with Express VIs. Most other VIs and functions that are shipped with LabVIEW do not accept this data type. To use a built-in VI or function to analyze or process the data the dynamic data type includes, you must convert the dynamic data type.
Data Structures in LabVIEW Sometimes it is beneficial to group data related to one another. Use arrays and clusters to group related data in LabVIEW. Arrays combine data of the same data type into one data structure, and clusters combine data of multiple data types into one data structure.
Arrays An array consists of elements and dimensions. Elements are the data that make up the array. A dimension is the length, height, or depth of an array. An array can have one or more dimensions and as many as (231) – 1 elements per dimension, memory permitting.
You can build arrays of numeric, Boolean, path, string, waveform, and cluster data types. Consider using arrays when you work with a collection of similar data and when you perform repetitive computations. Arrays are ideal for storing data you collect from waveforms or data generated in loops, where each iteration of a loop produces one element of the array.
Note: Array indexes in LabVIEW are zero-based. The index of the first element in the array, regardless of its dimension, is zero.
Array elements are ordered. An array uses an index so you can readily access any particular element. The index is zero-based, which means it is in the range 0 to n – 1, where n is the number of elements in the array. For example, n = 12 for the twelve months of the year, so the index ranges from 0 to 11. March is the third month, so it has an index of 2.
ni.com/students/learnlabview
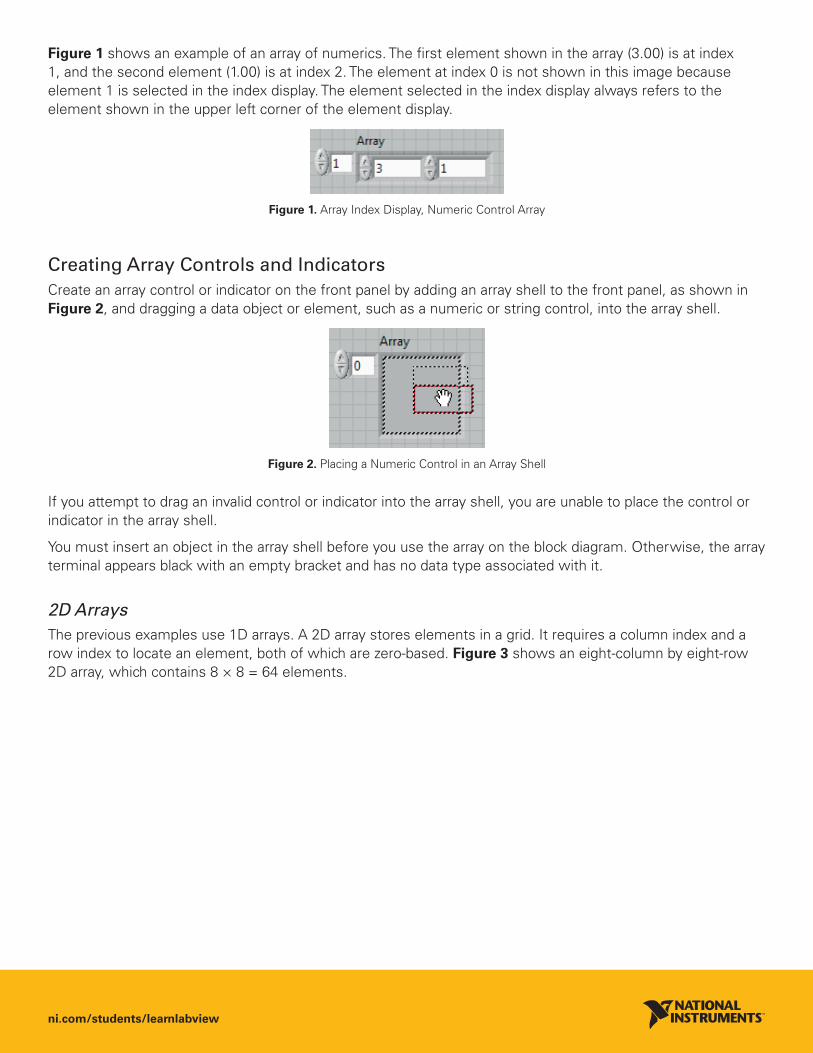
Figure 1 shows an example of an array of numerics. The first element shown in the array (3.00) is at index 1, and the second element (1.00) is at index 2. The element at index 0 is not shown in this image because element 1 is selected in the index display. The element selected in the index display always refers to the element shown in the upper left corner of the element display.
Figure 1. Array Index Display, Numeric Control Array
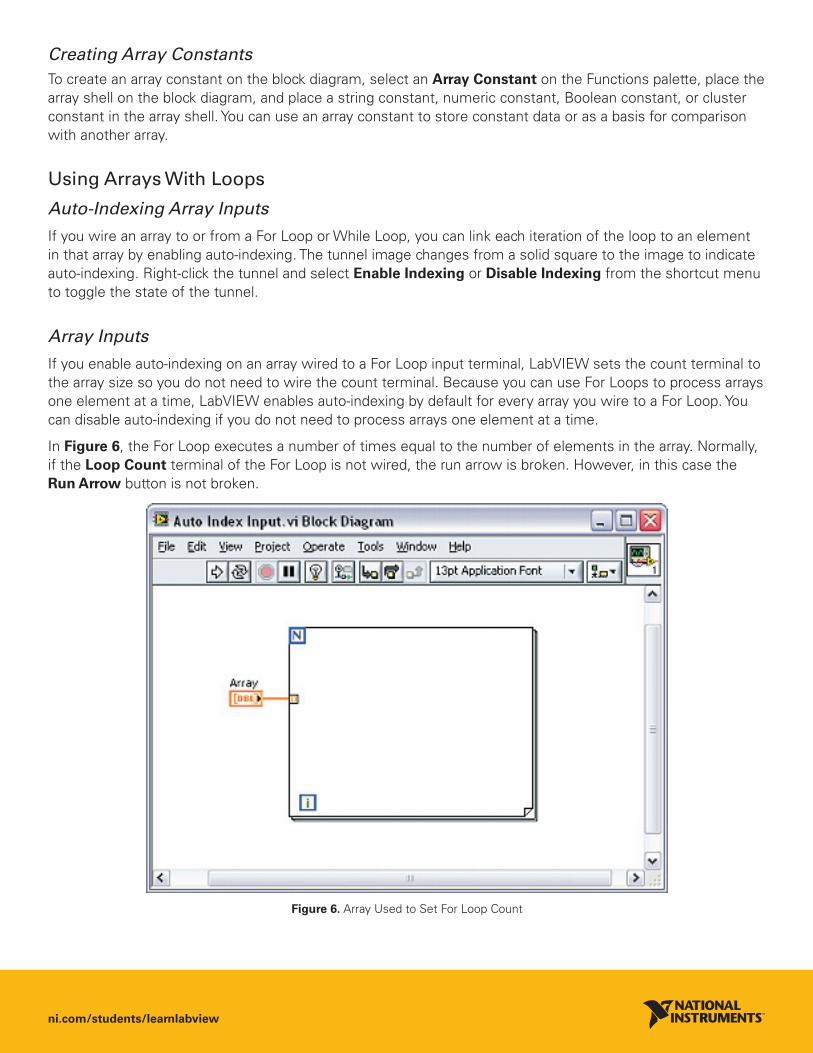
Creating Array Controls and Indicators Create an array control or indicator on the front panel by adding an array shell to the front panel, as shown in Figure 2, and dragging a data object or element, such as a numeric or string control, into the array shell.
Figure 2. Placing a Numeric Control in an Array Shell
If you attempt to drag an invalid control or indicator into the array shell, you are unable to place the control or indicator in the array shell.
You must insert an object in the array shell before you use the array on the block diagram. Otherwise, the array terminal appears black with an empty bracket and has no data type associated with it.
2D Arrays The previous examples use 1D arrays. A 2D array stores elements in a grid. It requires a column index and a row index to locate an element, both of which are zero-based. Figure 3 shows an eight-column by eight-row 2D array, which contains 8 × 8 = 64 elements.

ni.com/students/learnlabview
Column Index0 1 2 3 4 5 6 7
01234567
Figure 3. 2D Array
To add a multidimensional array to the front panel, right-click the index display and select Add Dimension from the shortcut menu. You also can resize the index display until you have as many dimensions as you want.
Initializing Arrays You can initialize an array or leave it uninitialized. When an array is initialized, you defined the number of elements in each dimension and the contents of each element. An uninitialized array contains a fixed number of dimensions but no elements. Figure 4 shows an uninitialized 2D array control. Notice that the elements are all dimmed. This indicates that the array is uninitialized.
Figure 4. 2D Uninitialized Array
In Figure 5, six elements are initialized. In a 2D array, after you initialize an element in a row, the remaining elements in that row are initialized and populated with the default value for the data type. For example, in Figure 5, if you enter 4 into the element in the first column, third row, the elements in the second and third column in the third row are automatically populated with a 0.
Figure 5. An Initialized 2D Array With Six Elements
Ro
w In
dex
ni.com/students/learnlabview
Creating Array ConstantsTo create an array constant on the block diagram, select an Array Constant on the Functions palette, place the array shell on the block diagram, and place a string constant, numeric constant, Boolean constant, or cluster constant in the array shell. You can use an array constant to store constant data or as a basis for comparison with another array.
Using Arrays With Loops
Auto-Indexing Array Inputs
If you wire an array to or from a For Loop or While Loop, you can link each iteration of the loop to an element in that array by enabling auto-indexing. The tunnel image changes from a solid square to the image to indicate auto-indexing. Right-click the tunnel and select Enable Indexing or Disable Indexing from the shortcut menu to toggle the state of the tunnel.
Array Inputs
If you enable auto-indexing on an array wired to a For Loop input terminal, LabVIEW sets the count terminal to the array size so you do not need to wire the count terminal. Because you can use For Loops to process arrays one element at a time, LabVIEW enables auto-indexing by default for every array you wire to a For Loop. You can disable auto-indexing if you do not need to process arrays one element at a time.
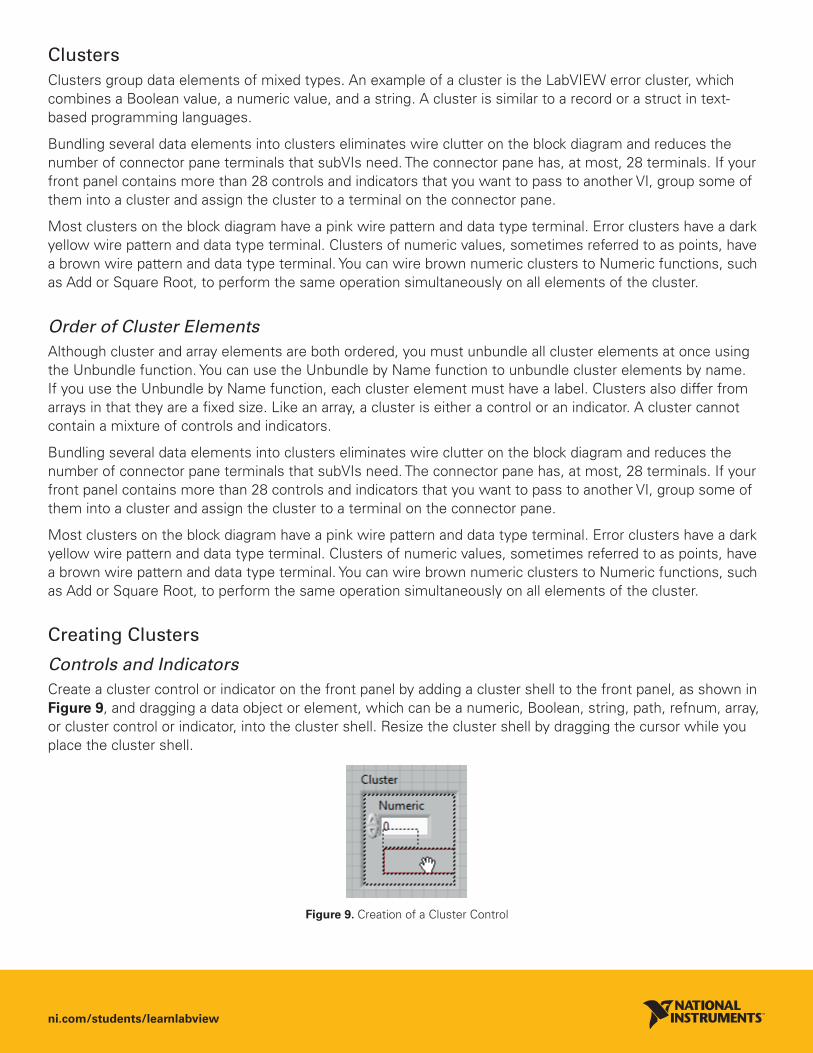
In Figure 6, the For Loop executes a number of times equal to the number of elements in the array. Normally, if the Loop Count terminal of the For Loop is not wired, the run arrow is broken. However, in this case the Run Arrow button is not broken.
Figure 6. Array Used to Set For Loop Count

ni.com/students/learnlabview
If you enable auto-indexing for more than one tunnel or if you wire the count terminal, the actual number of iterations becomes the smaller of the choices. For example, if two auto-indexed arrays enter the loop, with 10 and 20 elements respectively, and you wire a value of 15 to the count terminal, the loop still executes only 10 times, indexing all elements of the first array but only the first 10 elements of the second array.
Array Outputs When you auto-index an array output tunnel, the output array receives a new element from every iteration of the loop. Therefore, auto-indexed output arrays are always equal in size to the number of iterations. The wire from the output tunnel to the array indicator becomes thicker as it changes to an array at the loop border, and the output tunnel contains square brackets representing an array.
Figure 7. Auto-Indexed Output
Right-click the tunnel at the loop border and select Enable Indexing or Disable Indexing from the shortcut menu to enable or disable auto-indexing. Auto-indexing for While Loops is disabled by default. For example, disable auto-indexing if you need only the last value passed out of the tunnel.
Creating 2D Arrays You can use two For Loops, nested one inside the other, to create a 2D array. The outer For Loop creates the row elements, and the inner For Loop creates the column elements.
Figure 8. Creating a 2D Array
ni.com/students/learnlabview
ClustersClusters group data elements of mixed types. An example of a cluster is the LabVIEW error cluster, which combines a Boolean value, a numeric value, and a string. A cluster is similar to a record or a struct in text-based programming languages.
Bundling several data elements into clusters eliminates wire clutter on the block diagram and reduces the number of connector pane terminals that subVIs need. The connector pane has, at most, 28 terminals. If your front panel contains more than 28 controls and indicators that you want to pass to another VI, group some of them into a cluster and assign the cluster to a terminal on the connector pane.
Most clusters on the block diagram have a pink wire pattern and data type terminal. Error clusters have a dark yellow wire pattern and data type terminal. Clusters of numeric values, sometimes referred to as points, have a brown wire pattern and data type terminal. You can wire brown numeric clusters to Numeric functions, such as Add or Square Root, to perform the same operation simultaneously on all elements of the cluster.
Order of Cluster Elements Although cluster and array elements are both ordered, you must unbundle all cluster elements at once using the Unbundle function. You can use the Unbundle by Name function to unbundle cluster elements by name. If you use the Unbundle by Name function, each cluster element must have a label. Clusters also differ from arrays in that they are a fixed size. Like an array, a cluster is either a control or an indicator. A cluster cannot contain a mixture of controls and indicators.
Bundling several data elements into clusters eliminates wire clutter on the block diagram and reduces the number of connector pane terminals that subVIs need. The connector pane has, at most, 28 terminals. If your front panel contains more than 28 controls and indicators that you want to pass to another VI, group some of them into a cluster and assign the cluster to a terminal on the connector pane.
Most clusters on the block diagram have a pink wire pattern and data type terminal. Error clusters have a dark yellow wire pattern and data type terminal. Clusters of numeric values, sometimes referred to as points, have a brown wire pattern and data type terminal. You can wire brown numeric clusters to Numeric functions, such as Add or Square Root, to perform the same operation simultaneously on all elements of the cluster.
Creating Clusters
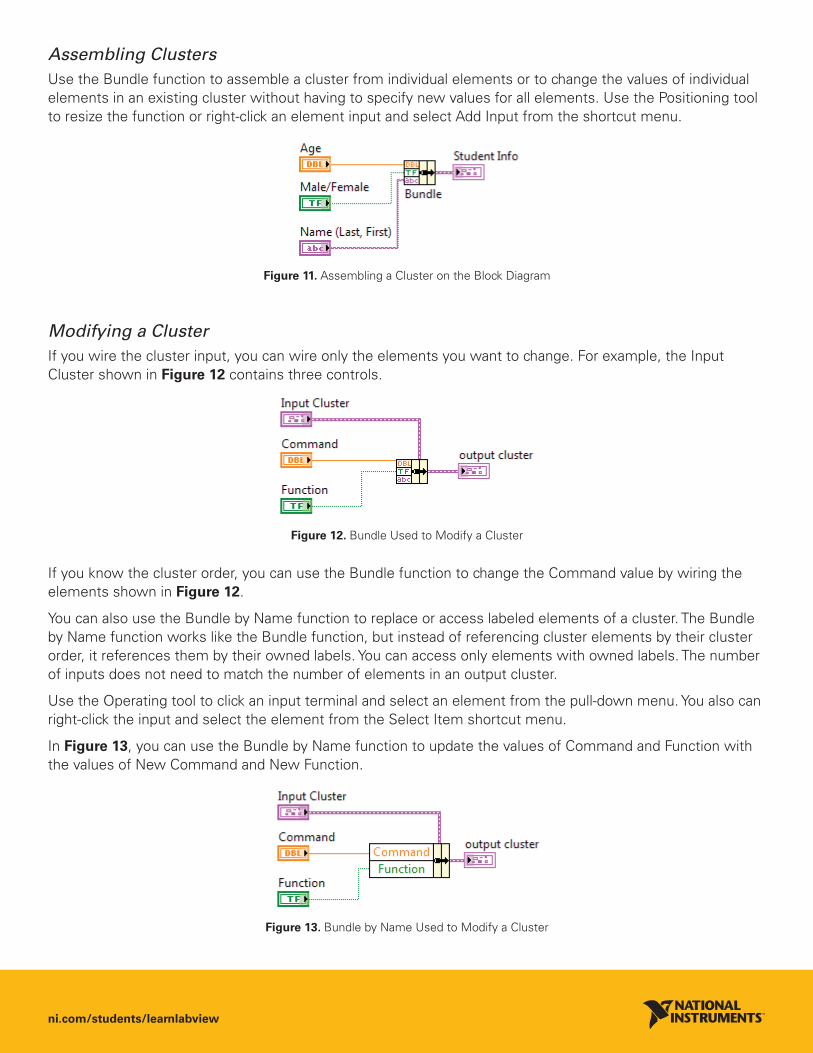
Controls and Indicators Create a cluster control or indicator on the front panel by adding a cluster shell to the front panel, as shown in Figure 9, and dragging a data object or element, which can be a numeric, Boolean, string, path, refnum, array, or cluster control or indicator, into the cluster shell. Resize the cluster shell by dragging the cursor while you place the cluster shell.
Figure 9. Creation of a Cluster Control

ni.com/students/learnlabview
Figure 10 is an example of a cluster containing three controls: a string, a Boolean switch, and a numeric. A cluster is either a control or an indicator; it cannot contain a mixture of controls and indicators.
Figure 10. Cluster Control Example
Creating Cluster Constants To create a cluster constant on the block diagram, select a Cluster Constant on the Functions palette, place the cluster shell on the block diagram, and place a string constant, numeric constant, Boolean constant, or cluster constant in the cluster shell. You can use a cluster constant to store constant data or as a basis for comparison with another cluster.
If you have a cluster control or indicator on the front panel window and you want to create a cluster constant containing the same elements on the block diagram, you can either drag that cluster from the front panel window to the block diagram or right-click the cluster on the front panel window and select Create >> Constant from the shortcut menu.
Using Cluster Functions Use the Cluster functions to create and manipulate clusters. For example, you can perform tasks similar to the following:
Extract individual data elements from a cluster.■■
Add individual data elements to a cluster.■■
Break a cluster into its individual data elements.■■
Use the Bundle function to assemble a cluster, use the Bundle function and Bundle by Name function to modify a cluster, and use the Unbundle function and the Unbundle by Name function to disassemble clusters.
You also can place the Bundle, Bundle by Name, Unbundle, and Unbundle by Name functions on the block diagram by right-clicking a cluster terminal on the block diagram and selecting Cluster, Class & Variant Palette from the shortcut menu. The Bundle and Unbundle functions automatically contain the correct number of terminals. The Bundle by Name and Unbundle by Name functions appear with the first element in the cluster. Use the Positioning tool to resize the Bundle by Name and Unbundle by Name functions to show the other elements of the cluster.
ni.com/students/learnlabview
Assembling Clusters Use the Bundle function to assemble a cluster from individual elements or to change the values of individual elements in an existing cluster without having to specify new values for all elements. Use the Positioning tool to resize the function or right-click an element input and select Add Input from the shortcut menu.
Figure 11. Assembling a Cluster on the Block Diagram
Modifying a Cluster If you wire the cluster input, you can wire only the elements you want to change. For example, the Input Cluster shown in Figure 12 contains three controls.
Figure 12. Bundle Used to Modify a Cluster
If you know the cluster order, you can use the Bundle function to change the Command value by wiring the elements shown in Figure 12.
You can also use the Bundle by Name function to replace or access labeled elements of a cluster. The Bundle by Name function works like the Bundle function, but instead of referencing cluster elements by their cluster order, it references them by their owned labels. You can access only elements with owned labels. The number of inputs does not need to match the number of elements in an output cluster.
Use the Operating tool to click an input terminal and select an element from the pull-down menu. You also can right-click the input and select the element from the Select Item shortcut menu.
In Figure 13, you can use the Bundle by Name function to update the values of Command and Function with the values of New Command and New Function.
Figure 13. Bundle by Name Used to Modify a Cluster

ni.com/students/learnlabview
Use the Bundle by Name function for data structures that might change during development. If you add a new element to the cluster or modify its order, you do not need to rewire the Bundle by Name function because the names are still valid.
Disassembling Clusters
Use the Unbundle function to split a cluster into its individual elements.
Use the Unbundle by Name function to return the cluster elements whose names you specify. The number of output terminals does not depend on the number of elements in the input cluster.
Use the Operating tool to click an output terminal and select an element from the pull-down menu. You also can right-click the output terminal and select the element from the Select Item shortcut menu.
For example, if you use the Unbundle function with the cluster in Figure 14, it has four output terminals that correspond to the four controls in the cluster. You must know the cluster order so you can associate the correct Boolean terminal of the unbundled cluster with the corresponding switch in the cluster. In this example, the elements are ordered from top to bottom starting with element 0. If you use the Unbundle by Name function, you can have an arbitrary number of output terminals and access individual elements by name in any order.
Figure 14. Unbundle and Unbundle By Name

ni.com/students/learnlabview
Enums An enum (enumerated control, constant, or indicator) is a combination of data types. An enum represents a pair of values, a string and a numeric, where the enum can be one of a list of values. For example, if you created an enum type called Month, the possible value pairs for a Month variable are January-0, February-1, and so on through December-11. Figure 15 shows an example of these data pairs in the Properties dialog box for an enumerated control. This is directly accessed by right-clicking the enum control and selecting Edit Items.
Figure 15. Properties for the Month Enumerated Control
ni.com/students/learnlabview
©2011 National Instruments. All rights reserved. LabVIEW, National Instruments, NI, and ni.com are trademarks of National Instruments. Other product and company names listed are trademarks or trade names of their respective companies.
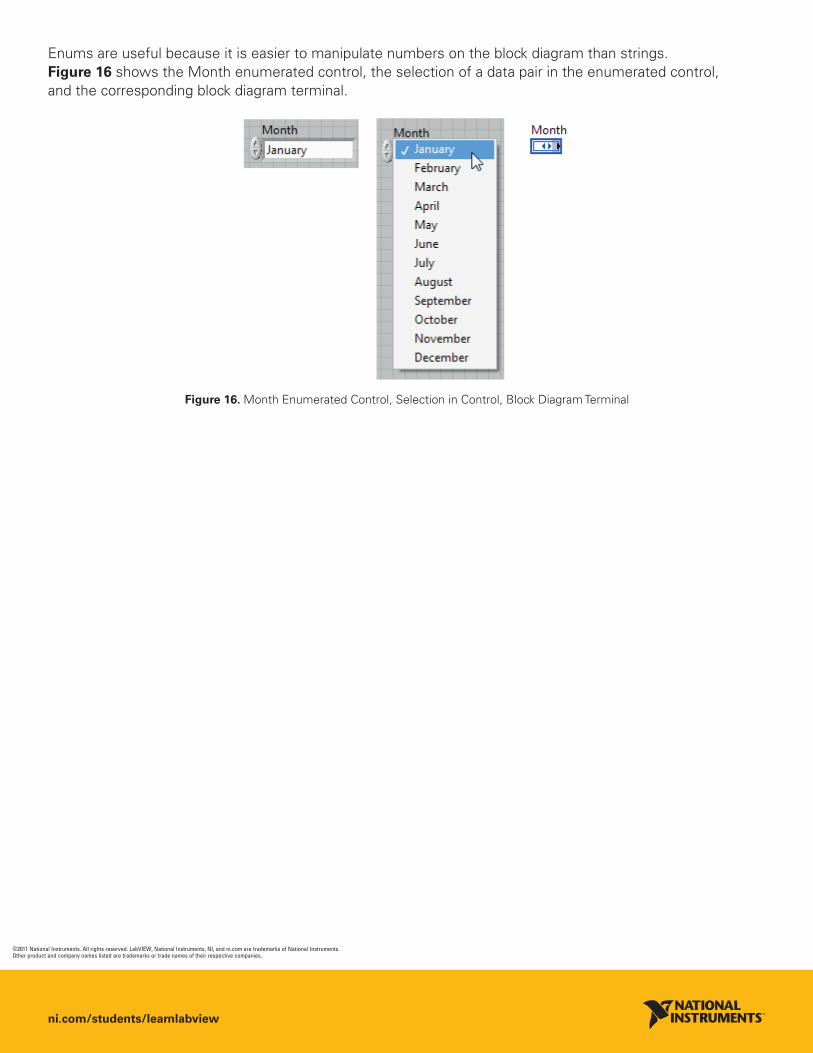
Enums are useful because it is easier to manipulate numbers on the block diagram than strings. Figure 16 shows the Month enumerated control, the selection of a data pair in the enumerated control, and the corresponding block diagram terminal.
Figure 16. Month Enumerated Control, Selection in Control, Block Diagram Terminal