database analysis of simulated and recorded … · database analysis of simulated and recorded...
TRANSCRIPT
Neuroinform (2009) 7:93–111DOI 10.1007/s12021-009-9048-z
Database Analysis of Simulated and RecordedElectrophysiological Datasets with PANDORA’s Toolbox
Cengiz Günay · Jeremy R. Edgerton · Su Li ·Thomas Sangrey · Astrid A. Prinz · Dieter Jaeger
Published online: 28 May 2009© Humana Press Inc. 2009
Abstract Neuronal recordings and computer simula-tions produce ever growing amounts of data, impedingconventional analysis methods from keeping pace. Suchlarge datasets can be automatically analyzed by takingadvantage of the well-established relational databaseparadigm. Raw electrophysiology data can be enteredinto a database by extracting its interesting charac-teristics (e.g., firing rate). Compared to storing theraw data directly, this database representation is sev-eral orders of magnitude higher efficient in storagespace and processing time. Using two large electrophys-iology recording and simulation datasets, we demon-strate that the database can be queried, transformedand analyzed. This process is relatively simple andeasy to learn because it takes place entirely in Matlab,using our database analysis toolbox, PANDORA. Itis capable of acquiring data from common recordingand simulation platforms and exchanging data withexternal database engines and other analysis toolboxes,
Electronic supplementary material The online versionof this article (doi:10.1007/s12021-009-9048-z) containssupplementary material, which is available toauthorized users.
C. Günay (B) · J. R. Edgerton · A. A. Prinz · D. JaegerDept. of Biology, Emory University,1510 Clifton Rd., Atlanta, GA 30322, USAe-mail: [email protected]
S. LiNeurosurgery Department, School of Medicine,Emory University, Atlanta, GA 30322, USA
T. SangreyComputational Neuroscience Unit,Okinawa Institute of Science and Technology,Okinawa, Japan
which make analysis simpler and highly interoperable.PANDORA is available to be freely used and modi-fied because it is open-source (http://software.incf.org/software/pandora/home).
Keywords Database · Data visualization · Matlab ·Neural model · Simulation · Electrophysiology ·SQL · Large datasets · Automated analysis ·Pandora · Open-source
Introduction
The amount of electrophysiological data is increasingas more channels can be sampled and recording qualityimproves, while rapid advances in computing speedand capacity (e.g., with grid computing) have enabledresearchers to generate simulation data very quicklyin massive amounts. Especially when diverse and cus-tomized sets of data analysis are used, proper handlingof this data poses a neuroinformatics challenge (Bjaalie2008).
Since more than 30 years, relational databaseshave been successfully used to manage large amountsof data (Chamberlin and Boyce 1974; Elmasri andNavathe 1994). In neuroscience, databases have beentraditionally used to improve laboratory procedures,record keeping, and data sharing (Shepherd et al. 1998;Pittendrigh and Jacobs 2003; Hines et al. 2004; Morse2007; Gardner et al. 2008), but only more recentlythey were found to be useful for storing and analyzingneural data (Prinz et al. 2003, 2004; Calin-Jagemanet al. 2007), and being subjected to data mining (Lytton2006; Taylor et al. 2006; Günay et al. 2008b). Construct-ing databases of neural analysis results addresses a
94 Neuroinform (2009) 7:93–111
bottleneck of neuroscience, which is analysis automa-tion. In contrast, eyeballing or other semi-automaticanalysis procedures would make it intractable to an-alyze the traces produced by the hundred thousands,or even millions, of neuron and network models (Prinzet al. 2003, 2004; Calin-Jageman et al. 2007; Günay et al.2008a, b), or to analyze the continuous streams fromdozens of electrodes (Nicolelis et al. 2003). Fully auto-matic analysis was demonstrated by Prinz et al. (2004)of intracellular data traces from 20 million neuronalnetwork models, where the analysis results were savedin a custom database consisting of a collection of textfiles. Although reading text files is straightforward, un-derstanding the organization of their contents requiresspecialized tools because of the lack of a queryingcapability. For instance, adding the output of a newanalysis method into the text files would entail parsingand reconstructing thousands of files occupying a spaceof several hundred gigabytes. Using a more generaldatabase tool can provide the same functionality muchmore easily. Despite the need for database approachesto neural data analysis, almost no software tool havebeen developed to date for general use. Günay et al.(2008a) used such a tool to study the rat globus pallidus(GP) by comparing a database of recordings from 146neurons to a database of 100,602 neuron models. In thecurrent study, we illustrate the strengths of this data-base approach, specifically with the PANDORA tool-box (Günay 2008a, b) employed in the above study.The PANDORA database approach transforms theraw data into numerical matrices by collecting itsimportant aspects (e.g., spike shape and firing ratecharacteristics), which enables the cross comparisonbetween the model and recorded GP neuron data-bases efficiently. PANDORA works within the Matlabenvironment (Mathworks Inc., Natick, MA), which al-lows accessing other commonly used electrophysiolog-ical and statistical analysis toolboxes such as Chronux(Brown et al. 2004; Bokil et al. 2006), FIND (Meieret al. 2008), BSMART (Cui et al. 2008), and sigTOOL(Lidierth 2009). Interoperability with other analysistools allows both: (1), improving reproducibility andcross validation of results; and (2), promoting to reuseexisting analysis methods that helps the developmentof robust community toolboxes (Cannon et al. 2007;Günay et al. 2008c; Herz et al. 2008). Interoperability isachieved by using compatible input and output formats.PANDORA can import data from several differentelectrophysiological acquisition and simulation pro-grams, and it constructs a self-describing database bykeeping associated metadata in Matlab structures, thatcan be exported to several external spreadsheet anddatabase formats. Here, we describe the specific advan-
tages of using the PANDORA toolbox for electrophys-iological data analysis, first in analyzing the above GPdataset (Günay et al. 2008a), and then by extending thedatabase approach to study a network model datasetfrom the lobster stomatogastric ganglion (Prinz et al.2004; Günay et al. 2008b) to show that the toolbox iscapable of operating on different types of data.
Methods
The PANDORA toolbox defines a methodology tocreate searchable databases of electrophysiology data(see the user manual in Günay 2007, 2008a, b). Itcomes as an add-on toolbox to the Matlab computingand analysis environment (MathWorks Inc., Natick,MA). PANDORA is distributed free of charge withan open-source license (Academic Free License version3.0; http://www.opensource.org/licenses/academic.php),organized with an object-oriented approach (see Supp.Methods A.1.1).
Overview of Database Analysisfor Electrophysiological Data
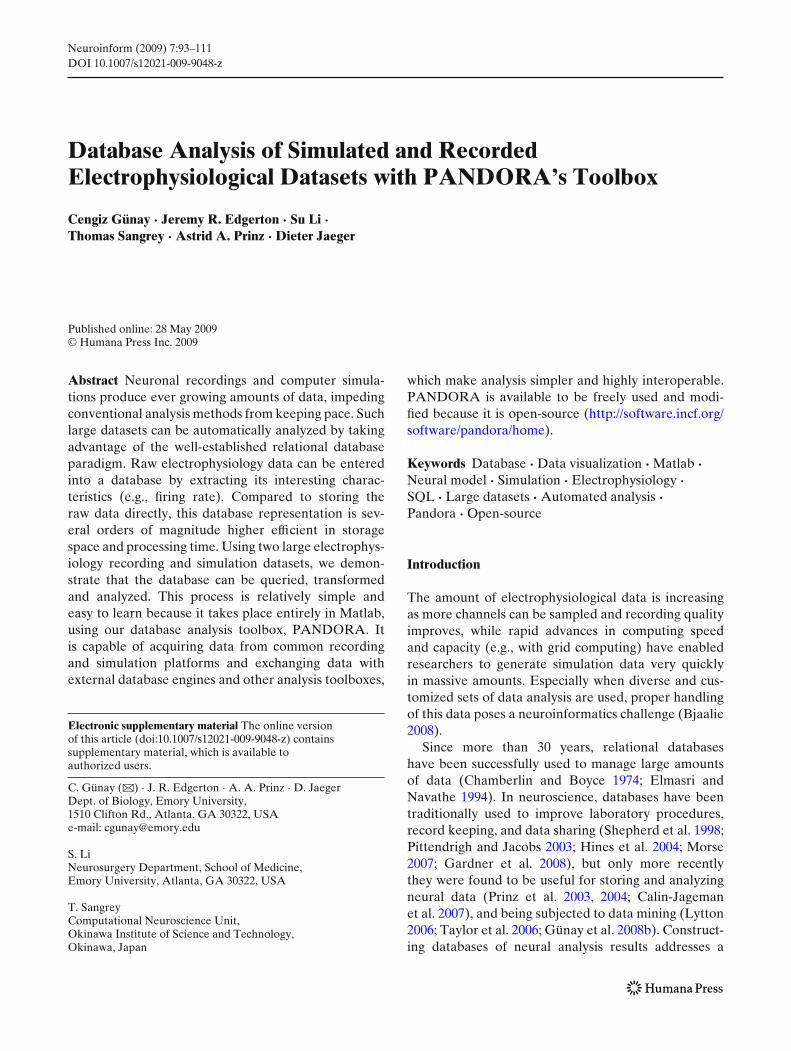
In PANDORA, database analysis consists of the fol-lowing steps (Fig. 1):
1. Organizing raw data files in a dataset for perform-ing automatic analysis;
2. Analyzing each raw electrophysiological data traceby measuring its electrophysiological characteris-tics (e.g., firing rate);
3. Inserting sets of measured characteristics from allitems of a dataset into a database;
4. Analyzing databases by comparing, merging, join-ing, reducing dimensions, and calculating cor-relations, histograms, statistics, and componentanalyses;
5. Linking back to raw data traces associated withparticular analysis values found; and
6. Visualizing raw or transformed results in a varietyof graphical representations.
In this paper, we show application of this analysis ap-proach first to a study of recordings and simulationsfrom the globus pallidus (GP) of the rat (Günay et al.2008a), and then to a study of the pyloric network of thelobster stomatogastric ganglion (Günay et al. 2008b). Inthe GP dataset, database analysis starts with identifyingthe sources from which to load the data.
Neuroinform (2009) 7:93–111 95
Fig. 1 Main componentsof PANDORA. Raw datatraces are analyzed to createmeasurement profiles andthen inserted into thedatabase matrix along withmetadata. See text for thedetails of the required steps
Organizing Data Files into a Datasetto Create a Database
The model GP neuron dataset contains 100,602 neu-rons modeled with nine Hodgkin and Huxley (1952)type ion channels with variable maximal conductanceparameters (Günay et al. 2008a). Each of these modelsis simulated five times with different current stimulusmagnitudes. The result was a dataset of more than500,000 files. Especially with such large datasets, orga-nizing and keeping track of data files scattered acrossmany directories becomes challenging. The process offinding data files, loading the data with correct para-meters, and inserting the measured characteristics intoprofile objects to create databases is automated bythe dataset component in PANDORA (Fig. 1). Theseare achieved by keeping, in the dataset, the necessaryinformation such as the location of raw data files; andthe parameters used to load, preprocess and identifythem (see Supp. Methods A.1.2 for details). Using thisinformation, the dataset object creates the databasestructure after iterating through its data files.
The dataset can process any Matlab-readable datafile. The supported data formats include the outputs ofneural simulators, such as Genesis (Bower and Beeman1998) and Neuron (Carnevale and Hines 2006), andoutputs of data acquisition programs compatible with theNeuroShare initiative (http://neuroshare.sourceforge.net; see Supp. Methods. A.1.3 for a full list of formats).After the data are loaded into Matlab, they areanalyzed to enter their salient characteristics into adatabase.
Measuring Electrophysiological Characteristicsto be Entered into the Database
Interesting electrophysiological characteristics (e.g., fir-ing rate) that deserve to be entered into the database
must be extracted from loaded data files automatically.To achieve this, we programmed Matlab functions toextract a uniform set of characteristics from data tracefiles. As such functions for each data type need toextract different sets of salient characteristics, we groupthe functions into separate software components. Forinstance, functions for intracellular voltage traces ofthe GP dataset are grouped in the data trace com-ponent (Fig. 1). These functions extract the followingcharacteristics:
• the voltage mean, minima and maxima;• action potential (AP) peaks and troughs from volt-
age minima and maxima using a sliding-windowapproach;
• firing rate statistics from AP times: mean rate andinter-spike-intervals (ISIs), their standard devia-tion and ISI coefficient of variation (ISI-CV);
• the AP initiation point, using complex heuristics(Sekerli et al. 2004); and,
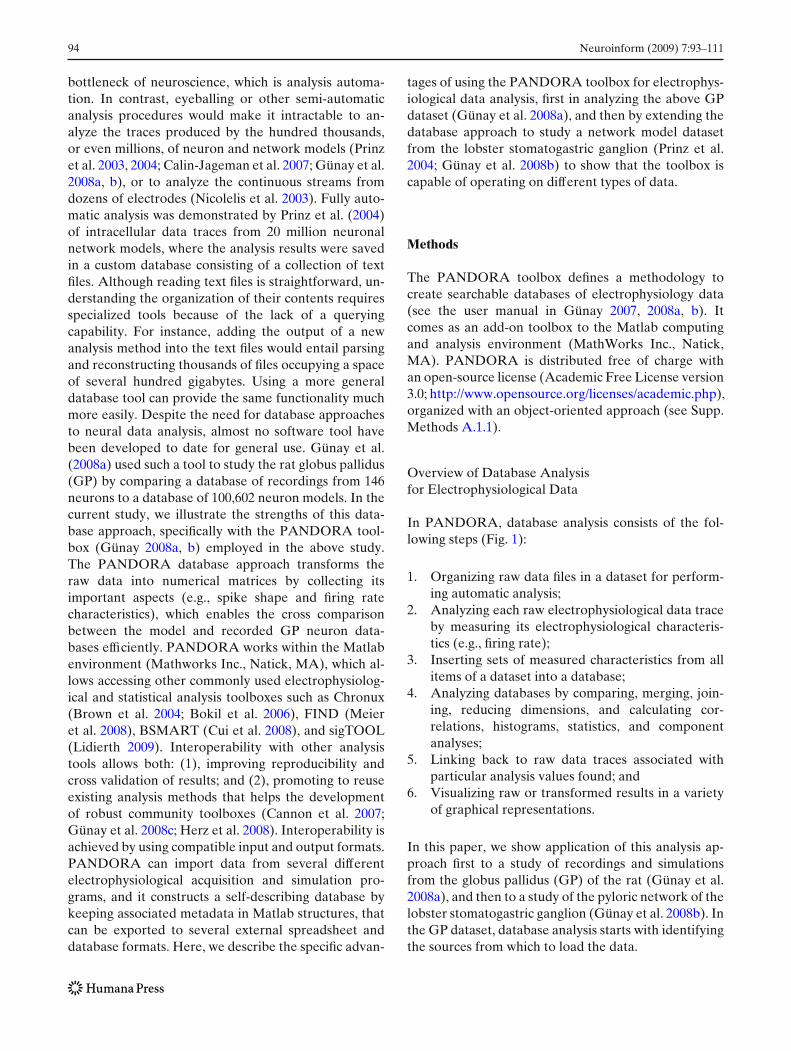
• using the initiation point, spike shape characteris-tics such as: the amplitude, rise and fall times, andthe after-hyperpolarization (AHP) depth (Fig. 2a).
In the case when a stimulus is applied to the traces,additional characteristics must be measured.
Measuring Responses to a Current Injection Stimulus
To test the input resistance of the neurons in the GPdataset and to find their firing rate as a function ofinput current (f/I curve), we used a current injectionpulse (CIP) stimulus, which is commonly employed forcurrent-clamp recordings and simulations. When thereis a stimulus applied, the change in electrophysiologicalcharacteristics depending on the timing of the stimulusbecomes interesting. With the use of the CIP stimu-lus protocol, the electrophysiological characteristics ofthe activity before, during and the recovery after the
96 Neuroinform (2009) 7:93–111
A B
1450 1500 1550-100
-90
-80
-70
-60annotated spike characteristics
time [ms]
volta
ge [m
V]
Fig. 2 PANDORA offers functions for automated measurementof electrophysiological characteristics from intracellular voltagetraces. a Action potential (spike) shape characteristics of thresh-old, base width, amplitude and afterhyperpolarization (AHP)annotated on a single spike. b Automatically found spikes anno-tated on a recorded intracellular trace (PANDORA commandsto obtain this plot are given in Supp. Matlab Code 1)
CIP period can be observed (Fig. 5c). Thus, the abovemeasurements are replicated for each of these periodsfor CIP-applied data traces (cip_trace componentin Supp. Mat. A.3). We also include additional mea-surements special to CIP-applied traces (described inGünay et al. 2008a), such as:
• the firing rates at the beginning and at the end ofthe CIP period corresponding to the initial responseto current stimulus and the steady-state firing ratereached,
• the firing rate of the two halves of the recoveryperiod corresponding to the initial recovery andsteady-state rate reached,
• the ratio of the firing rates in periods before andafter CIP,
• the voltage “sag” when a hyperpolarizing current isapplied to measure the hyperpolarization-activatedinward current (Ih), and
• the firing rate accommodation during the CIP pe-riod (ratio of last ISI to first ISI).
Once a comprehensive set of measurements are ex-tracted from electrophysiology traces, they are usedto represent the recorded or simulated neuron in theabsence of the raw traces.
Creating a Database from Measured Dataset Files
A prerequisite to creating a database is having themeasured characteristics uniform across dataset ele-ments. During the creation, one function of the datatrace component collects all of these characteristics andplaces them in a trace profile component object (Fig. 1).To form the database object, multiple profile objectsare concatenated together into a matrix.
Since the measured characteristics and the parame-ters of the data files are all numeric, the PANDORAdatabase object consists of a double-precision numer-ical matrix and its associated metadata. The metadataconsists of parameters associated with the recordingor simulation such as an identifying number, conduc-tance values or drug concentrations. The dataset trans-fers the data and metadata from the files to createthe database structures. To demonstrate this, a simpleexample shows how a database can be created fromarbitrary data and metadata (Fig. 3). The metadataallows giving labels to the indices such as ‘firing_rate’,‘spike_amplitude’, etc. The labels can be given to therows, columns and pages (the third dimension) of thematrix, although the matrix can hold more dimen-sions. By convention, columns represent parametersand measurements, and rows represent independentobservations (e.g., from a neuron, or from one of itstraces with specific parameters). This convention al-lows specific types of analyses to be performed on thisdatabase.
Database Analysis
Database analysis is performed by asking queries andapplying transformations to a database and placing theresults in new database objects (Supp. Methods A.1.4).Statistics, histogram, or cross-correlation functions that
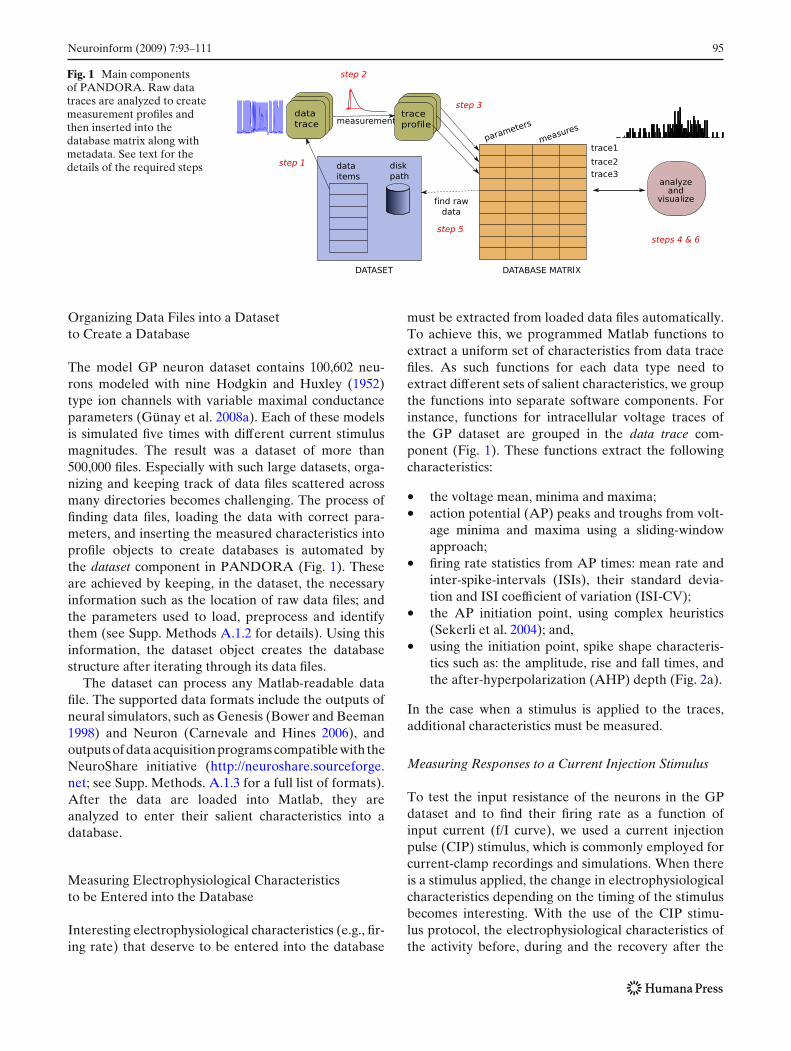
>> db_obj =tests_db([1 2; 3 4],
{’col1’, ’col2’},{’row1’, ’row2’}, ’a 2x2 DB’)
Fig. 3 A simple example of creating a database from a 2 × 2arbitrary data matrix. tests_db is the name of the databasecomponent and it also represents the constructor function thatgenerates such database objects. The function uses its argumentsto generate the database object assigned to the db_obj variable.
The function arguments consist of the matrix data, metadatato label column and row dimensions, and finally an identify-ing name for the database (see the Supp. Methods and theonline PANDORA Manual in Günay 2007, 2008a, b for moredetails)
Neuroinform (2009) 7:93–111 97
operate on a database produce their results in newspecialized database objects. For instance, when thehistogram of a database column is calculated, the his-togram bins appear in a new histogram database ob-ject (histogram_db component in Supp. Mat. A.1.4)with the bin center and height as columns, whichallows visualization and calculation of statistics such asthe Kullback–Leibler (KL) divergence (Kullback andLeibler 1951; Johnson and Sinanovic 2001; Sinanovicand Johnson 2007, see Supp. Methods A.1.6). Simi-larly, a database can be subjected to statistics func-tions such as mean, mode, median, standard deviation,and standard error that generate a statistics database(stats_db component). In this database, the numberof samples used for calculating the statistic is reportedseparately for each column for downstream analysisand plotting functions (e.g., see n values in bar plotsof Figs. 5b and 8b) because it may be different due tomissing values in the originating database. These miss-ing values are represented by the not-a-number (NaN)symbol of Matlab, and treated specially by variousPANDORA functions (e.g., averaging will skip NaNs).Since the statistics results are in databases, they can bequeried to find an activity of interest (e.g., histogrampeak, tail, outliers or specific ranges) and the queryresults can be used to query the original database to findthe individual neurons that contributed to the desiredactivity.
Querying the Database
The database contents can be searched by placing mul-tiple constraints on the metadata and measured char-acteristics in database queries. In PANDORA, queriesare expressed in the Matlab language syntax for ad-dressing vector and matrix indices using parentheses,allowing the use of Matlab logical expressions (seeSupp. Methods A.1.4 for examples). Returning match-ing database entries is only a simple application ofqueries, and they can be used to achieve more elaboratetasks. For example, queries were used to find uniqueparameter sets for automatically averaging repeatedtrials in the GP dataset.
Averaging Repeated Trials in the Database
Often experimental data from repeated trials withthe same recording conditions need to be averaged.PANDORA’s meanDuplicateParams function (seeSupp. Section A.3) does this by collapsing all databaserows that are equivalent in terms of chosen parameters(e.g., stimulus conditions) but, at the same time, distin-guished by other parameters (e.g., neuron identifiers).
The results of the function are the mean and the stan-dard deviation (STD) of the measured characteristicscorresponding to the repeated rows (see Supp. Mat-lab Code 2 for an example). After averaging repeatedexperimental conditions, we needed to find effectson characteristics between the changing parameterconditions.
Multivariate Parameter Analysis
In electrophysiology datasets, it is common to havemultiple recording or simulation parameters. Acrosstrials, parameters such as drug concentrations andstimuli magnitude vary. Especially in large datasets,unavoidable inconsistencies between values of theseparameters makes it harder to find parameter ef-fects on electrophysiological characteristics. For findingstatistically significant effects, a sufficient number ofconsistent parameter values must be identified, whichcan be achieved with multivariate analysis methods.PANDORA has functions to identify consistent values,at the same time for several parameters, and calculatestatistics from their effects on measured characteristics(see Supp. Methods A.1.8 for details and examples).Independent of the parameters, the uniform set of char-acteristics in the database also made it straightforwardto compare neuron representations to one another.
Comparing Measured Characteristics of Two Neurons
Comparing neuron representations is especially use-ful to test whether a model neuron successfully sim-ulates features of recorded neurons. The measuredcharacteristics in the database represent a neuron ina vector format, making it easy to compare the char-acteristics across neurons (see Supp. Methods A.1.10for PANDORA commands used). We use the nor-malized Euclidean distance method to calculate a dis-tance between two vector neuron representations (seeSupp. Methods A.1.9). Although these analysis meth-ods are described above in the context of the GPdataset, they can be applied to the analysis of othertypes of data.
Database Analysis of a Neuron ActivitySensor Dataset
To show how to analyze data other than the GPintracellular voltage recordings in PANDORA (seeSupp. Methods A.1.12), we applied the PANDORAmethodology to a database of 20,250,000 models of the
98 Neuroinform (2009) 7:93–111
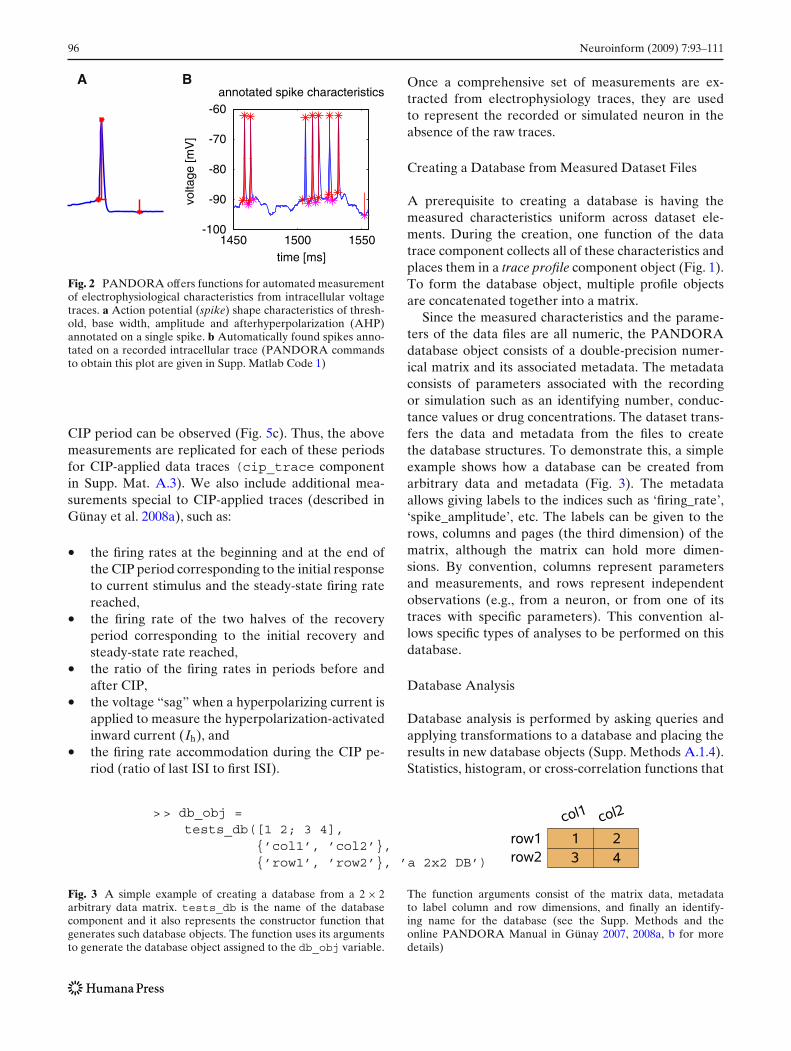
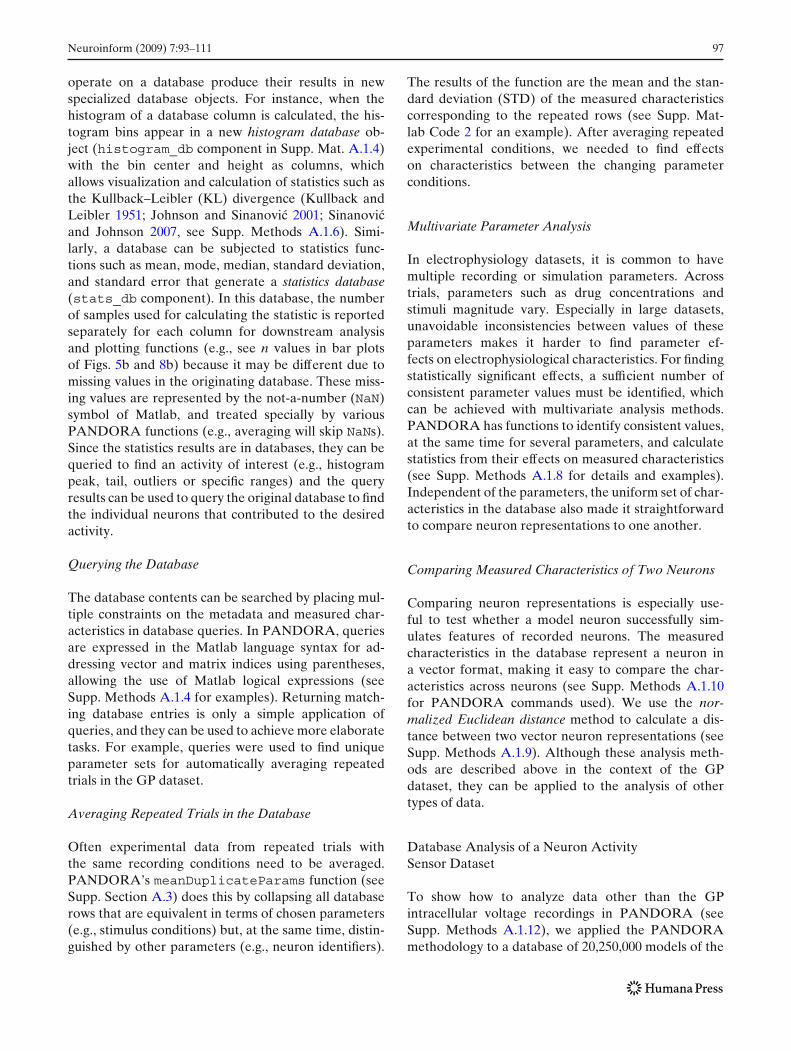
Fig. 4 Electrophysiologicalactivity of the real and modelpyloric networks of thelobster stomatogastricganglion. a Recordedfunctional network rhythmsfrom the pyloric network.(b, c) Example functional(b) and non-functional (c)activity produced by themodel pyloric networks
A B C
pyloric network in the stomatogastric ganglion (STG;Fig. 4a) of the lobster (Prinz et al. 2004). We used a newset of simulations of these models where the averagevalues of calcium-dependent activity sensors (Liu et al.1998) were saved from the model neurons in eachnetwork to create a sensor dataset (Günay et al. 2008b).In this dataset, average sensor readings from a singlemodel network represented the raw data. From the rawsensor data, we measured the separation between func-tional and non-functional network models and savedthem as characteristics in a database. These character-istics included a separation success rate obtained froman optimal linear classifier using sensor readings (seeSupp. Methods A.1.13). From the characteristics in thedatabase, this project aimed at identifying sensor para-meters that can distinguish functional network activitypatterns (Fig. 4b) from non-functional activity (Fig. 4c).
Out of the 20 million networks, we only used a 10thousand-network subset that was chosen randomly.We chose this subset because it provides a good rep-resentation of the entire dataset, which is too large toanalyze directly (Günay et al. 2008b).
Using External Storage for Large Databases
In the sensor database each network model has threemodel neurons with 366 sensors with different pa-rameters, which makes the database especially large.Therefore, to store the bulk of the data we used anexternal MySQL (MySQL AB, Uppsala, Sweden) data-base. Manageable chunks of 10,000–250,000 networksfrom this database was transferred to PANDORA foranalysis. Next, we describe the specific advantages ofthe PANDORA database analysis approach, startingwith the analysis done on the GP dataset.
Results
In Günay et al. (2008a), we considered a large modelneuron database for matching the experimentally ob-served variability in rat globus pallidus (GP) neurons,and we showed that models matching recordings couldbe found efficiently by PANDORA (Fig. 5 showsthat the distributions of model neuron characteristics,
A B C
0 20 400
5000
10000
spont. rate [Hz]
mod
el c
ount
50 100AP amp. [mV]
0 5AP width [ms]
0
5
10
neur
on c
ount
1 20
5
10
15
20
25
n=144
n=100602
spon
t firi
ng r
ate
1 20
20
40
60
80
n=144n=89766
spik
e am
plitu
de
1 20
1
2
3n=144
n=89104
spik
e w
idth
0 1 2 3
- 500
50
0 1 2 3 5 10
- 50
0
50
time [ms]
- 50
0
50
volta
ge [m
V]
+100 pA - 100 pA
- 50
0
502nd pulse spike
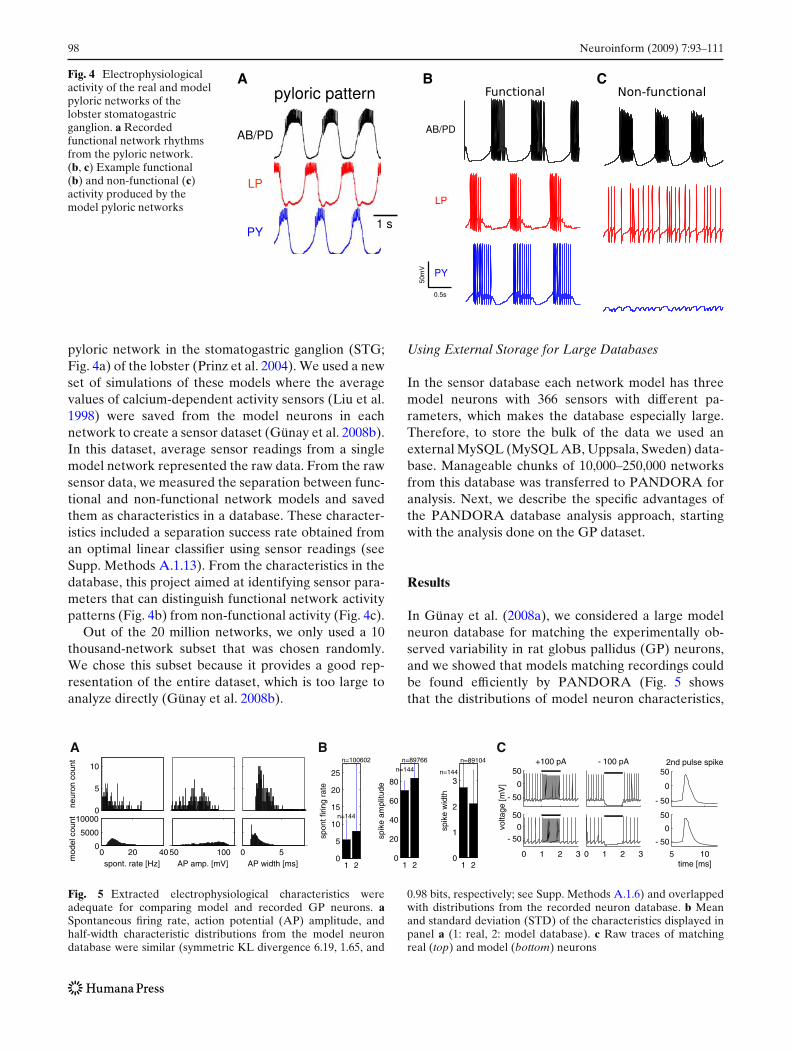
Fig. 5 Extracted electrophysiological characteristics wereadequate for comparing model and recorded GP neurons. aSpontaneous firing rate, action potential (AP) amplitude, andhalf-width characteristic distributions from the model neurondatabase were similar (symmetric KL divergence 6.19, 1.65, and
0.98 bits, respectively; see Supp. Methods A.1.6) and overlappedwith distributions from the recorded neuron database. b Meanand standard deviation (STD) of the characteristics displayed inpanel a (1: real, 2: model database). c Raw traces of matchingreal (top) and model (bottom) neurons

Neuroinform (2009) 7:93–111 99
obtained only with conductance variations, are highlysimilar to that of recorded neurons). Here, we showin more detail the use of PANDORA in addressingthis and similar problems that require database studiesof electrophysiological recordings and simulations. Inthe subsequent sections, we show the advantage ofconstructing databases of extracted electrophysiolog-ical characteristics (such as spike times, spike shapeinformation, and firing rates) rather than directly usingthe raw data traces from real and model GP neurons,and how these resulting databases of extracted char-acteristics can easily be queried to find interesting fea-tures of the neurons. Then, to establish the advantageof an automated technique over manual analysis ofdata, we demonstrate more practical uses of the data-base for routine maintenance of GP neural data suchas averaging redundant recording trials. The databaseapproach is useful for more complex parameter analysisthat is often needed for understanding neural data. Thefollowing section describes the multivariate analysisperformed in PANDORA to find the effects of phar-macological block experiments in GP recordings andmatching model manipulations in the nine conductanceparameters. Furthermore, our approach to extract thesame characteristics from recorded and simulated neu-rons enabled their direct comparison, thus allowing usto better analyze parallels between model and real GPneurons. In the following section, we describe how tofind models with different conductance densities thatbest match different recorded GP neurons and de-scribe their natural variability. Finally, to show that thePANDORA analysis techniques can be applied to stud-ies on datasets other than these GP neuron databases,we describe the database analysis to study a lobsterstomatogastric ganglion neuronal network model in thefinal results section (Günay et al. 2008b). This studyconcerns 20 million instances of the network model andaims to find activity sensors that work best for sepa-ration of functional network activity patterns (Fig. 12shows that activity sensors with inactivating variablesperformed better in these model networks).
Constructing a Database of ExtractedElectrophysiological Characteristics was Efficient
Especially with large datasets (Prinz et al. 2003, 2004;Calin-Jageman et al. 2007; Günay et al. 2008a), it be-comes difficult to store, search, and process the rawdata quickly and efficiently for answering specific ques-tions. Questions can be answered much faster if char-acteristics (such as firing rate) that pertain to the targetquestions are extracted and placed in a more compactdatabase format. Once interesting entries are found
among the characteristics in the database, the raw datacan be consulted again for validation, visualization,and further analysis. To access the raw data associatedwith the results found, a database must also containthe recording or simulation parameters as metadata(e.g., an identifying label, current stimulation ampli-tude, physiological blocker concentration, etc.).
In Günay et al. (2008a), constructing such a data-base of extracted electrophysiological characteristicsproved to be an efficient way to examine the overalldistributions of electrophysiological data. The char-acteristics were extracted from 146 neurons recordedfrom the rat globus pallidus (GP) and from 100,602model GP neurons. Characteristics, including for ex-ample firing rate, spike width and amplitude, andafterhyperpolarization depth before, during and af-ter stimulation (see “Methods”), were extracted fromvoltage traces recorded in current-clamp mode (see“Methods”, Fig. 5c). The extracted databases improvedthe efficiency of the analysis by reducing the amountof data to be accessed: (1) the disk space occupiedby the raw data was reduced from 2.4 gigabytes to357 kilobytes for the recorded neuron database—areduction of about four orders of magnitude; (2) andthe simulation data was reduced from 6.8 gigabytes,in compressed form, to 109 megabytes in the databaseformat. These databases of extracted characteristicswere not intended to replace the raw data, but ratherto complement it.
After constructing these two databases, we com-pared them to judge the quality of the model neuronsin representing the recorded biological neurons (Fig. 5).Comparing the histograms representing the character-istic distributions of from both databases indicated thatthe varying conductance densities in the models canexplain the natural variability found in GP neurons(Fig. 5a). Statistics of these characteristics offered asummary of comparison between the two databases(Fig. 5b). Highly similar recorded and model neuronscould be found in the databases by using the queryingcapabilities of PANDORA (Fig. 5c).
The Database Can be Queried in Matlab for FindingSpecific Neuronal Phenomena
An important advantage of using database-supportedanalysis is that we can query the data easily. For in-stance, in the GP recording database, the bias currentapplied to maintain recording quality was varied acrosstrials from the same cell. To be consistent across trials,results from recordings with excessive bias currents hadto be removed before interpreting the data. A single,simple PANDORA query composed of Matlab logical
100 Neuroinform (2009) 7:93–111
A
-1.5 -1 -0.5 00
1000
2000
125- 250 S/m2 levels of NaF
Δ half width [ms]
Cou
nt
6 8 10 12 14- 80
- 60
- 40
- 20
0
20
Effect of NaF on AP half- width
time [ms]
NaF=125NaF=250
6 8 10
- 50
0
50
Small effect of NaF on halfwidth
time [ms]
volta
ge [m
v]
NaF=125
NaF=250
B C
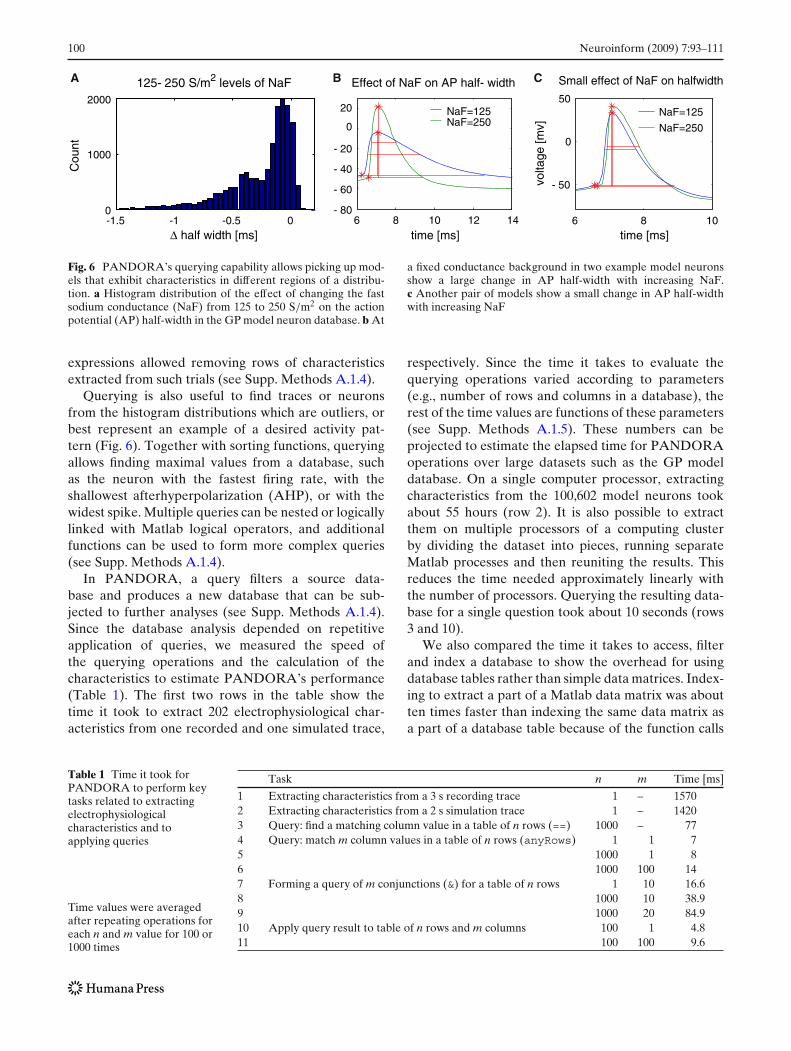
Fig. 6 PANDORA’s querying capability allows picking up mod-els that exhibit characteristics in different regions of a distribu-tion. a Histogram distribution of the effect of changing the fastsodium conductance (NaF) from 125 to 250 S/m2 on the actionpotential (AP) half-width in the GP model neuron database. b At
a fixed conductance background in two example model neuronsshow a large change in AP half-width with increasing NaF.c Another pair of models show a small change in AP half-widthwith increasing NaF
expressions allowed removing rows of characteristicsextracted from such trials (see Supp. Methods A.1.4).
Querying is also useful to find traces or neuronsfrom the histogram distributions which are outliers, orbest represent an example of a desired activity pat-tern (Fig. 6). Together with sorting functions, queryingallows finding maximal values from a database, suchas the neuron with the fastest firing rate, with theshallowest afterhyperpolarization (AHP), or with thewidest spike. Multiple queries can be nested or logicallylinked with Matlab logical operators, and additionalfunctions can be used to form more complex queries(see Supp. Methods A.1.4).
In PANDORA, a query filters a source data-base and produces a new database that can be sub-jected to further analyses (see Supp. Methods A.1.4).Since the database analysis depended on repetitiveapplication of queries, we measured the speed ofthe querying operations and the calculation of thecharacteristics to estimate PANDORA’s performance(Table 1). The first two rows in the table show thetime it took to extract 202 electrophysiological char-acteristics from one recorded and one simulated trace,
respectively. Since the time it takes to evaluate thequerying operations varied according to parameters(e.g., number of rows and columns in a database), therest of the time values are functions of these parameters(see Supp. Methods A.1.5). These numbers can beprojected to estimate the elapsed time for PANDORAoperations over large datasets such as the GP modeldatabase. On a single computer processor, extractingcharacteristics from the 100,602 model neurons tookabout 55 hours (row 2). It is also possible to extractthem on multiple processors of a computing clusterby dividing the dataset into pieces, running separateMatlab processes and then reuniting the results. Thisreduces the time needed approximately linearly withthe number of processors. Querying the resulting data-base for a single question took about 10 seconds (rows3 and 10).
We also compared the time it takes to access, filterand index a database to show the overhead for usingdatabase tables rather than simple data matrices. Index-ing to extract a part of a Matlab data matrix was aboutten times faster than indexing the same data matrix asa part of a database table because of the function calls
Table 1 Time it took forPANDORA to perform keytasks related to extractingelectrophysiologicalcharacteristics and toapplying queries
Time values were averagedafter repeating operations foreach n and m value for 100 or1000 times
Task n m Time [ms]
1 Extracting characteristics from a 3 s recording trace 1 – 15702 Extracting characteristics from a 2 s simulation trace 1 – 14203 Query: find a matching column value in a table of n rows (==) 1000 – 774 Query: match m column values in a table of n rows (anyRows) 1 1 75 1000 1 86 1000 100 147 Forming a query of m conjunctions (&) for a table of n rows 1 10 16.68 1000 10 38.99 1000 20 84.910 Apply query result to table of n rows and m columns 100 1 4.811 100 100 9.6
Neuroinform (2009) 7:93–111 101
Table 2 Comparison of thetime it took between dataindexing operations in Matlabstructures versus withPANDORA structures
For commands involved inthese operations, seeSupp. Methods A.1.5. Timevalues were averaged afterrepeating operations for eachn and m value for 1000 times
For n rows and m columns Time [ms]
n = 10 n = 100 n = 100m = 1 m = 1 m = 10
1 Numerically index a data matrix 0.017 0.019 0.0222 Numerically index a DB’s data matrix 0.136 0.141 0.1413 Numerically index DB to create new DB 0.418 0.418 0.8214 Overloaded numerically index DB 0.472 0.473 0.879
to create new DB5 Symbolically index DB to create new DB 1.652 1.657 11.2516 Overloaded symbolically index DB 1.717 1.717 11.333
to create new DB
involved (Table 2, compare row 1 to 2). However, theoverhead generated by the function calls happen oncefor each indexing operation since the duration did notsignificantly increase with more data items (comparedifferent n and m values on row 2). Filtering the sameportion of a database table to produce a new tablewas another four times slower because of the timeneeded to maintain the metadata (compare row 2 to 3).Because column names appear in the metadata, thetime it took to create a new table was also proportionalto the number of columns involved (row 3, comparem = 1 to m = 10), but a large number of rows can beindexed without penalty (compare n = 10 to n = 100).Using the overloaded parenthesis operators for index-ing (see Supp. Methods A.1.5) only slightly increasedprocessing time (compare row 3 to 4). A significantperformance penalty appeared when using symboliccolumn names rather than numeric identifiers (rows 5and 6), which again was independent of the numberof rows indexed. These results show that some of theroutine filtering, indexing and querying operations inPANDORA are slightly slower compared to similaroperations in Matlab, but they take reasonable times
considering the convenience of providing the meta-data that allow using symbolic row and column names.When this convenience is unnecessary, one can operateon the data matrix of the database directly to gainspeed (line 1; see Supp. Methods A.1.5 for commandsinvolved).
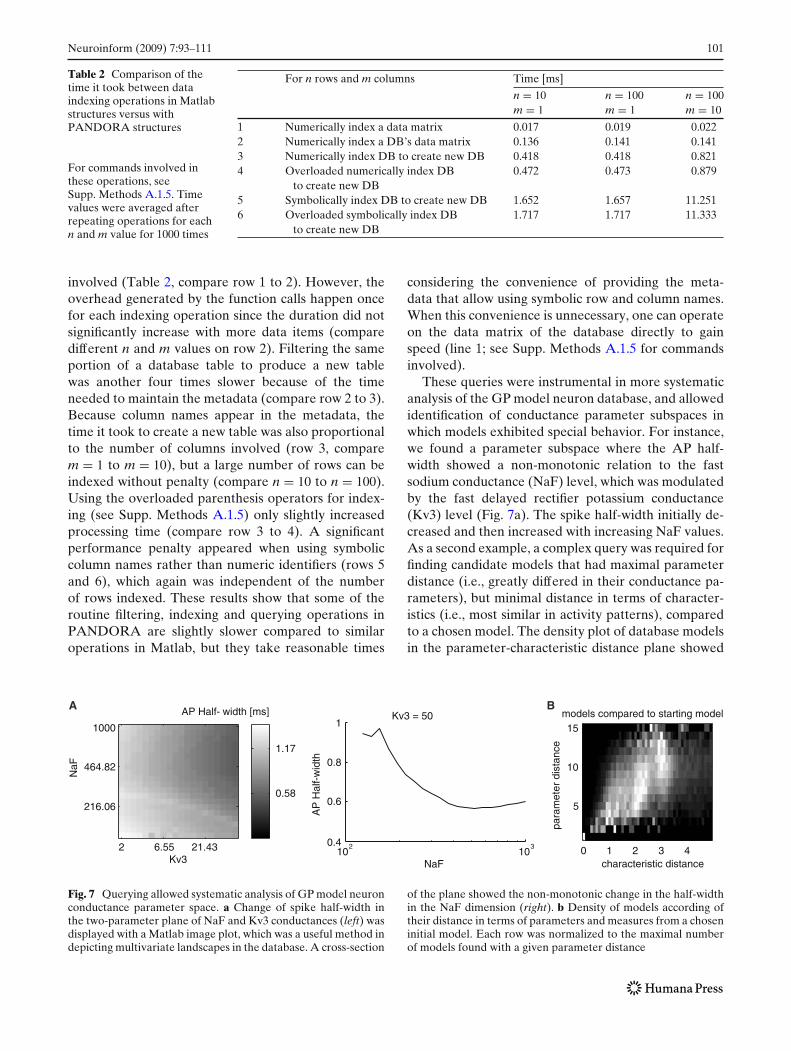
These queries were instrumental in more systematicanalysis of the GP model neuron database, and allowedidentification of conductance parameter subspaces inwhich models exhibited special behavior. For instance,we found a parameter subspace where the AP half-width showed a non-monotonic relation to the fastsodium conductance (NaF) level, which was modulatedby the fast delayed rectifier potassium conductance(Kv3) level (Fig. 7a). The spike half-width initially de-creased and then increased with increasing NaF values.As a second example, a complex query was required forfinding candidate models that had maximal parameterdistance (i.e., greatly differed in their conductance pa-rameters), but minimal distance in terms of character-istics (i.e., most similar in activity patterns), comparedto a chosen model. The density plot of database modelsin the parameter-characteristic distance plane showed
BA
characteristic distance
para
met
er d
ista
nce
models compared to starting model
0 1 2 3 4
5
10
15
Kv3
NaF
AP Half- width [ms]
2 6.55 21.43
1000
464.82
216.060.58
1.17
0.4
0.6
0.8
1
102
103
NaF
AP
Hal
f-w
idth
Kv3 = 50
Fig. 7 Querying allowed systematic analysis of GP model neuronconductance parameter space. a Change of spike half-width inthe two-parameter plane of NaF and Kv3 conductances (left) wasdisplayed with a Matlab image plot, which was a useful method indepicting multivariate landscapes in the database. A cross-section
of the plane showed the non-monotonic change in the half-widthin the NaF dimension (right). b Density of models according oftheir distance in terms of parameters and measures from a choseninitial model. Each row was normalized to the maximal numberof models found with a given parameter distance
102 Neuroinform (2009) 7:93–111
how such a model could be found (Fig. 7b). This re-sult from a multi-compartmental GP model neuron ofthe rat (Günay et al. 2008a) fortified previous findingsfrom invertebrates showing that neuron models withdisparate parameters can exhibit similar activity (Prinzet al. 2004). The database format also enabled automat-ing routine maintenance operations on neural data.
Automatically Averaging Redundant Trialsin the Database
Electrophysiological data sometimes needs to be ana-lyzed at different levels of abstraction. On a fine scale,multiple traces collected from one neuron must bedisplayed and analyzed, and on a coarse scale, one mustlook at a summary information from each neuron to un-derstand effects across neurons. PANDORA routinesthat allow us to sift, average and collapse parameterdimensions were essential in switching between theselevels of abstraction. These routines worked on meta-data that identify one trace or neuron from another.These metadata can be pharmacological treatmentsapplied, stimulation parameters and identifying valuesfor recordings, or model parameters and other similaridentifying values for simulations.
In the above study comparing GP neurons to models,each row in the real neuron database contained resultsfrom one experimental trial with specific stimulus para-meters, and therefore each neuron was represented bymultiple rows. This initial database was informative tofind ranges of activity characteristics, but it containedan unequal number of rows for each stimulus condition
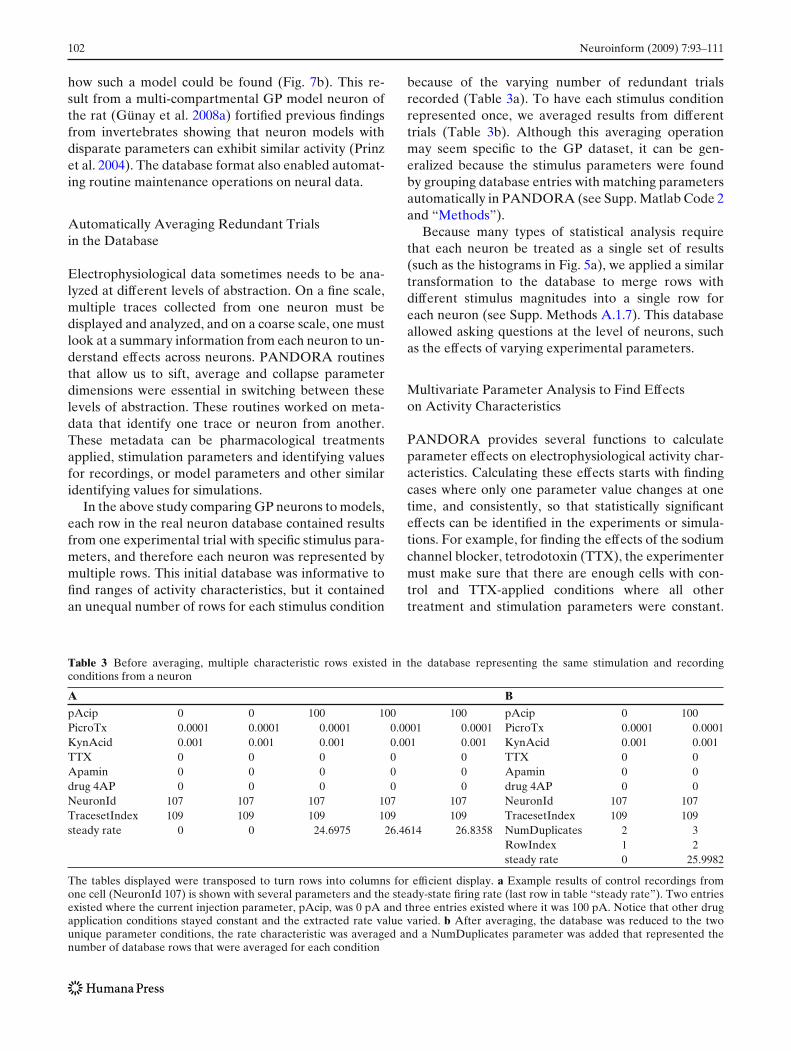
because of the varying number of redundant trialsrecorded (Table 3a). To have each stimulus conditionrepresented once, we averaged results from differenttrials (Table 3b). Although this averaging operationmay seem specific to the GP dataset, it can be gen-eralized because the stimulus parameters were foundby grouping database entries with matching parametersautomatically in PANDORA (see Supp. Matlab Code 2and “Methods”).
Because many types of statistical analysis requirethat each neuron be treated as a single set of results(such as the histograms in Fig. 5a), we applied a similartransformation to the database to merge rows withdifferent stimulus magnitudes into a single row foreach neuron (see Supp. Methods A.1.7). This databaseallowed asking questions at the level of neurons, suchas the effects of varying experimental parameters.
Multivariate Parameter Analysis to Find Effectson Activity Characteristics
PANDORA provides several functions to calculateparameter effects on electrophysiological activity char-acteristics. Calculating these effects starts with findingcases where only one parameter value changes at onetime, and consistently, so that statistically significanteffects can be identified in the experiments or simula-tions. For example, for finding the effects of the sodiumchannel blocker, tetrodotoxin (TTX), the experimentermust make sure that there are enough cells with con-trol and TTX-applied conditions where all othertreatment and stimulation parameters were constant.
Table 3 Before averaging, multiple characteristic rows existed in the database representing the same stimulation and recordingconditions from a neuron
A B
pAcip 0 0 100 100 100 pAcip 0 100PicroTx 0.0001 0.0001 0.0001 0.0001 0.0001 PicroTx 0.0001 0.0001KynAcid 0.001 0.001 0.001 0.001 0.001 KynAcid 0.001 0.001TTX 0 0 0 0 0 TTX 0 0Apamin 0 0 0 0 0 Apamin 0 0drug 4AP 0 0 0 0 0 drug 4AP 0 0NeuronId 107 107 107 107 107 NeuronId 107 107TracesetIndex 109 109 109 109 109 TracesetIndex 109 109steady rate 0 0 24.6975 26.4614 26.8358 NumDuplicates 2 3
RowIndex 1 2steady rate 0 25.9982
The tables displayed were transposed to turn rows into columns for efficient display. a Example results of control recordings fromone cell (NeuronId 107) is shown with several parameters and the steady-state firing rate (last row in table “steady rate”). Two entriesexisted where the current injection parameter, pAcip, was 0 pA and three entries existed where it was 100 pA. Notice that other drugapplication conditions stayed constant and the extracted rate value varied. b After averaging, the database was reduced to the twounique parameter conditions, the rate characteristic was averaged and a NumDuplicates parameter was added that represented thenumber of database rows that were averaged for each condition
Neuroinform (2009) 7:93–111 103
Table 4 Pharmacological treatment parameters and one rate characteristic of four TTX-treated cells selected from a subset of the GPrecording database
PicroTx 0.0001 0.0001 0.0001 0.0001 0.0001 0.0001 0.0001 0.0001 0.0001 0.0001KynAcid 0.001 0.001 0.001 0.001 0.001 0.001 0.001 0.001 0.001 0.001TTX 0 7e − 09 0 7e − 09 0 7e − 09 1.5e − 08 0 0 1e − 08Apamin 0 0 0 0 0 0 0 0 0 0drug 4AP 0 0 0 0 0 0 0 0 1e − 04 1e − 04NeuronId 107 107 108 108 110 110 110 159 159 159TracesetIndex 109 110 111 112 114 115 116 NaN NaN NaND100pA steady rate 25.9982 19.6056 29.9673 22.7628 23.8443 20.9744 13.3892 20.1947 11.8999 12.6017
Conditions applied to a cell can be distinguished by common NeuronId parameter values. Three different TTX concentrations 7, 10and 15 nM were used variably in these experiments. Notice that the TTX effect on neuron n159 could only be discerned in parameterbackgrounds where the potassium channel blocker, 4AP, was present
PANDORA offers functions to sort the data to identifytraces meeting these conditions and to correctly treatthe missing values (see “Methods”).
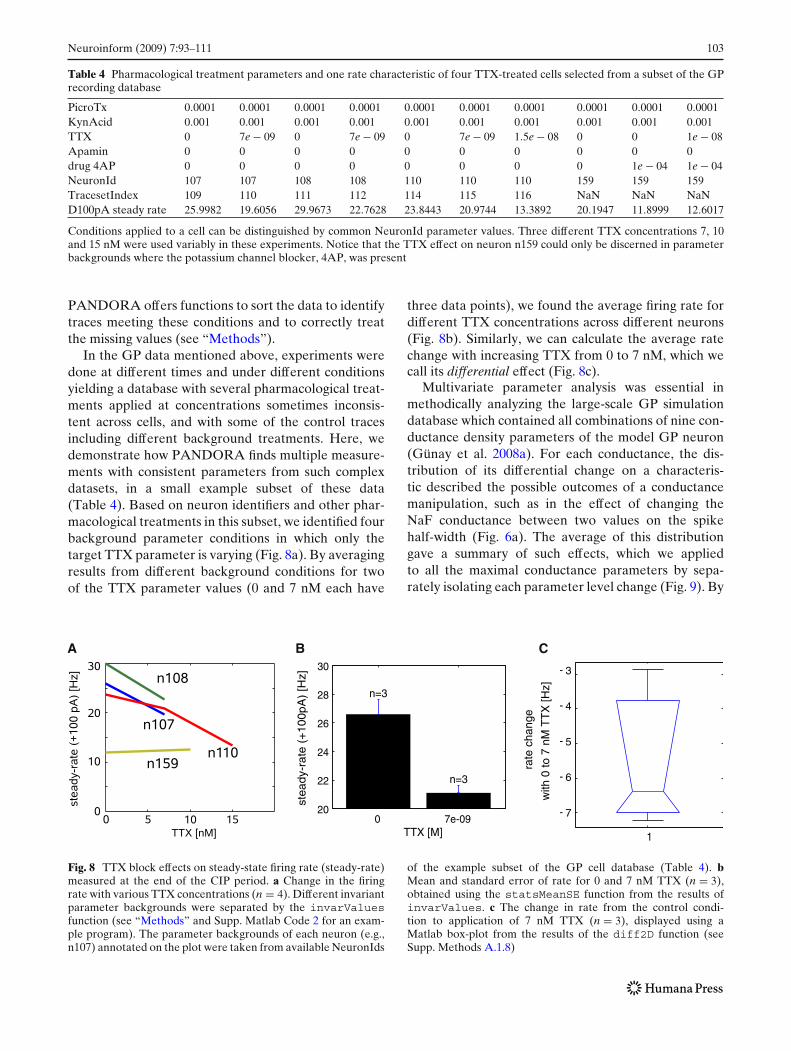
In the GP data mentioned above, experiments weredone at different times and under different conditionsyielding a database with several pharmacological treat-ments applied at concentrations sometimes inconsis-tent across cells, and with some of the control tracesincluding different background treatments. Here, wedemonstrate how PANDORA finds multiple measure-ments with consistent parameters from such complexdatasets, in a small example subset of these data(Table 4). Based on neuron identifiers and other phar-macological treatments in this subset, we identified fourbackground parameter conditions in which only thetarget TTX parameter is varying (Fig. 8a). By averagingresults from different background conditions for twoof the TTX parameter values (0 and 7 nM each have
three data points), we found the average firing rate fordifferent TTX concentrations across different neurons(Fig. 8b). Similarly, we can calculate the average ratechange with increasing TTX from 0 to 7 nM, which wecall its differential effect (Fig. 8c).
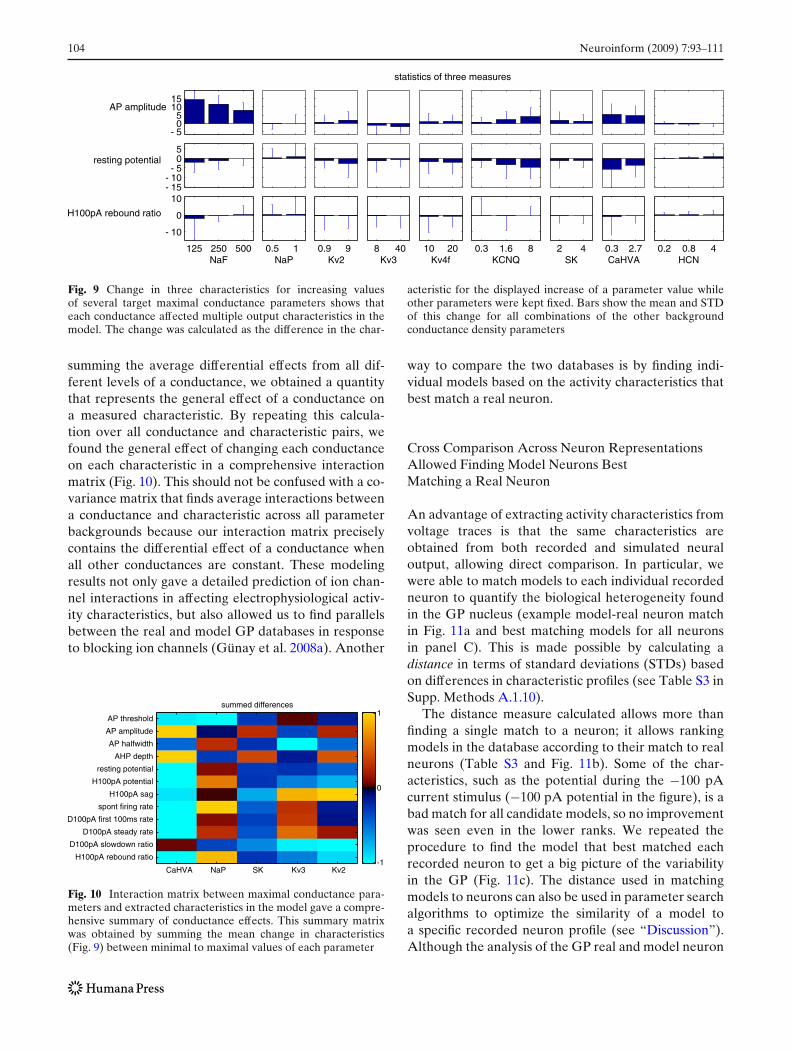
Multivariate parameter analysis was essential inmethodically analyzing the large-scale GP simulationdatabase which contained all combinations of nine con-ductance density parameters of the model GP neuron(Günay et al. 2008a). For each conductance, the dis-tribution of its differential change on a characteris-tic described the possible outcomes of a conductancemanipulation, such as in the effect of changing theNaF conductance between two values on the spikehalf-width (Fig. 6a). The average of this distributiongave a summary of such effects, which we appliedto all the maximal conductance parameters by sepa-rately isolating each parameter level change (Fig. 9). By
A
0 7e-0920
22
24
26
28
30
n=3
n=3
TTX [M]
stea
dy-r
ate
(+10
0pA
) [H
z]
1
- 7
- 6
- 5
- 4
- 3
rat
e ch
ange
with
0 to
7 n
M T
TX
[Hz]
B C
Fig. 8 TTX block effects on steady-state firing rate (steady-rate)measured at the end of the CIP period. a Change in the firingrate with various TTX concentrations (n = 4). Different invariantparameter backgrounds were separated by the invarValuesfunction (see “Methods” and Supp. Matlab Code 2 for an exam-ple program). The parameter backgrounds of each neuron (e.g.,n107) annotated on the plot were taken from available NeuronIds
of the example subset of the GP cell database (Table 4). bMean and standard error of rate for 0 and 7 nM TTX (n = 3),obtained using the statsMeanSE function from the results ofinvarValues. c The change in rate from the control condi-tion to application of 7 nM TTX (n = 3), displayed using aMatlab box-plot from the results of the diff2D function (seeSupp. Methods A.1.8)
104 Neuroinform (2009) 7:93–111
statistics of three measures
125 250 500
- 10
0
10
NaF
H100pA rebound ratio
0.5 1NaP
0.9 9Kv2
8 40Kv3
10 20Kv4f
0.3 1.6 8KCNQ
2 4SK
0.3 2.7CaHVA
0.2 0.8 4HCN
- 15- 10
- 505
resting potential
- 505
1015
AP amplitude
Fig. 9 Change in three characteristics for increasing valuesof several target maximal conductance parameters shows thateach conductance affected multiple output characteristics in themodel. The change was calculated as the difference in the char-
acteristic for the displayed increase of a parameter value whileother parameters were kept fixed. Bars show the mean and STDof this change for all combinations of the other backgroundconductance density parameters
summing the average differential effects from all dif-ferent levels of a conductance, we obtained a quantitythat represents the general effect of a conductance ona measured characteristic. By repeating this calcula-tion over all conductance and characteristic pairs, wefound the general effect of changing each conductanceon each characteristic in a comprehensive interactionmatrix (Fig. 10). This should not be confused with a co-variance matrix that finds average interactions betweena conductance and characteristic across all parameterbackgrounds because our interaction matrix preciselycontains the differential effect of a conductance whenall other conductances are constant. These modelingresults not only gave a detailed prediction of ion chan-nel interactions in affecting electrophysiological activ-ity characteristics, but also allowed us to find parallelsbetween the real and model GP databases in responseto blocking ion channels (Günay et al. 2008a). Another
summed differences
CaHVA NaP SK Kv3 Kv2
AP threshold
AP amplitude
AP halfwidth
AHP depth
resting potential
H100pA potential
H100pA sag
spont firing rate
D100pA first 100ms rate
D100pA steady rate
D100pA slowdown ratio
H100pA rebound ratio-1
0
1
Fig. 10 Interaction matrix between maximal conductance para-meters and extracted characteristics in the model gave a compre-hensive summary of conductance effects. This summary matrixwas obtained by summing the mean change in characteristics(Fig. 9) between minimal to maximal values of each parameter
way to compare the two databases is by finding indi-vidual models based on the activity characteristics thatbest match a real neuron.
Cross Comparison Across Neuron RepresentationsAllowed Finding Model Neurons BestMatching a Real Neuron
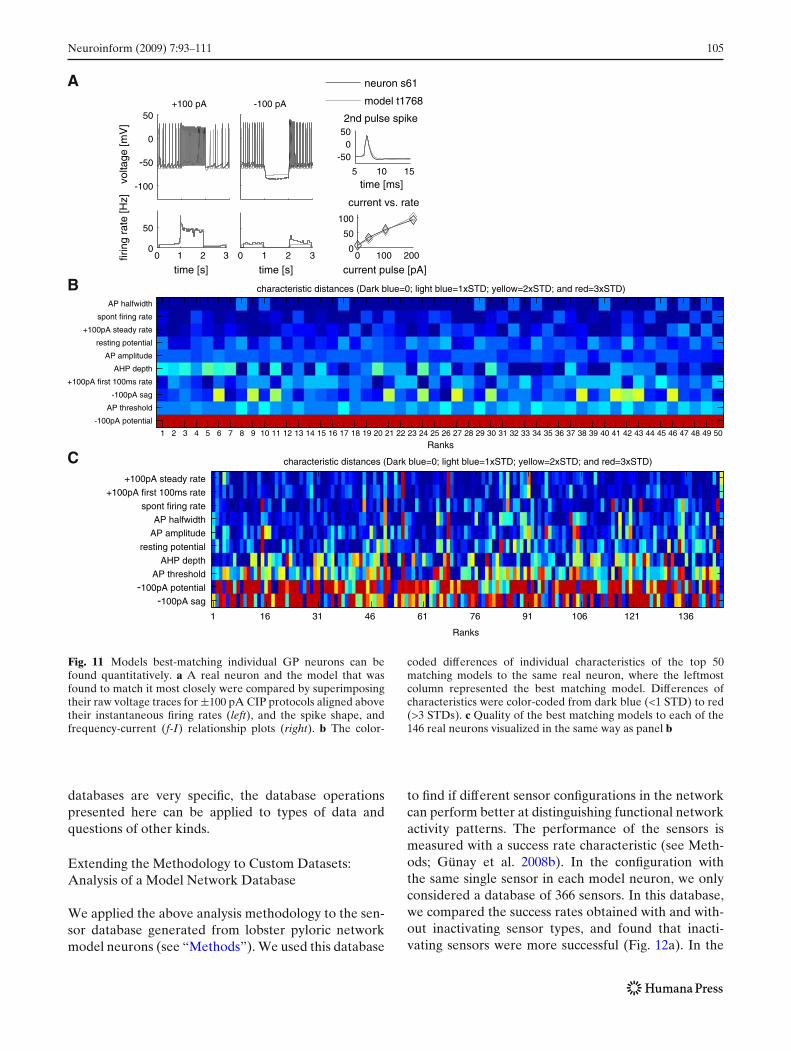
An advantage of extracting activity characteristics fromvoltage traces is that the same characteristics areobtained from both recorded and simulated neuraloutput, allowing direct comparison. In particular, wewere able to match models to each individual recordedneuron to quantify the biological heterogeneity foundin the GP nucleus (example model-real neuron matchin Fig. 11a and best matching models for all neuronsin panel C). This is made possible by calculating adistance in terms of standard deviations (STDs) basedon differences in characteristic profiles (see Table S3 inSupp. Methods A.1.10).
The distance measure calculated allows more thanfinding a single match to a neuron; it allows rankingmodels in the database according to their match to realneurons (Table S3 and Fig. 11b). Some of the char-acteristics, such as the potential during the −100 pAcurrent stimulus (−100 pA potential in the figure), is abad match for all candidate models, so no improvementwas seen even in the lower ranks. We repeated theprocedure to find the model that best matched eachrecorded neuron to get a big picture of the variabilityin the GP (Fig. 11c). The distance used in matchingmodels to neurons can also be used in parameter searchalgorithms to optimize the similarity of a model toa specific recorded neuron profile (see “Discussion”).Although the analysis of the GP real and model neuron
Neuroinform (2009) 7:93–111 105
A+100 pA
0 1 2 30
50
time [s]
firin
g ra
te [H
z]
-100
-50
0
50vo
ltage
[mV
]
-100 pA
0 1 2 3
time [s]
neuron s61
model t1768
0 100 2000
50
100
current pulse [pA]
current vs. rate
5 10 15
-500
50
time [ms]
2nd pulse spike
B characteristic distances (Dark blue=0; light blue=1xSTD; yellow=2xSTD; and red=3xSTD)
Ranks1 2 3 4 5 6 7 8 9 10 11 12 13 14 15 16 17 18 19 20 21 22 23 24 25 26 27 28 29 30 31 32 33 34 35 36 37 38 39 40 41 42 43 44 45 46 47 48 49 50
AP halfwidth
spont firing rate
+100pA steady rate
resting potential
AP amplitude
AHP depth
+100pA first 100ms rate
-100pA sag
AP threshold
-100pA potential
C characteristic distances (Dark blue=0; light blue=1xSTD; yellow=2xSTD; and red=3xSTD)
Ranks
1 16 31 46 61 76 91 106 121 136
+100pA steady rate
+100pA first 100ms rate
spont firing rate
AP halfwidth
AP amplitude
resting potential
AHP depth
AP threshold
-100pA potential
-100pA sag
Fig. 11 Models best-matching individual GP neurons can befound quantitatively. a A real neuron and the model that wasfound to match it most closely were compared by superimposingtheir raw voltage traces for ±100 pA CIP protocols aligned abovetheir instantaneous firing rates (left), and the spike shape, andfrequency-current (f-I) relationship plots (right). b The color-
coded differences of individual characteristics of the top 50matching models to the same real neuron, where the leftmostcolumn represented the best matching model. Differences ofcharacteristics were color-coded from dark blue (<1 STD) to red(>3 STDs). c Quality of the best matching models to each of the146 real neurons visualized in the same way as panel b
databases are very specific, the database operationspresented here can be applied to types of data andquestions of other kinds.
Extending the Methodology to Custom Datasets:Analysis of a Model Network Database
We applied the above analysis methodology to the sen-sor database generated from lobster pyloric networkmodel neurons (see “Methods”). We used this database
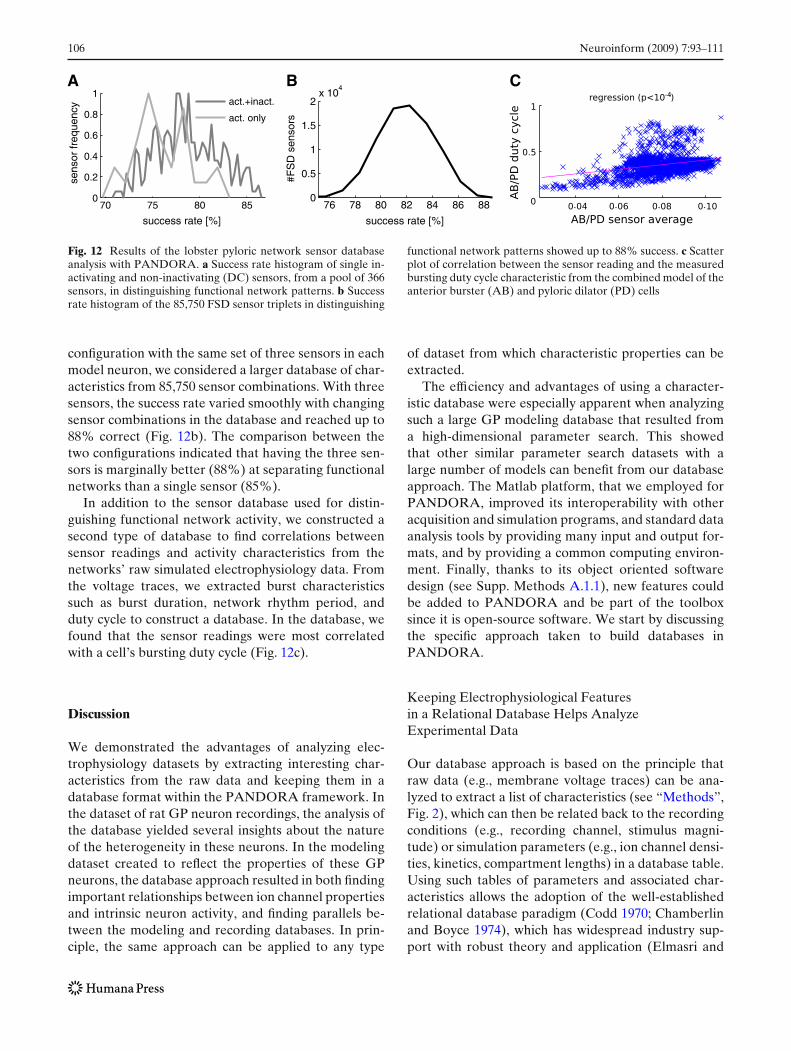
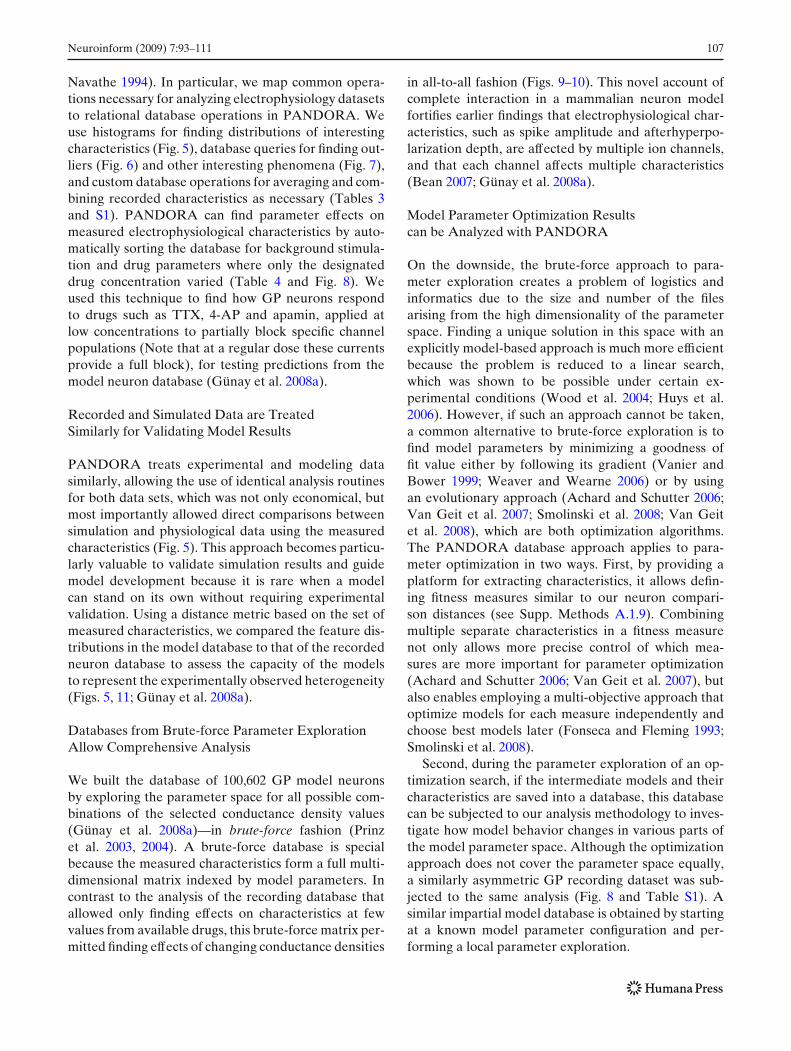
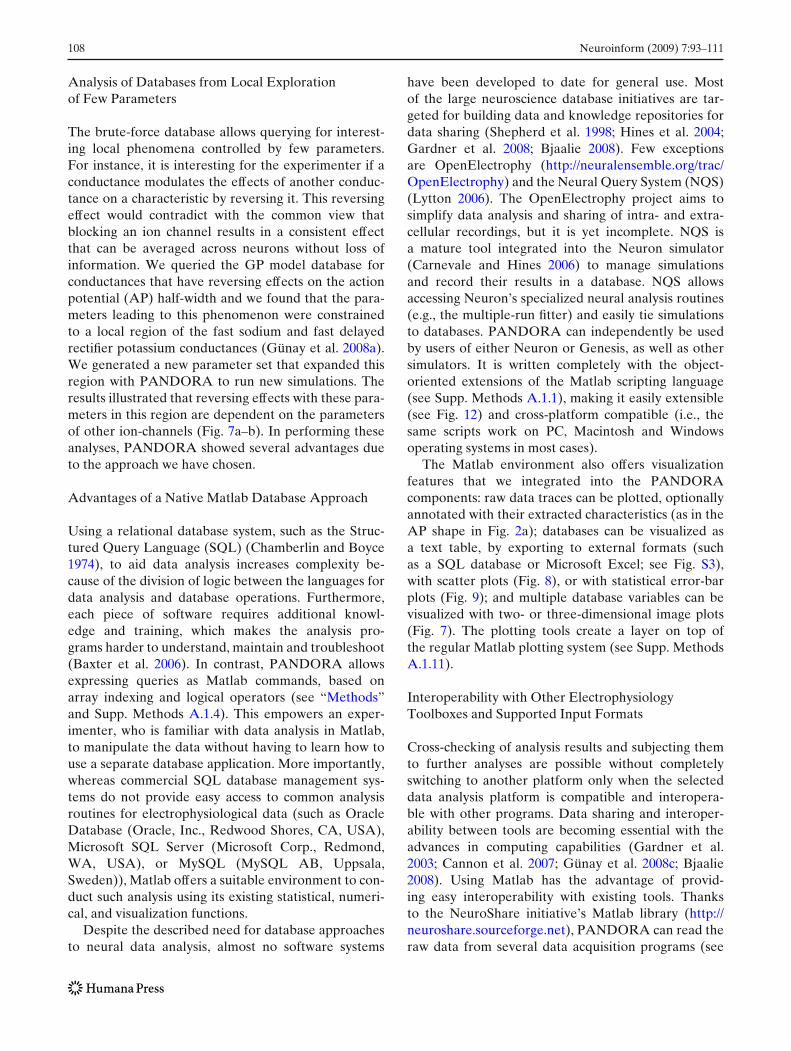
to find if different sensor configurations in the networkcan perform better at distinguishing functional networkactivity patterns. The performance of the sensors ismeasured with a success rate characteristic (see Meth-ods; Günay et al. 2008b). In the configuration withthe same single sensor in each model neuron, we onlyconsidered a database of 366 sensors. In this database,we compared the success rates obtained with and with-out inactivating sensor types, and found that inacti-vating sensors were more successful (Fig. 12a). In the
106 Neuroinform (2009) 7:93–111
70 75 80 850
0.2
0.4
0.6
0.8
1
success rate [%]
sens
or fr
eque
ncy
act.+inact.
act. only
76 78 80 82 84 86 880
0.5
1
1.5
2x 10
4
success rate [%]
#FS
D s
enso
rs
A B C
Fig. 12 Results of the lobster pyloric network sensor databaseanalysis with PANDORA. a Success rate histogram of single in-activating and non-inactivating (DC) sensors, from a pool of 366sensors, in distinguishing functional network patterns. b Successrate histogram of the 85,750 FSD sensor triplets in distinguishing
functional network patterns showed up to 88% success. c Scatterplot of correlation between the sensor reading and the measuredbursting duty cycle characteristic from the combined model of theanterior burster (AB) and pyloric dilator (PD) cells
configuration with the same set of three sensors in eachmodel neuron, we considered a larger database of char-acteristics from 85,750 sensor combinations. With threesensors, the success rate varied smoothly with changingsensor combinations in the database and reached up to88% correct (Fig. 12b). The comparison between thetwo configurations indicated that having the three sen-sors is marginally better (88%) at separating functionalnetworks than a single sensor (85%).
In addition to the sensor database used for distin-guishing functional network activity, we constructed asecond type of database to find correlations betweensensor readings and activity characteristics from thenetworks’ raw simulated electrophysiology data. Fromthe voltage traces, we extracted burst characteristicssuch as burst duration, network rhythm period, andduty cycle to construct a database. In the database, wefound that the sensor readings were most correlatedwith a cell’s bursting duty cycle (Fig. 12c).
Discussion
We demonstrated the advantages of analyzing elec-trophysiology datasets by extracting interesting char-acteristics from the raw data and keeping them in adatabase format within the PANDORA framework. Inthe dataset of rat GP neuron recordings, the analysis ofthe database yielded several insights about the natureof the heterogeneity in these neurons. In the modelingdataset created to reflect the properties of these GPneurons, the database approach resulted in both findingimportant relationships between ion channel propertiesand intrinsic neuron activity, and finding parallels be-tween the modeling and recording databases. In prin-ciple, the same approach can be applied to any type
of dataset from which characteristic properties can beextracted.
The efficiency and advantages of using a character-istic database were especially apparent when analyzingsuch a large GP modeling database that resulted froma high-dimensional parameter search. This showedthat other similar parameter search datasets with alarge number of models can benefit from our databaseapproach. The Matlab platform, that we employed forPANDORA, improved its interoperability with otheracquisition and simulation programs, and standard dataanalysis tools by providing many input and output for-mats, and by providing a common computing environ-ment. Finally, thanks to its object oriented softwaredesign (see Supp. Methods A.1.1), new features couldbe added to PANDORA and be part of the toolboxsince it is open-source software. We start by discussingthe specific approach taken to build databases inPANDORA.
Keeping Electrophysiological Featuresin a Relational Database Helps AnalyzeExperimental Data
Our database approach is based on the principle thatraw data (e.g., membrane voltage traces) can be ana-lyzed to extract a list of characteristics (see “Methods”,Fig. 2), which can then be related back to the recordingconditions (e.g., recording channel, stimulus magni-tude) or simulation parameters (e.g., ion channel densi-ties, kinetics, compartment lengths) in a database table.Using such tables of parameters and associated char-acteristics allows the adoption of the well-establishedrelational database paradigm (Codd 1970; Chamberlinand Boyce 1974), which has widespread industry sup-port with robust theory and application (Elmasri and
Neuroinform (2009) 7:93–111 107
Navathe 1994). In particular, we map common opera-tions necessary for analyzing electrophysiology datasetsto relational database operations in PANDORA. Weuse histograms for finding distributions of interestingcharacteristics (Fig. 5), database queries for finding out-liers (Fig. 6) and other interesting phenomena (Fig. 7),and custom database operations for averaging and com-bining recorded characteristics as necessary (Tables 3and S1). PANDORA can find parameter effects onmeasured electrophysiological characteristics by auto-matically sorting the database for background stimula-tion and drug parameters where only the designateddrug concentration varied (Table 4 and Fig. 8). Weused this technique to find how GP neurons respondto drugs such as TTX, 4-AP and apamin, applied atlow concentrations to partially block specific channelpopulations (Note that at a regular dose these currentsprovide a full block), for testing predictions from themodel neuron database (Günay et al. 2008a).
Recorded and Simulated Data are TreatedSimilarly for Validating Model Results
PANDORA treats experimental and modeling datasimilarly, allowing the use of identical analysis routinesfor both data sets, which was not only economical, butmost importantly allowed direct comparisons betweensimulation and physiological data using the measuredcharacteristics (Fig. 5). This approach becomes particu-larly valuable to validate simulation results and guidemodel development because it is rare when a modelcan stand on its own without requiring experimentalvalidation. Using a distance metric based on the set ofmeasured characteristics, we compared the feature dis-tributions in the model database to that of the recordedneuron database to assess the capacity of the modelsto represent the experimentally observed heterogeneity(Figs. 5, 11; Günay et al. 2008a).
Databases from Brute-force Parameter ExplorationAllow Comprehensive Analysis
We built the database of 100,602 GP model neuronsby exploring the parameter space for all possible com-binations of the selected conductance density values(Günay et al. 2008a)—in brute-force fashion (Prinzet al. 2003, 2004). A brute-force database is specialbecause the measured characteristics form a full multi-dimensional matrix indexed by model parameters. Incontrast to the analysis of the recording database thatallowed only finding effects on characteristics at fewvalues from available drugs, this brute-force matrix per-mitted finding effects of changing conductance densities
in all-to-all fashion (Figs. 9–10). This novel account ofcomplete interaction in a mammalian neuron modelfortifies earlier findings that electrophysiological char-acteristics, such as spike amplitude and afterhyperpo-larization depth, are affected by multiple ion channels,and that each channel affects multiple characteristics(Bean 2007; Günay et al. 2008a).
Model Parameter Optimization Resultscan be Analyzed with PANDORA
On the downside, the brute-force approach to para-meter exploration creates a problem of logistics andinformatics due to the size and number of the filesarising from the high dimensionality of the parameterspace. Finding a unique solution in this space with anexplicitly model-based approach is much more efficientbecause the problem is reduced to a linear search,which was shown to be possible under certain ex-perimental conditions (Wood et al. 2004; Huys et al.2006). However, if such an approach cannot be taken,a common alternative to brute-force exploration is tofind model parameters by minimizing a goodness offit value either by following its gradient (Vanier andBower 1999; Weaver and Wearne 2006) or by usingan evolutionary approach (Achard and Schutter 2006;Van Geit et al. 2007; Smolinski et al. 2008; Van Geitet al. 2008), which are both optimization algorithms.The PANDORA database approach applies to para-meter optimization in two ways. First, by providing aplatform for extracting characteristics, it allows defin-ing fitness measures similar to our neuron compari-son distances (see Supp. Methods A.1.9). Combiningmultiple separate characteristics in a fitness measurenot only allows more precise control of which mea-sures are more important for parameter optimization(Achard and Schutter 2006; Van Geit et al. 2007), butalso enables employing a multi-objective approach thatoptimize models for each measure independently andchoose best models later (Fonseca and Fleming 1993;Smolinski et al. 2008).
Second, during the parameter exploration of an op-timization search, if the intermediate models and theircharacteristics are saved into a database, this databasecan be subjected to our analysis methodology to inves-tigate how model behavior changes in various parts ofthe model parameter space. Although the optimizationapproach does not cover the parameter space equally,a similarly asymmetric GP recording dataset was sub-jected to the same analysis (Fig. 8 and Table S1). Asimilar impartial model database is obtained by startingat a known model parameter configuration and per-forming a local parameter exploration.
108 Neuroinform (2009) 7:93–111
Analysis of Databases from Local Explorationof Few Parameters
The brute-force database allows querying for interest-ing local phenomena controlled by few parameters.For instance, it is interesting for the experimenter if aconductance modulates the effects of another conduc-tance on a characteristic by reversing it. This reversingeffect would contradict with the common view thatblocking an ion channel results in a consistent effectthat can be averaged across neurons without loss ofinformation. We queried the GP model database forconductances that have reversing effects on the actionpotential (AP) half-width and we found that the para-meters leading to this phenomenon were constrainedto a local region of the fast sodium and fast delayedrectifier potassium conductances (Günay et al. 2008a).We generated a new parameter set that expanded thisregion with PANDORA to run new simulations. Theresults illustrated that reversing effects with these para-meters in this region are dependent on the parametersof other ion-channels (Fig. 7a–b). In performing theseanalyses, PANDORA showed several advantages dueto the approach we have chosen.
Advantages of a Native Matlab Database Approach
Using a relational database system, such as the Struc-tured Query Language (SQL) (Chamberlin and Boyce1974), to aid data analysis increases complexity be-cause of the division of logic between the languages fordata analysis and database operations. Furthermore,each piece of software requires additional knowl-edge and training, which makes the analysis pro-grams harder to understand, maintain and troubleshoot(Baxter et al. 2006). In contrast, PANDORA allowsexpressing queries as Matlab commands, based onarray indexing and logical operators (see “Methods”and Supp. Methods A.1.4). This empowers an exper-imenter, who is familiar with data analysis in Matlab,to manipulate the data without having to learn how touse a separate database application. More importantly,whereas commercial SQL database management sys-tems do not provide easy access to common analysisroutines for electrophysiological data (such as OracleDatabase (Oracle, Inc., Redwood Shores, CA, USA),Microsoft SQL Server (Microsoft Corp., Redmond,WA, USA), or MySQL (MySQL AB, Uppsala,Sweden)), Matlab offers a suitable environment to con-duct such analysis using its existing statistical, numeri-cal, and visualization functions.
Despite the described need for database approachesto neural data analysis, almost no software systems
have been developed to date for general use. Mostof the large neuroscience database initiatives are tar-geted for building data and knowledge repositories fordata sharing (Shepherd et al. 1998; Hines et al. 2004;Gardner et al. 2008; Bjaalie 2008). Few exceptionsare OpenElectrophy (http://neuralensemble.org/trac/OpenElectrophy) and the Neural Query System (NQS)(Lytton 2006). The OpenElectrophy project aims tosimplify data analysis and sharing of intra- and extra-cellular recordings, but it is yet incomplete. NQS isa mature tool integrated into the Neuron simulator(Carnevale and Hines 2006) to manage simulationsand record their results in a database. NQS allowsaccessing Neuron’s specialized neural analysis routines(e.g., the multiple-run fitter) and easily tie simulationsto databases. PANDORA can independently be usedby users of either Neuron or Genesis, as well as othersimulators. It is written completely with the object-oriented extensions of the Matlab scripting language(see Supp. Methods A.1.1), making it easily extensible(see Fig. 12) and cross-platform compatible (i.e., thesame scripts work on PC, Macintosh and Windowsoperating systems in most cases).
The Matlab environment also offers visualizationfeatures that we integrated into the PANDORAcomponents: raw data traces can be plotted, optionallyannotated with their extracted characteristics (as in theAP shape in Fig. 2a); databases can be visualized asa text table, by exporting to external formats (suchas a SQL database or Microsoft Excel; see Fig. S3),with scatter plots (Fig. 8), or with statistical error-barplots (Fig. 9); and multiple database variables can bevisualized with two- or three-dimensional image plots(Fig. 7). The plotting tools create a layer on top ofthe regular Matlab plotting system (see Supp. MethodsA.1.11).
Interoperability with Other ElectrophysiologyToolboxes and Supported Input Formats
Cross-checking of analysis results and subjecting themto further analyses are possible without completelyswitching to another platform only when the selecteddata analysis platform is compatible and interopera-ble with other programs. Data sharing and interoper-ability between tools are becoming essential with theadvances in computing capabilities (Gardner et al.2003; Cannon et al. 2007; Günay et al. 2008c; Bjaalie2008). Using Matlab has the advantage of provid-ing easy interoperability with existing tools. Thanksto the NeuroShare initiative’s Matlab library (http://neuroshare.sourceforge.net), PANDORA can read theraw data from several data acquisition programs (see
Neuroinform (2009) 7:93–111 109
“Methods” and Supp. Mat. A.1.3). It can also read theHierarchical Data Format (HDF5) files (http://www.hdfgroup.org). HDF5 was recently proposed as astandard for electrophysiological data (unpublishedproceedings of the Interoperability Workshop at theComputational Neuroscience Conference, Portland,Oregon, July 2008; Herz et al. 2008). In addition,PANDORA supports reading outputs of various neuralsimulators (see “Methods”).
The Matlab environment allows passing data backand forth between PANDORA and other commu-nity toolboxes for analysis of electrophysiology data,such as:
• the Chronux Toolbox (Mitra Lab, Cold Spring Har-bor Laboratory, NY) that allows frequency spec-trum and coherence analyses for time-series datafor both point and continuous processes (Brownet al. 2004; Bokil et al. 2006);
• the FIND toolbox that specializes for analyzingextracellular recordings (Meier et al. 2007, 2008;http://find.bccn.uni-freiburg.de);
• the BSMART software package that provides func-tions for multi electrode recordings (Cui et al.2008); and
• the sigTOOL package which implements a range ofwaveform and spike-train analyses on neurosciencedata (Lidierth 2009).
PANDORA differs from these toolboxes by providingdatabase support and by its specific analysis routines forintracellular electrophysiology datasets.
Matlab also offers a Database Toolbox that candirectly access an external database application with-out the need for PANDORA. It has the advantageof offering access to an optimized, industry-strengthdatabase, but brings with it the drawbacks of usingan external database application as discussed above.PANDORA can use the Matlab Database Toolboxto import and export data between external databases(see the sql_portal component in Supp. Mat. A.3).In the analysis of the activity sensor network database,we used this feature of PANDORA to read data froman external MySQL database, which allowed accessinga large amount of data that would not fit into Matlabdirectly (see “Methods” and Fig. 12).
Limitations of the Approach
It should be mentioned that PANDORA has limi-tations due to the simplified approach that we havetaken. The speed of querying operations depends on
the number of rows in a table (i.e., it takes O(n) time)because no special effort was made to improve indexing(Table 1 and Supp. Methods A.1.4). Our approach ofquerying by overloading operators within the Matlabenvironment performs slower than directly accessing amatrix, but scales well with the number of rows andcolumns accessed (see Table 2 and Supp. MethodsA.1.5). Across querying operations, the largest speedpenalty occured in maintaining the metadata that holdsthe symbolic row and column names, which should beavoided for operations that need a large number ofrepetitive queries by directly accessing the database’sdata matrix (Supp. Methods A.1.5). In terms of workingmemory requirements, the database analysis needs tomaintain one or more copies of the complete data ma-trix in memory, which limits the size of the analysis bythe computer’s physical memory. A simple workaroundto the memory requirement is to perform analysis oflarge databases in several steps with smaller databases.Another solution is using PANDORA together withan external commercial database engine that supportslarge databases with the help of the Matlab DatabaseToolbox (see above).
Future Directions
Despite its advantages, Matlab is a commercial soft-ware which hinders the free use of PANDORA. How-ever, a completely free version of PANDORA wouldneed to be created from scratch because it is notstraightforward to make PANDORA work with analternative open-source scientific analysis platform thatis Matlab-compatible. The best such alternative plat-form is GNU Octave (Eaton 2002), which uses a script-ing language similar to that of Matlab, although itscurrent version lacks Matlab’s object-oriented pro-gramming features on which PANDORA heavily de-pends. If PANDORA needs to be rewritten, the Pythonlanguage seems be a good choice because it offersefficient, open-source data analysis routines that wererecently employed by several neural simulator andanalysis tools available from the International Neuroin-formatics Coordinating Facility (INCF) Software Cen-ter (http://software.incf.org; Bjaalie and Grillner 2007).NeuroTools is one of these toolsets written in Python tomanage, store and analyze computational neurosciencesimulations (http://neuralensemble.org/). The Java lan-guage is also appealing because it was employed by theneuroConstruct simulator tool (Gleeson et al. 2007). Inan ambitious effort similar to ours, the G-node projectproposes to convert the FIND Matlab Toolbox to astandalone, open-source program (Herz et al. 2008).
110 Neuroinform (2009) 7:93–111
Information Sharing Statement
The software presented in this paper is freely availablefor download from http://software.incf.org/software/pandora/home.
Acknowledgements This project is supported by NINDS R01-NS039852 and NIMH R01-MH065634 awarded to D. Jaegerand 1 R01 NS054911-01A1 from NINDS awarded to A. Prinz.The PANDORA Toolbox includes code from Alfonso Delgado-Reyes, for which the authors are grateful. Special thanks toHoratiu Voicu, Eric Hendrickson, Robert Clewley and KellySuter for providing helpful comments and suggestions to earlierdrafts of this paper; and to Natalia Toporikova for providing testdata and testing initial versions of PANDORA. We thank bothanonymous reviewers, whose comments dramatically improvedthe manuscript and the time performance of indexing operationsin PANDORA.
References
Achard, P., & Schutter, E. D. (2006). Complex parameter land-scape for a complex neuron model. PLoS Computers inBiology, 2(7), e94. doi:10.1371/journal.pcbi.0020094.
Baxter, S. M., Day, S. W., Fetrow, J. S., & Reisinger, S. J. (2006).Scientific software development is not an oxymoron. PLoSComputers in Biology, 2, 975–978.
Bean, B. P. (2007). The action potential in mammalian centralneurons. Nature Reviews. Neuroscience, 8(6), 451–465. doi:10.1038/nrn2148.
Bjaalie, J. (2008). Understanding the brain through neuroinfor-matics. Front Neuroscience, 2(1), 19–21. doi:10.3389/neuro.01.022.2008.
Bjaalie, J. G., & Grillner, S. (2007). Global neuroinformat-ics: The international neuroinformatics coordinating facility.Journal of Neuroscience, 27(14), 3613–3615. doi:10.1523/jneurosci.0558-07.2007.
Bokil, H., Tchernichovski, O., & Mitra, P. P. (2006). Dynamicphenotypes: Time series analysis techniques for character-izing neuronal and behavioral dynamics. Neuroinformatics,4(1), 119–128.
Bower, J. M., & Beeman, D. (1998). The book of GENESIS(2nd ed.). New York: Springer.
Brown, E. N., Kass, R. E., & Mitra, P. P. (2004). Multiple neuralspike train data analysis: State-of-the-art and future chal-lenges. Nature Neuroscience, 7(5), 456–461.
Calin-Jageman, R. J., Tunstall, M. J., Mensh, B. D., Katz, P. S.,& Frost, W. N. (2007). Parameter space analysis suggestsmulti-site plasticity contributes to motor pattern initiationin Tritonia. Journal of Neurophysiology, 98(4), 2382–2398.doi:10.1152/jn.00572.2007.
Cannon, R. C., Gewaltig, M. O., Gleeson, P., Bhalla, U. S.,Cornelis, H., Hines, M. L., et al. (2007) Interoperabilityof neuroscience modeling software: Current status and fu-ture directions. Neuroinformatics, 5(2), 127–138. doi:10.1007/s12021-007-0004-5.
Carnevale, N., & Hines, M. (2006). The NEURON book.Cambridge: Cambridge University Press.
Chamberlin, D. D., & Boyce, R. F. (1974). SEQUEL: A struc-tured English query language. In International conferenceon management of data, proceedings of the 1974 ACMSIGFIDET (now SIGMOD) workshop on data description,access and control (pp. 249–264). Ann Arbor, Michigan.
Codd, E. (1970). A relational model of data for large shared databanks. Communications of the ACM, 13(6), 377–387.
Cui, J., Xu, L., Bressler, S. L., Ding, M., & Liang, H. (2008).BSMART: A MATLAB/C toolbox for analysis of mul-tichannel neural time series. Neural Networks, 21(8, Sp.Iss. SI), 1094–1104. doi:10.1016/j.neunet.2008.05.007.
Eaton, J. W. (2002). GNU Octave. A numerical engineering soft-ware package. http://www.che.wisc.edu/octave.
Elmasri, R., & Navathe, S. B. (1994). Fundamentals of databasesystems (2nd ed.). Reading: Addison-Wesley.
Fonseca, C. M., & Fleming, P. J. (1993). Genetic algorithmsfor multiobjective optimization: Formulation, discussion andgeneralization. In Genetic algorithms: Proceedings of thefifth international conference (pp. 416–423). San Francisco:Morgan Kaufmann.
Gardner, D., Toga, A., Ascoli, G., Beatty, J., Brinkley, J.,Dale, A., et al. (2003). Towards effective and rewarding datasharing. Neuroinformatics, 1(3), 289–295.
Gardner, D., Akil, H., Ascoli, G. A., Bowden, D. M., Bug, W.,Donohue, D. E., et al. (2008). The neuroscience informa-tion framework: A data and knowledge environment forneuroscience. Neuroinformatics, 6(3), 149–160. doi:10.1007/s12021-008-9024-z.
Gleeson, P., Steuber, V., & Silver, R. A. (2007). neuro-Construct: A tool for modeling networks of neurons in3D space. Neuron, 54(2), 219–235. doi:10.1016/j.neuron.200703.025.
Günay, C. (2007). Plotting and analysis for neural database-oriented research applications (PANDORA) toolbox. http://userwww.service.emory.edu/˜cgunay/pandora.
Günay, C. (2008a). PANDORA neural analysis toolbox. InIntenational Neuroinformatics coordinating facility (INCF)software center. http://software.incf.org/software/44/view/PANDORA.
Günay, C. (2008b). PANDORA neural analysis toolbox.SimToolDB. http://senselab.med.yale.edu/SimToolDB.
Günay, C., Edgerton, J. R., & Jaeger, D. (2008a). Channel den-sity distributions explain spiking variability in the globuspallidus: A combined physiology and computer simulationdatabase approach. Journal of Neuroscience, 28(30), 7476–7491. doi:10.1523/jneurosci.4198-07.2008.
Günay, C., Hooper, R. M., Hammett, K. R., & Prinz, A. A.(2008b). Calcium sensor properties for activity-dependenthomeostatic regulation of pyloric network rhythms inthe lobster stomatogastric ganglion. BMC Neuroscience,9(Suppl 1), P42.
Günay, C., Smolinski, T., Lytton, W., et al. (2008c). Compu-tational intelligence in electrophysiology: Trends and openproblems. In T. Smolinski, M. Milanova, & A. E. Hassanien(Eds.), Applications of computational intelligence in biology:Current trends and open problems (chap. XIV, pp. 325–359).New York: Springer.
Herz, A. V., Meier, R., Nawrot, M. P., Schiegel, W., & Zito, T.(2008). G-Node: An integrated tool-sharing platform to sup-port cellular and systems neurophysiology in the age ofglobal neuroinformatics. Neural Networks, 21(8), 1070–1075.doi:10.1016/j.neunet.2008.05.011 (Special Issue on Neuroin-formatics).
Hines, M., Morse, T., Migliore, M., Carnevale, N., &Shepherd, G. (2004). ModelDB: A database to support com-putational neuroscience. Journal of Computational Neuro-science, 17(1), 7–11. http://senselab.med.yale.edu/ModelDB.
Hodgkin, A., & Huxley, A. (1952). A quantitative descrip-tion of membrane current and its application to conduc-tion and excitation in nerve. Journal of Physiology, 117(4),500–544.
Neuroinform (2009) 7:93–111 111
Huys, Q. J. M., Ahrens, M. B., & Paninski, L. (2006). Efficientestimation of detailed single-neuron models. Journal ofNeurophysiology, 96(2), 872–890. doi:10.1152/jn.00079.2006.
Johnson, D. H., & Sinanovic, S. (2001). Symmetrizing theKullback-Leibler distance. Tech. Rep., Electrical & Com-puter Engineering Department, MS380 Rice UniversityHouston, Texas 77005-1892. http://www-dsp.rice.edu/˜dhj/resistor.pdf.
Kullback, S., & Leibler, R. (1951). On information and suffi-ciency. Annals of Mathematical Statistics, 22(1), 79–86.
Lidierth, M. (2009). sigTOOL: A MATLAB-based environ-ment for sharing laboratory-developed software to ana-lyze biological signals. Journal of Neuroscience Methods.doi:10.1016/j.jneumeth.2008.11.004.
Liu, Z., Golowasch, J., Marder, E., & Abbott, L. F. (1998). Amodel neuron with activity-dependent conductances regu-lated by multiple calcium sensors. Journal of Neuroscience,18(7), 309–320.
Lytton, W. W. (2006). Neural query system—data-mining fromwithin the neuron simulator. Neuroinformatics, 4(2), 163–175.
Meier, R., Boven, K., Aertsen, A., & Egert, U. (2007). FIND—finding information in neural data, An open-source analysistoolbox for multiple-neuron recordings and network simula-tions. In Proc. 7th German Neurosci Meeting (p. 1212).
Meier, R., Egert, U., Aertsen, A., & Nawrot, M. P. (2008).FIND—A unified framework for neural data analysis.Neural Networks, 21(8), 1085–1093. doi:10.1016/j.neunet.2008.06.019 (Special Issue on Neuroinformatics).
Morse, T. (2007). Model sharing in computational neuro-science. Scholarpedia, 2(4), 3036. http://www.scholarpedia.org/article/Model_sharing_in_computational_neuroscience.
Nicolelis, M., Dimitrov, D., Carmena, J., Crist, R., Lehew, G.,Kralik, J., et al. (2003). Chronic, multisite, multielec-trode recordings in macaque monkeys. Proceedings of theNational Academy of Sciences of the United States ofAmerica, 100(19), 11041–11046.
Pittendrigh, S., & Jacobs G. (2003). Neurosys: A semistructuredlaboratory database. Neuroinformatics, 1(2), 167–176.
Prinz, A. A., Billimoria, C. P., & Marder, E. (2003). Alterna-tive to hand-tuning conductance-based models: Construc-tion and analysis of databases of model neurons. Journal ofNeurophysiology, 90, 3998–4015.
Prinz, A. A., Bucher, D., & Marder, E. (2004). Similar networkactivity from disparate circuit parameters. Nature Neuro-science, 7(12), 1345–1352.
Sekerli, M., Del Negro, C., Lee, R., & Butera, R. (2004).Estimating action potential thresholds from neuronal time-series: New metrics and evaluation of methodologies. IEEETransactions on Biomedical Engineering, 51(9), 1665–1672.doi:10.1109/TBME.2004.827531.
Shepherd, G., Mirsky, J., Healy, M., et al. (1998). The humanbrain project: Neuroinformatics tools for integrating, search-ing and modeling multidisciplinary neuroscience data. TINS,21(11).
Sinanovic, S., & Johnson, D. H. (2007). Toward a theory of infor-mation processing. Signal Processing, 87, 1326–1344.
Smolinski, T. G., Prinz, A. A., & Zurada, J. M. (2008). Hy-bridization of rough sets and multi-objective evolutionaryalgorithms for classificatory signal decomposition. In A. E.Hassanien, Z. Suraj, D. Slezak, & P. Lingras (Eds.), Roughcomputing: Theories, technologies, and applications (chap. X,pp. 204–227). Hershey: Information Science Reference.
Taylor, A. L., Hickey, T. J., Prinz, A. A., & Marder, E. (2006).Structure and visualization of high-dimensional conductancespaces. Journal of Neurophysiology, 96, 891–905.
Van Geit, W., Achard, P., & Schutter, E. D. (2007). Neurofitter:A parameter tuning package for a wide range of electrophys-iological neuron models. Frontiers in Neuroinformatics, 1, 1.
Van Geit, W., De Schutter, E., & Achard, P. (2008). Auto-mated neuron model optimization techniques: A review.Biological Cybernetics, 99(4–5), 241–251. doi:10.1007/s00422-008-0257-6.
Vanier, M. C., & Bower, J. M. (1999). A comparative surveyof automated parameter-search methods for compartmentalneural models. Journal of Computational Neuroscience, 7,149–171.
Weaver, C., & Wearne, S. (2006). The role of action potentialshape and parameter constraints in optimization of com-partment models. Neurocomputing, 69(10–12), 1053–1057.doi:10.1016/j.neucom.2005.12.044 (14th Annual Computa-tional Neuroscience Meeting (CNS 05), Madison, WI, 17–21July, 2005).
Wood, R., Gurney, K., & Wilson, C. (2004). A novel parameteroptimisation technique for compartmental models applied toa model of a striatal medium spiny neuron. Neurocomputing,58, 1109–1116. doi:10.1016/j.neucom.2004.01.174.