data storytelling - government forums · based on presentation by brent dykes on data storytelling:...
TRANSCRIPT
1
Data StorytellingTurning Data into insights and value
Based on presentation by Brent Dykes on Data Storytelling:https://www.slideshare.net/webanalisten/brent-dykes-data-storytelling-conversion-hotel-2015
Leveraging Data Conference, June 7, 2017

2
Rachel ArrezolaDeputy Director,
Communication and Planning
CA DEPT. OF MANAGED HEALTHCARE
Savita Farooqui
CEO
SYMSOFT SOLUTIONS
3
Problem Solution Example DIY
4
Disengaging Data
Problem
5
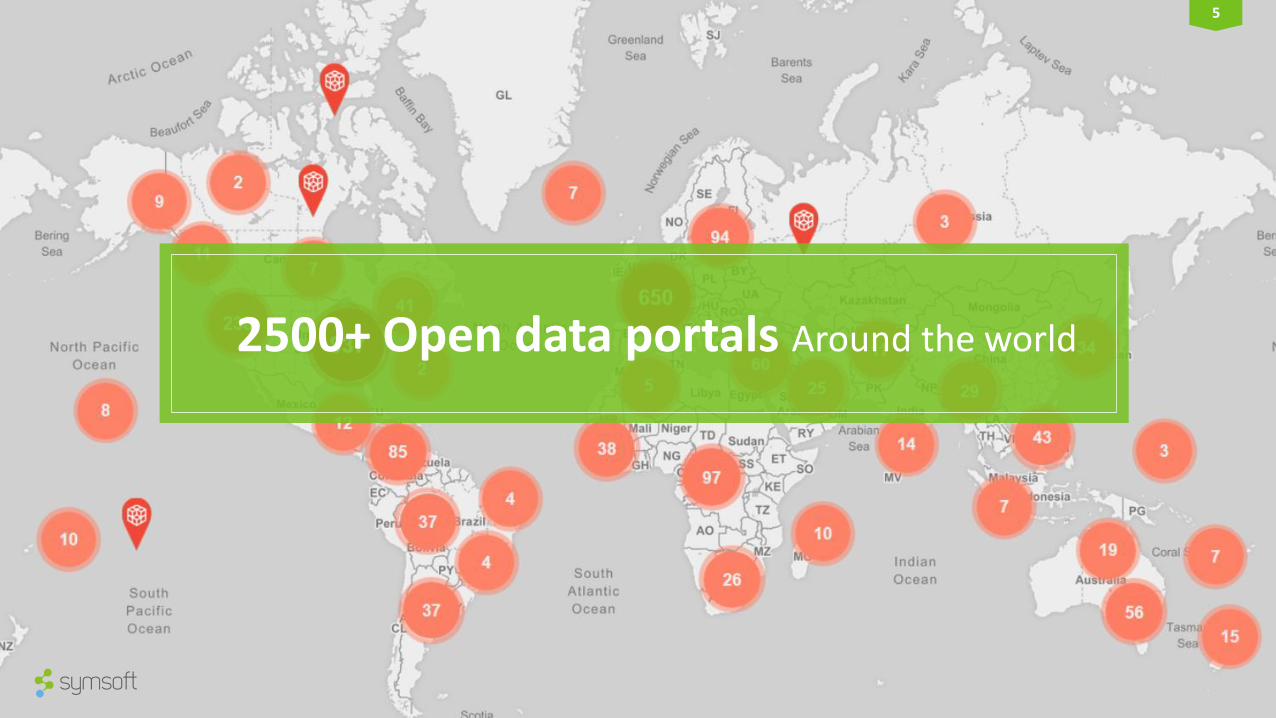
2500+ Open data portals Around the world
6
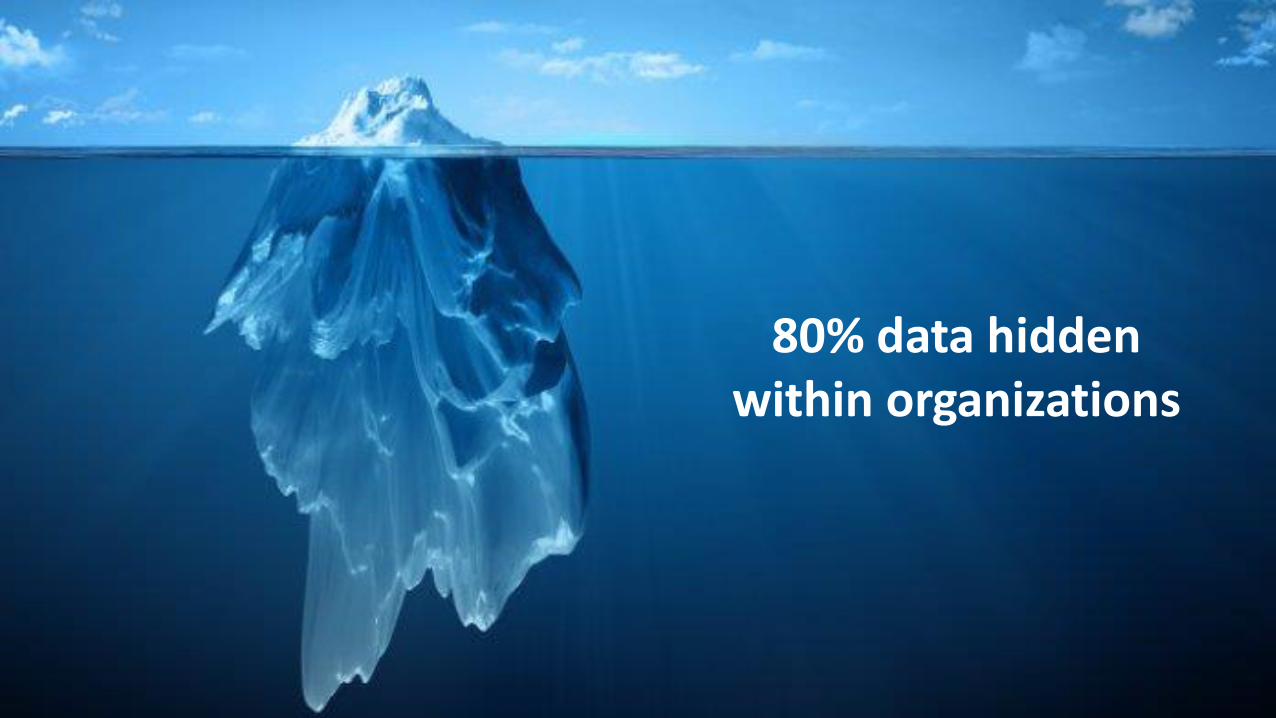
80% data hidden within organizations
7
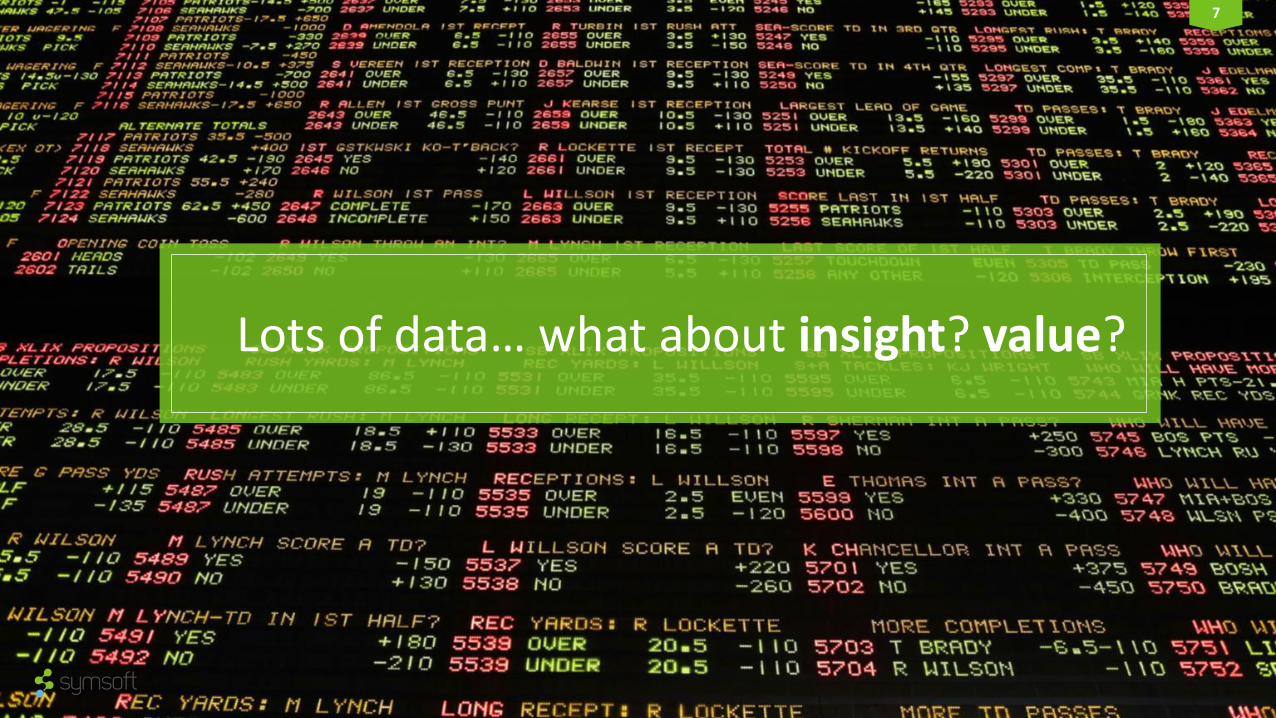
Lots of data… what about insight? value?
8
Data Storytelling
Solution
9
ILLUSTRATION CREDIT: http://circlesfordialogue.com/author/arabella/
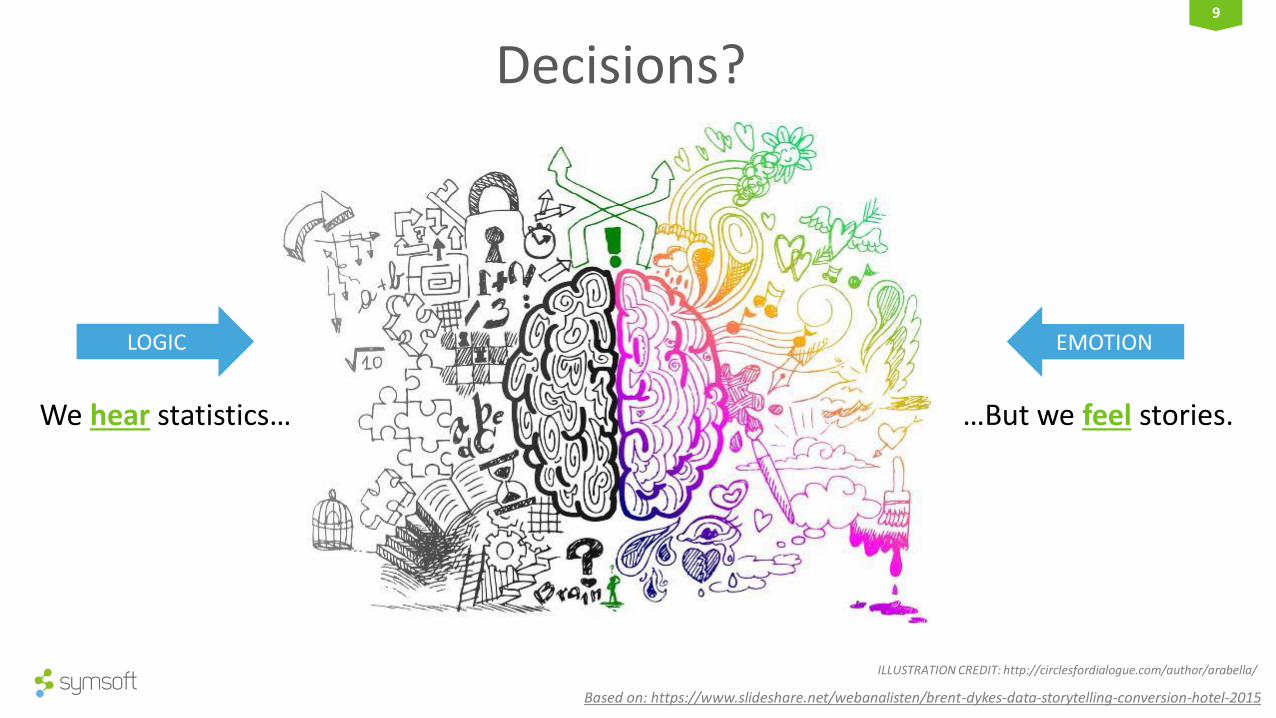
LOGIC EMOTION
We hear statistics… …But we feel stories.
Decisions?
Based on: https://www.slideshare.net/webanalisten/brent-dykes-data-storytelling-conversion-hotel-2015
10
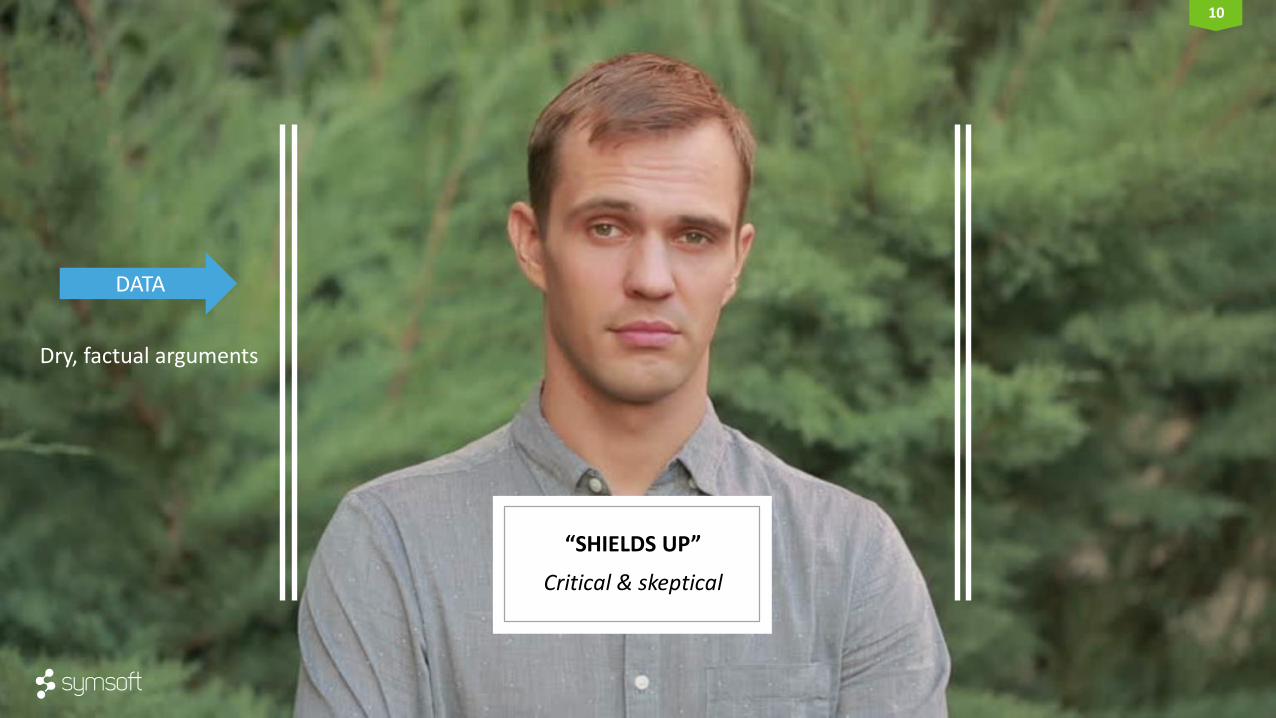
“SHIELDS UP”
Critical & skeptical
DATA
Dry, factual arguments
11
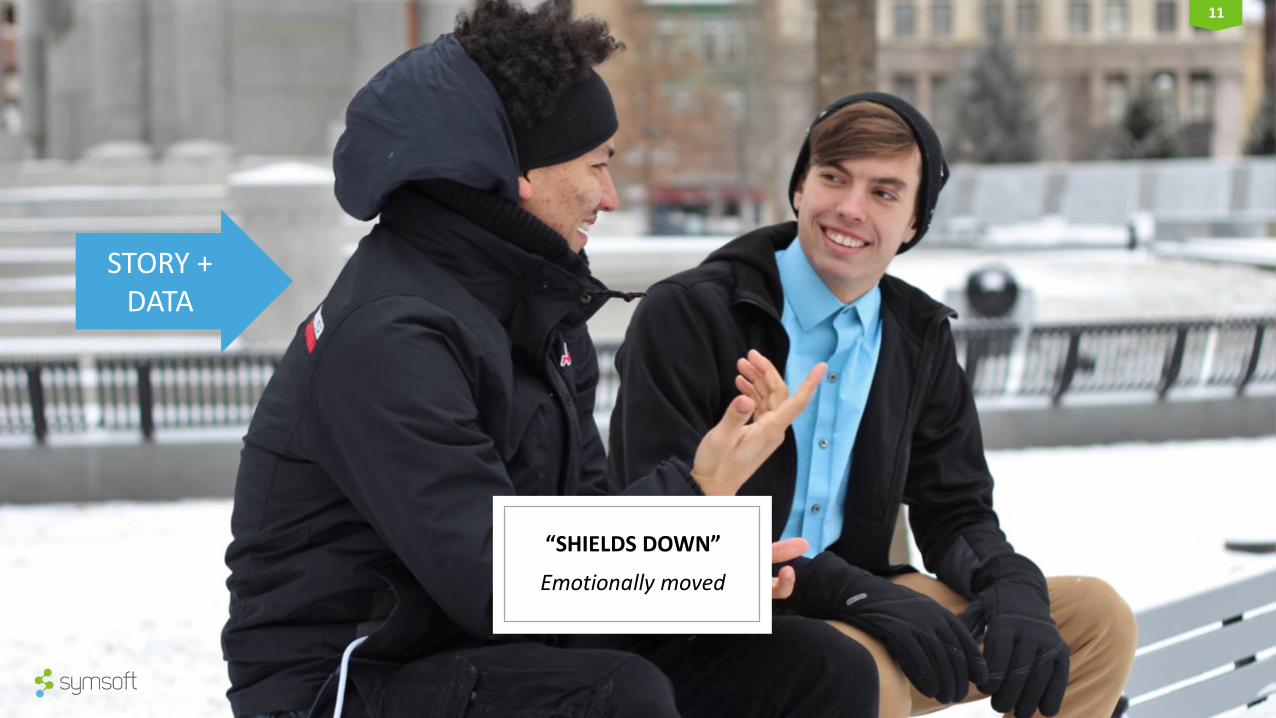
“SHIELDS DOWN”
Emotionally moved
STORY +DATA

12
PHOTO CREDIT: http://projourno.org/2013/10/how-sex-and-google-glass-will-save-us-meet-the-naked-environmentalist/
Understandable Engaging Memorable Persuasive Viral
13
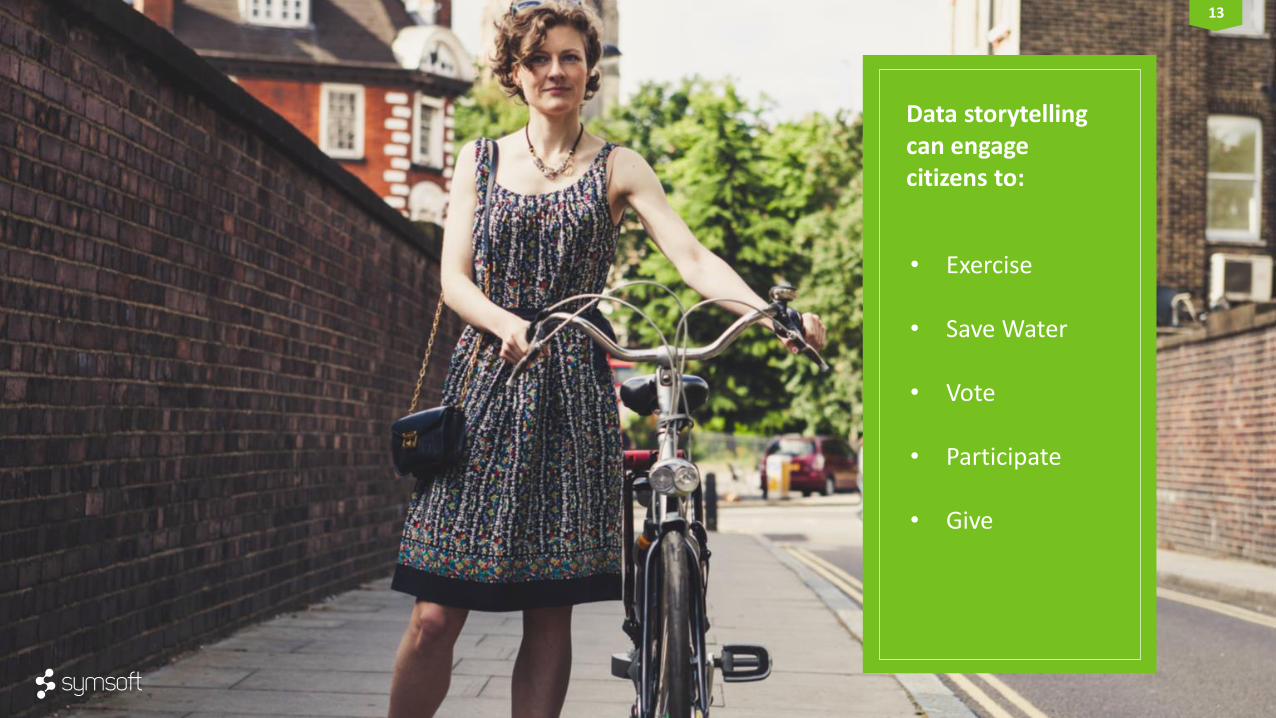
Data storytelling can engage citizens to:
• Exercise
• Save Water
• Vote
• Participate
• Give
14
Data Storytelling in Action
Examples
15
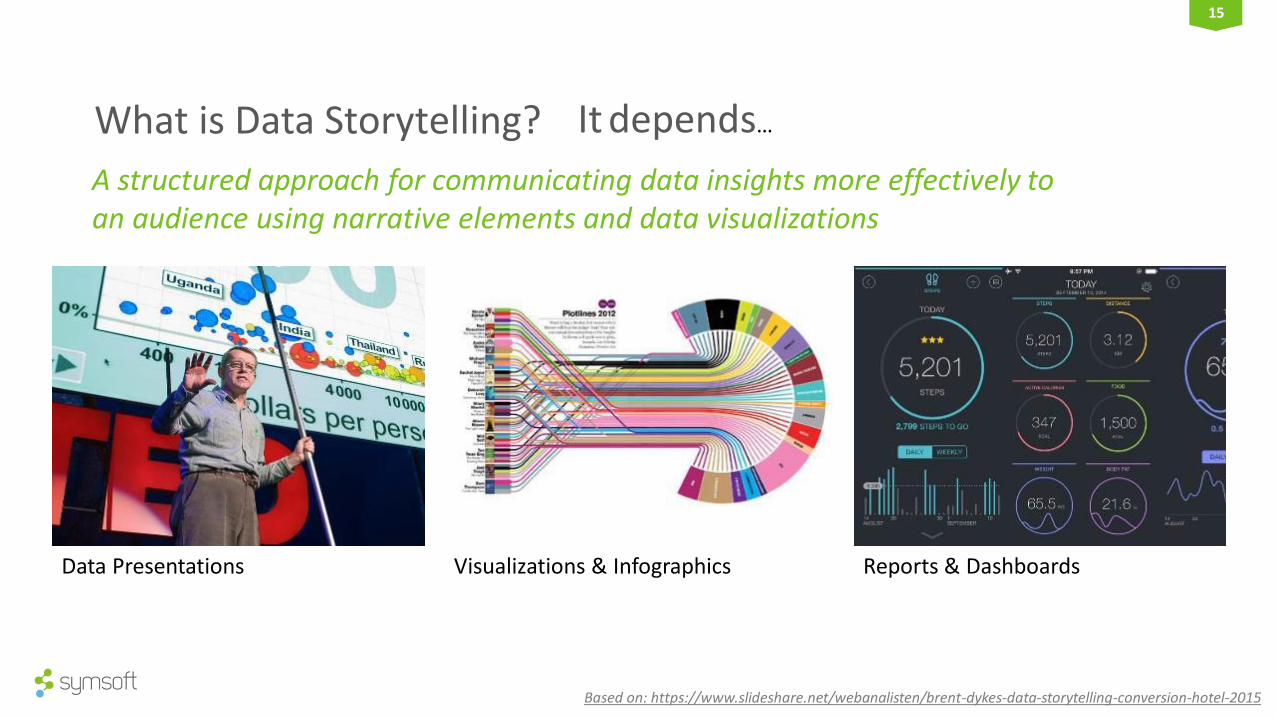
What is Data Storytelling?
Data Presentations Visualizations & Infographics Reports & Dashboards
A structured approach for communicating data insights more effectively to an audience using narrative elements and data visualizations
It depends…
Based on: https://www.slideshare.net/webanalisten/brent-dykes-data-storytelling-conversion-hotel-2015
16
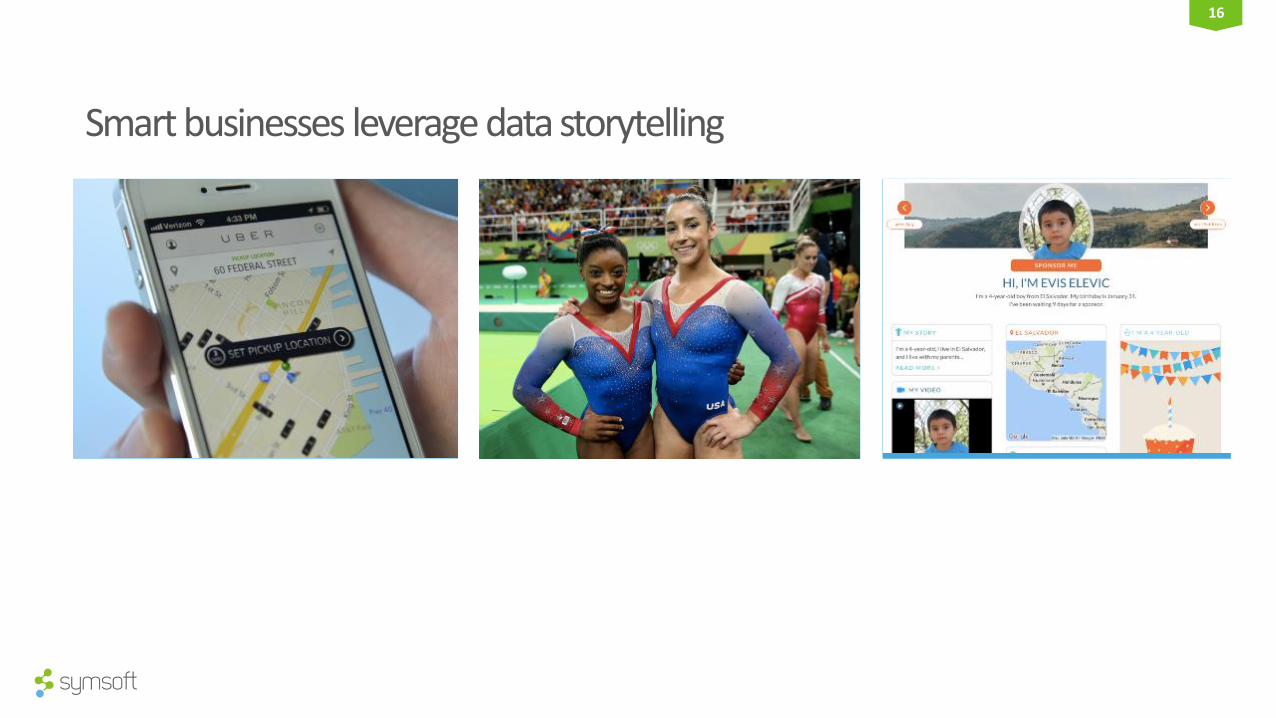
Funding requests:
Elevic, E $125/moAdiel, C $130/moDorjee, P $125/moKenh, S $100/mo
Upcoming Events:
All-around, individualVaultAll-around, individual
Team, portable apparatus
Transportation assistance:
65-74399 2.1mi65-60021 2.8mi67-41998 3.3mi67-15345 4.0mi
Smart businesses leverage data storytelling

17
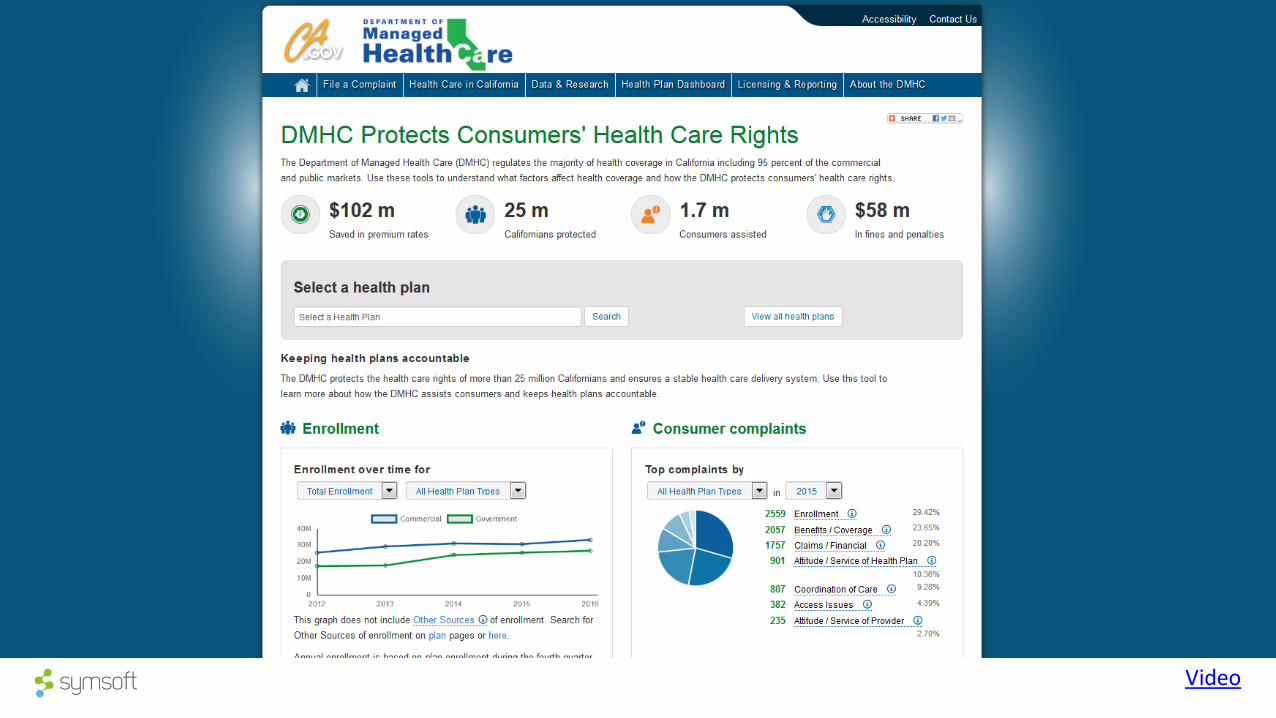
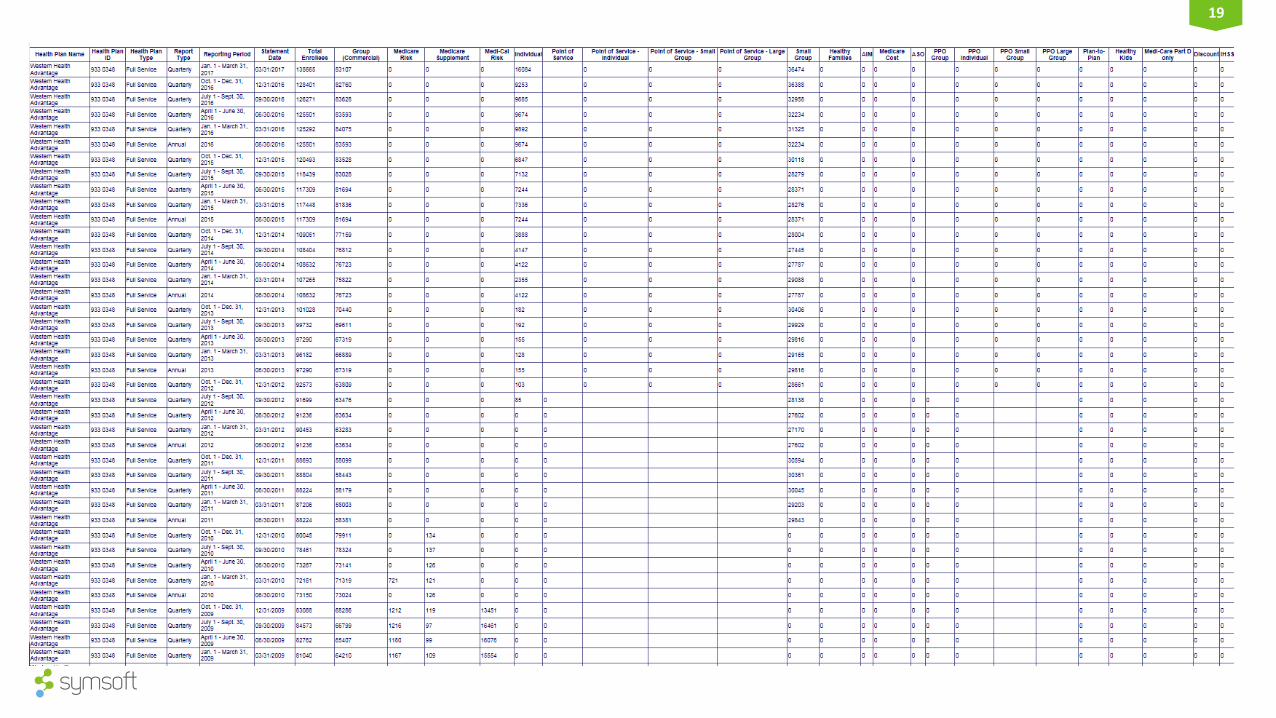
Department of Managed Healthcare (DMHC) Health Plan Dashboard
19
20
Create a Story with Data
How to
21
3 Keys to Data Storytelling
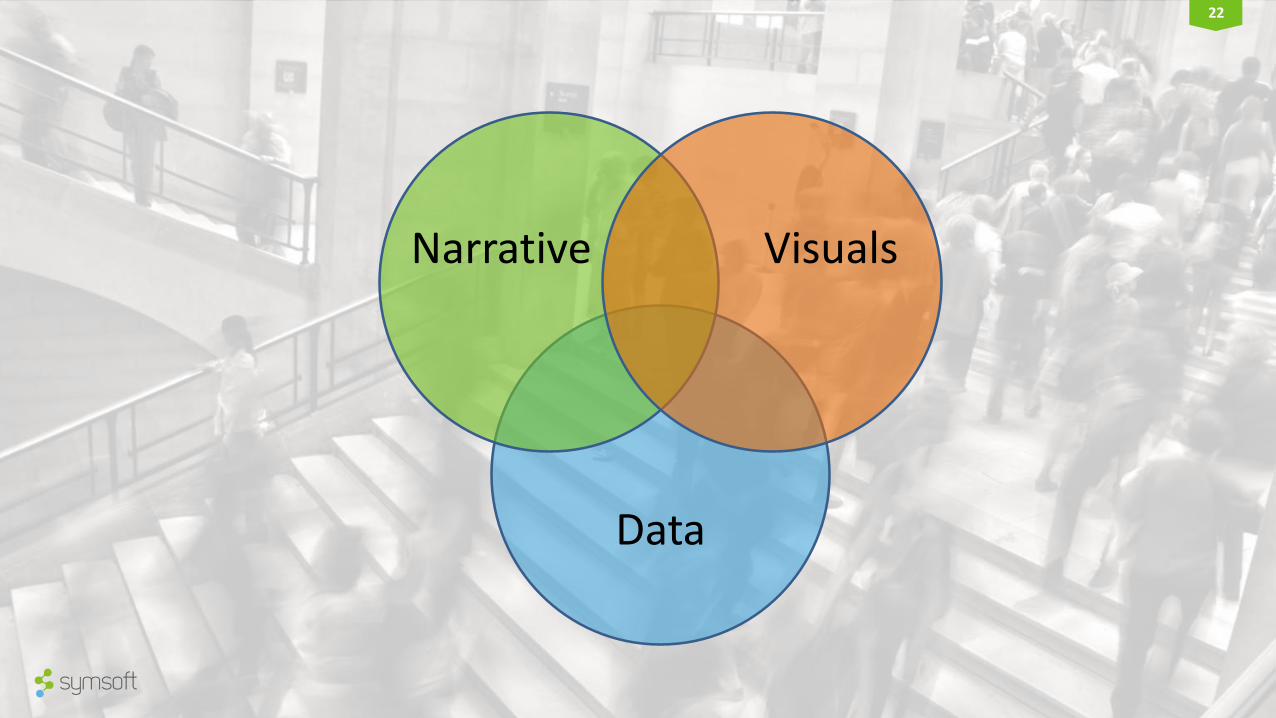
22
Data
Narrative Visuals
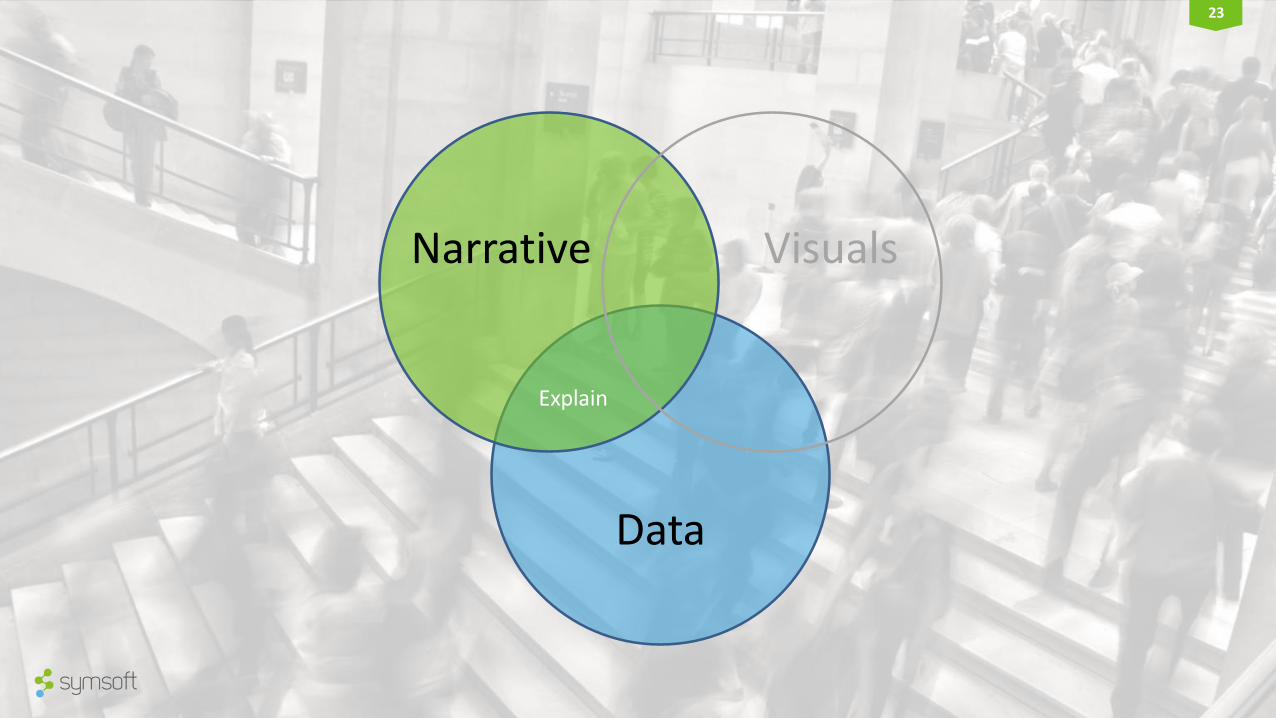
23
Data
Narrative Visuals
Explain
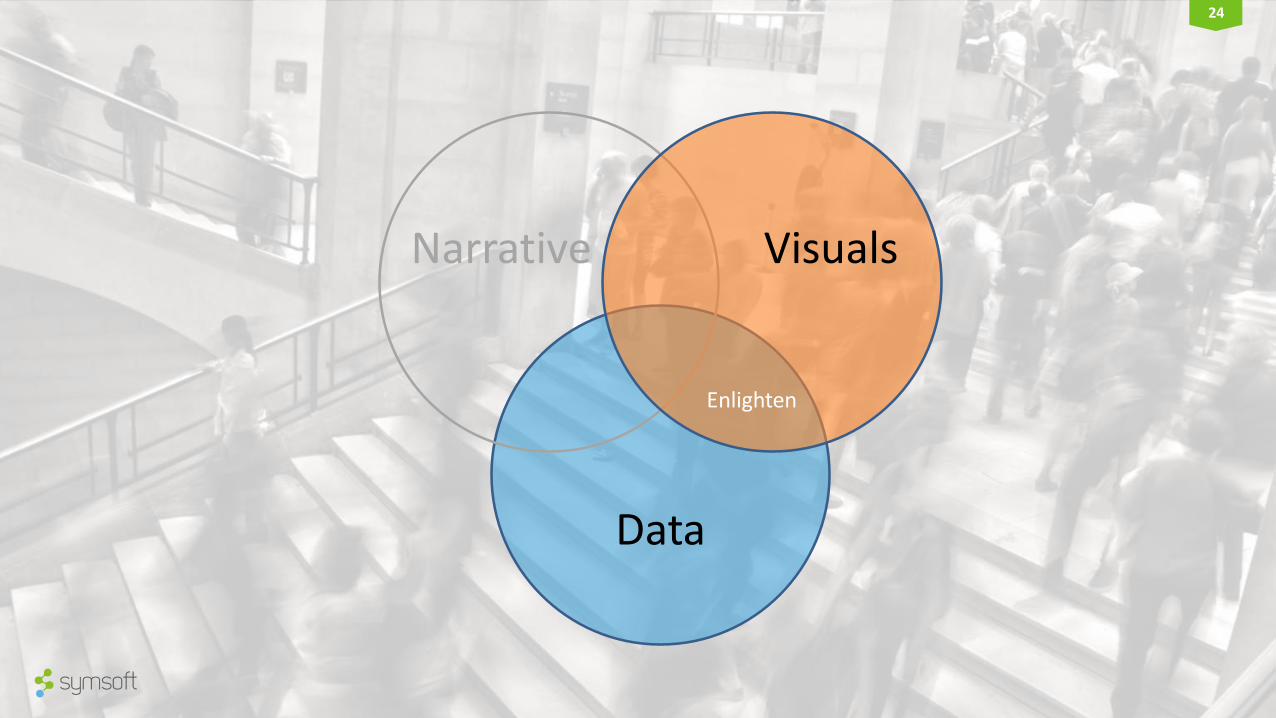
24
Data
Narrative Visuals
Enlighten
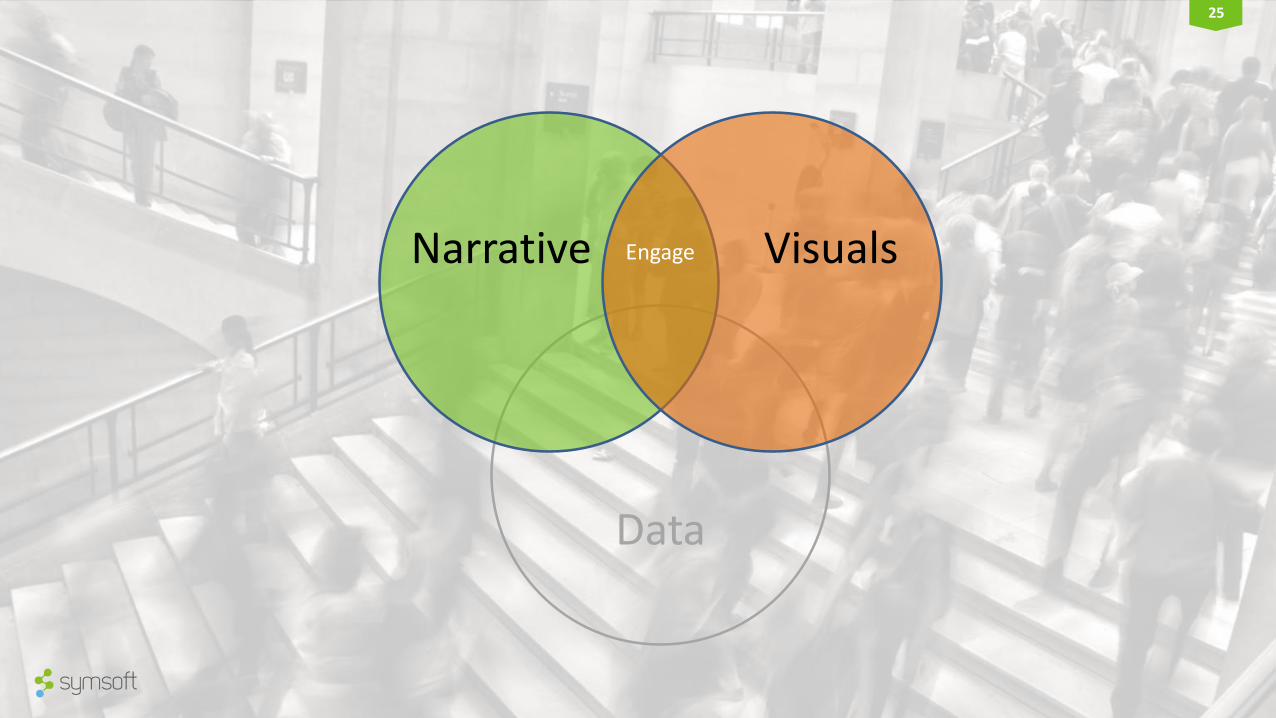
25
Data
Narrative VisualsEngage
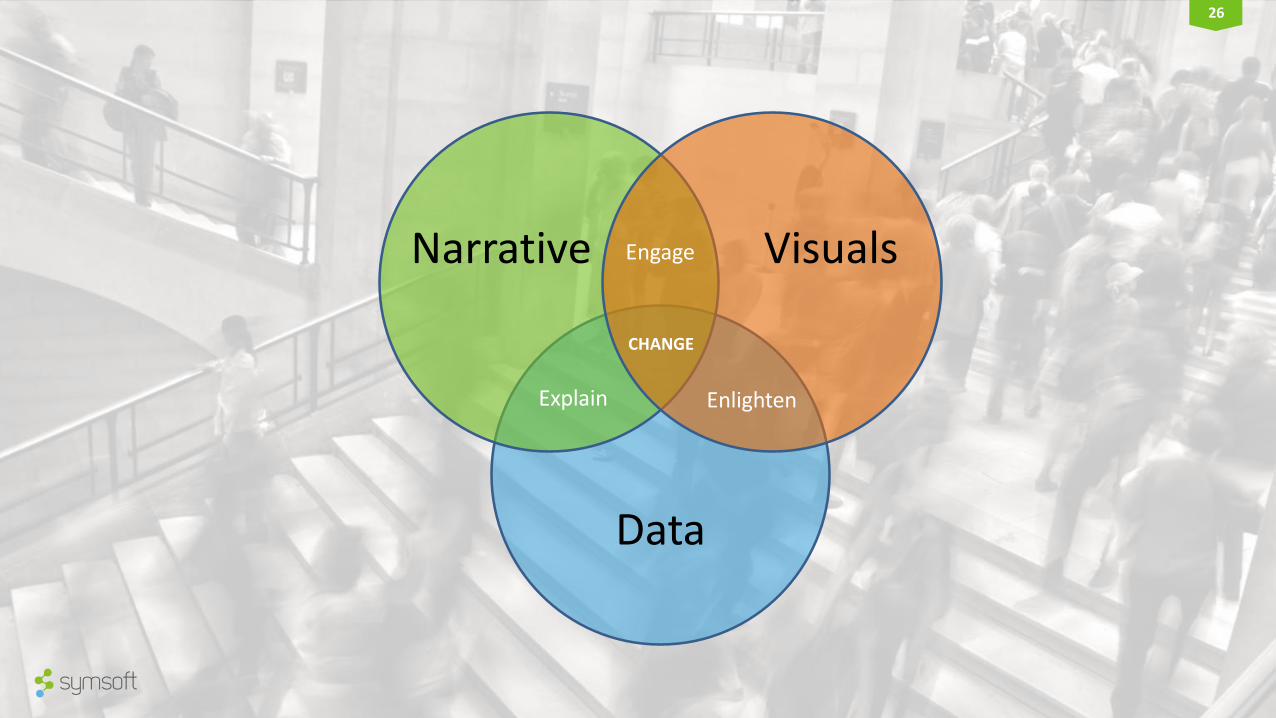
26
Data
Narrative Visuals
EnlightenExplain
Engage
CHANGE
27
Start with Credible and Quality Data

28
Data
Narrative Visuals
29
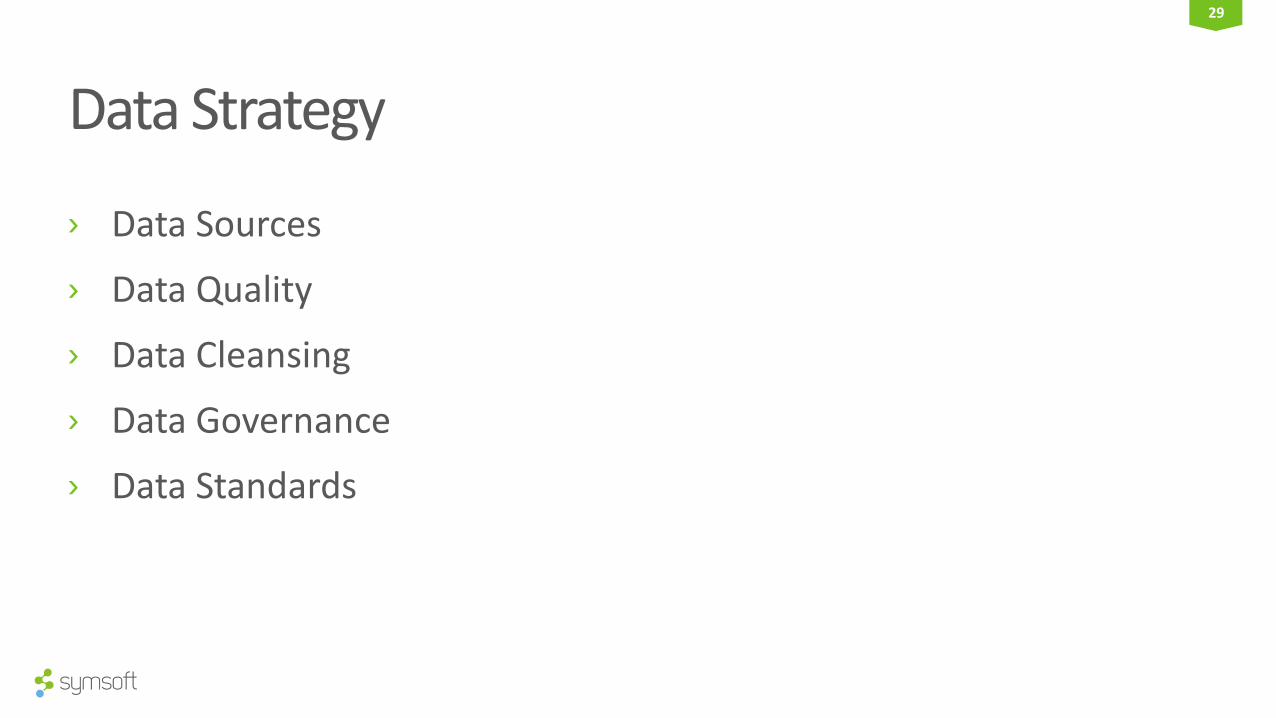
Data Strategy
› Data Sources
› Data Quality
› Data Cleansing
› Data Governance
› Data Standards

30
From Data to Insight
› What is the data telling us?
• Data integration, analysis
• What is the purpose of the analysis?
• What patterns emerge?
› Is data helping with decision making?
• Right answers start with right questions
• Who is the audience?
• What decisions will be made based on the analysis?
31
How to structure a Data Story
32
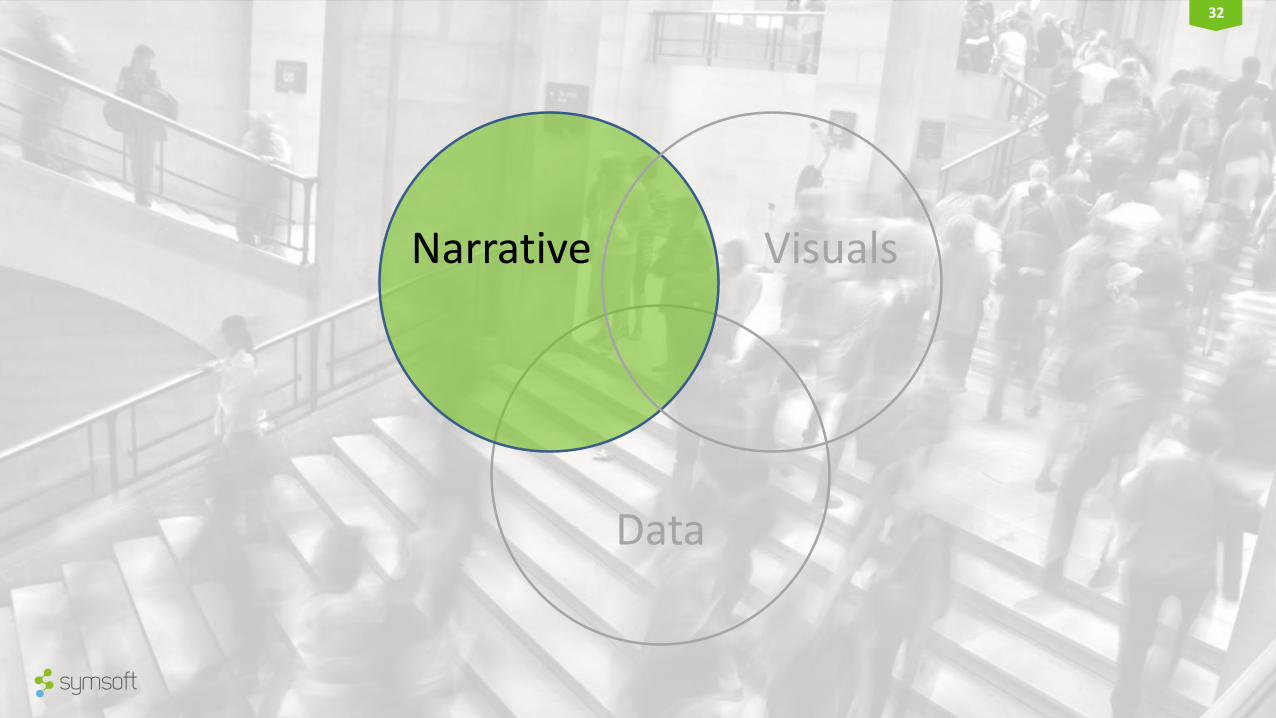
Data
Narrative Visuals
33
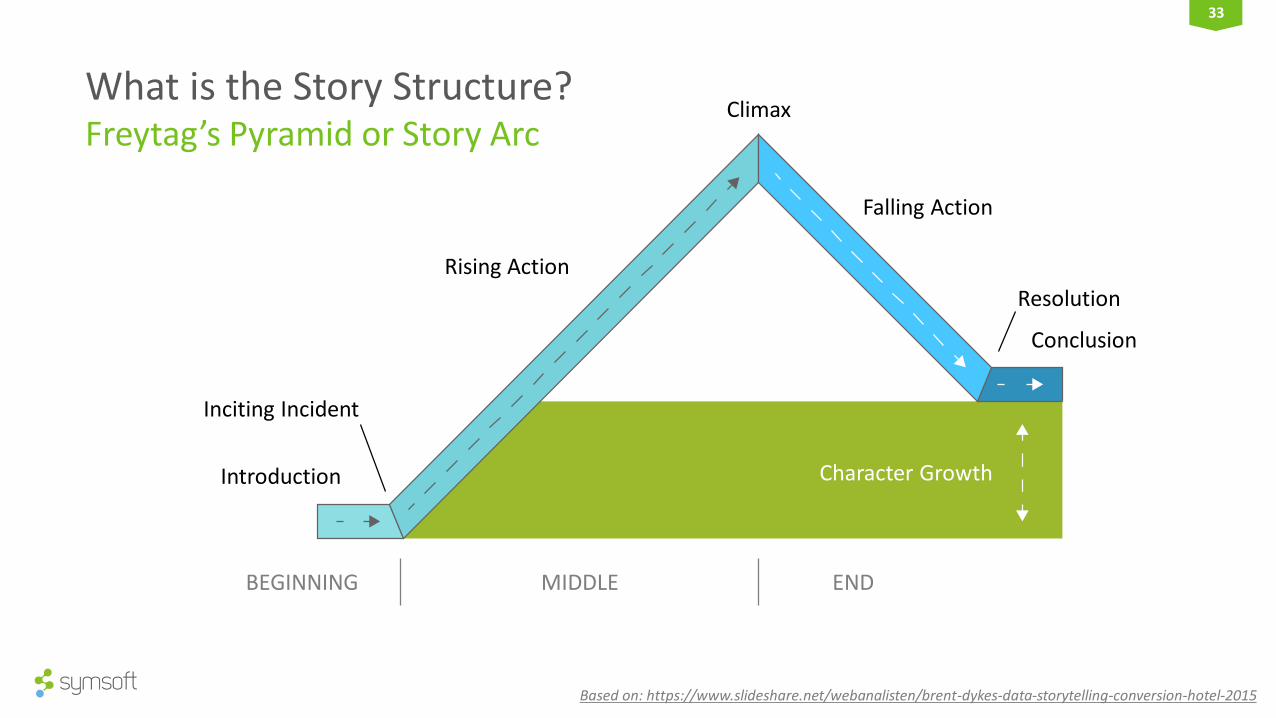
Character Growth
Climax
Falling Action
Resolution
Conclusion
Inciting Incident
Introduction
Rising Action
BEGINNING MIDDLE END
What is the Story Structure?Freytag’s Pyramid or Story Arc
Based on: https://www.slideshare.net/webanalisten/brent-dykes-data-storytelling-conversion-hotel-2015
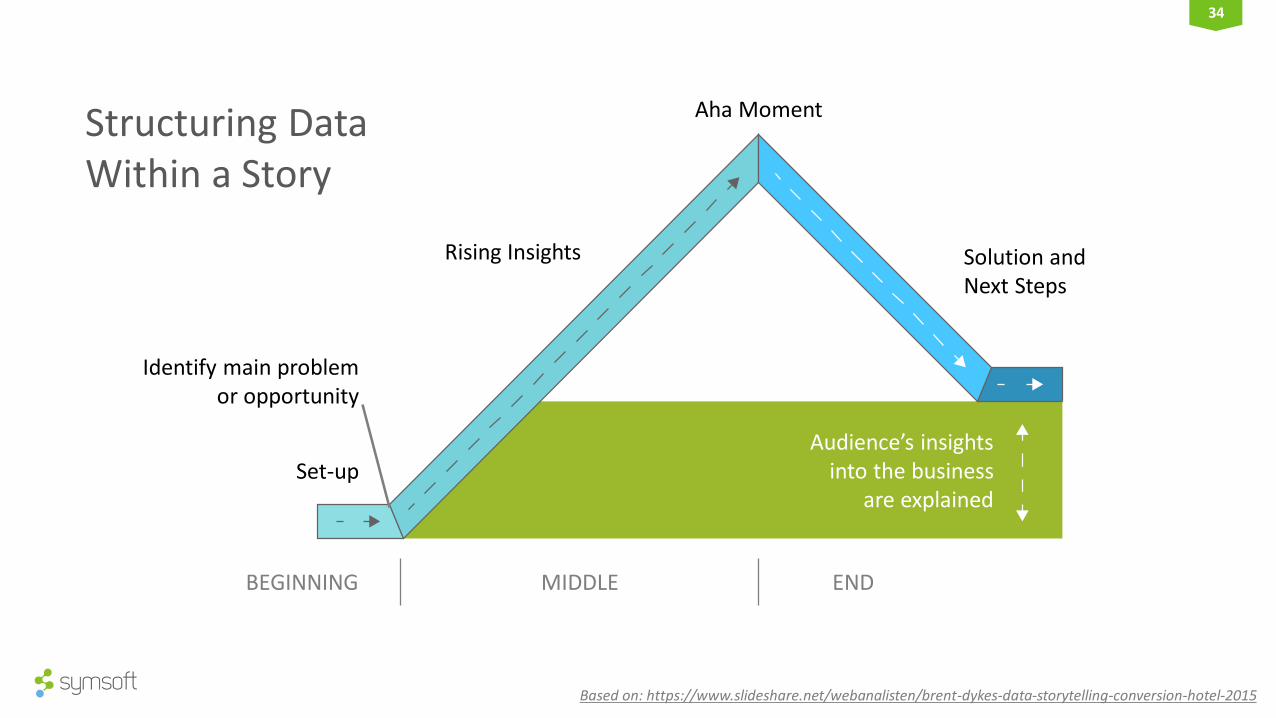
34
Audience’s insightsinto the business
are explained
Aha Moment
Solution andNext Steps
Set-up
Rising Insights
BEGINNING MIDDLE END
Structuring DataWithin a Story
Identify main problemor opportunity
Based on: https://www.slideshare.net/webanalisten/brent-dykes-data-storytelling-conversion-hotel-2015
35
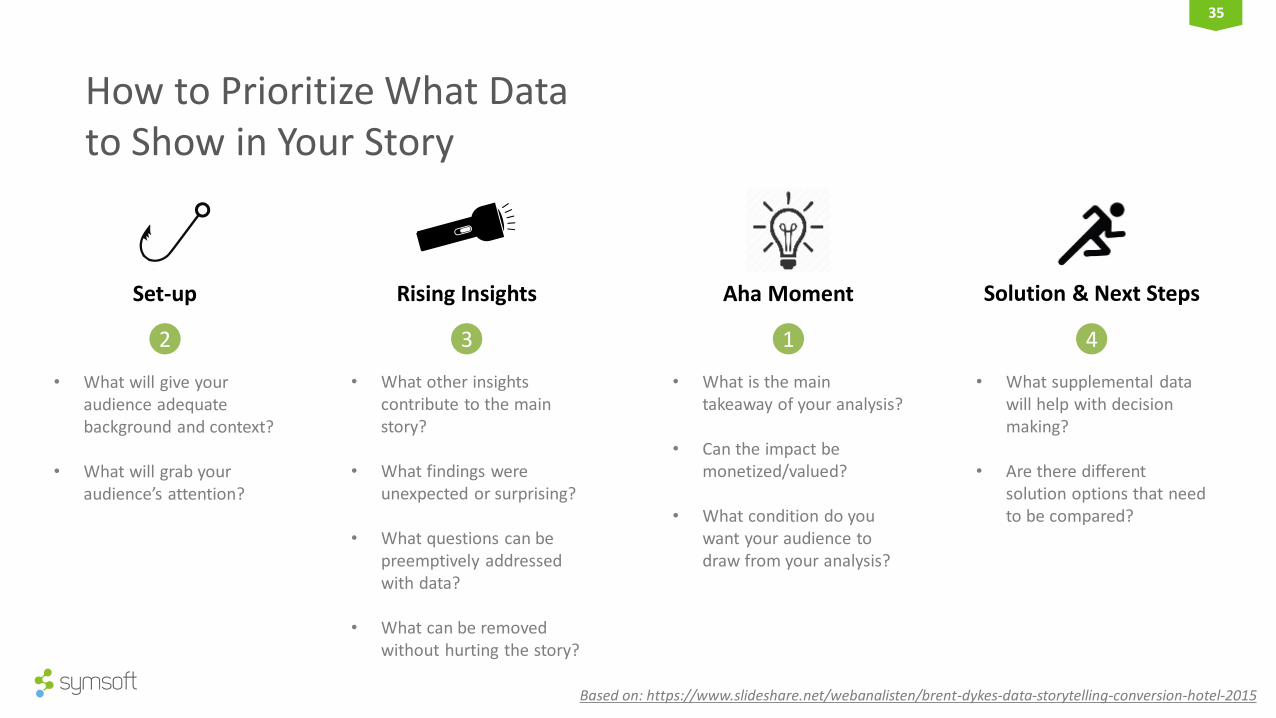
How to Prioritize What Datato Show in Your Story
• What will give your audience adequate background and context?
• What will grab your audience’s attention?
Aha Moment Solution & Next StepsSet-up
12 3 4
• What other insights contribute to the main story?
• What findings were unexpected or surprising?
• What questions can be preemptively addressed with data?
• What can be removed without hurting the story?
• What is the main takeaway of your analysis?
• Can the impact be monetized/valued?
• What condition do you want your audience to draw from your analysis?
• What supplemental data will help with decision making?
• Are there different solution options that need to be compared?
Rising Insights
Based on: https://www.slideshare.net/webanalisten/brent-dykes-data-storytelling-conversion-hotel-2015
36
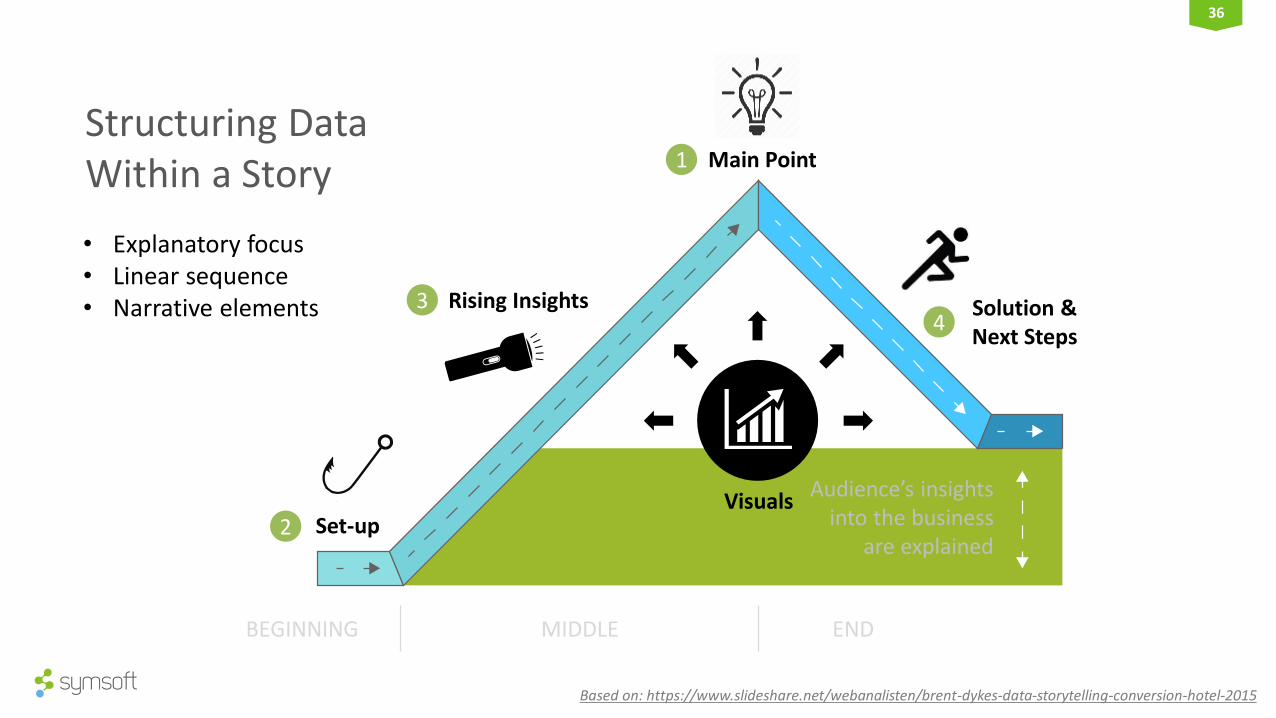
Audience’s insightsinto the business
are explained
BEGINNING MIDDLE END
Structuring DataWithin a Story
• Explanatory focus• Linear sequence• Narrative elements
Main Point
VisualsSet-up
Rising Insights Solution & Next Steps
1
2
34
Based on: https://www.slideshare.net/webanalisten/brent-dykes-data-storytelling-conversion-hotel-2015
37
Who is your story’s hero?
38
Help your audience find key insights with data visualizations
39
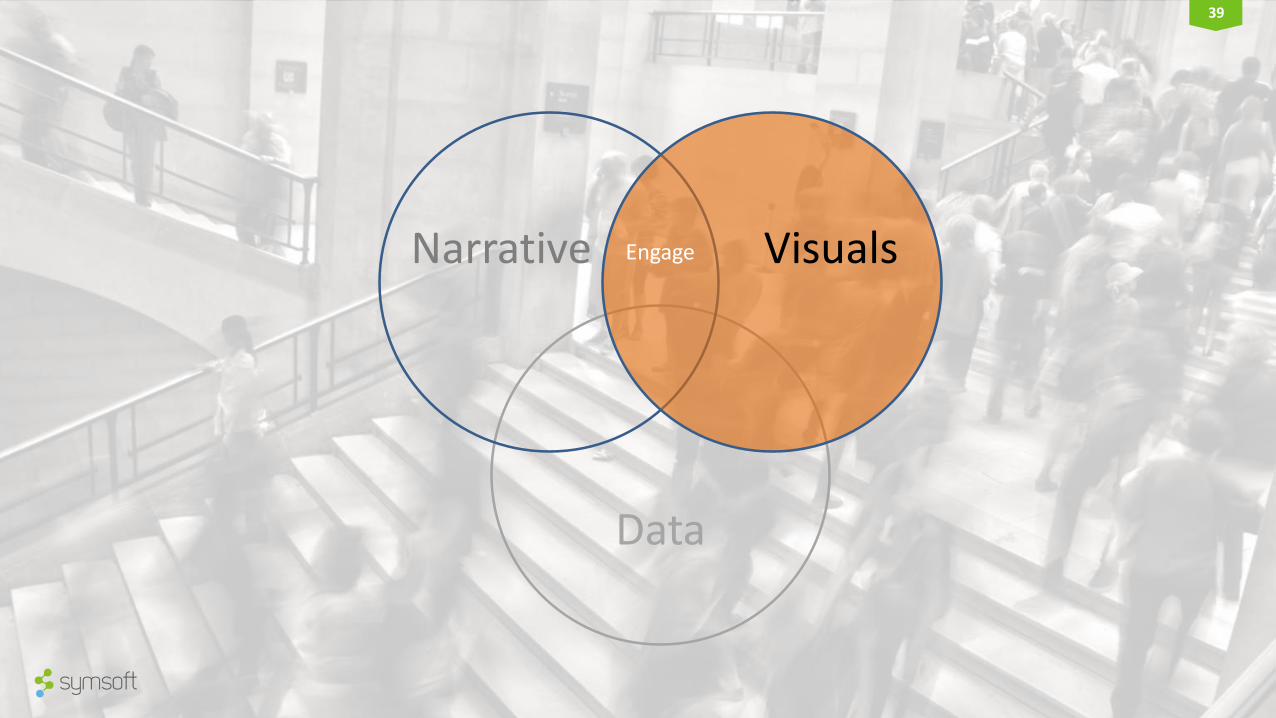
Data
Narrative VisualsEngage
40
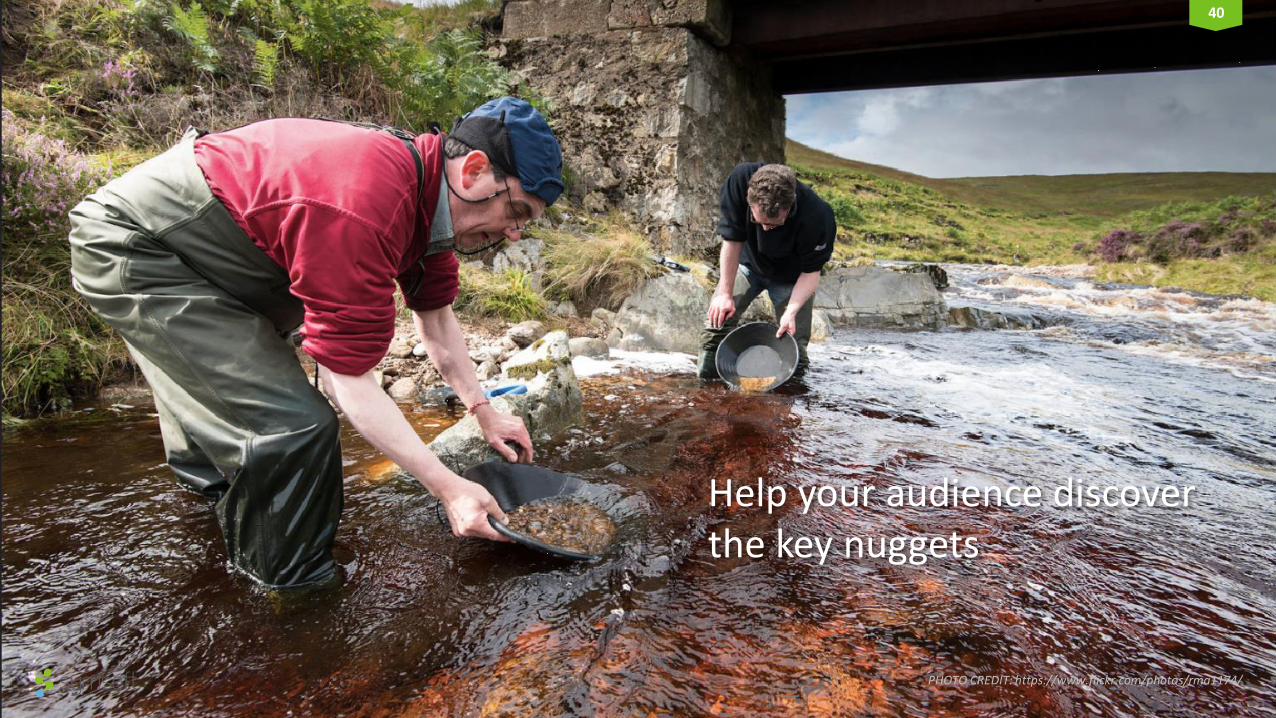
Help your audience discover the key nuggets
PHOTO CREDIT: https://www.flickr.com/photos/rma1174/
41
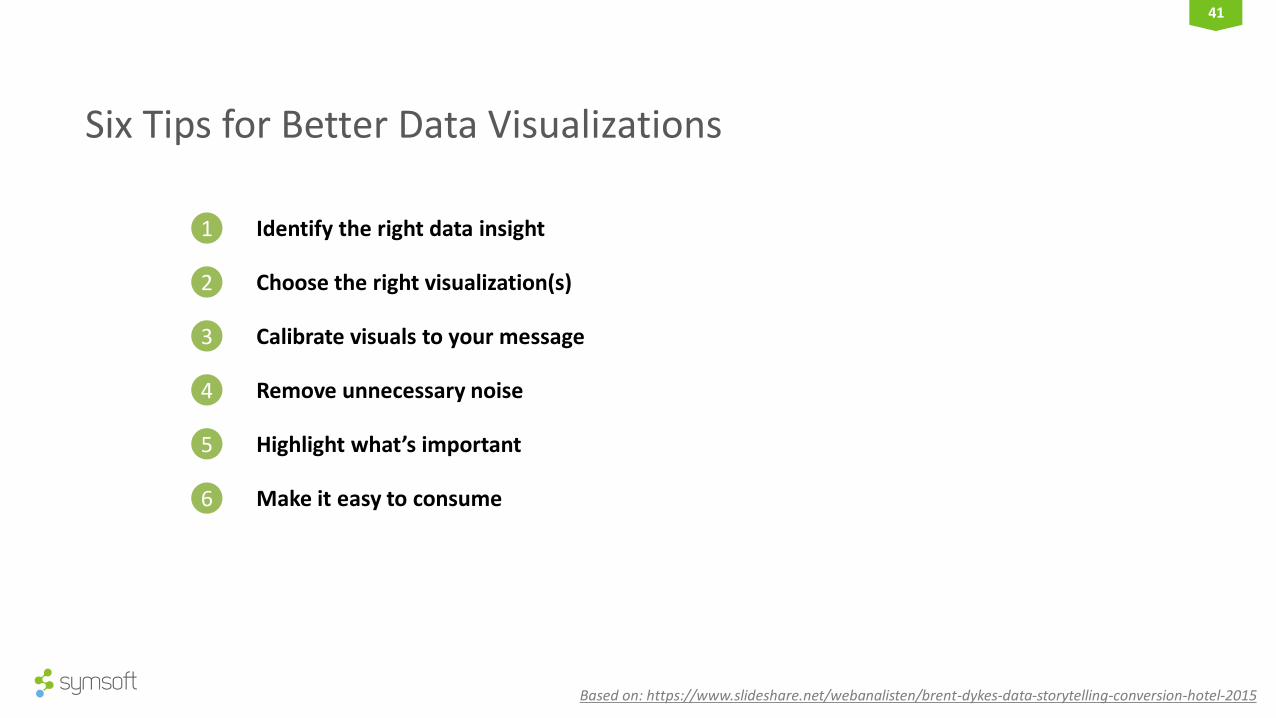
Six Tips for Better Data Visualizations
Identify the right data insight1
Choose the right visualization(s)2
Calibrate visuals to your message3
Remove unnecessary noise4
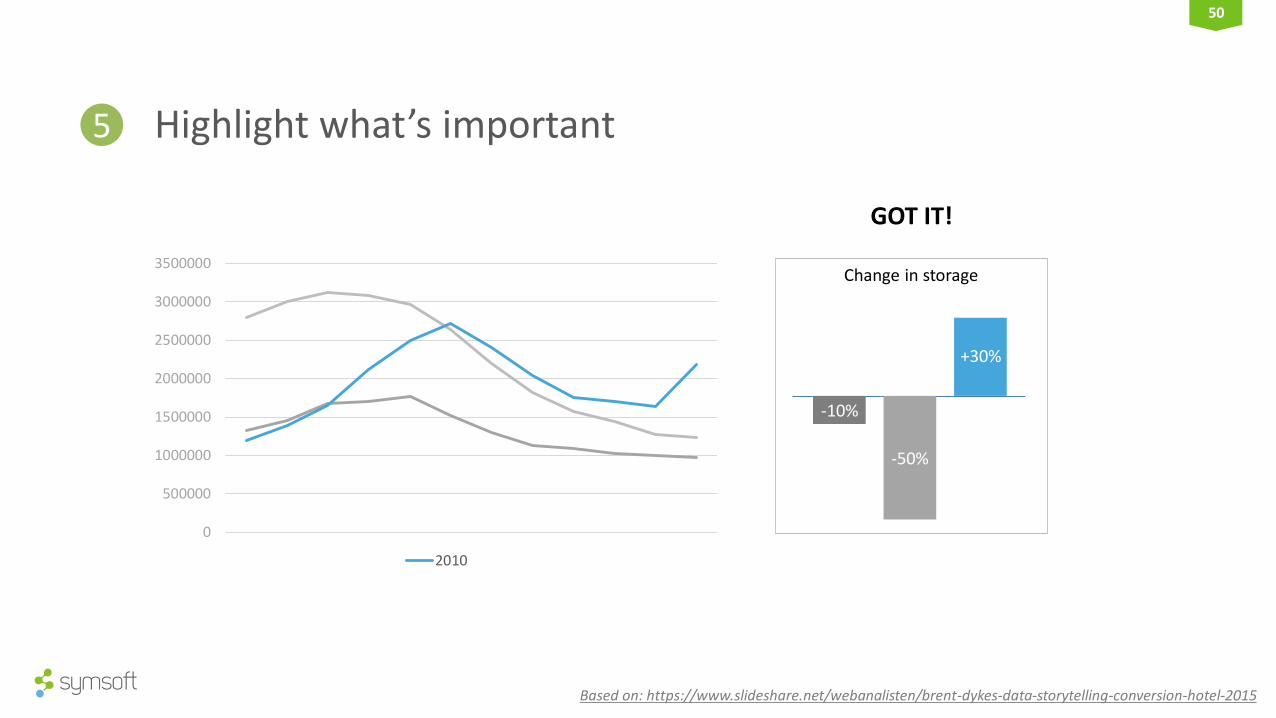
Highlight what’s important5
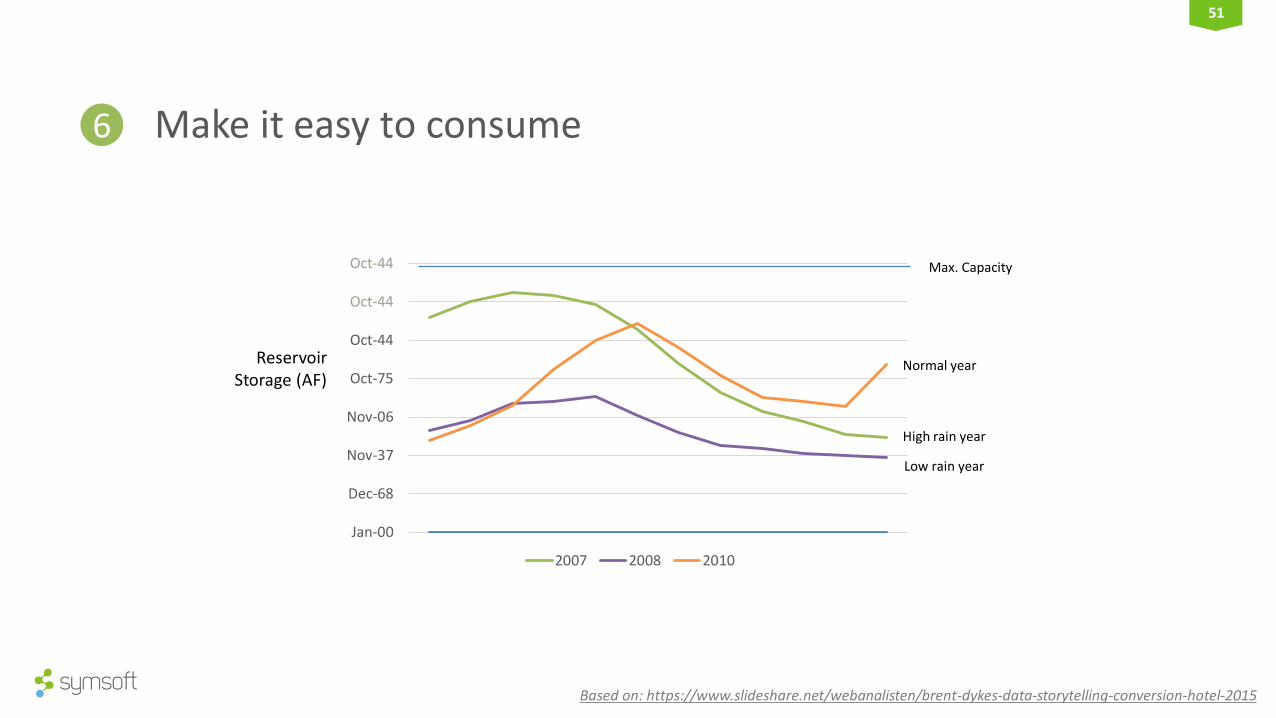
Make it easy to consume6
Based on: https://www.slideshare.net/webanalisten/brent-dykes-data-storytelling-conversion-hotel-2015
42
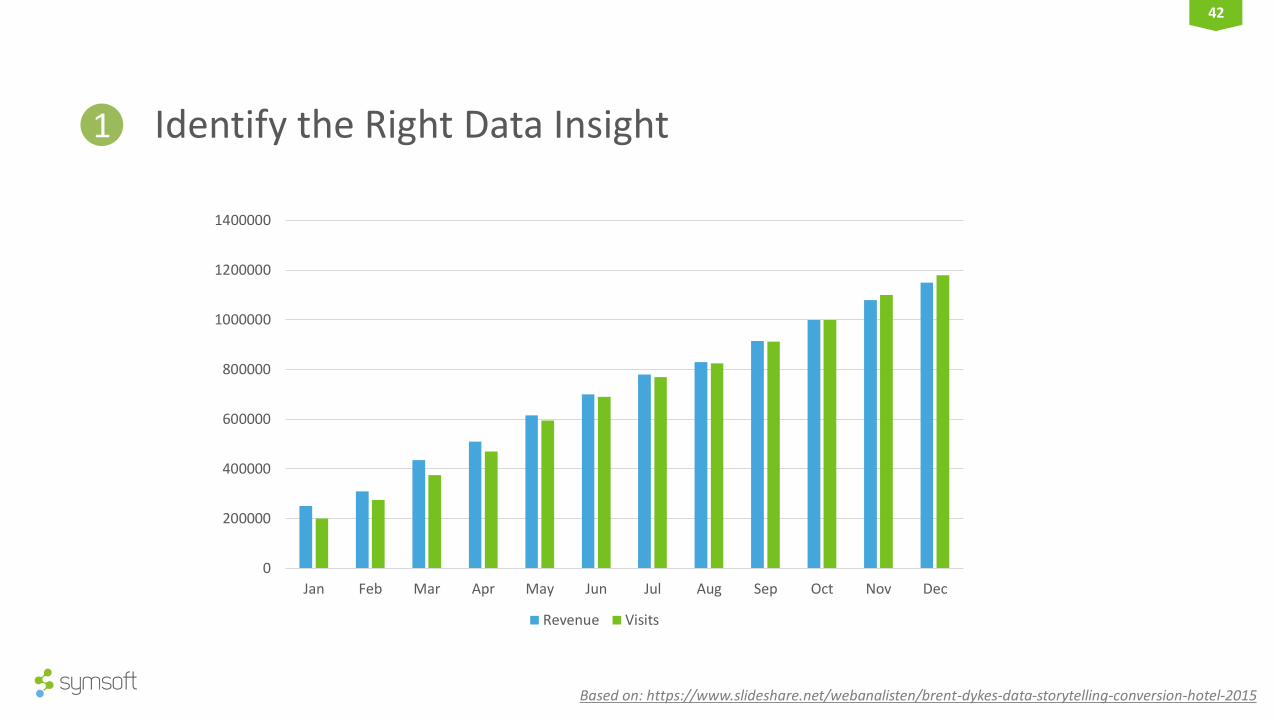
Identify the Right Data Insight1
0
200000
400000
600000
800000
1000000
1200000
1400000
Jan Feb Mar Apr May Jun Jul Aug Sep Oct Nov Dec
Revenue Visits
Based on: https://www.slideshare.net/webanalisten/brent-dykes-data-storytelling-conversion-hotel-2015
43
0
200000
400000
600000
800000
1000000
1200000
1400000
Jan Feb Mar Apr May Jun Jul Aug Sep Oct Nov Dec
Revenue Visits
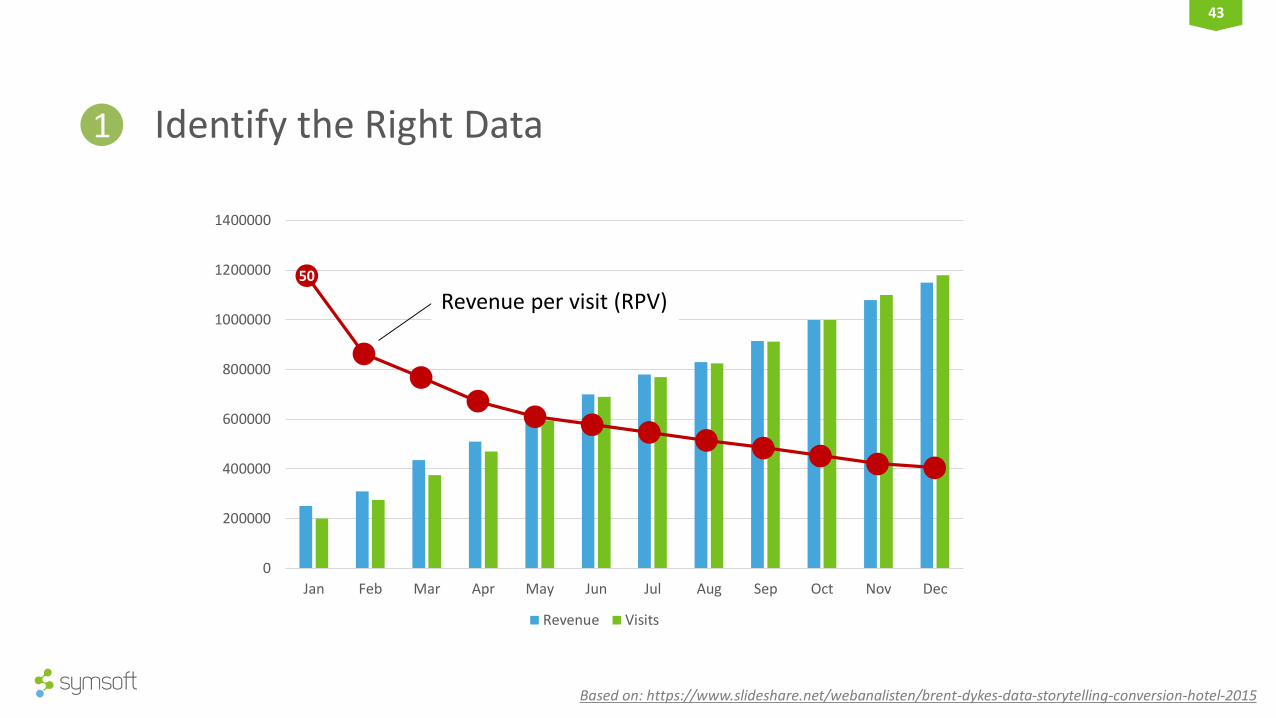
Identify the Right Data1
50
Revenue per visit (RPV)
Based on: https://www.slideshare.net/webanalisten/brent-dykes-data-storytelling-conversion-hotel-2015
44
0
200000
400000
600000
800000
1000000
1200000
1400000
Jan Feb Mar Apr May Jun Jul Aug Sep Oct Nov Dec
Revenue Visits
50
59
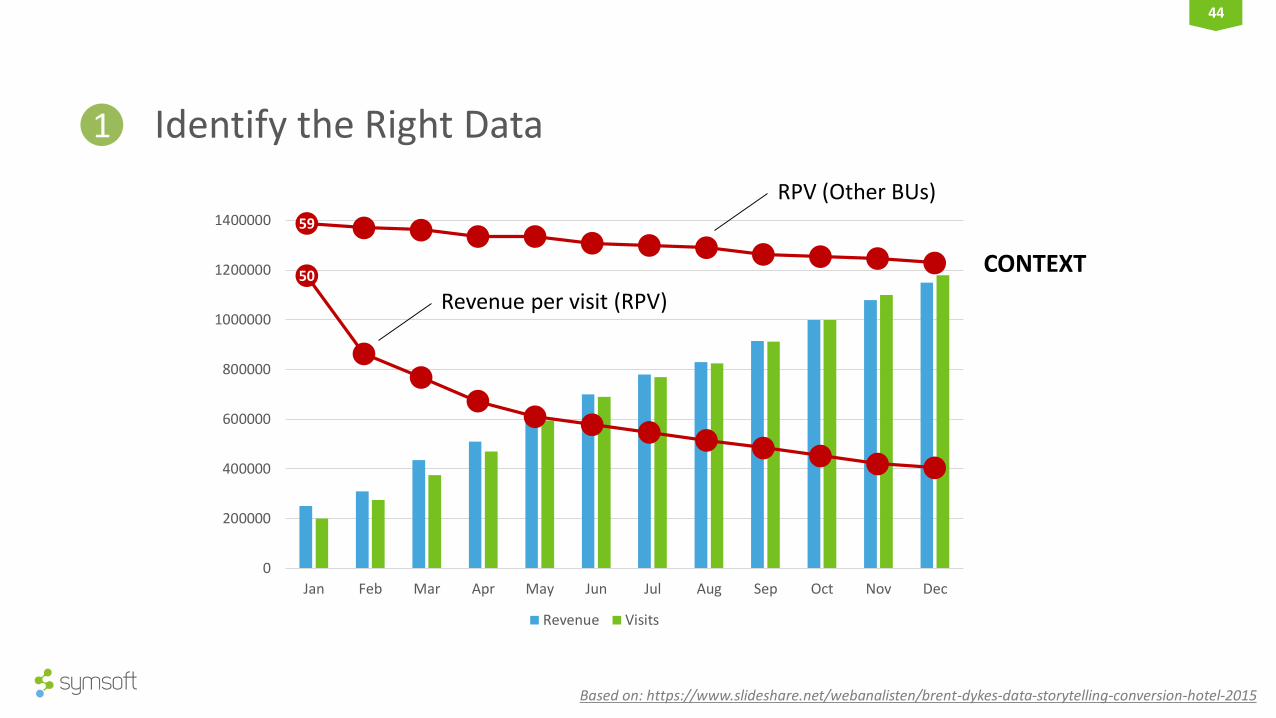
Identify the Right Data1
Revenue per visit (RPV)
RPV (Other BUs)
CONTEXT
Based on: https://www.slideshare.net/webanalisten/brent-dykes-data-storytelling-conversion-hotel-2015
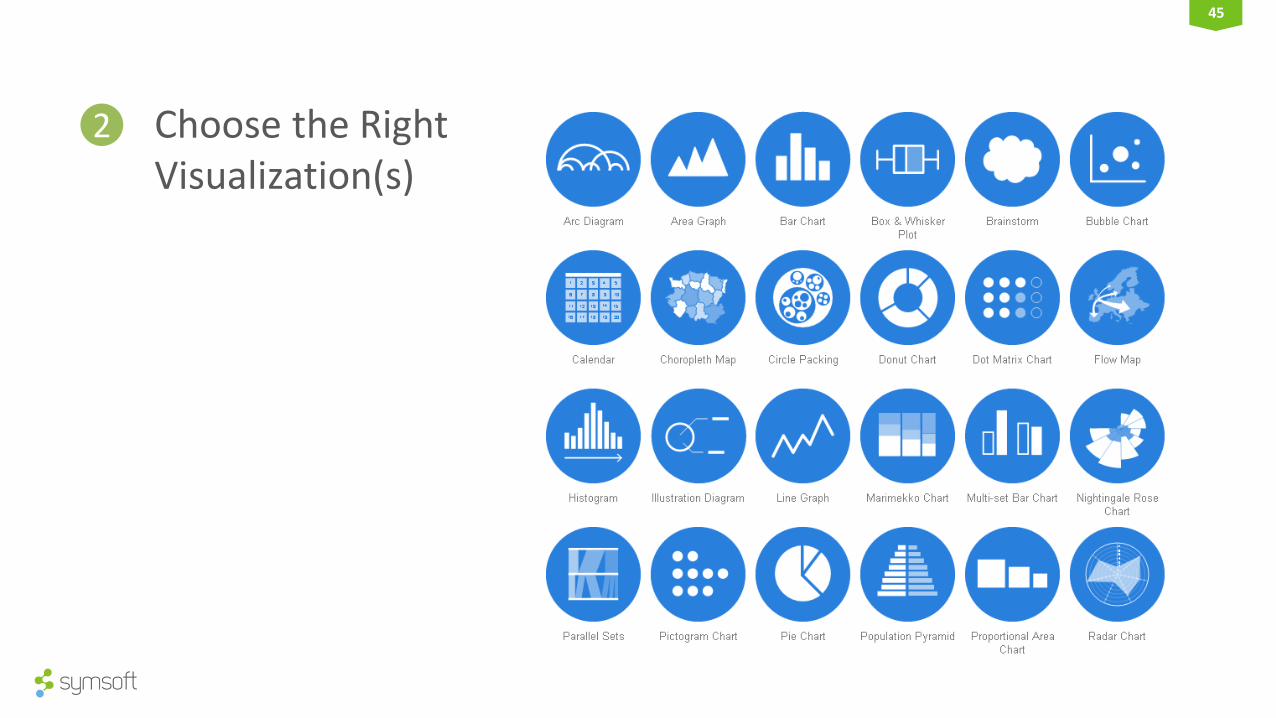
45
Choose the Right Visualization(s)
2

46
Choose the Right Visualization(s)
2
Facebook32%
Twitter29%
YouTube25%
LinkedIn9%
Google+5%
YouTube
Google+
0 10 20 30 40
“OK” BETTER
Based on: https://www.slideshare.net/webanalisten/brent-dykes-data-storytelling-conversion-hotel-2015
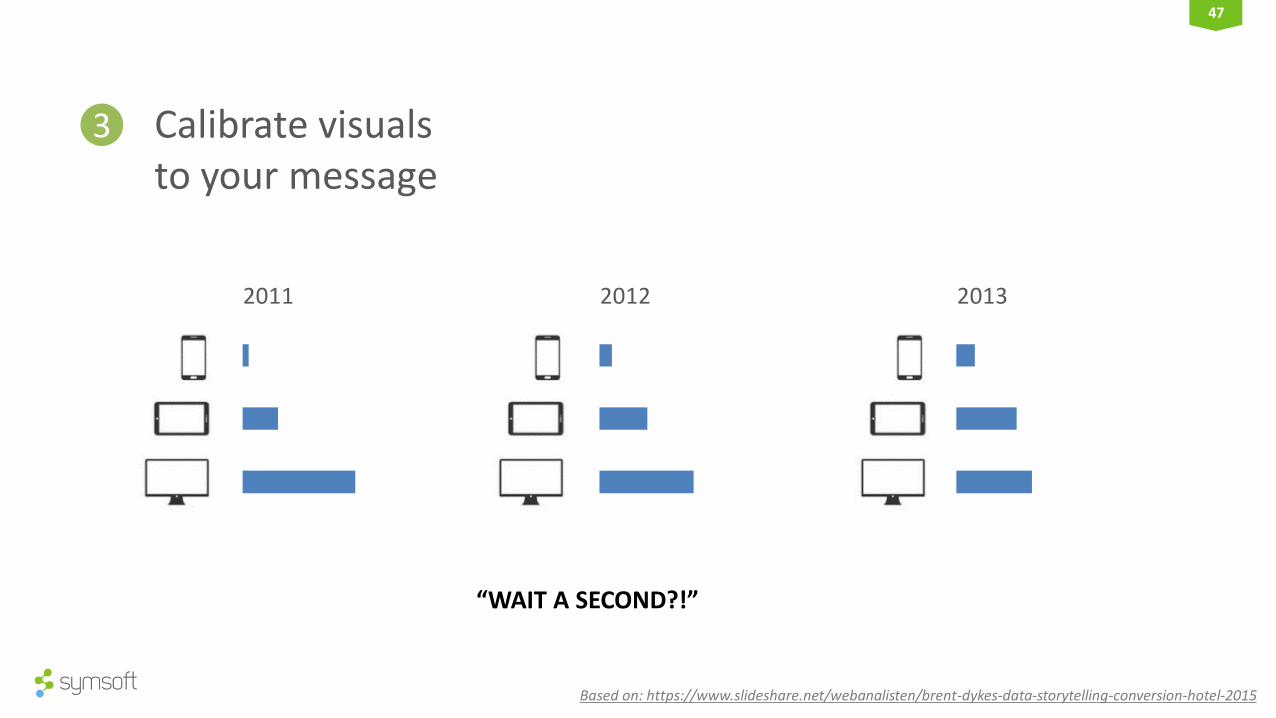
47
Calibrate visuals to your message
3
“WAIT A SECOND?!”
20132011 2012
Based on: https://www.slideshare.net/webanalisten/brent-dykes-data-storytelling-conversion-hotel-2015
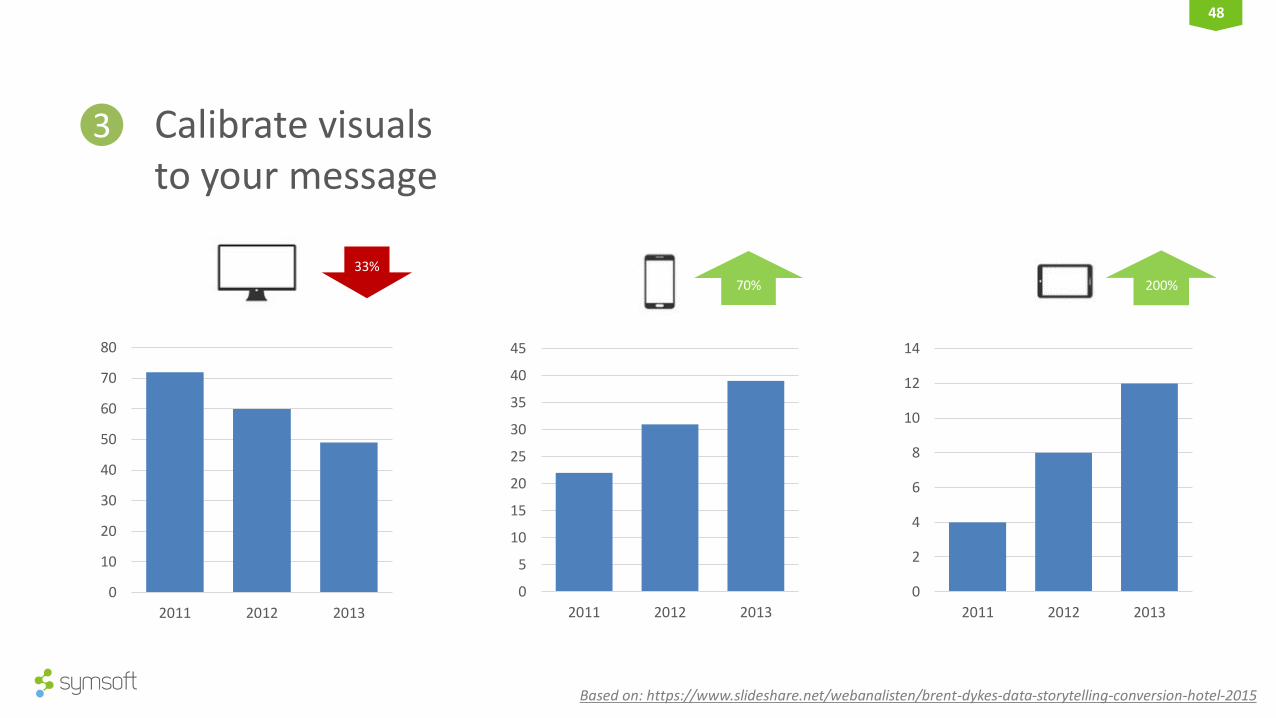
48
Calibrate visuals to your message
3
0
5
10
15
20
25
30
35
40
45
2011 2012 2013
0
10
20
30
40
50
60
70
80
2011 2012 2013
0
2
4
6
8
10
12
14
2011 2012 2013
70% 200%
33%
Based on: https://www.slideshare.net/webanalisten/brent-dykes-data-storytelling-conversion-hotel-2015
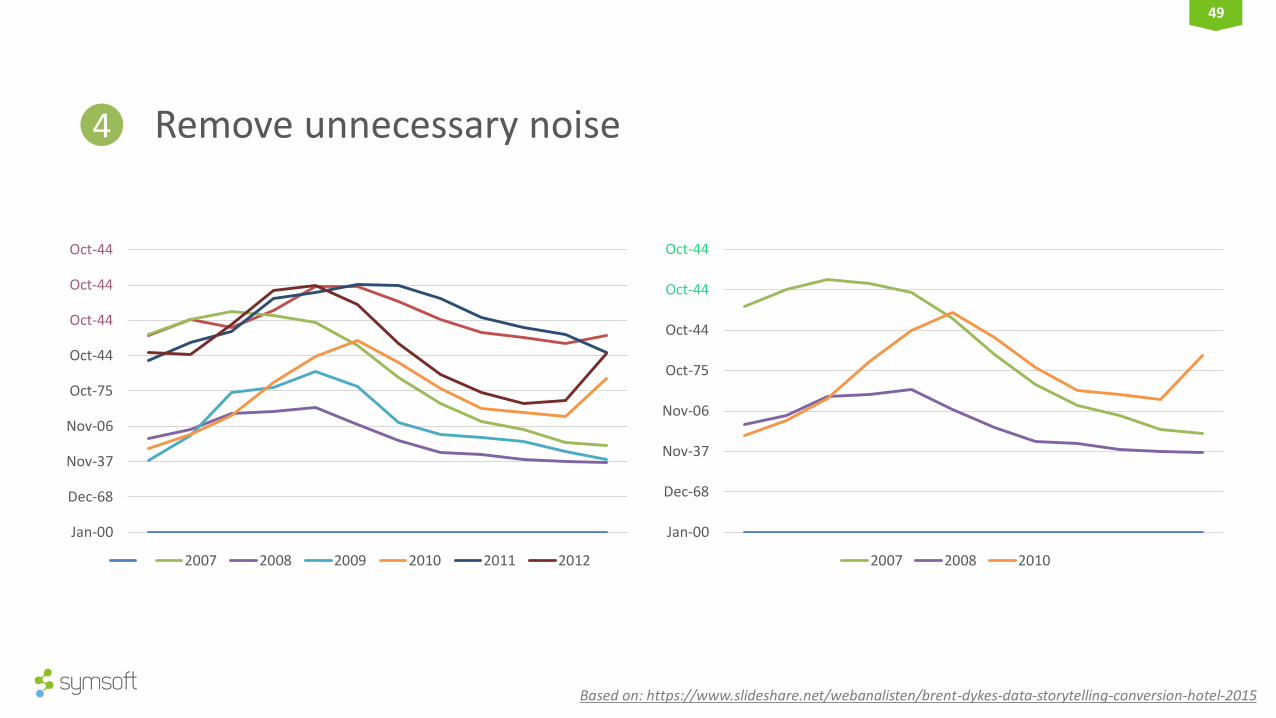
49
Remove unnecessary noise4
Jan-00
Dec-68
Nov-37
Nov-06
Oct-75
Oct-44
Oct-44
Oct-44
Oct-44
2007 2008 2009 2010 2011 2012
Jan-00
Dec-68
Nov-37
Nov-06
Oct-75
Oct-44
Oct-44
Oct-44
2007 2008 2010
Based on: https://www.slideshare.net/webanalisten/brent-dykes-data-storytelling-conversion-hotel-2015
50
Highlight what’s important5
0
500000
1000000
1500000
2000000
2500000
3000000
3500000
2010
Change in storage
+30%
-50%
-10%
GOT IT!
Based on: https://www.slideshare.net/webanalisten/brent-dykes-data-storytelling-conversion-hotel-2015
51
Make it easy to consume6
Jan-00
Dec-68
Nov-37
Nov-06
Oct-75
Oct-44
Oct-44
Oct-44
2007 2008 2010
ReservoirStorage (AF)
Max. Capacity
Normal year
High rain year
Low rain year
Based on: https://www.slideshare.net/webanalisten/brent-dykes-data-storytelling-conversion-hotel-2015
52
Draw the audience in your analysis – use interactivity
53
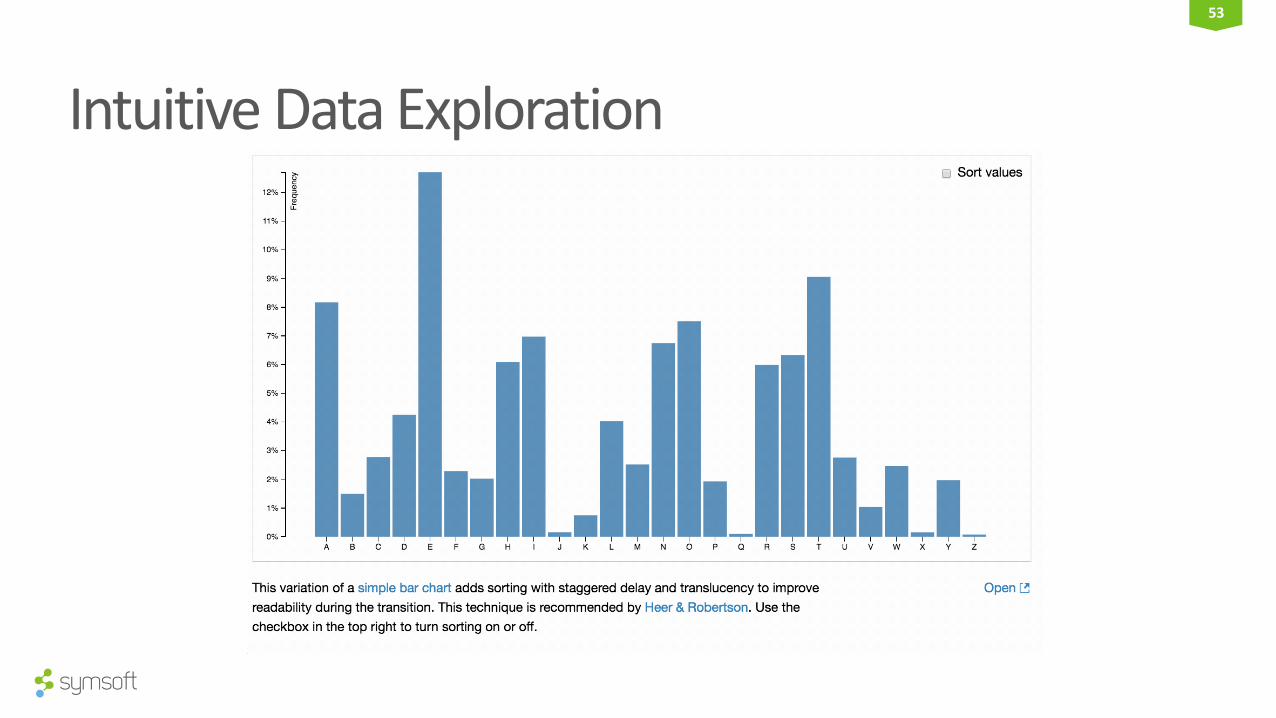
Intuitive Data Exploration
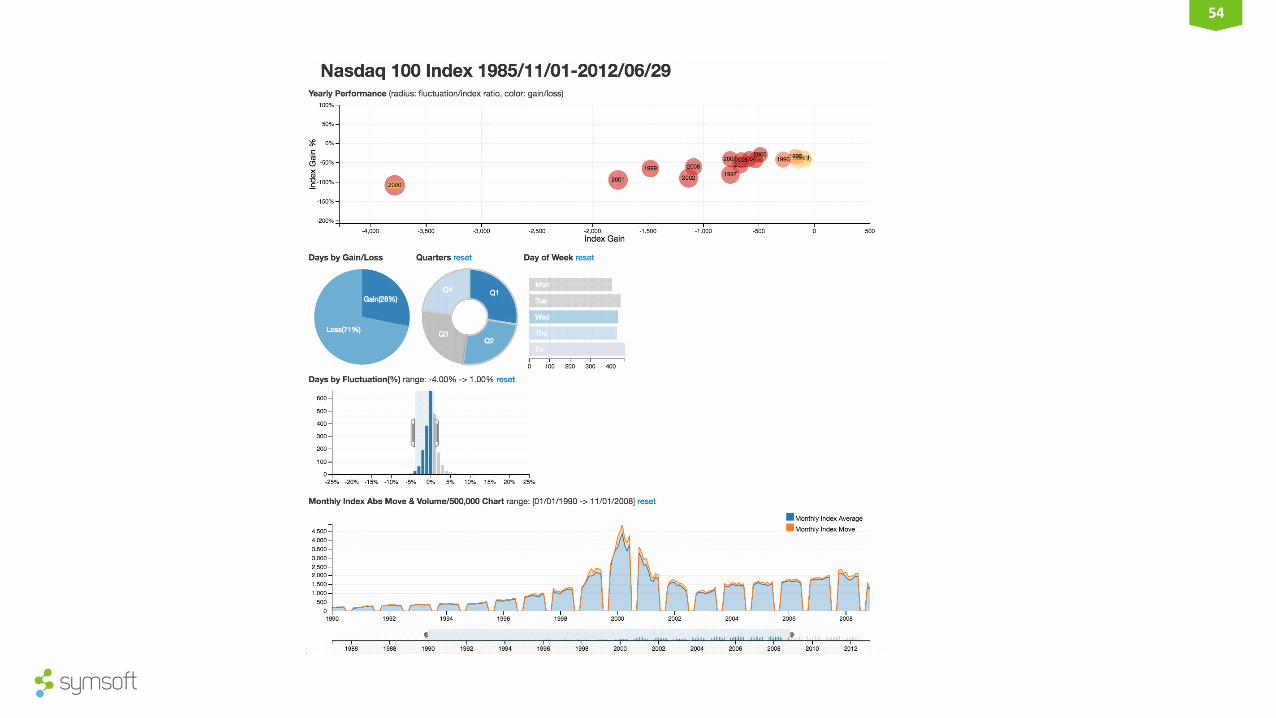
54

55
To re-cap…
56
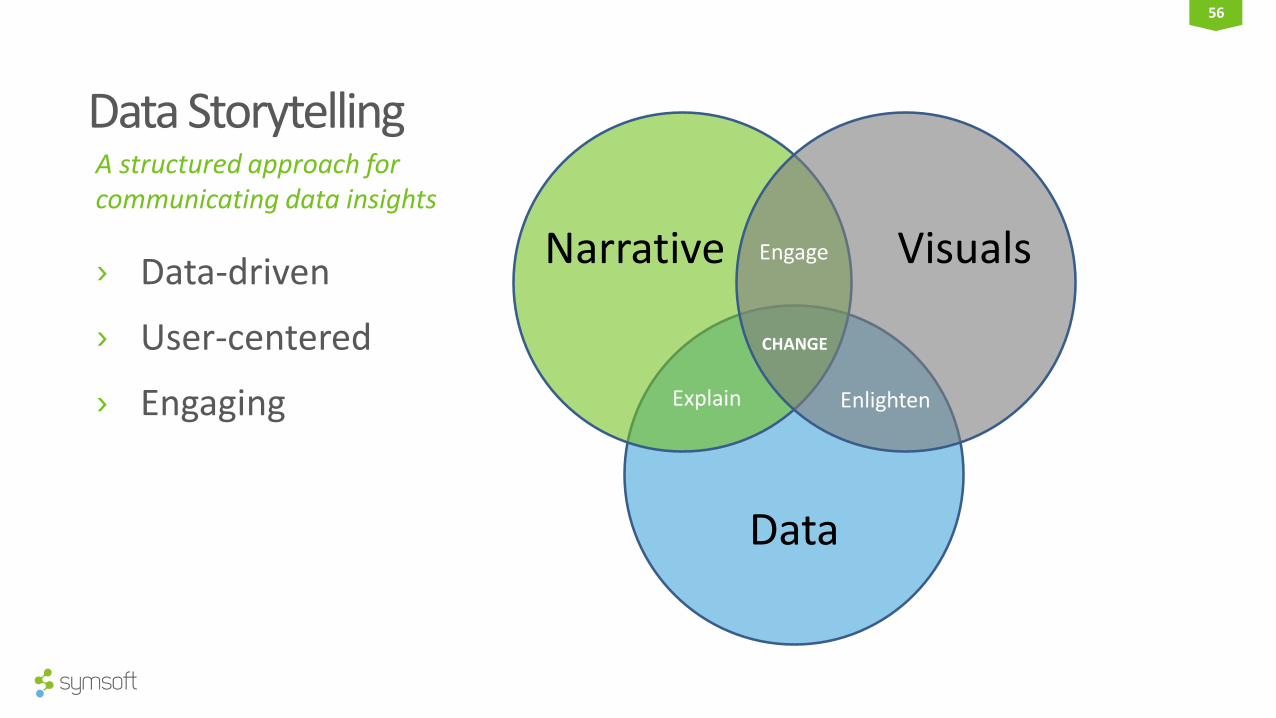
Data Storytelling
› Data-driven
› User-centered
› Engaging
A structured approach for communicating data insights
Data
Narrative Visuals
EnlightenExplain
Engage
CHANGE
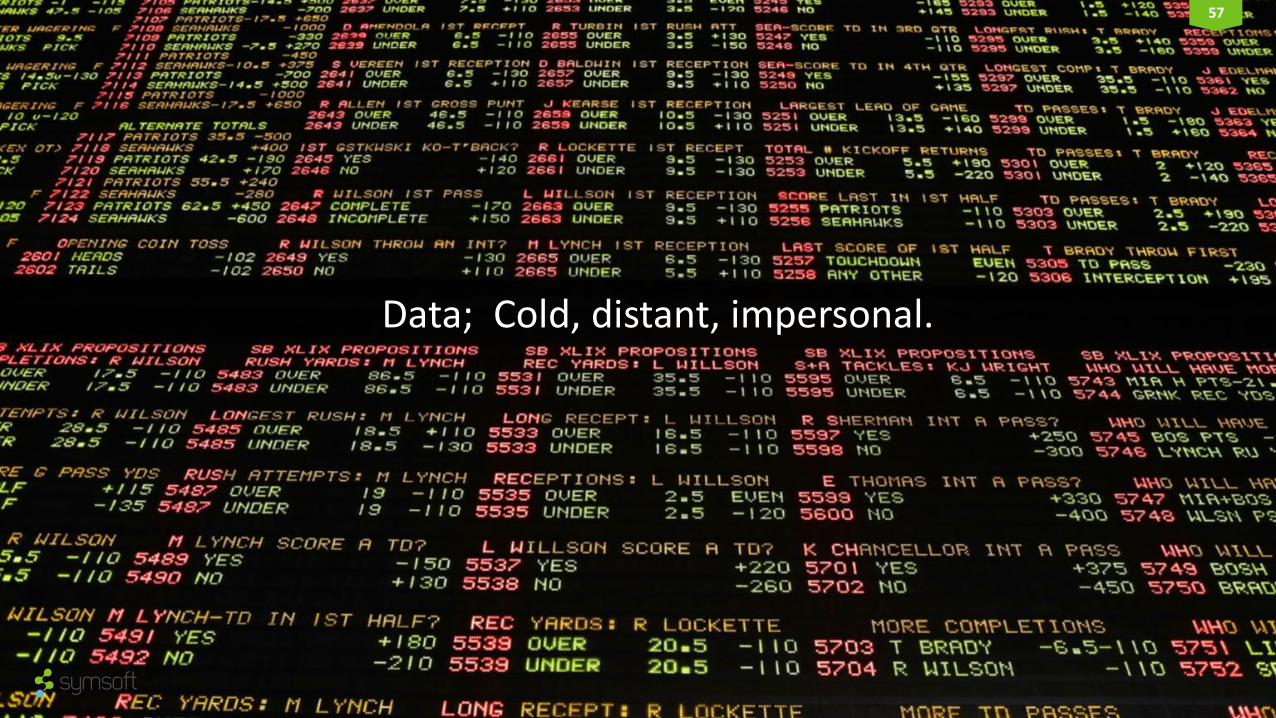
57
Data; Cold, distant, impersonal.
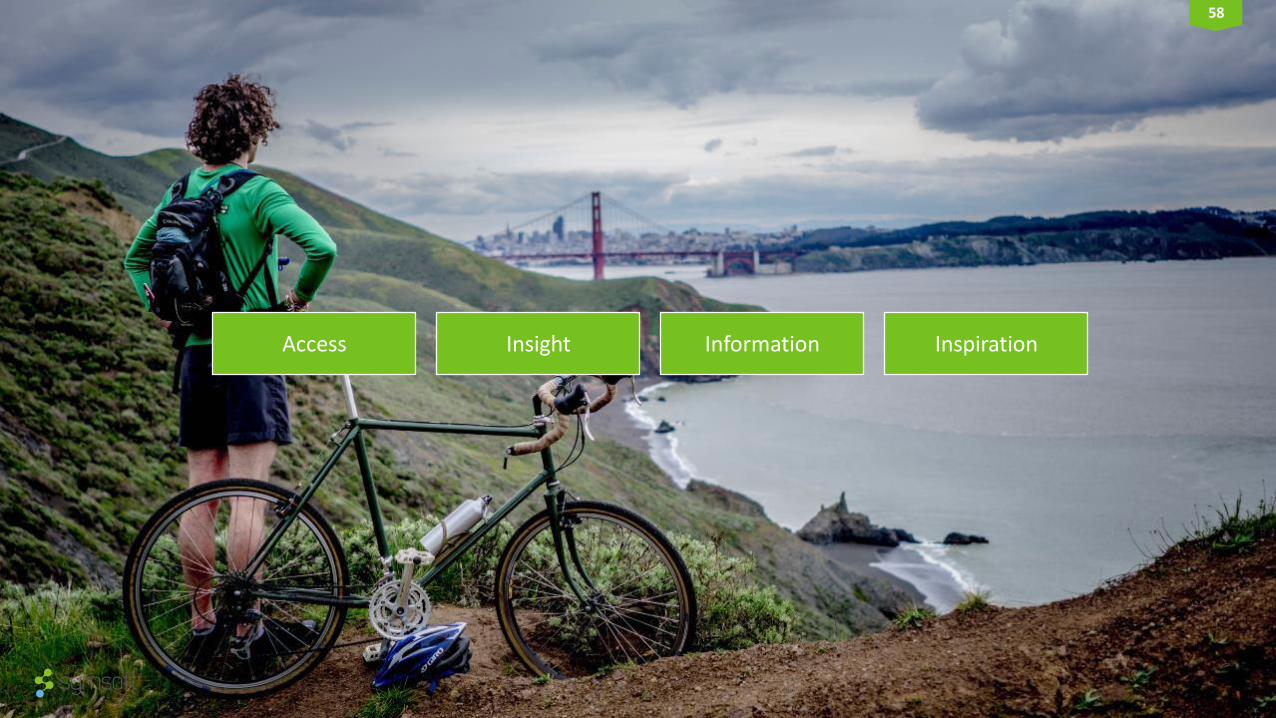
58
Access Insight Information Inspiration