data mining: tasks, techniques, applications luigi palopoli dimes, università della calabria...
TRANSCRIPT

Data Mining: tasks, techniques, applications
Luigi Palopoli
DIMES, Università della [email protected]

To provide a general overview of (some) data mining techniques
To (maybe indirectly) pointing to the potential usefulness of those techniques in the life sciences domain
To highlight what is missing (in my opinion) in order to make them effective and flexible “every-day” support tools to biologists
(I won’t go into any technical details!!)
Talk objectives and overview

Query
• Deductive approach
• Query languages are often logic-based
Data Mining
• Inductive approach
• the process of inspecting data with the goal of extracting useful hidden knowledge
• focuses on the efficient and accurate analysis of large collections of disk-stored data
Queries vs data mining

What is (not) Data Mining?
What is Data Mining?
• Certain names are more prevalent in certain locations
• Group together similar documents returned by search engine according to their content
• Discover structural regularities in biological graphs
What is not Data Mining?
• Look up phone number in phone directory
• Query a Web search engine for information about “genetics”

Advances in data collection and storage
• Vast amounts of data available
Extracting useful knowledge is challenging
• Traditional techniques are ineffective
Data Mining puts together
• Traditional data analysis methods
• Algorithms for processing large volumes of data
• Treatment of “new” types of data
Why Data Mining?

Lots of data is being collected and warehoused
• web data, e-commerce
• purchases at diverse stores
• bank/credit Card transactions
• telephone calls
Computers have become cheaper and more powerful
Competitive Pressure is Strong
• Customer profiling, targeted marketing, store layout, fraud detection, …
Why Mining Data?

Why Mining Data? Data collected and stored at
enormous speeds (GB/hour)
• remote sensors on a satellite
• telescopes scanning the skies
• biological data (sequences,microarrays, annotations and more)
• scientific simulations generating terabytes of data
Traditional techniques infeasible for raw data
Data mining may help scientists • in classifying and segmenting data• in hypothesis formation
(to be later verified “in the lab”)
Mining Large Data Sets
There is often information “hidden” in the data that is not readily evident
Human analysts may take years to discover useful information
Much of the data is not analyzed at all!

Draws ideas from Machine Learning, AI, Pattern Recognition, Statistics, and Database Systems
Origins of Data Mining
Machine Learning/Pattern
Recognition
ArtificialIntelligenc
e
Database Systems
Data Mining
Statistics

What is Data Mining?
Several definitions, amongst which:
• “Non-trivial extraction of implicit, previously unknown and potentially useful information from data”
• “Exploration and analysis, by automatic or semi-automatic means, of large quantities of data in order to discover meaningful patterns ”

Main phases (to be typically iterated):
• Pre-processing
• Data Mining
• Post-processing
Data analysis workflow (aka, KDD process)

Developed techniques may be unsuitable due to:
• Overwhelming data size Scalability
• Large data dimensionality (up to thousands attributes) the “curse” of dimensionality
• Heterogeneous and complex data needing integration, non-traditional data types
• Distributed data Data ownership, access&usage rights Distribution architectures and costraints
Challenges

Tasks
Prediction Methods
• Use some (independent) variables to predict unknown or future values of other variables (dependent or target)
Description Methods
• Find human-interpretable patterns that describe or characterize the data

Some data mining tasks...
ClassificationClusteringAssociation Rule Discovery Sequential Pattern DiscoveryRegressionOutlier DetectionOutlier explanation
And……Text mining

Classification
Learning from examples• Handwritten character recognition• Idea: train a machine to recognize characters from
examples
Given a collection of records (training set)• Each record contains a set of attributes, one of the
attributes is the class (target)• Classes: values of the class attribute (typically a
small set; if two, binary classifier)
Find a model for class attribute as a function of the values of other attributes

Classification
Goal: previously unseen records should be assigned to a class as accurately as possible
A test set is used to determine the accuracy of the model• Usually, the given data set is divided into
training and test sets, with training set used to build the model and test set used to validate it

Classification Example
categoric
al
categoric
al
contin
uous
class
TestSet
Training Set
ModelLearn
Classifier
Tid Refund MaritalStatus
TaxableIncome
Cheat
1 Yes Single 125K No2 No Married 100K No3 No Single 70K No4 Yes Married 120K No5 No Divorced 95K Yes6 No Married 60K No7 Yes Divorced 220K No8 No Single 85K Yes9 No Married 75K No10 No Single 90K Yes
Refund MaritalStatus
TaxableIncome
Cheat
No Single 75K ?
Yes Married 50K ?
No Married 150K ?
Yes Divorced 90K ?
No Single 40K ?
No Married 80K ?

Classification: Fraud Detection
Fraud Detection• Goal: Predict fraudulent cases in credit card
transactions• Approach:
Use credit card transactions and the information on its account-holder as attributes
• When does a customer buy, what does (s)he buy, how often (s)he refunds debits out of time, ...
Label past transactions as fraud or fair transactions. This forms the class attribute
Learn a model for the class of the transactionsUse this model to detect fraud by observing credit card
transactions on an account

Classification: Sky objects cataloging
Sky Survey Cataloging
• Goal: To predict a class of sky objects based on the telescopic survey images
• Approach:Segment images Measure image attributes (features – maybe 40
or more per object)Model the class of the celestial oject based on
these features
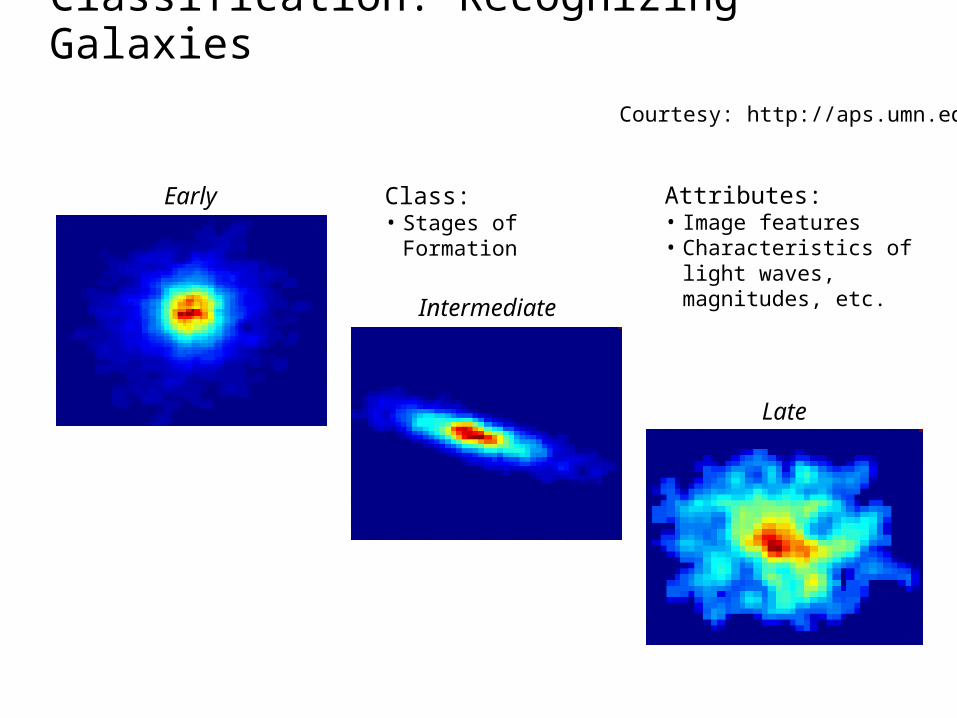
Classification: Recognizing Galaxies
Early
Intermediate
Late
Class: • Stages of Formation
Attributes:• Image features• Characteristics of light
waves, magnitudes, etc.
Courtesy: http://aps.umn.edu

Classification: Longevity
Find a classification model for predicting longevous individuals from their genetic profiles
Genetic loci are considered (e.g., APOA1, APOA4, APOB, APOE, HSP70-1, HSP90α, HSP90β, SIRT3, TH, and mtDNA) as features
A set of longevous individuals (age >= 90) is used as the training set

Metagenomics
• Studies genomic sequences obtained directly by sampling an environment
• For these samples, species and genera present in the sample are largely unknown
• The goal of sequencing is to determine the microbial composition as precisely as possible

Classification: metagenomics
Sequence classification algorithms based on sequence alignment and classification techniques are employed to associate taxonomic labels to reads
Classification tree: with sequences classified as belonging to tree leaves

Clustering
Given a set of data points and a similarity measure among them, find clusters such that• Data points in one cluster are much similar
to one another• Data points in separate clusters are much
dissimilar to one another
Example Similarity Measures:• Euclidean Distance if attributes are
continuous

Clustering
Euclidean Distance Based Clustering in 3-D space.
Intracluster distancesare minimized
Intracluster distancesare minimized
Intercluster distancesare maximized
Intercluster distancesare maximized

A note: supervised vs. unsupervised techniques
Supervised techniques• Examples are available
Classification is supervisedClasses are pre-defined (as well as their
number)
Unsupervised techniques• No examples
Clustering is unsupervisedClusters are not pre-defined

Clustering: Group Documents
Document Clustering:
• Goal: To find groups of documents dealing with similar subjects
• Approach: To identify frequently occurring terms in each document. Form a similarity measure based on the frequencies of different terms. Use it to cluster
• Information Retrieval can utilize the clusters to relate a new document or search term to clustered documents (recommendation techniques)
Clustering: Longevity
Genetic profiling longevous individuals:
• To find groups of longevous individuals that are similar to each other
• Again, genetic loci can be considered as features
• Longevous individuals clustered together are characterized by similar genetic profiles

Clustering: Metagenomics
• Supervised methods make an implicit assumption that genomes used during the training are representative of microbeic populations to be found
• This assumption is violated by many metagenomic samples
• Clustering can be required when publicly available genomes are a poor fit to data to be analyzed

Association Rule Induction
Given a set of records each of which contains some number of items from a given collection the objective is to produce dependency rules which will predict occurrence of an item based on occurrences of other items
Rules Discovered: {Milk} --> {Coke} {Diaper, Milk} --> {Beer}
Rules Discovered: {Milk} --> {Coke} {Diaper, Milk} --> {Beer}
TID Items
1 Bread, Coke, Milk
2 Beer, Bread
3 Beer, Coke, Diaper, Milk
4 Beer, Bread, Diaper, Milk
5 Coke, Diaper, Milk

Association Rule Induction: Shelf Management
Supermarket shelf management• Goal: To identify items that are bought together by
“many” customers
• Approach: Process the point-of-sale data collected with barcode scanners to find dependencies among items
• A classic ruleIf a customer buys diaper and milk, then he is very likely
to buy beerImplies, for instance, that those items are put close to
one another on the shelves (or maybe far from one another!!!)

Association Rules Inductions: individuals’ profiling
• Produce dependency rules which will predict occurrence of given phenotypic characteristics (longevity, height, predisposition to depression, etc.) on the basis of the individual’s genetic profile.

Regression
Predict a value of a given continuous valued variable based on the values of other variables, assuming a linear or non-linear model of dependency
Largely studied in statistics
Examples:• Predicting sales amounts of new product based
on advertising expenditure• Predicting wind velocities as a function of
temperature, humidity, air pressure, etc.• Time series prediction of stock market indices
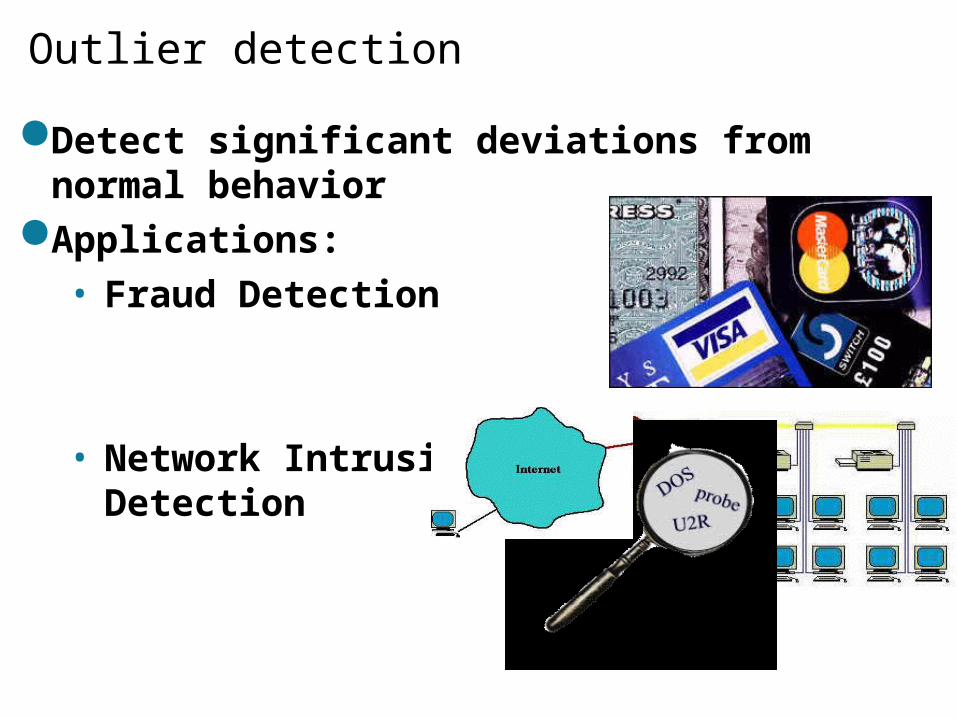
Outlier detection
Detect significant deviations from normal behavior
Applications:
• Fraud Detection
• Network Intrusion Detection

Outlier detection
Outliers are data objects whose characteristics are considerably different than most of the other data objects in the data set

Outlier detection
In many contexts outliers are considered as noise that must be eliminated
NOTE: Predictive accuracy of classifiers is affected by noise and clusters can get be distorted by it
BUT…..
“One individual’s noise could be another individual’s signal” ….. YES INDEED!!!

Outlier detection: another note on supervision
• Supervised: a training set containing observations labeled as inlier or outlier is available
• Semi-supervised: a training set containing onlyinliers is given
• Unsupervised: search for outliers in an unlabelled dataset
– Assign a “score” to each object which reflects its “degree” ofabnormality

Outlier explanation
• Given a population, the outlier detection task is to find the “abnormal” objects
• Given a population and an outlier, the outlier explanation task consists finding theproperties acconting for the abnormality of that object w.r.t. that data population

Outlier explanation: the longevity example
Given the genetic profile of a longevous individual and a set of genetic profiles of individuals passed over at “usual” age, to find out what, in the genetic characteristics, distinguishes the longevous individual from the others

Outlier explanation
•Property: A combination of one or more attributes whose behavior on the outlier is anomalous •Explanation: A sub-population of individuals •Given a population DS and one single individual o of DS known to be outlier, find the exceptional property-explanation pairs of o justifying its abnormality

Outlier explanation
For example…..
Result 1:Explanation: SEX =“F”APOE = 0.995; HSP90-β = 0.972
Result 2:Explanation: SEX =“M”APOE = 0.970; SIRT3 = 0.995; APOA1 = 0.992

DM approaches: can they be effective in the life science domains?
Data generation, from:• DNA, RNA sequences• Proteins (sequences, structures, interactions)• Small compounds• ……..
often completed by annotation text files
so that tons of data have been gathered and stored

Biological datasets: how they look like?
• Typically, samples got large number of variables (RNA, Proteins, lipids, etc.)
• Gathered data structures may vary much with the data generation scenario (sequences, microarrays, graphs,…..)
• Usually codable as (multi- or mono-) relational databases
• Effective approaches to data integration and exchange are often much needed

Biological datasets: how they look like?
• Each variable indicates (usually quantitatively) the presence of an element in a sample
• If (variables >> samples), over-fitting problems are induced in model generation techniques
• Missing data and erroneous data may puzzle data mining techniques
Analyzing bio-datasets
• If samples are annotated with a class label (e.g., wealthy vs. ill patients), the classification task can be a natural choice to generate prediction models from the data

Further examples of extractable knowledge (other than class prediction)
• Key components identification (e.g., biomarkers using rule induction)
• Structure descriptions (e.g., regularities and surrounding contexts)
• Data clusters• Interaction prediction• Sequence and graph motifs• Data sequences (streams)

Normalisation and preprocessing
• Usually, significant efforts must be paid on data preprocessing
• Normalize data• Missing data• Data cleaning• Data integration
• We need more techniques for these tasks tailored on the bio-data realm

Combining data analysis with text databases
• Lots of information is publicly available that can validate/complement the data mining process (e.g, Pubmed, KEGG,…..)
• Also, textual databases can be mined on their own to extract, for instance, data tables or to construct document clusters

DM approaches: are they effective in the life science domains?Biological data are diverse in structure (sequences, networks, arrays, ….) each needing specific processing (and pre-processing!!!) techniques for each chosen data mining task
Methodological problems to be faced (data source selection, data source cleaning, approaches to result assessment and process iteration)

DM approaches: can they be effective in the life science domains?
On the one hand: Several application-specific data-mining techniques have been succesfully developed, but are difficult to generalize
On the other hand: General data mining methodologies and techniques were developed to work on “traditional” databases and not on (more peculiar) biological data sets

DM approaches: can they be effective in the life science domains?
This produces an application/approach mismatch that should be solved, taking into account that the success of data mining tools for “traditional” applications has largely relied on their generality and flexibility

Summarizing……
1.Need for flexible and accurate results-assessment methodologies and measures
2.Need for general bio-dataset-oriented data cleaning and data integration tools
3.Need for new approaches (tasks, techniques, methodologies) for mining large datasets produced by high-throughput technologies, maybe exploiting (non database-conventional) data formats

Main phases (to be typically iterated):
• Pre-processing
• Data Mining
• Post-processing
The Bio KDD process…..?
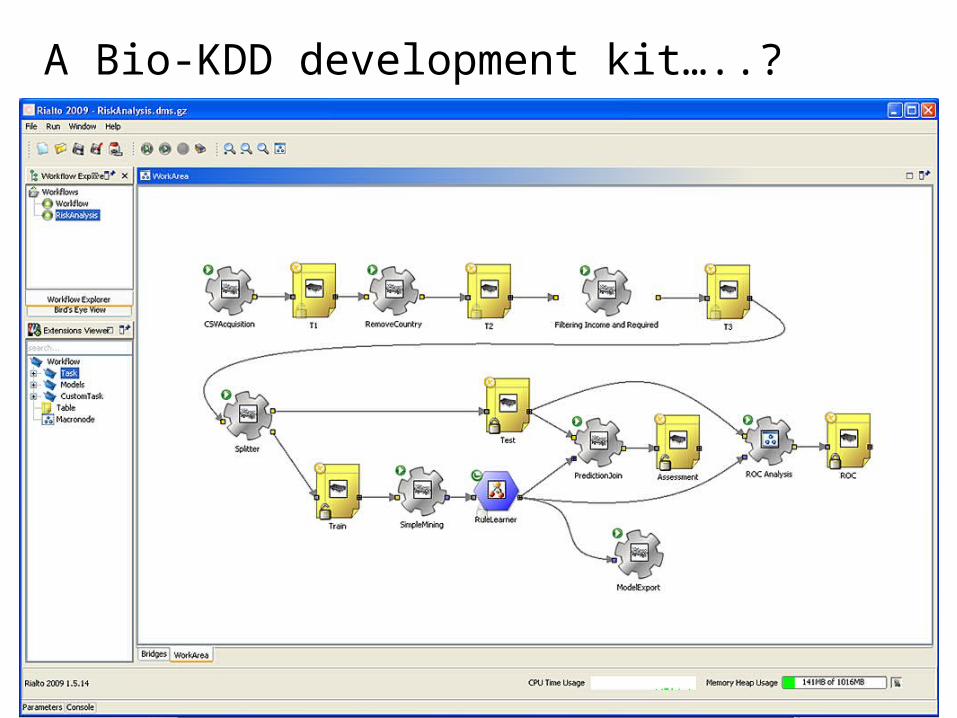
A Bio-KDD development kit…..?

Any further problems to
pinpoint?

Alkemio: ranking thousands of chemicals for any topics using document categorization. Gijón-Correas et al., 2014
CAFE: detects chromosomal abnormalities from DNA microarray expression data. Bollen et al. 2014.
NYCE: predicts subcellular location of eukaryotic proteins based on their sequence. Mer and Andrade-Navarro, 2013.
uORFdb: a literature database on upstream open reading frame (uORF) biology. Wethmar et al., 2013.
Some recent tools (incomplete list)

CellFinder: study annotations, bibliography, gene and protein expression in stem cells and derivatives. Stachelscheid et al., 2013.
PESCADOR: extract and analyse a network of gene and protein interactions from a set of Medline abstracts. Barbosa-Silva et al., 2011.
PDBpaint: a visualization webservice to tag protein structures with sequence annotations. Fournier and Andrade-Navarro, 2011.
QiSampler: evaluate alternative scoring schemes for list of items (e.g. genes) based on a very small set of positives. Fontaine et al., 2011.
Génie: ranking all the genes of your favorite species for any topic in a few seconds using orthology information. Fontaine et al., 2011.
Recent tools (an incomplete list)

THANKS FOR YOUR ATTENTION