data mining introduction - statistics departmentstine/mich/dm_01.pdfdata mining introduction bob...
TRANSCRIPT
Wharton Department of Statistics
Data MiningIntroduction
Bob StineDept of Statistics, Wharton School
University of Pennsylvania
www-stat.wharton.upenn.edu/~stine
Wharton Department of Statistics
What is data mining?• An insult?
• Predictive modeling• Large, wide data sets, often unstructured• Automatic, complex models
Networks, trees, ensembles… “black boxes”Exploit results from theory... universal models, random projections, multiview learning
• Prediction rather than explanationAssociation and prediction rather than cause and effect
• Testable claims• Science requires making claims that are testable• Claimed predictive accuracy provides such a test
2
What is magic?
Wharton Department of Statistics
Data Mining in Social Sci• Poor match to social science?• Empiricism run wild, lack of theory or hypotheses• Post hoc inference
• Response• Need to leverage technology
Tukey comments on cost of theory vis-a-vis cost of computing
• HonestA better match to what most of us do in practice
• DiagnosticHave I missing something?
• Deep connectionsMultidimensional scaling, likelihood, modern regression
3
Wharton Department of Statistics
Plan• Week 1• Data mining with regression, logistic regression• Illustrate key ideas in familiar context
• Week 2• Alternative methods• Trees, networks, ensemble methods
Boosting and bagging
• Syllabus• Hands-on: Lab sessions each week• Annotated bibliography• July 4
4
Wharton Department of Statistics
Software• Must do statistics to learn statistics
• Modern computing provides• New ways to look at old things, like regression• New approaches to data analysis
• Packages• JMP from SAS
Front-end to SAS Enterprise MinerAvailable on Newberry systems
• R• Others: Stata, SPSS, Weka,…
5
Wharton Department of Statistics
My Background• Time series analysis• Effects of modeling on forecast accuracy• Bootstrap resampling
• Model selection in general• Predictive models in credit, health
• Recent• Alternative methods for building regression• Combining traditional data and text
• Long time ‘friend’ of Summer Program• Political science and voting behavior
6
t-shirts
Wharton Department of Statistics
Research Questions• What question do you want to answer?• Can your data provide an answer?
• Questions from science, business• Who’s most at risk of a disease?• What’s going to happen in financial markets?• Are any of these people dishonest?
• Social science questions: voting behavior• Will this person vote if I get them to register?• Whom will this registered voter choose?• Whom would those who didn’t vote choose?
7
Question to guide analysis
Ideal data?
Wharton Department of Statistics
2008 ANES Survey• Background of survey ICPSR #25383• Two waves, every two years
• Questions• Categorical responses
Did you vote? For whom?• Numerical responses
How much do you like this candidate
• Why are these interesting?• Get out the vote, phone banks• Role of participation in election…
Would those who didn’t vote change things?
• Is the ANES ideal data?• Missing data, self-reported, interviewer effects...
8
90/10 rule
Wharton Department of Statistics
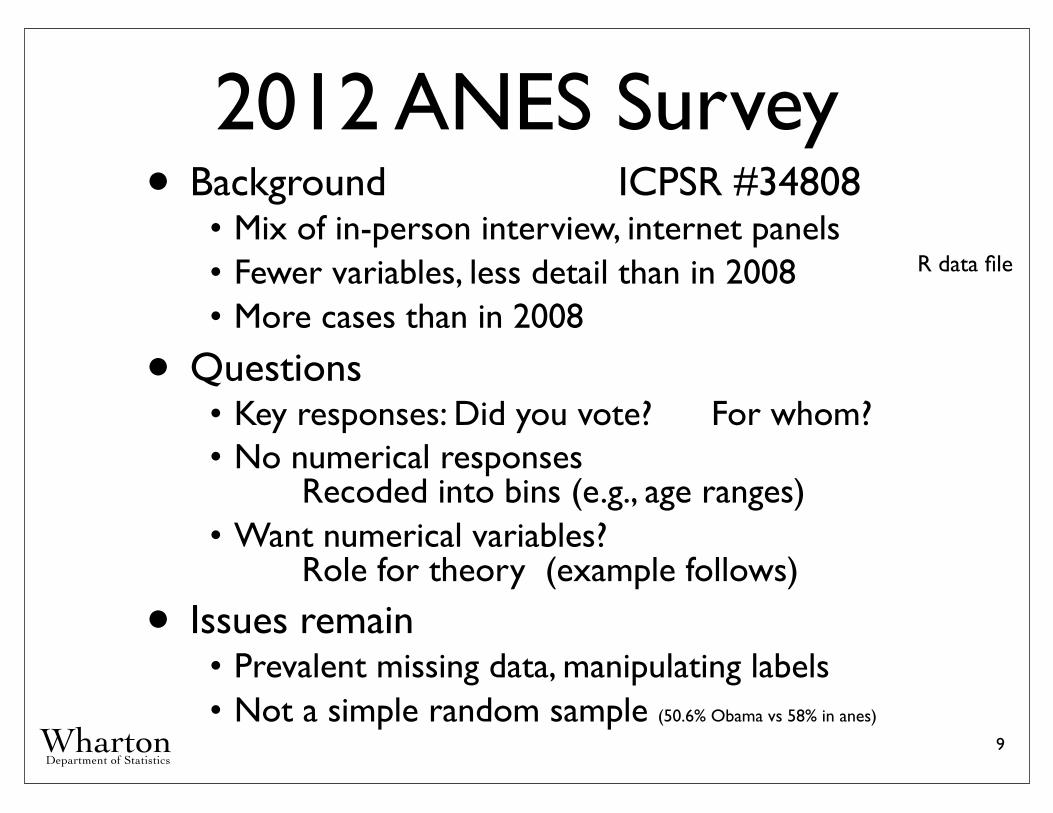
2012 ANES Survey• Background ICPSR #34808• Mix of in-person interview, internet panels• Fewer variables, less detail than in 2008• More cases than in 2008
• Questions• Key responses: Did you vote? For whom?• No numerical responses Recoded into bins (e.g., age ranges)• Want numerical variables? Role for theory (example follows)
• Issues remain• Prevalent missing data, manipulating labels• Not a simple random sample (50.6% Obama vs 58% in anes)
9
R data file
Wharton Department of Statistics
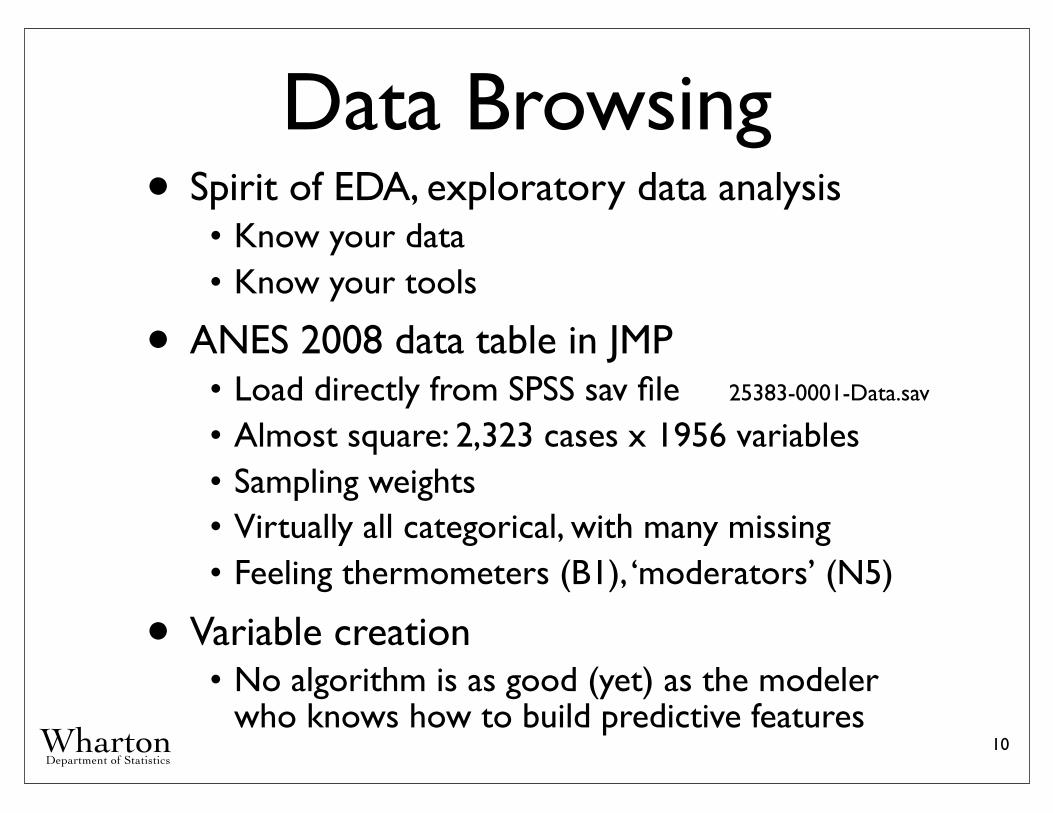
Data Browsing• Spirit of EDA, exploratory data analysis• Know your data• Know your tools
• ANES 2008 data table in JMP • Load directly from SPSS sav file 25383-0001-Data.sav
• Almost square: 2,323 cases x 1956 variables• Sampling weights• Virtually all categorical, with many missing• Feeling thermometers (B1), ‘moderators’ (N5)
• Variable creation• No algorithm is as good (yet) as the modeler
who knows how to build predictive features10
Wharton Department of Statistics
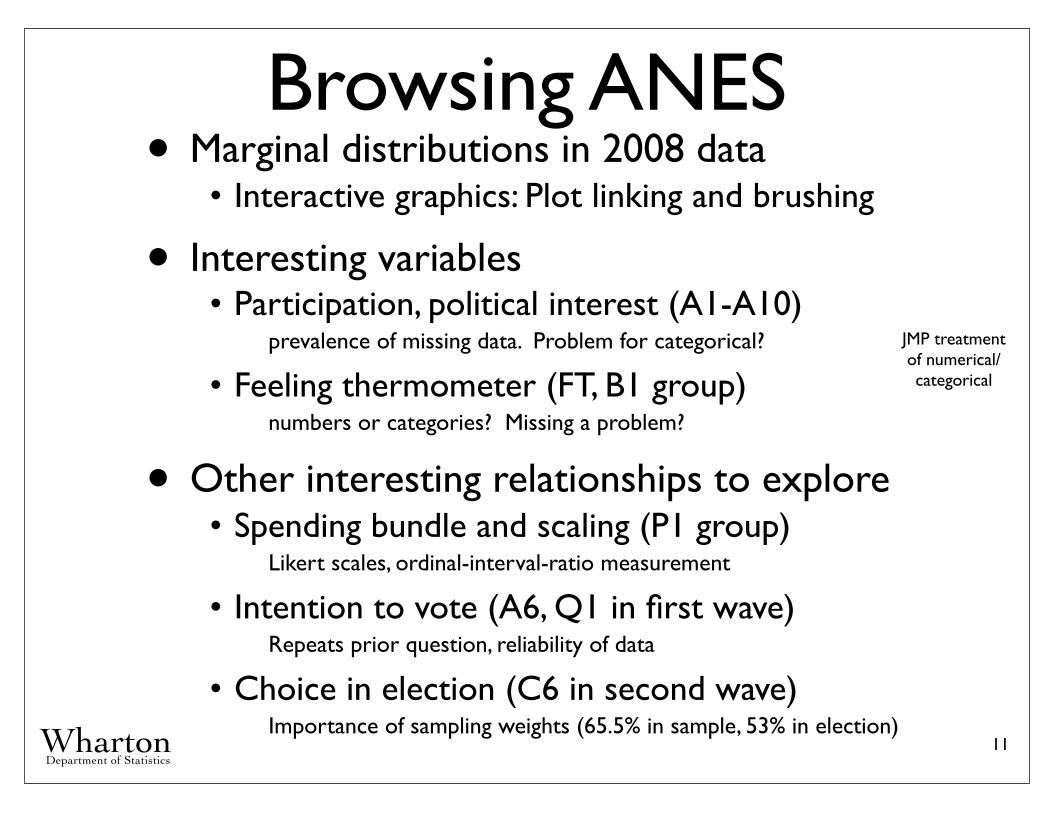
Browsing ANES• Marginal distributions in 2008 data• Interactive graphics: Plot linking and brushing
• Interesting variables• Participation, political interest (A1-A10)
prevalence of missing data. Problem for categorical?
• Feeling thermometer (FT, B1 group)numbers or categories? Missing a problem?
• Other interesting relationships to explore• Spending bundle and scaling (P1 group)
Likert scales, ordinal-interval-ratio measurement
• Intention to vote (A6, Q1 in first wave)Repeats prior question, reliability of data
• Choice in election (C6 in second wave)Importance of sampling weights (65.5% in sample, 53% in election)
11
JMP treatment of numerical/categorical
Wharton Department of Statistics
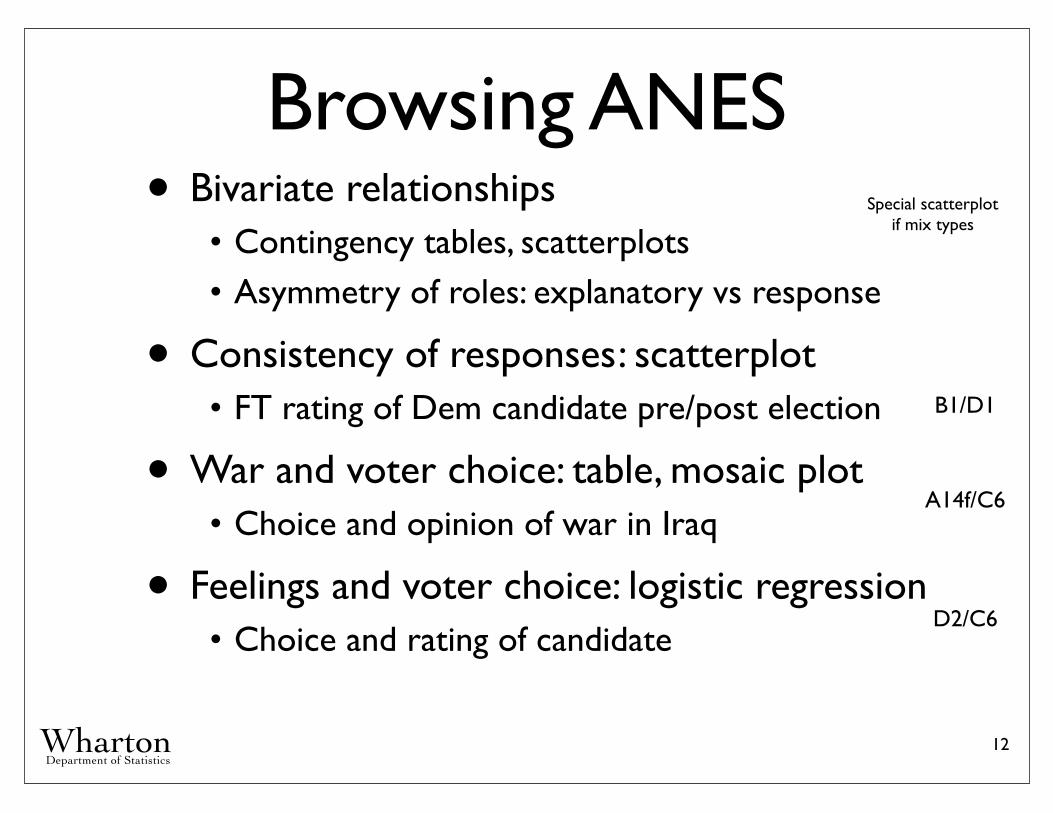
Browsing ANES• Bivariate relationships• Contingency tables, scatterplots • Asymmetry of roles: explanatory vs response
• Consistency of responses : scatterplot • FT rating of Dem candidate pre/post election
• War and voter choice: table, mosaic plot• Choice and opinion of war in Iraq
• Feelings and voter choice: logistic regression• Choice and rating of candidate
12
Special scatterplot if mix types
B1/D1
A14f/C6
D2/C6
Wharton Department of Statistics
“All models are wrong, but some are useful”
Box
Models• What is a statistical model?
• Model• Simplification of reality• Facilitate answering specific types of questions• Example: Maps
Map for driving directions versus subway map
• What is a statistical model?• Data generating process• Probability model describing a random mechanism
• Link to theory• Test theory’s claims for features of model
13
Wharton Department of Statistics
Assumptions• Models make two types of assumptions• systematic structure linear equation in regression• “unexplained” variation (a) Independent (b) Equal uncertainty (c) Bell shaped
• Which make sense within the context of this model using the ANES data?• Does it matter if the assumption is not met?
• Why do we make such assumptions?14
Wharton Department of Statistics
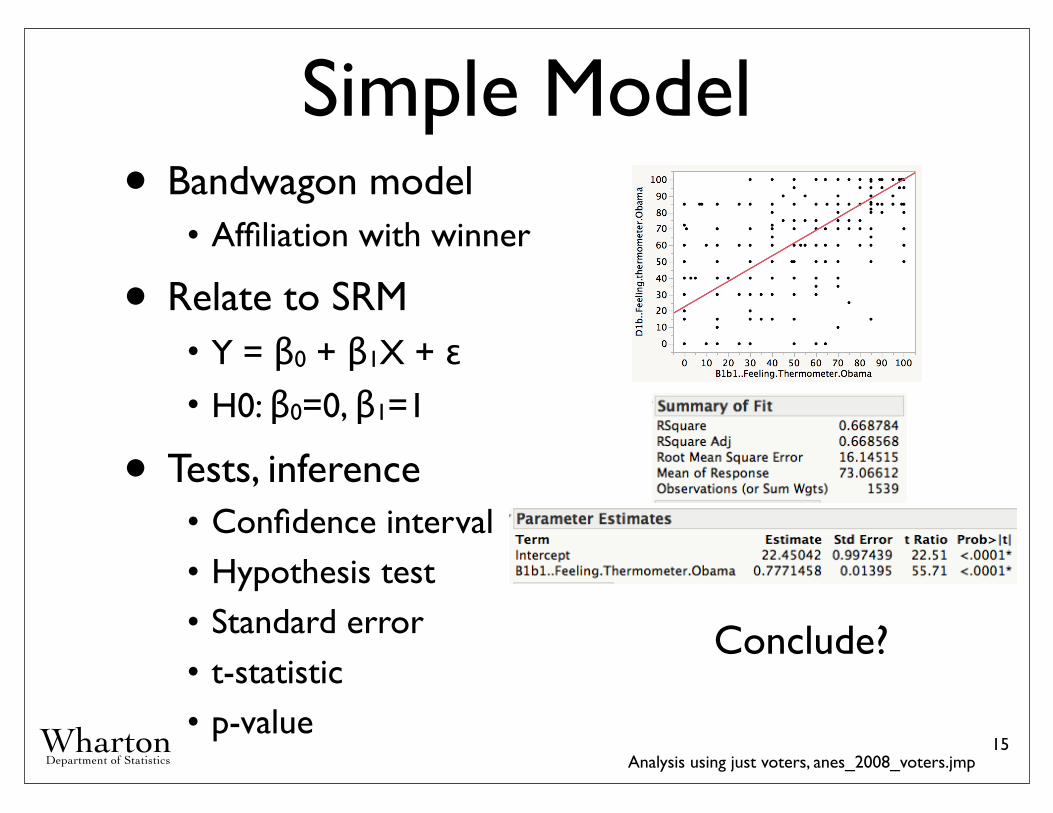
Simple Model• Bandwagon model• Affiliation with winner
• Relate to SRM• Y = β0 + β1X + ε• H0: β0=0, β1=1
• Tests, inference• Confidence interval• Hypothesis test• Standard error• t-statistic• p-value
15
Conclude?
Analysis using just voters, anes_2008_voters.jmp
Wharton Department of Statistics
Bootstrapping• Standard error is key to inference• What are standard errors?
• BS is alternative method for obtaining standard errors and confidence intervals• Estimates standard error by simulation• Sampling with replacement from observed
distribution of data
• Implementation• R ‘bootstrap’ package - also easy to do yourself• Throughout JMP
Control click.
16
Wharton Department of Statistics
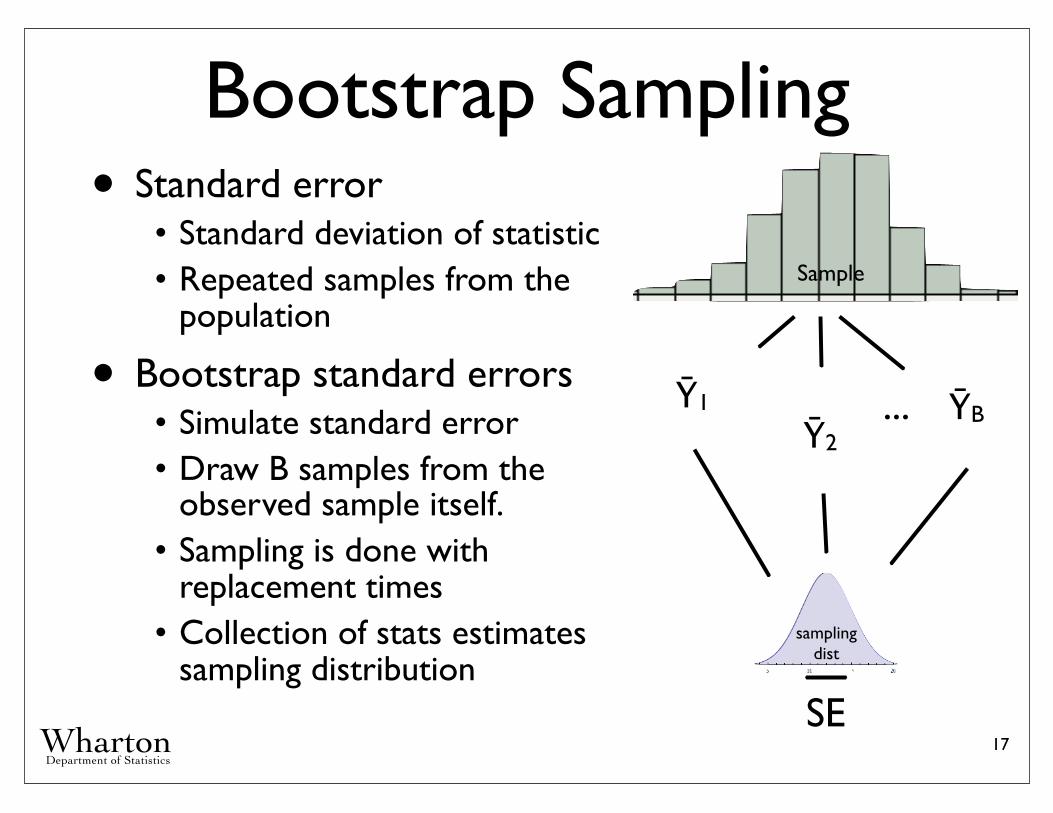
Bootstrap Sampling• Standard error• Standard deviation of statistic• Repeated samples from the
population
• Bootstrap standard errors• Simulate standard error• Draw B samples from the
observed sample itself.• Sampling is done with
replacement times• Collection of stats estimates
sampling distribution
17
Ȳ2
Ȳ1 ȲB...
SE
population
sampling dist
Sample
Wharton Department of Statistics
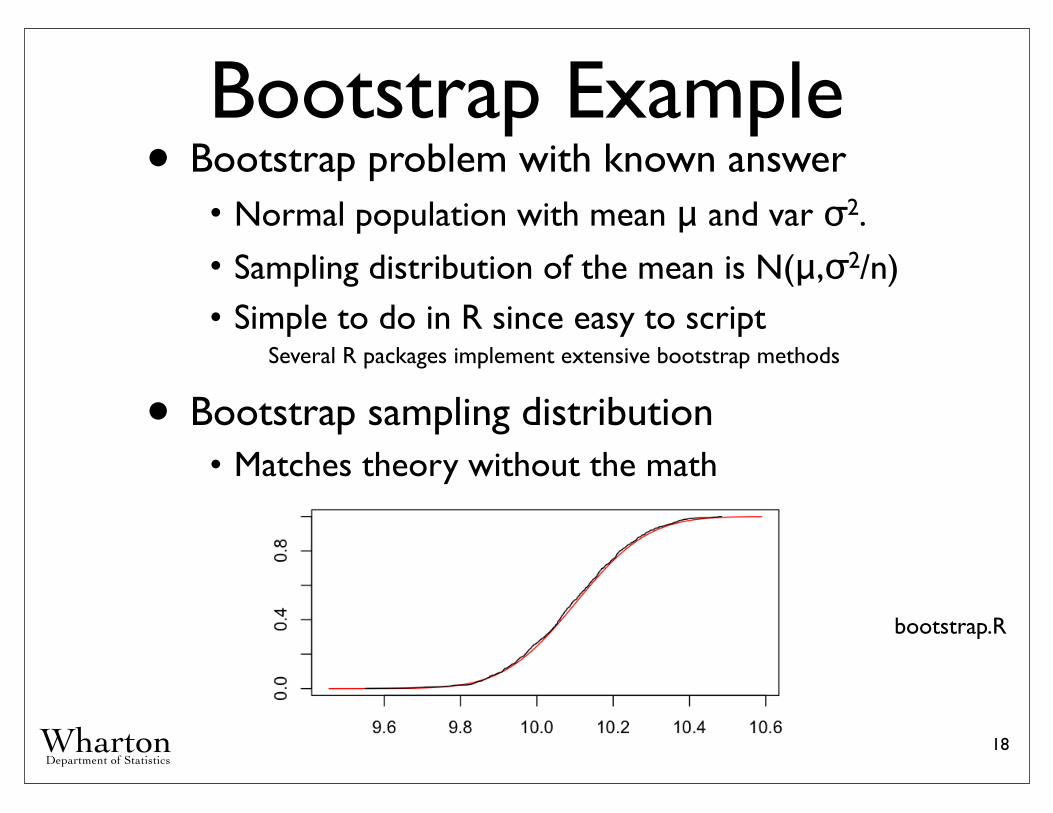
Bootstrap Example• Bootstrap problem with known answer• Normal population with mean μ and var σ2.
• Sampling distribution of the mean is N(μ,σ2/n)• Simple to do in R since easy to script
Several R packages implement extensive bootstrap methods
• Bootstrap sampling distribution• Matches theory without the math
18
bootstrap.R
Wharton Department of Statistics
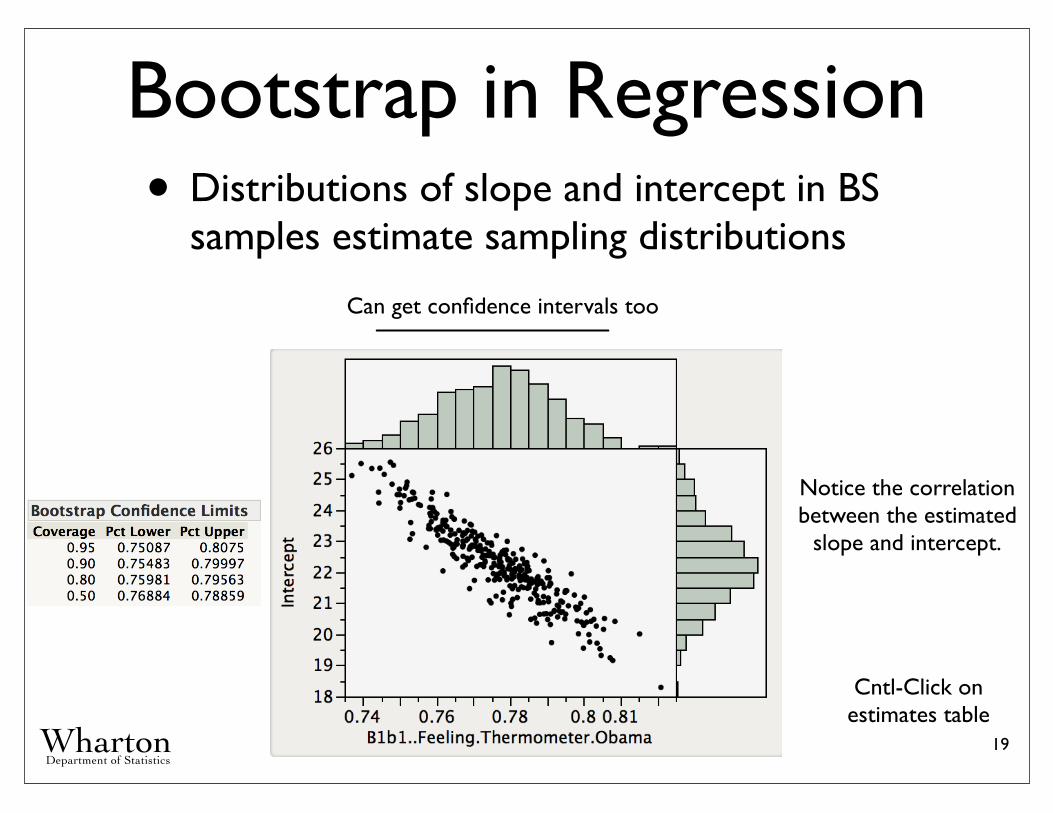
Bootstrap in Regression• Distributions of slope and intercept in BS
samples estimate sampling distributions
19
Can get confidence intervals too
Notice the correlation between the estimated
slope and intercept.
Cntl-Click on estimates table
Wharton Department of Statistics
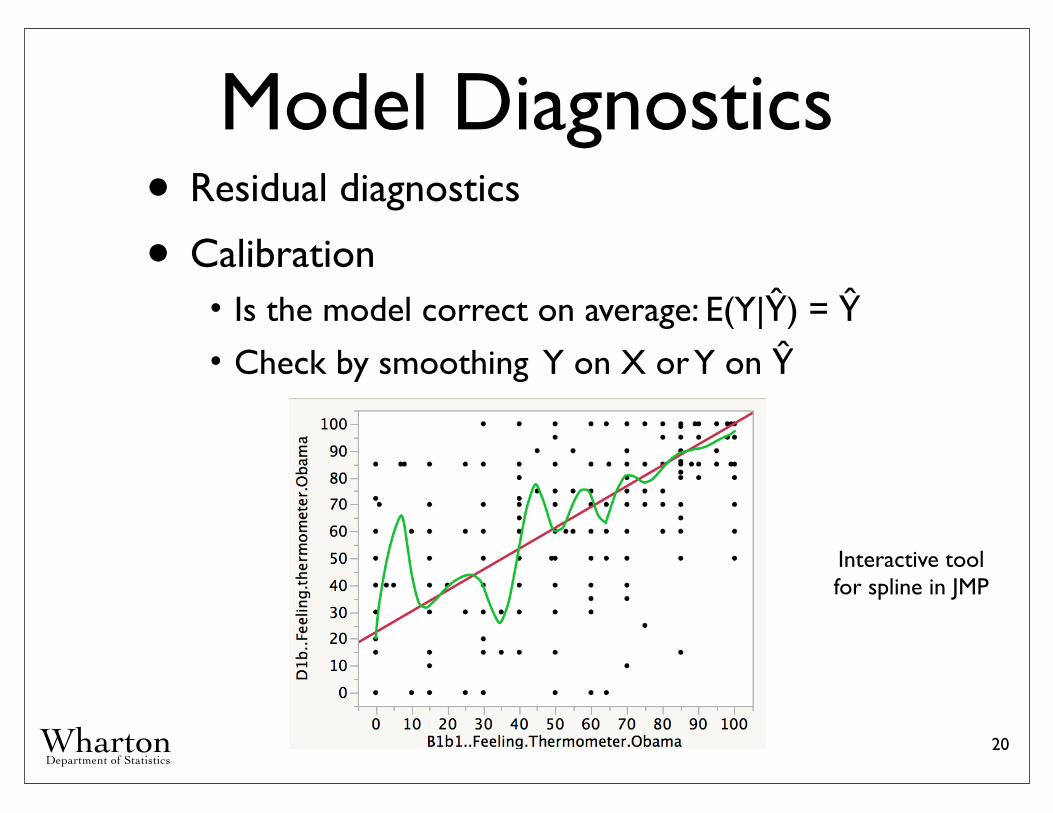
Model Diagnostics• Residual diagnostics
• Calibration• Is the model correct on average: E(Y|Ŷ) = Ŷ• Check by smoothing Y on X or Y on Ŷ
20
Interactive tool for spline in JMP
Wharton Department of Statistics
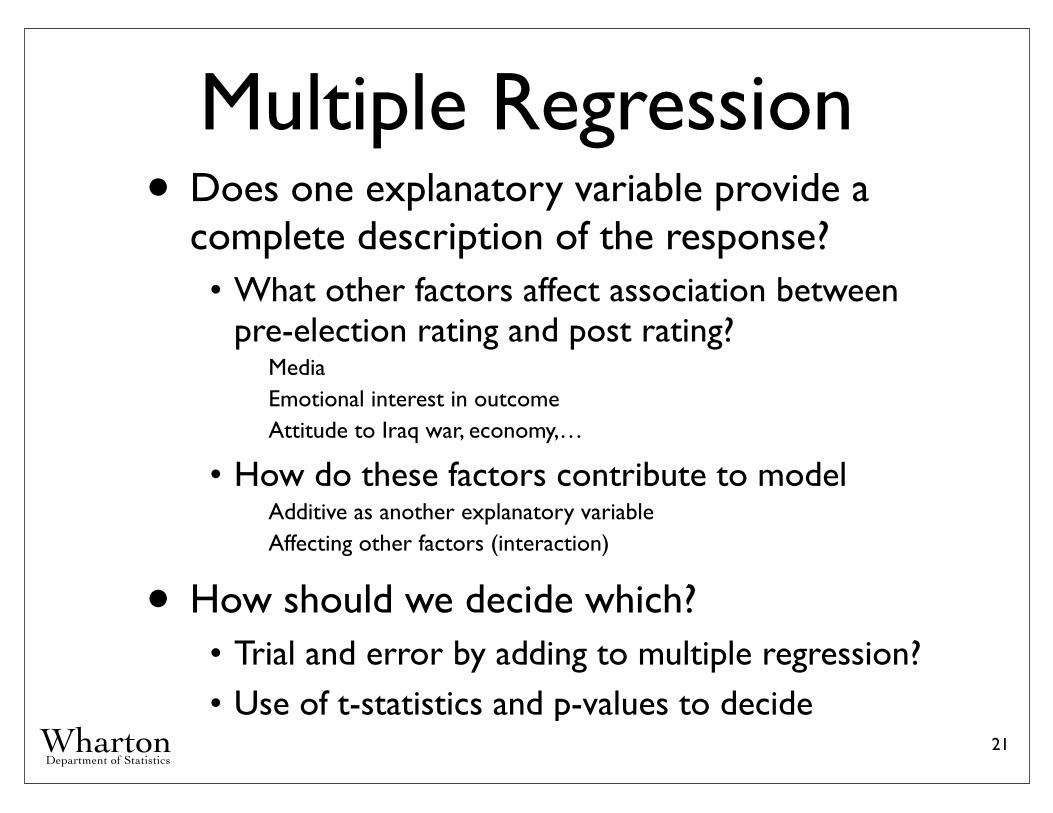
Multiple Regression• Does one explanatory variable provide a
complete description of the response?• What other factors affect association between
pre-election rating and post rating?MediaEmotional interest in outcomeAttitude to Iraq war, economy,…
• How do these factors contribute to modelAdditive as another explanatory variableAffecting other factors (interaction)
• How should we decide which?• Trial and error by adding to multiple regression?• Use of t-statistics and p-values to decide
21
Wharton Department of Statistics
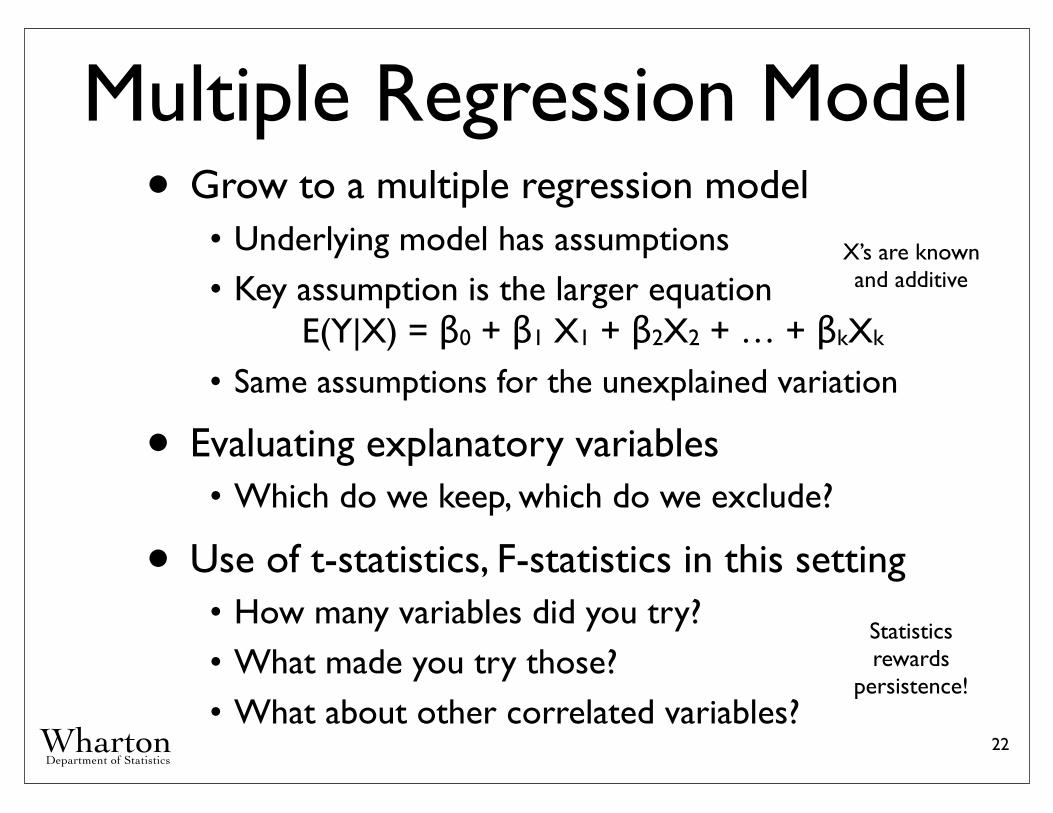
Multiple Regression Model• Grow to a multiple regression model • Underlying model has assumptions• Key assumption is the larger equation E(Y|X) = β0 + β1 X1 + β2X2 + … + βkXk
• Same assumptions for the unexplained variation
• Evaluating explanatory variables• Which do we keep, which do we exclude?
• Use of t-statistics, F-statistics in this setting• How many variables did you try?• What made you try those?• What about other correlated variables?
22
X’s are known and additive
Statistics rewards
persistence!
Wharton Department of Statistics
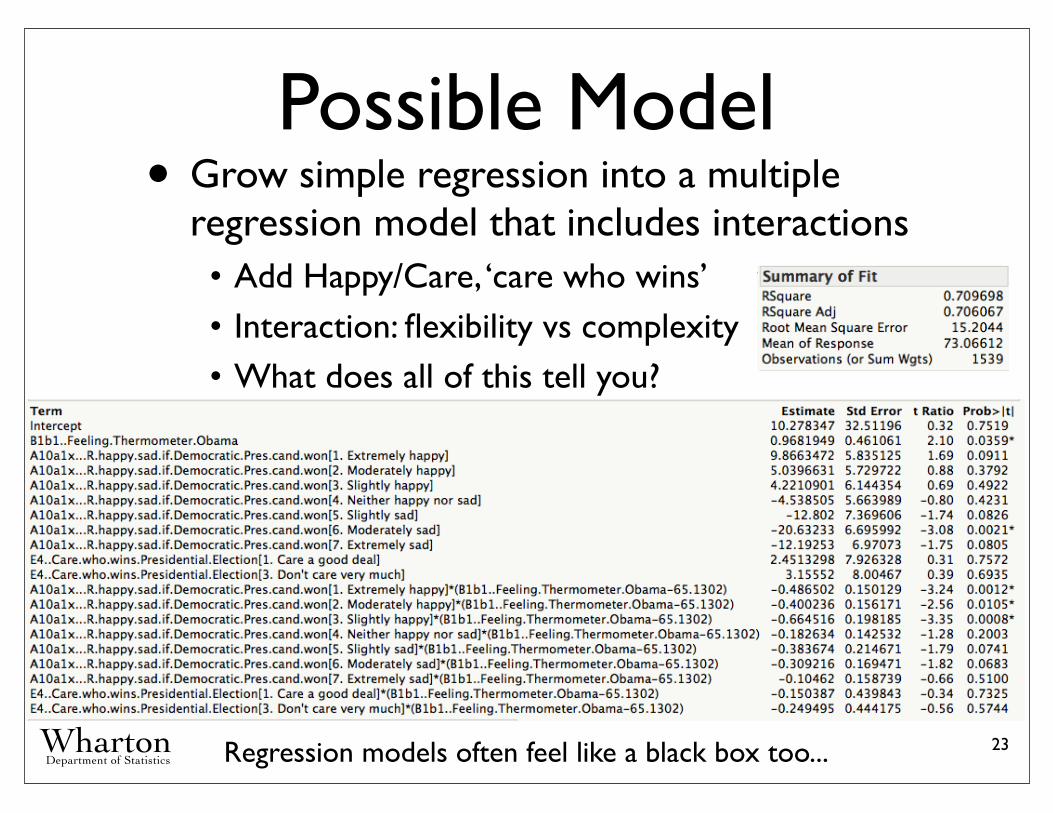
Possible Model• Grow simple regression into a multiple
regression model that includes interactions• Add Happy/Care, ‘care who wins’• Interaction: flexibility vs complexity• What does all of this tell you?
23Regression models often feel like a black box too...
Wharton Department of Statistics
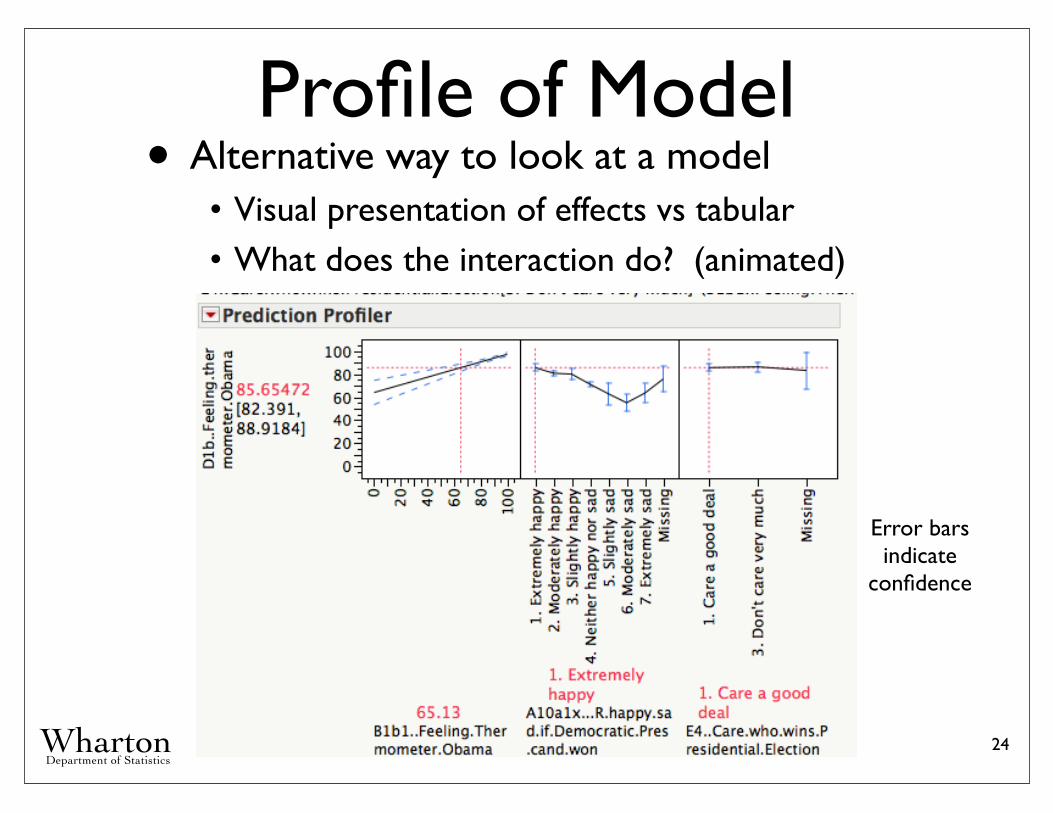
Profile of Model• Alternative way to look at a model• Visual presentation of effects vs tabular• What does the interaction do? (animated)
24
Error bars indicate
confidence
Wharton Department of Statistics
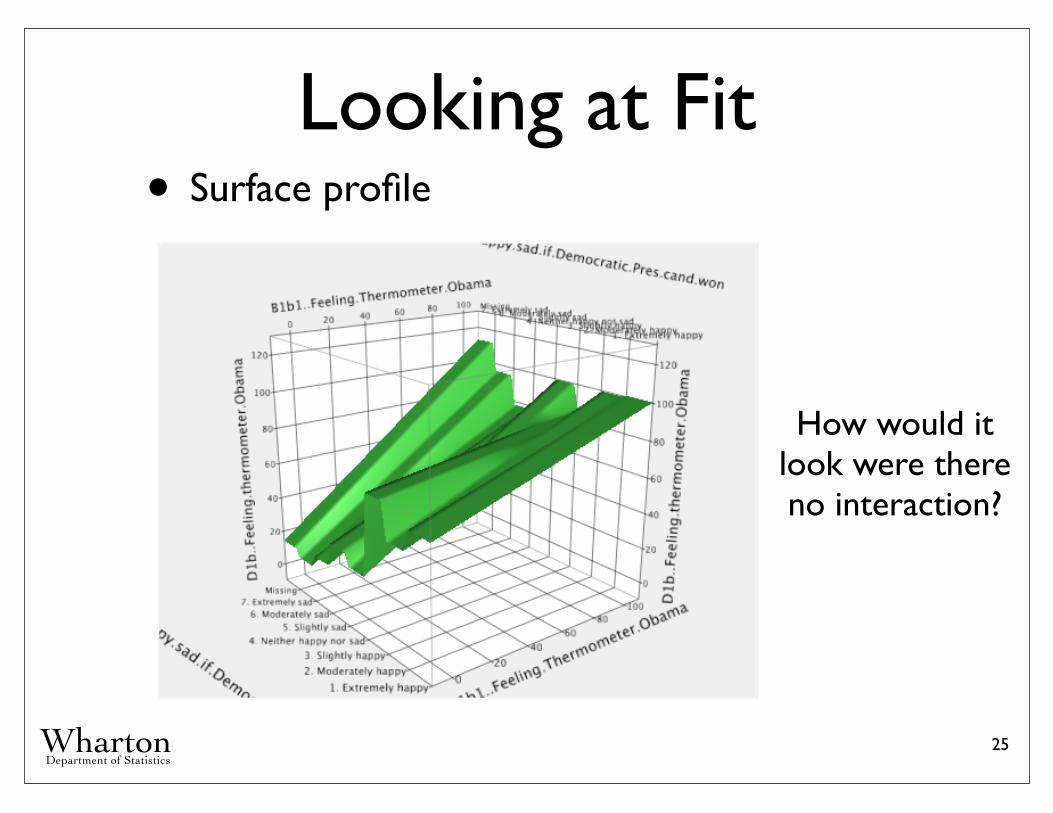
Looking at Fit• Surface profile
25
How would it look were there no interaction?
Wharton Department of Statistics
Take-Aways• Role for data mining in social sci research• Diagnostic• Better way to do what we do already
• Importance of models• Linking theory to data to allow inference• Standard error: bootstrap resampling
• Calibration• Check that a model is correct, on average
• Interactive visualization • Exploring data (plot linking, brushing)• Exploring models (profiling, surfaces)
26
Wharton Department of Statistics
Assignment• Skim syllabus, bibliography
• Peek at the codebook for ANES• Will put on Newberry computers
• Think about modeling your own data• How did you decide on a model, hypotheses
• Come with questions...
27
Wharton Department of Statistics
Next Time• Picking the features of a model.
• An often overlooked diagnostic.
• What to do about missing values?
28