data, methods, choices, and truthiness in performance measurement r. adams dudley, md, mba professor...
TRANSCRIPT

Data, Methods, Choices, and Truthiness in Performance Measurement
R. Adams Dudley, MD, MBA
Professor of Medicine and Health Policy
Philip R. Lee Institute for Health Policy Studies
University of California, San Francisco
Support: Agency for Healthcare Research and Quality, California Healthcare Foundation, Robert Wood Johnson Foundation
Investigator Award Program

Request for Scenarios Coming
• Soon, you will be asked to describe situations in which your public reporting group struggled with:– What measures to pick– What data to use– Whether the data was good enough– How to calculate a performance score– Whether to use a composite– What label to put on performance (e.g., “good”,
“better”, “best”)

Goal of this Session
• De-jargonize and de-mystify measurement and report preparation, so everyone can participate in deciding what to do

Pop Quiz
• You are about to be asked to observe characteristics of people who need care and make measurements
• We will be assessing whether or not the measurements are important and can be made “accurately”
• Then we will decide whether they will be incorporated into a report

Available data
• It was too expensive to have an observer present at all times to record the quality of care, therefore, you will have to base your judgments on a sample available abstractions from the record of care.
• If you are willing to do so, you may elect, for future performance reports, to invest more money to get more data…but for now, this is all the data you have.

Setting
• A mother needs to take a 2 day business trip. She leaves her three children in the care of her husband.

Setting
• What measures should be included in a performance report about the care the father provides?
• To make this decision, you will be given data from prior episodes of care. Similar data can be made available for the period of the business trip at essentially no cost.

The Data
• Collected over the preceding 6 months


Audience Survey: Question #1
• Performance report variable possibility #1: Should the measure, “When in the care of this provider, do the children smile and have fun a lot?” be included in the report?
– Yes– No

Audience Survey: Question #2
• Performance report variable possibility #2: Should the measure, “When in the care of this provider, were the children prepared for the weather (dressed appropriately, etc.)?” be included in the report?
– Yes– No

Audience Survey: Question #3
• Performance report variable possibility #3: Should the measure, “When in the care of this provider, do the children eat enough vegetables?” be included in the report?
– Yes– No

Audience Survey: Question #4
• Can you think of other measures that should be included in the report?
– Yes– No
The Only Two Criteria for Choosing Measures (I think)
• Is it important?• How hard is it to measure it well?

Criteria for Choosing Measures
• Is it important?– Do we care about the measure? Does it vary among
providers? Would reporting the information change anything?
• How hard is it to measure it well? E.g.:– Do you think all observers would come to the same
conclusion about what the answer is? – How big a sample size (how many observations) can you
get? Do you think you the answer varies day-to-day?– How much does it cost to measure it well?

Possible Issues
• Did the children smile and have fun?– Does this vary among providers?
• Are they prepared for the weather?– One warm weather and one cold weather photo, two
indoor photos…would need to spend more collecting data
• Do they eat enough vegetables?– How do we define “enough”? Is taking photographs a
good way to measure? How much would alternative measurement methods cost?

Making Measurements
• Some things about the children’s care—and about almost any topic, including health care—are easier to measure with confidence than others
• If something is difficult to assess but still important, one may have to find a way to measure it anyway
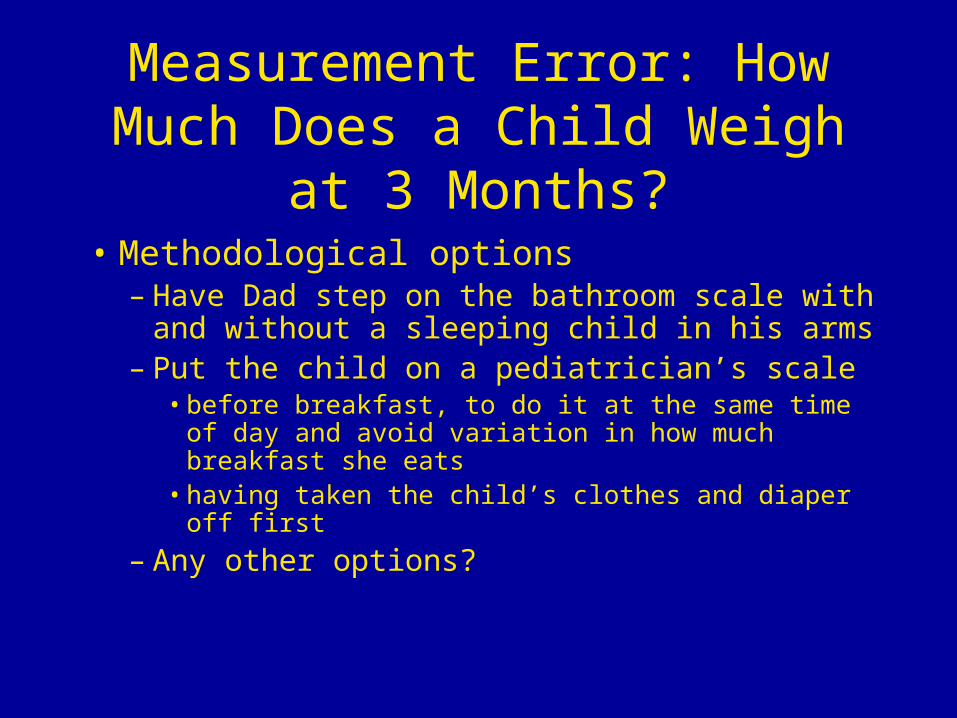
Measurement Error: How Much Does a Child Weigh at 3 Months?
• Methodological options– Have Dad step on the bathroom scale with and
without a sleeping child in his arms– Put the child on a pediatrician’s scale
• before breakfast, to do it at the same time of day and avoid variation in how much breakfast she eats
• having taken the child’s clothes and diaper off first
– Any other options?

Measurement Error: How Much Does a Child Weigh at 3 Months?
• The choice between the methods involves consideration of how much effort and expense are required, how important the information is, and how precise it has to be

Measurement Error: How Much Does a Child Weigh at 3 Months?
– Less effort, not very precise…yet how people do it for most kids: Dad steps on the bathroom scale with and without the child in his arms
– Congenital heart disease where weight is REALLY important:
• Buy a pediatrician’s scale for home use• Put the child on a pediatrician’s scale first thing in the
morning FULLY CLOTHED so she won’t scream or wiggle
• Measure 3 times and take the average• Then take her clothes and diaper off and weigh them
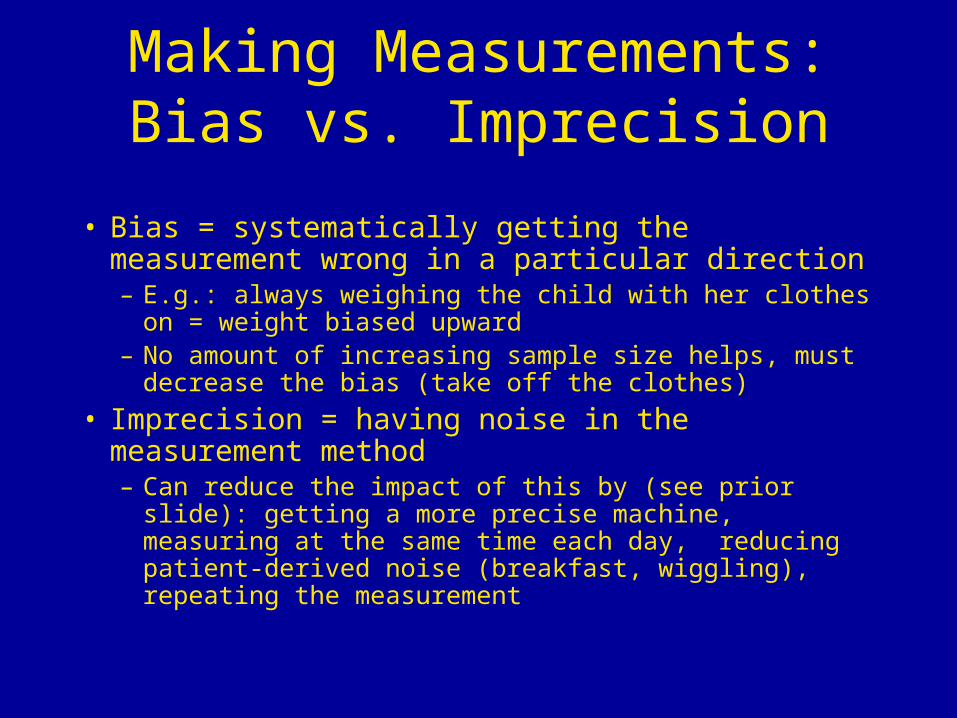
Making Measurements: Bias vs. Imprecision
• Bias = systematically getting the measurement wrong in a particular direction– E.g.: always weighing the child with her clothes on = weight
biased upward– No amount of increasing sample size helps, must decrease
the bias (take off the clothes)
• Imprecision = having noise in the measurement method– Can reduce the impact of this by (see prior slide): getting a
more precise machine, measuring at the same time each day, reducing patient-derived noise (breakfast, wiggling), repeating the measurement

Please Tell Us about Situations You Will Face
• What do you want measured about your own performance?

Performance Measurement: A Real World Example
• The California Hospital Assessment and Reporting Taskforce (CHART)

Participants in CHARTAll the stakeholders:
Hospitals: e.g., HASC & CHA, hospital systems, individual hospitals
Physicians: e.g., California Medical Association Nurses: ANA-C Consumers: e.g., Community Health Councils,
Sacramento Healthcare Decisions Labor and Management: e.g., PBGH, CalPERS,
California Health Care Coalition Health Plans: Aetna, Blue Shield, CIGNA,
HealthNet, Kaiser, Wellpoint/Blue Cross Regulators: e.g., OSHPD

Goals of CHART
To develop an agreed upon measure set To increase the standardization of measures
(across hospitals and with JCAHO, CMS, etc.) To provide high quality data management and
reporting To provide and maintain transparency in hospital
performance ratings

CHART Organization

How CHART Data Will Flow
ORClinical Measures
IT or Other Structural Measures
Patient Experience Measures
Admin data
Specialized clinical data collection
H-CAHPS Scores
Survey Tools and Documentation
Data Aggregator (UCSF) - Produces one set of scores
per hospital
Reportto
Hospitals
Report toHealthPlansand
Purchasers
Reportto
Public

Choosing Measures and Creating a Public Report: Which Parts Are Science?
• Surprisingly, most of the decisions—and almost all of the contentious ones—are NOT about science, but about value judgments
– That does not mean that these decisions are “unscientific”, esp. if by “unscientific” we mean “haphazard, wrong, and/or intellectually deficient”
– Rather, it means they are “not suitable for numerical testing because different people may have different opinions, and the opinions may be equally valid”

Choosing Measures and Creating a Public Report: Which Parts Are Science?
• In choosing what to measure: – This is pretty much about what is of interest to
the stakeholders…so it’s a matter of value judgments
– HOWEVER, it is possible that something could be measured, but not really represent “quality” in a scientific sense

Choosing Measures and Creating a Public Report: Which Parts Are Science?
• Something that can be measured, but may not represent “quality” in a scientific sense:– “% of patients with prostate cancer who choose to have their
prostate removed” (science suggests surgery offers no survival benefit over radiation or having no treatment, but there are different morbidities…it’s a matter of patient preference)
– Some patients might prefer doctors/clinics that are very aggressive about surgery, others might prefer support for a conservative approach…
– So this could be a CHOICE measure, without being a QUALITY measure

Choosing Measures and Creating a Public Report: Which Parts Are Science?• In choosing how to measure:
– Science: • The ways that we calculate statistics about agreement between
different measurement methods• The ways that we calculate performance (like how you calculate
a 95% confidence interval)
– NOT Science—examples: • deciding when it is worth it to use a more expensive approach to
measuring something rather than a less expensive (e.g., chart abstraction vs. admin data)
• using 95% confidence interval instead of 90% (turns out 95% is just a tradition!...although, like most traditions, there are reasons for it)

Choosing Measures and Creating a Public Report: Which Parts Are Science?• In deciding whether a data source or a measure is
good enough:– Science: The ways that we calculate “reliability” and
“validity” statistics– NOT Science: what level of reliability and/or validity is
required to go ahead and use a measure

Ways around an impasse:• Establish or refer to goals: “What is the behavior
change we are trying to create here?” FOLLOWED BY: – “How do the methods compare in terms of that
desired goal?” (if there is agreement about the desired goal) OR
– “Let’s talk some more about what we’re trying to achieve, or find ways to take turns achieving each others’ goals.”

Ways around an impasse:• Bring trade-offs into the light:
– “If we spend more (less) effort and this measure ends up more (less) accurate, what specific alternative measure would we have to give up (or get to do)”?

Ways to resolve an impasse:
• Determine whether a point is worth arguing: – “I think you are both making good points.
Could we calculate the performance ratings both ways, and see if it makes a difference?”

How Labels and Icons Were Developed
• Formal focus testing with consumers and industry representatives– Most accurate choice + qualitative comments– Color coded icon with word in the center
• RMAG review – No formal recommendation to Steering Committee
• Steering Committee Discussion

Initial Steering Committee Principles
• More than just the usual 3 groups (average, above, below, using 95% CIs)
• Consider alternative approaches – cluster methodology analysis, multiple benchmarks
• Let the data dictate how many groups are created (upper limit 5)
• No ranking, not even quintiles• Use confidence intervals (sample size)

The Process
• Engage well known biostatistician with strong public reporting experience
• Create a work group to interface with biostatistician

Eventual Steering Committee Decision
After hearing from the biostatistician that the multiple benchmark approach (see next slides) was valid, the Steering Committee decided:
• Use multiple benchmark approach• Use national (meaning JCAHO/CMS/HQA) benchmarks
when available, use California benchmarks when necessary
• No upper or lower thresholds (except any performance ≥98% will always be consider in the top group, even if national benchmarks are 99% or 100%)

Eventual Steering Committee Decision
The Multiple Benchmark approach:• Choose 3 clinically relevant benchmarks• Compare hospital performance not just to mean or expected
performance, but to all three benchmarks– For each hospital, estimate the interval within which we believe the
hospital’s performance is most likely to fall (e.g., “Hospital X administers thrombolytics within 30 minutes to patients having an acute myocardial infarction between 58% and 69% of the time”)
– Ask which of the benchmarks this interval includes
• This can result in more than the usual 3 groups of “above expected/above average”, “expected/average”, and “below expected/below average”

Benchmarks
Better Performance
Worse Performance
Top
Benchmark
Middle
Benchmark
Lowest
Benchmark

Possible Results(3 Benchmarks)
A
B
C
D E
F
G H
I J
Better Performance
Worse Performance
Top
Benchmark
Middle
Benchmark
Lowest
Benchmark

A
B
C
D E
F
G H
I J
Better Performance
Worse Performance
Top
Benchmark
Middle
Benchmark
Lowest
Benchmark
1
2
34
5
6
Possible Performance Categories – Six


Conclusions
• Most of the thought that goes into making a public report can be understood by a lay audience, if presented without jargon
• Most of the true scientific issues about differences in method don’t end up having much impact on scores…but you can always check
• Highlighting, in simple language, the goals of the stakeholders and the trade-offs they face is usually the best way to figure out what to do next