data matching: understanding the impact of homelessness on health services
TRANSCRIPT

Presentation Title
Speaker’s name
Presentation title
Speaker’s
name
Data matching: understanding the
impact of homelessness
on health services Neil Hamlet – Consultant, Public Health Medicine, NHS Fife
- Lead for Homelessness, NHS Health Scotland
[email protected] @Neil_Hamlet

Multiple Exclusion Homelessness is the
visible, deeply damaged and vulnerable tip of
the health inequality iceberg.
Below the waterline lie all the social,
environmental and behavioural drivers and
transition points for prevention and early
intervention.
The Inequality Iceberg
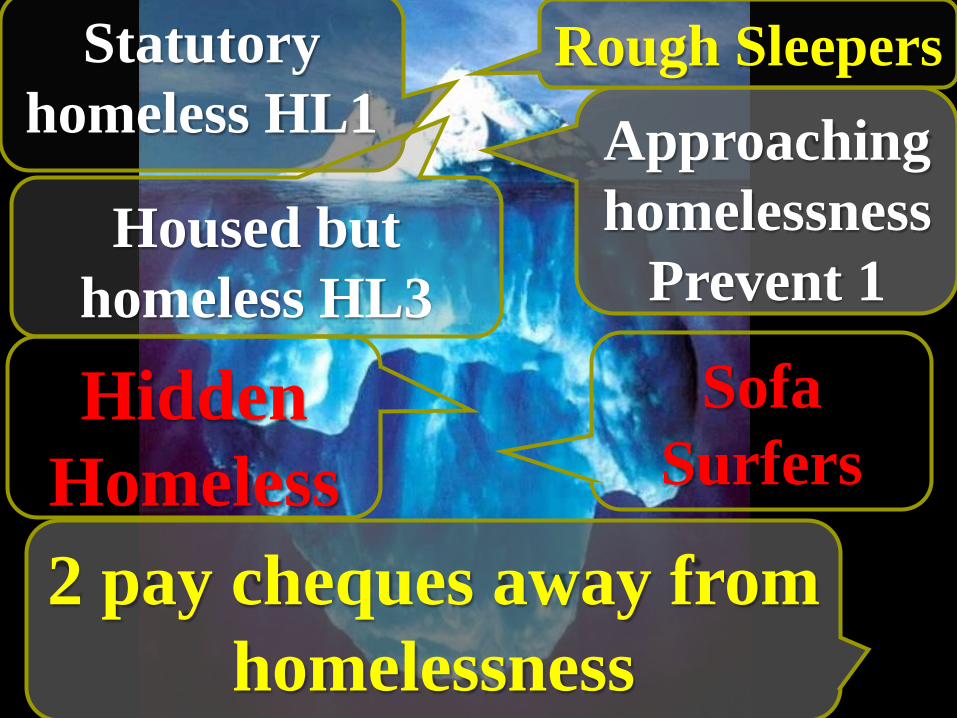
2 pay cheques away from
homelessness
Approaching
homelessness
Prevent 1
Statutory
homeless HL1
Sofa
Surfers
Housed but
homeless HL3
Hidden
Homeless
Rough Sleepers
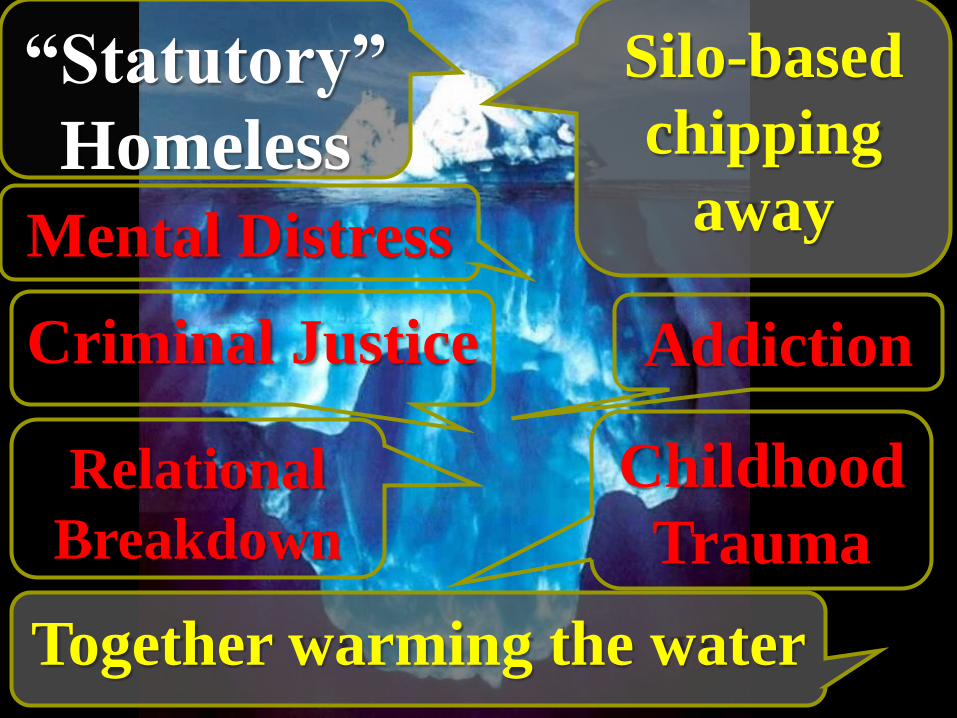
Together warming the water
Silo-based
chipping
away
“Statutory”
Homeless
Mental Distress
Childhood
Trauma
Addiction Criminal Justice
Relational
Breakdown
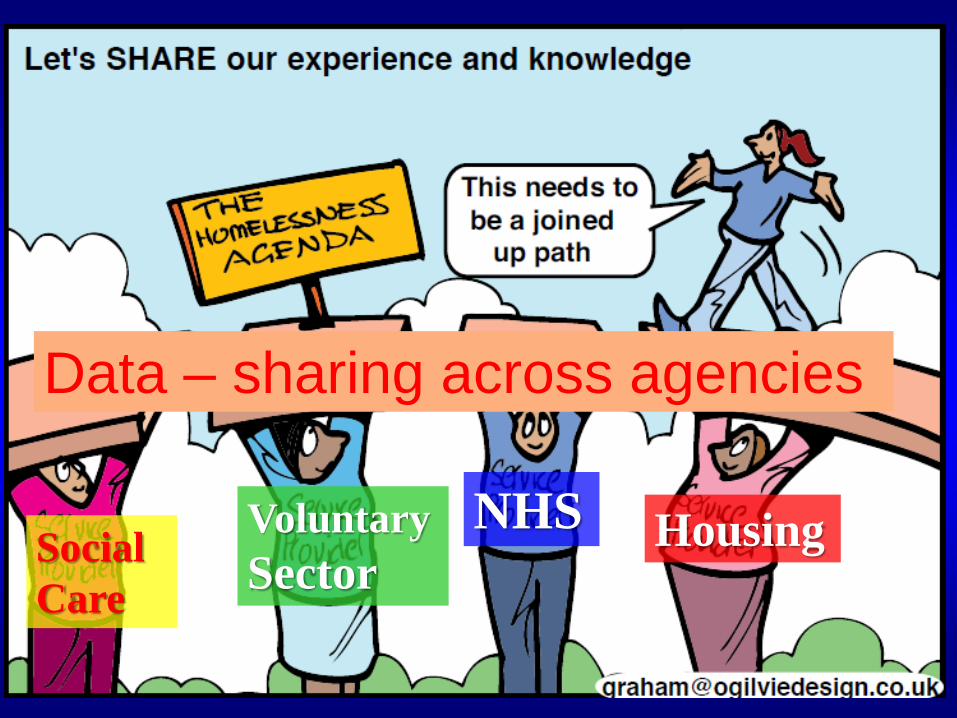
Housing Voluntary
Sector
NHS Social
Care
Data – sharing across agencies
-
200
400
600
800
1,000
1,200
1,400
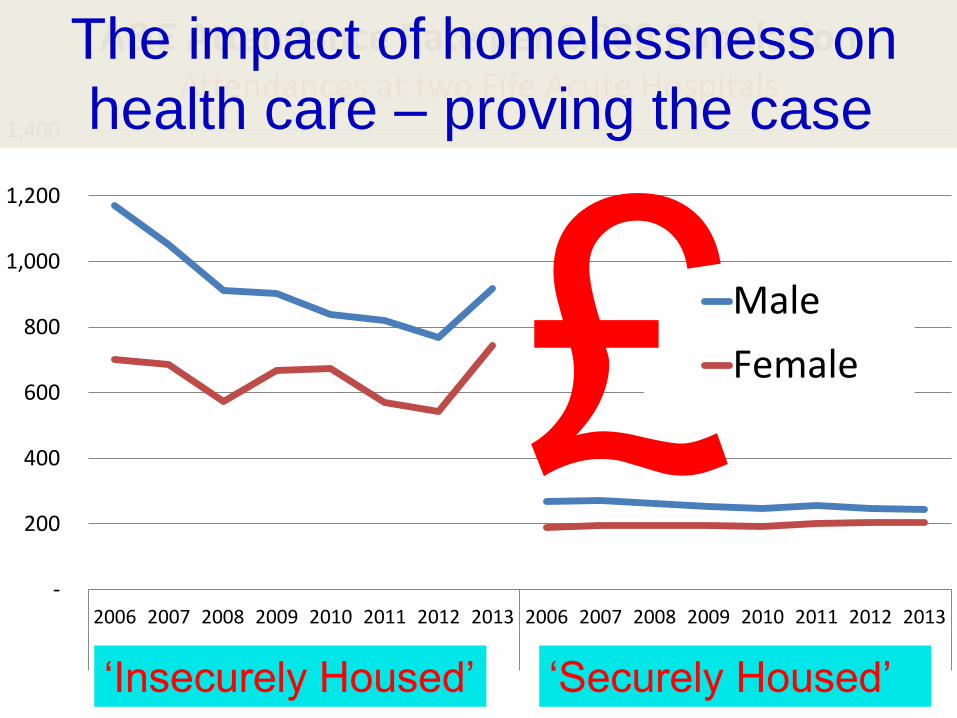
2006 2007 2008 2009 2010 2011 2012 2013 2006 2007 2008 2009 2010 2011 2012 2013
HL1 Fife (Aged 15 - 64)
A&E Attendance Rate per 1,000 Population Attendances at two Fife Acute Hospitals
Male
Female
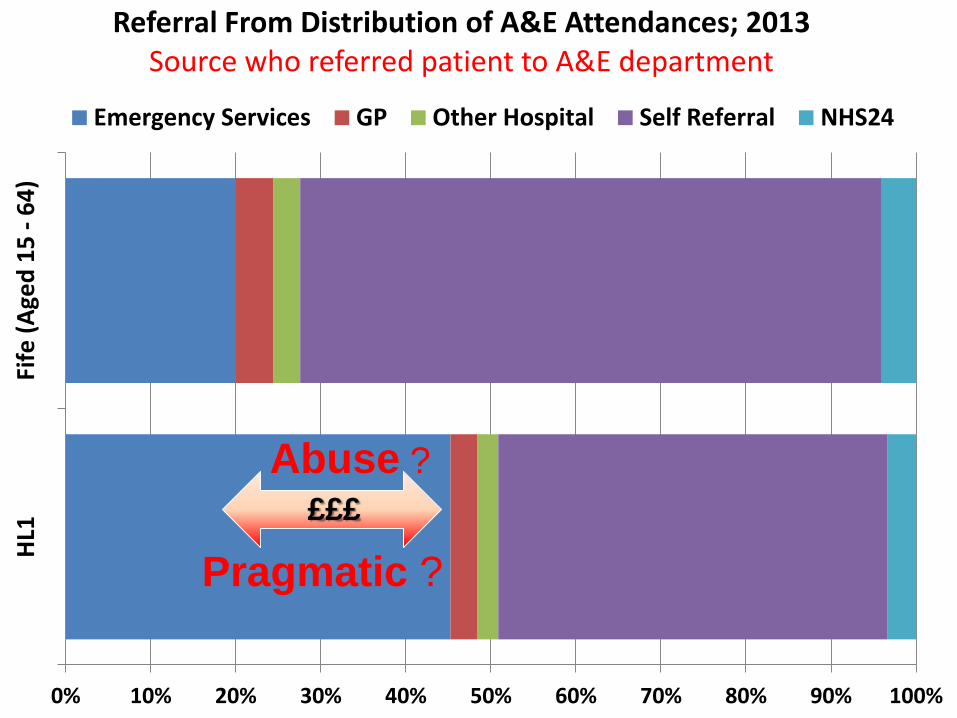
The impact of homelessness on
health care – proving the case
‘Insecurely Housed’ ‘Securely Housed’
0% 10% 20% 30% 40% 50% 60% 70% 80% 90% 100%
HL1
Fife
(A
ged
15
- 6
4)
Referral From Distribution of A&E Attendances; 2013 Source who referred patient to A&E department
Emergency Services GP Other Hospital Self Referral NHS24
Abuse ?
Pragmatic ?
£££

0% 10% 20% 30% 40% 50% 60% 70% 80% 90% 100%
HL1
Fife
Age Distribution of A&E Attendances; 2013 Age of patients attending A&E
Under 15 15 to 19 20 to 29 30 to 39 40 to 49 50 to 64 65+
Over 50% are under 30 yrs
Over 80% are under 40 yrs
-
50
100
150
200
250
300
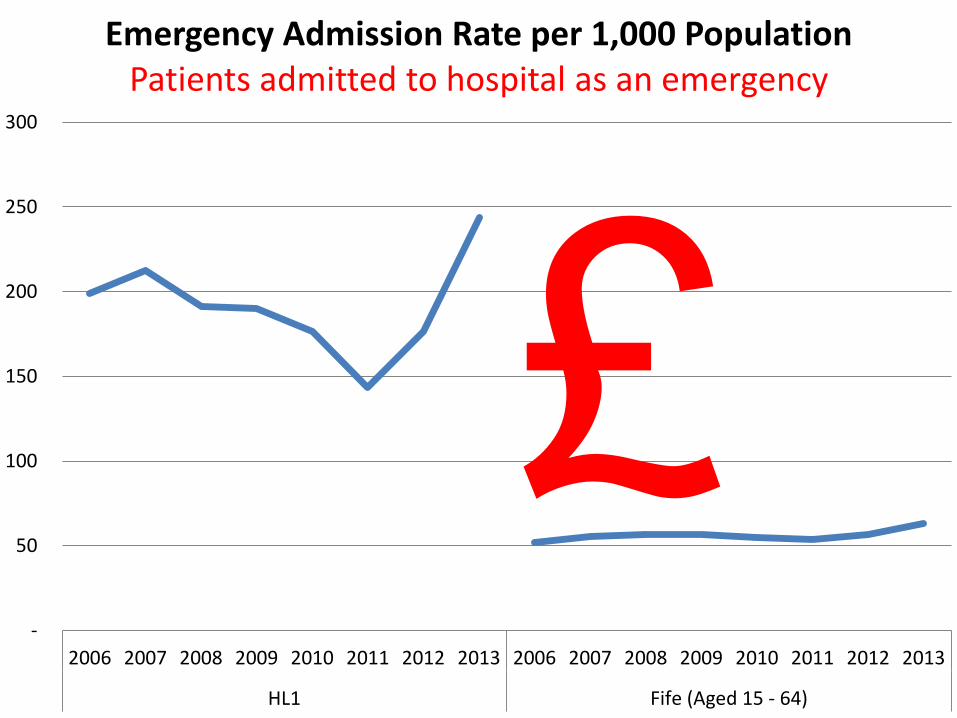
2006 2007 2008 2009 2010 2011 2012 2013 2006 2007 2008 2009 2010 2011 2012 2013
HL1 Fife (Aged 15 - 64)
Emergency Admission Rate per 1,000 Population Patients admitted to hospital as an emergency
-
50
100
150
200
250
2006 2007 2008 2009 2010 2011 2012 2013 2006 2007 2008 2009 2010 2011 2012 2013
HL1 Fife (Aged 15 - 64)
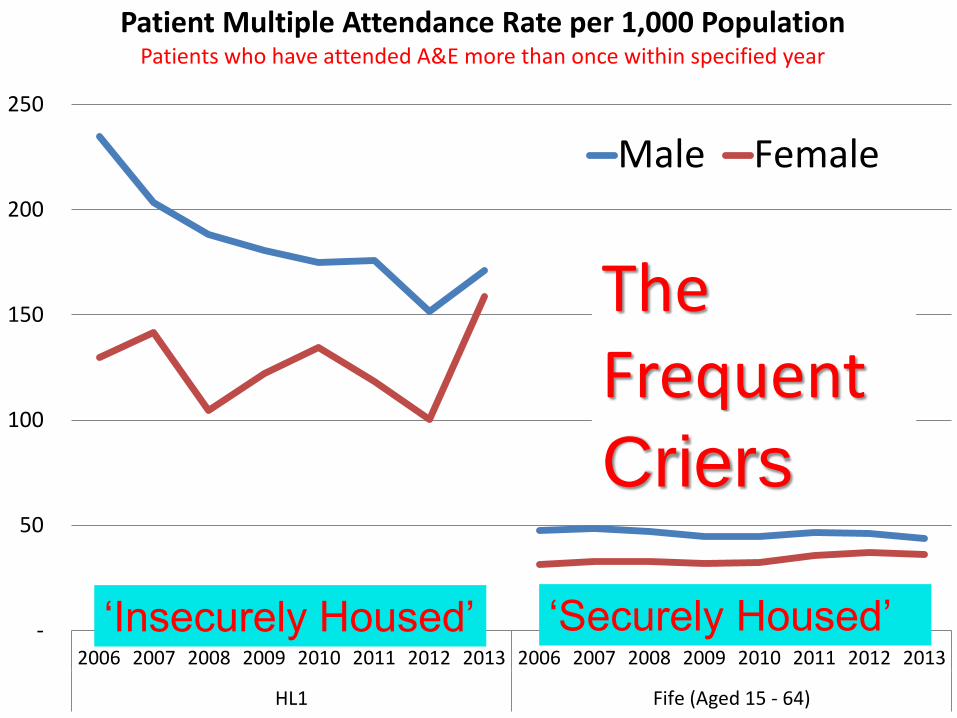
Patient Multiple Attendance Rate per 1,000 Population Patients who have attended A&E more than once within specified year
Male Female
‘Insecurely Housed’ ‘Securely Housed’
The Frequent Fliers Criers

-
5
10
15
20
25
30
35
40
2006 2007 2008 2009 2010 2011 2012 2013 2006 2007 2008 2009 2010 2011 2012 2013
HL1 Fife (Aged 15 - 64)
Multiple Emergency Admission Rate per 1,000 Population Patients who have been admitted as an emergency more than once in specified year
Revolving Hospital Door effect
0%
5%
10%
15%
20%
25%
30%
-
15
30
45
60
75
90
2006 2007 2008 2009 2010 2011 2012 2013 2006 2007 2008 2009 2010 2011 2012 2013
HL1 Fife (Aged 15 - 64)
% o
f Ad
missio
ns
Rat
e p
er
1,0
00
Po
pu
lati
on
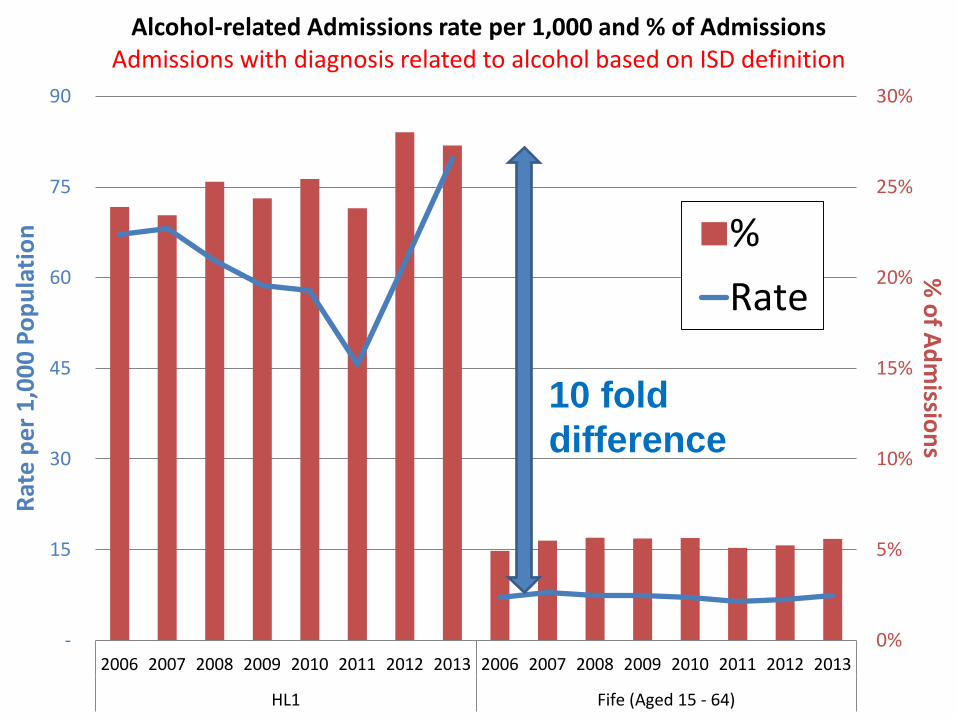
Alcohol-related Admissions rate per 1,000 and % of Admissions
Admissions with diagnosis related to alcohol based on ISD definition
%
Rate
10 fold
difference

0%
5%
10%
15%
20%
25%
30%
35%
40%
2006 2007 2008 2009 2010 2011 2012 2013 2006 2007 2008 2009 2010 2011 2012 2013
HL1 Fife (Aged 15 - 64)
% New Outpatient Appointments DNA
New appointments who Did Not Attend (excludes cancellations by hospital or patient)
•Changed address
•Fearful to open official mail
•Appointment too early
•No money for the bus
•It won’t do any good’
Access / Expectation

Chief Statistician funded pilot to test Fife approach nationally

A&E Outpatients
Inpatients Day cases
Deaths
Prescribing
Age/gender
CHI
Linked File
SPARRA
Social Care
SIMD
Linked Health and Social care
file at an individual service
user level (Aggregated
Activity & Costs)
Integrated Data: Health & Social Care Integration and
Information Platform
£costed
Community Housing &
Homelessness
data
www.housingandwellbeing.org
http://www.scotphn.net/projects/previous
_projects/homelessness_guidance_for_
public_health