data collection and use in early childhood education ... · u.s. department of education april...
TRANSCRIPT

U . S . D e p a r t m e n t o f E d u c a t i o n
April 2015
What’s Happening
Data collection and use in early childhood education programs: Evidence from
the Northeast Region
Jacqueline Zweig Clare W. Irwin
Janna Fuccillo Kook Josh Cox
Education Development Center, Inc. In collaboration with the Early Childhood Education Research Alliance
At Education Development Center, Inc.
U.S. Department of Education Arne Duncan, Secretary
Institute of Education Sciences Sue Betka, Acting Director
National Center for Education Evaluation and Regional Assistance Ruth Curran Neild, Commissioner Joy Lesnick, Associate Commissioner Amy Johnson, Action Editor Joelle Lastica, Project Officer
REL 2015–084
The National Center for Education Evaluation and Regional Assistance (NCEE) conducts unbiased large-scale evaluations of education programs and practices supported by federal funds; provides research-based technical assistance to educators and policymakers; and supports the synthesis and the widespread dissemination of the results of research and evaluation throughout the United States.
April 2015
This report was prepared for the Institute of Education Sciences (IES) under Contract ED-IES-12-C-0009 by Regional Educational Laboratory Northeast & Islands administered by Education Development Center, Inc. The content of the publication does not necessarily reflect the views or policies of IES or the U.S. Department of Education, nor does mention of trade names, commercial products, or organizations imply endorsement by the U.S. Government.
This REL report is in the public domain. While permission to reprint this publication is not necessary, it should be cited as:
Zweig, J., Irwin, C. W., Kook, J. F., & Cox, J. (2015). Data collection and use in early childhood education programs: Evidence from the Northeast Region (REL 2015–084). Washington, DC: U.S. Department of Education, Institute of Education Sciences, National Center for Education Evaluation and Regional Assistance, Regional Educational Laboratory Northeast & Islands. Retrieved from http://ies.ed.gov/ncee/edlabs.
This report is available on the Regional Educational Laboratory website at http://ies.ed.gov/ ncee/edlabs.
Summary
Early childhood education programs face increasing pressures to collect data, about both teachers and children, and to use those data to make decisions (Yazejian & Bryant, 2013). Research supports the potential value of using data in education settings for multiple purposes (Crommey, 2000, and Earl & Katz, 2006, as cited in Datnow, Park, & Wohlstetter, 2007). But little is known about whether or how early childhood education programs use data for these purposes. This study explores how early childhood education programs are collecting and using data, how they would like to use data, how they could use the data that they have, and the challenges they face in these efforts. These tasks were accomplished by interviewing administrators and teachers at seven preschools in a mid-sized city in the Northeast Region and by analyzing child data already collected by two of these preschools.
This study was conducted in collaboration with the Early Childhood Education Research Alliance at the Regional Educational Laboratory Northeast & Islands. The alliance, which comprises state education leaders, prioritized a study examining the collection and use of data in preschools. Alliance members served as advisors on the study design and report. The audience for this study includes administrators of early childhood education programs who are seeking to develop or enhance their data processes, policymakers who are considering policies to increase data-informed decisionmaking in preschools, and education leaders who are interested in advancing their data structures to answer more complex questions about early childhood education experiences and outcomes in K–12.
This study focuses on preschools’ collection and use of data on early learning outcomes, dosage (the amount of time children spend in early childhood education), and classroom quality (for example, teacher-child interactions). Based on previous research showing that dosage and classroom quality are positively associated with early learning outcomes (see, for example, Burchinal, Kainz, & Cai, 2011; Burchinal et al., 2009; McCartney et al., 2010; NICHD Early Child Care Research Network, 2000; Peisner-Feinberg et al., 2001; Robin, Frede, & Barnett, 2006), this study focused on dosage, classroom quality, and early learning outcomes. Data on these topics have the potential to inform decisions about children, teachers, and early childhood education programs in general.
Most states do not systematically collect information on how early childhood education programs collect and use data. Given this lack of information, the results from the current study help provide the early childhood community with information on data collection and use in early childhood education classrooms. Key findings include:
• All participating preschools reported using ongoing, performance-based assessments of early learning outcomes.
• The participating preschools reported collecting attendance data; all used it for compliance purposes, but some were interested in using it for other purposes such as linking absences to learning outcomes.
• Although all participating preschools conducted classroom observations to inform teacher practice, the structure and formality of the processes varied.
• Challenges in using child data to inform program-level decisions included the time and difficulty of combining multiple sources of data and the potential for multiple explanations for trends observed in the data.
i
Contents
Summary i
Why this study? 1
What the study examined 2
How the study was conducted 2
What the study found 4 All seven preschools reported using ongoing, performance-based assessments of early learning
outcomes 4 The participating preschools reported collecting and storing attendance data; all reported
using it for compliance purposes, but some were also interested in using it for other purposes such as linking absences to learning outcomes 7
Although all participating preschools reported conducting classroom observations to inform teacher practice, the structure and formality of the processes varied 8
Considerations for using Early Childhood program data 11 Preschools could use child data to inform program-level decisions 11 Challenges in using child data to inform program-level decisions include the time and
difficulty of combining multiple sources of data and the potential for multiple explanations for observed trends in the data 15
Limitations of the study 18
Implications of the study 18
Appendix A. Methodology for interviews A-1
Appendix B. Methodology for data analysis B-1
Appendix C. Process to combine data C-1
Appendix D. Administrator interview protocol D-1
Appendix E. Teacher interview protocol E-1
Notes Notes-1
References Ref-1
Boxes 1 State department of education requirements 2 2 Description of sample 3 3 Key terms 3 3 Key terms (continued) 4 4 Quality rating and improvement system overview 10
ii
Figures 1 Example of one way that preschools could visually represent Teaching Strategies GOLD
data from the fall and spring 11 2 Preschools could examine fall Teaching Strategies GOLD literacy scores by age 12 3 Preschools could examine fall Teaching Strategies GOLD skill-level literacy scores for
children who are ages 36–44 months 12 4 Preschool programs could use attendance data to examine the degree of absenteeism
across the program 13 5 Preschool programs could use attendance data to examine monthly absenteeism across
the school year 14 6 Sample analysis of mean scores of Classroom Assessment Scoring System domains, one
measure of classroom quality 14 7 Children enrolled in Program B for a full day had significantly higher fall math outcomes
than children enrolled for a half day 16 8 Example of multiple explanations: children enrolled in Program B for a full day also had
higher average family incomes and were older than children who enrolled for a half day 17 C1 Process to combine data C-1
Tables 1 Data for 2013 from Programs A and B 5 2 Two preschools’ systems for assessing early learning outcomes: Teaching Strategies
GOLD and internally developed 6 3 Three preschools’ systems for assessing classroom quality 9 A1 Preschool characteristics A-2 A2 Example of study coding scheme A-3 B1 Descriptive statistics of children’s characteristics in Programs A and B, 2012/13 B-2 B2 Average Teaching Strategies GOLD scores for the fall and spring assessments in
Programs A and B, 2012/13 B-3 B3 Descriptive statistics of dosage in Programs A and B, 2012/13 B-3 B4 Descriptive statistics of ECERS-R ratings in Programs A and B, 2012/13 B-4 B5 Descriptive statistics of Classroom Assessment Scoring System ratings in Program B,
2012/13 B-5 B6 Number and percent of children with Teaching Strategies GOLD scores on all items, some
items, and no items for the fall and spring assessments in Programs A and B, 2012/13 B-6 B7 Mean Teaching Strategies GOLD scores for fall and spring for the nonimputed data, the
1st and 40th sets of imputed data for Program B, 2012/13 B-7
iii
Why this study?
Although demand has increased for early childhood education practitioners to use research-based practice and data to drive decisions (Yazejian & Bryant, 2013), there is little information on the data that preschools collect and how they use those data to inform practice. Prior research suggests that educators can use data to monitor students’ learning and growth, examine progress toward state and district standards, become more knowledgeable about their own capacities, and develop plans for improvement (Crommey, 2000, and Earl & Katz, 2006, as cited in Datnow et al., 2007).
Two major obstacles may prevent early childhood education practitioners from effectively using data to inform decisions (Yazejian & Bryant, 2013). The first is the lack of research on best practices in using data in early childhood education. The second is lack of capacity among preschool programs to gather data and use the results for decisionmaking. This study addresses these knowledge gaps by presenting information from a convenience sample of preschool programs on the kind of data that administrators and teachers collected on early learning outcomes, dosage (the amount of time children spend in early childhood education programs), and classroom quality; how data were used; and the challenges they faced in collecting and using data. It also presents data from two preschool programs to demonstrate how preschools could use data and to highlight some of the challenges that preschool programs may face when collecting and using data.
This study was conducted in collaboration with the Early Childhood Education Research Alliance at the Regional Educational Laboratory Northeast & Islands. The alliance, which comprises state education leaders, prioritized a study examining the collection and use of data in preschools. Alliance members served as advisors on the study design and report.
The analysis focused on preschools’ collection and use of data on early learning outcomes, dosage, and classroom quality. Based on previous research showing that dosage and classroom quality are positively associated with early learning outcomes (see, for example, Burchinal et al., 2011; Burchinal et al., 2009; McCartney et al., 2010; NICHD Early Child Care Research Network, 2000; Peisner-Feinberg et al., 2001; Robin et al., 2006), this study focused on dosage, classroom quality, and early learning outcomes. Data on these topics have the potential to inform decisions about children, teachers, and early childhood education programs in general.
Effective data-driven decisionmaking depends on what data are collected, how data are collected, how data are stored, and how data are analyzed and used; for this reason, this study addresses all steps of this process. In addition, the policy context within which data collection takes place also influences these factors. Box 1 provides an overview of the study state’s requirements regarding the collection of data in licensed early child care settings.1
Reporting on data collection systems from interviews with preschools provides information on the diversity and complexity of the processes. Further, understanding the challenges that preschools face in collecting and using data on early learning outcomes, dosage, and classroom quality and the purposes for which data collection is undertaken is important for several audiences. This information is relevant to early childhood education administrators who are seeking to develop or enhance their data processes, policymakers who are considering policies to increase data-informed decisionmaking in preschools, and education leaders who are interested in advancing their data structures to answer more complex
This study presents information from a convenience sample of preschool programs on what data administrators and teachers collected on early learning outcomes, dosage, and classroom quality; how data were used; and the challenges faced in collecting and using data
1
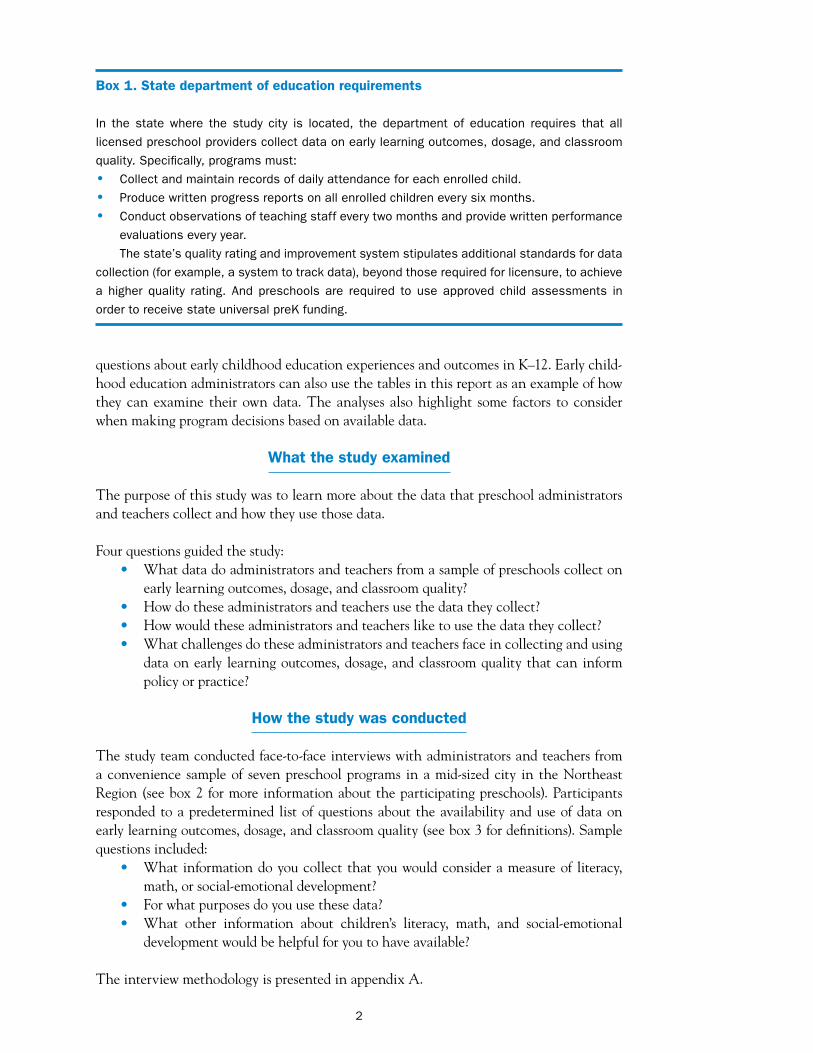
Box 1. State department of education requirements
In the state where the study city is located, the department of education requires that all
licensed preschool providers collect data on early learning outcomes, dosage, and classroom
quality. Specifically, programs must:
• Collect and maintain records of daily attendance for each enrolled child.
• Produce written progress reports on all enrolled children every six months.
• Conduct observations of teaching staff every two months and provide written performance
evaluations every year.
The state’s quality rating and improvement system stipulates additional standards for data
collection (for example, a system to track data), beyond those required for licensure, to achieve
a higher quality rating. And preschools are required to use approved child assessments in
order to receive state universal preK funding.
questions about early childhood education experiences and outcomes in K–12. Early childhood education administrators can also use the tables in this report as an example of how they can examine their own data. The analyses also highlight some factors to consider when making program decisions based on available data.
What the study examined
The purpose of this study was to learn more about the data that preschool administrators and teachers collect and how they use those data.
Four questions guided the study: • What data do administrators and teachers from a sample of preschools collect on
early learning outcomes, dosage, and classroom quality? • How do these administrators and teachers use the data they collect? • How would these administrators and teachers like to use the data they collect? • What challenges do these administrators and teachers face in collecting and using
data on early learning outcomes, dosage, and classroom quality that can inform policy or practice?
How the study was conducted
The study team conducted face-to-face interviews with administrators and teachers from a convenience sample of seven preschool programs in a mid-sized city in the Northeast Region (see box 2 for more information about the participating preschools). Participants responded to a predetermined list of questions about the availability and use of data on early learning outcomes, dosage, and classroom quality (see box 3 for definitions). Sample questions included:
• What information do you collect that you would consider a measure of literacy, math, or social-emotional development?
• For what purposes do you use these data? • What other information about children’s literacy, math, and social-emotional
development would be helpful for you to have available?
The interview methodology is presented in appendix A.
2
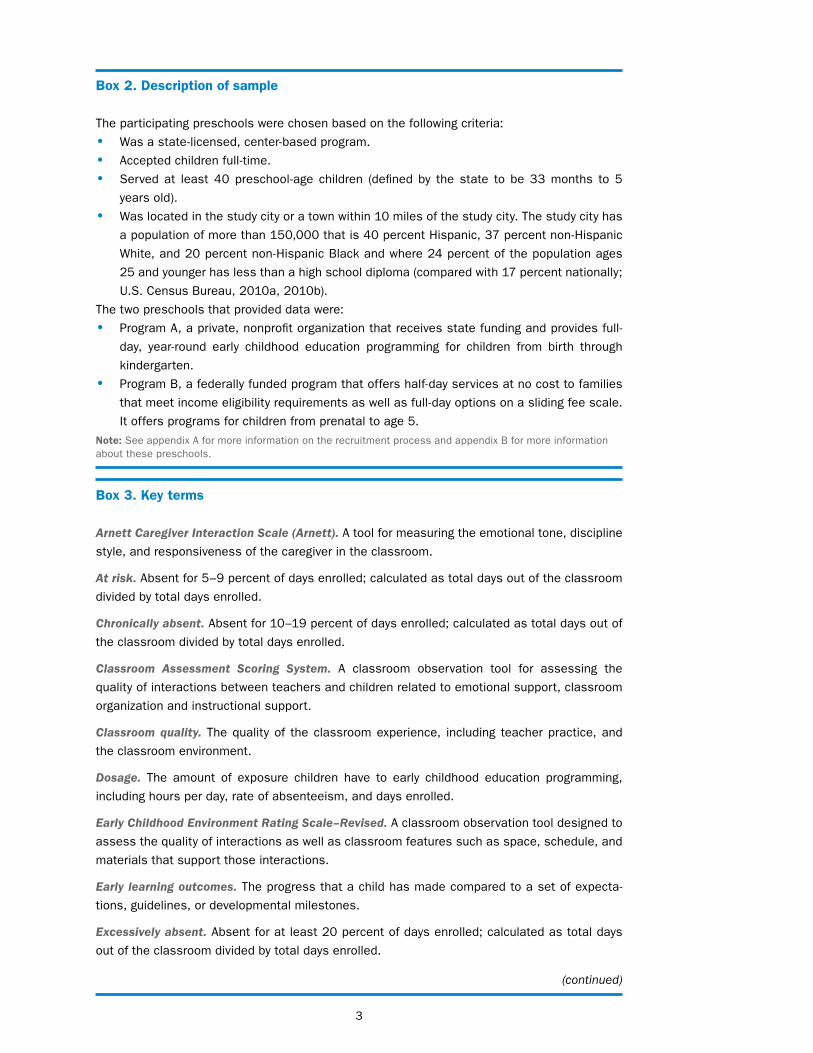
Box 2. Description of sample
The participating preschools were chosen based on the following criteria:
• Was a state-licensed, center-based program.
• Accepted children full-time.
• Served at least 40 preschool-age children (defined by the state to be 33 months to 5
years old).
• Was located in the study city or a town within 10 miles of the study city. The study city has
a population of more than 150,000 that is 40 percent Hispanic, 37 percent non-Hispanic
White, and 20 percent non-Hispanic Black and where 24 percent of the population ages
25 and younger has less than a high school diploma (compared with 17 percent nationally;
U.S. Census Bureau, 2010a, 2010b).
The two preschools that provided data were:
• Program A, a private, nonprofit organization that receives state funding and provides full-
day, year-round early childhood education programming for children from birth through
kindergarten.
• Program B, a federally funded program that offers half-day services at no cost to families
that meet income eligibility requirements as well as full-day options on a sliding fee scale.
It offers programs for children from prenatal to age 5.
Note: See appendix A for more information on the recruitment process and appendix B for more information about these preschools.
Box 3. Key terms
Arnett Caregiver Interaction Scale (Arnett). A tool for measuring the emotional tone, discipline
style, and responsiveness of the caregiver in the classroom.
At risk. Absent for 5–9 percent of days enrolled; calculated as total days out of the classroom
divided by total days enrolled.
Chronically absent. Absent for 10–19 percent of days enrolled; calculated as total days out of
the classroom divided by total days enrolled.
Classroom Assessment Scoring System. A classroom observation tool for assessing the
quality of interactions between teachers and children related to emotional support, classroom
organization and instructional support.
Classroom quality. The quality of the classroom experience, including teacher practice, and
the classroom environment.
Dosage. The amount of exposure children have to early childhood education programming,
including hours per day, rate of absenteeism, and days enrolled.
Early Childhood Environment Rating Scale–Revised. A classroom observation tool designed to
assess the quality of interactions as well as classroom features such as space, schedule, and
materials that support those interactions.
Early learning outcomes. The progress that a child has made compared to a set of expecta
tions, guidelines, or developmental milestones.
Excessively absent. Absent for at least 20 percent of days enrolled; calculated as total days
out of the classroom divided by total days enrolled.
(continued)
3
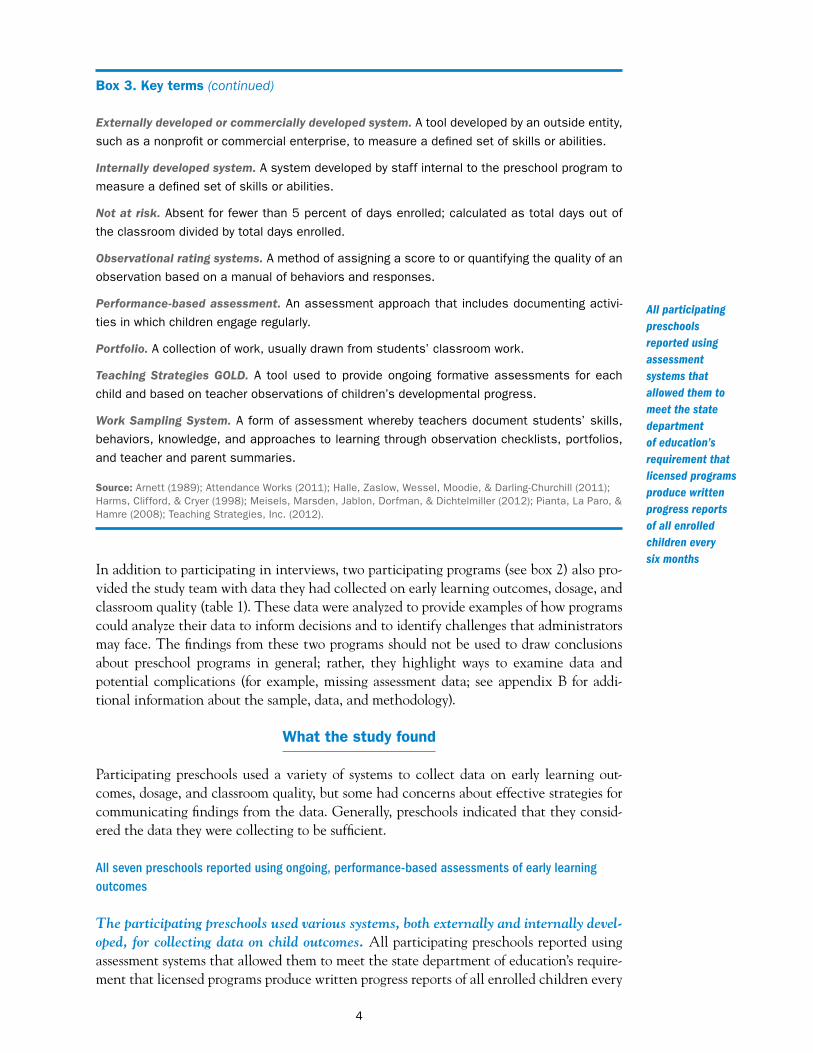
Box 3. Key terms (continued)
Externally developed or commercially developed system. A tool developed by an outside entity,
such as a nonprofit or commercial enterprise, to measure a defined set of skills or abilities.
Internally developed system. A system developed by staff internal to the preschool program to
measure a defined set of skills or abilities.
Not at risk. Absent for fewer than 5 percent of days enrolled; calculated as total days out of
the classroom divided by total days enrolled.
Observational rating systems. A method of assigning a score to or quantifying the quality of an
observation based on a manual of behaviors and responses.
Performance-based assessment. An assessment approach that includes documenting activi
ties in which children engage regularly.
Portfolio. A collection of work, usually drawn from students’ classroom work.
Teaching Strategies GOLD. A tool used to provide ongoing formative assessments for each
child and based on teacher observations of children’s developmental progress.
Work Sampling System. A form of assessment whereby teachers document students’ skills,
behaviors, knowledge, and approaches to learning through observation checklists, portfolios,
and teacher and parent summaries.
Source: Arnett (1989); Attendance Works (2011); Halle, Zaslow, Wessel, Moodie, & Darling-Churchill (2011); Harms, Clifford, & Cryer (1998); Meisels, Marsden, Jablon, Dorfman, & Dichtelmiller (2012); Pianta, La Paro, & Hamre (2008); Teaching Strategies, Inc. (2012).
In addition to participating in interviews, two participating programs (see box 2) also provided the study team with data they had collected on early learning outcomes, dosage, and classroom quality (table 1). These data were analyzed to provide examples of how programs could analyze their data to inform decisions and to identify challenges that administrators may face. The findings from these two programs should not be used to draw conclusions about preschool programs in general; rather, they highlight ways to examine data and potential complications (for example, missing assessment data; see appendix B for additional information about the sample, data, and methodology).
What the study found
Participating preschools used a variety of systems to collect data on early learning outcomes, dosage, and classroom quality, but some had concerns about effective strategies for communicating findings from the data. Generally, preschools indicated that they considered the data they were collecting to be sufficient.
All seven preschools reported using ongoing, performance-based assessments of early learning outcomes
The participating preschools used various systems, both externally and internally developed, for collecting data on child outcomes. All participating preschools reported using assessment systems that allowed them to meet the state department of education’s requirement that licensed programs produce written progress reports of all enrolled children every
All participating preschools reported using assessment systems that allowed them to meet the state department of education’s requirement that licensed programs produce written progress reports of all enrolled children every six months
4
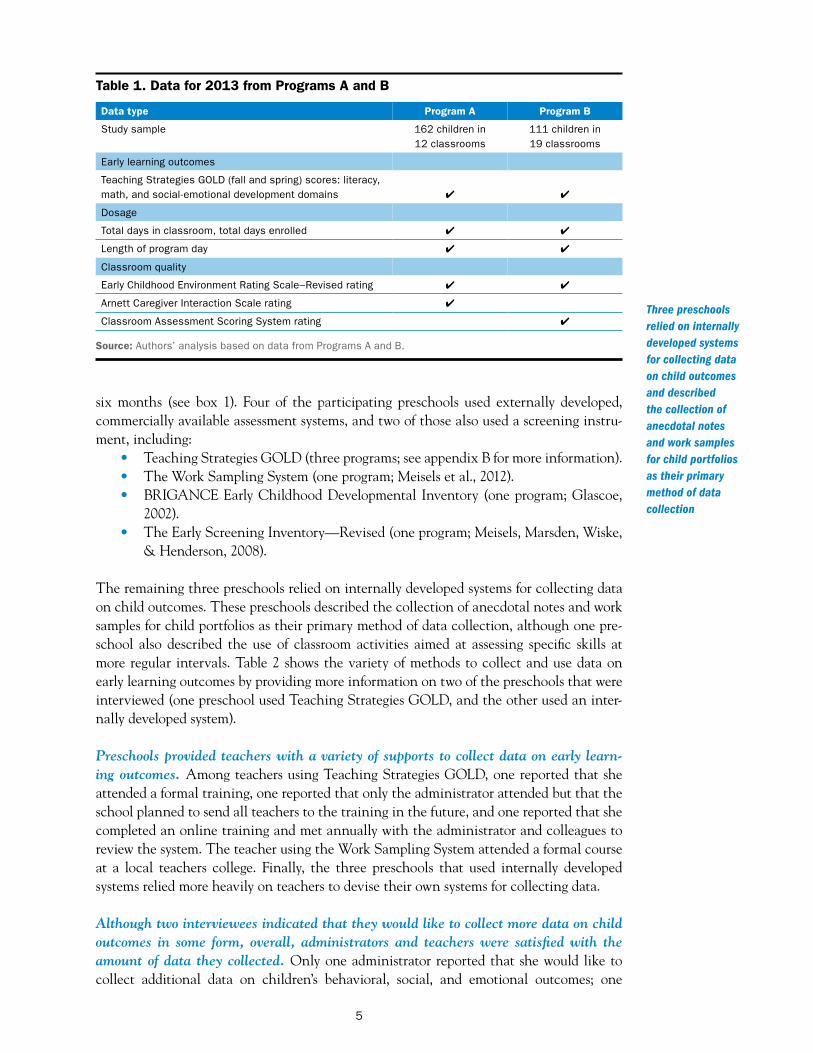
Table 1. Data for 2013 from Programs A and B
Data type Program A Program B
Study sample 162 children in 111 children in 12 classrooms 19 classrooms
Early learning outcomes
Teaching Strategies GOLD (fall and spring) scores: literacy, math, and social-emotional development domains ✔ ✔
Dosage
Total days in classroom, total days enrolled ✔ ✔
Length of program day ✔ ✔
Classroom quality
Early Childhood Environment Rating Scale–Revised rating
Arnett Caregiver Interaction Scale rating
Classroom Assessment Scoring System rating
✔
✔
✔
✔
Source: Authors’ analysis based on data from Programs A and B.
six months (see box 1). Four of the participating preschools used externally developed, commercially available assessment systems, and two of those also used a screening instrument, including:
• Teaching Strategies GOLD (three programs; see appendix B for more information). • The Work Sampling System (one program; Meisels et al., 2012). • BRIGANCE Early Childhood Developmental Inventory (one program; Glascoe,
2002). • The Early Screening Inventory—Revised (one program; Meisels, Marsden, Wiske,
& Henderson, 2008).
The remaining three preschools relied on internally developed systems for collecting data on child outcomes. These preschools described the collection of anecdotal notes and work samples for child portfolios as their primary method of data collection, although one preschool also described the use of classroom activities aimed at assessing specific skills at more regular intervals. Table 2 shows the variety of methods to collect and use data on early learning outcomes by providing more information on two of the preschools that were interviewed (one preschool used Teaching Strategies GOLD, and the other used an internally developed system).
Preschools provided teachers with a variety of supports to collect data on early learning outcomes. Among teachers using Teaching Strategies GOLD, one reported that she attended a formal training, one reported that only the administrator attended but that the school planned to send all teachers to the training in the future, and one reported that she completed an online training and met annually with the administrator and colleagues to review the system. The teacher using the Work Sampling System attended a formal course at a local teachers college. Finally, the three preschools that used internally developed systems relied more heavily on teachers to devise their own systems for collecting data.
Although two interviewees indicated that they would like to collect more data on child outcomes in some form, overall, administrators and teachers were satisfied with the amount of data they collected. Only one administrator reported that she would like to collect additional data on children’s behavioral, social, and emotional outcomes; one
Three preschools relied on internally developed systems for collecting data on child outcomes and described the collection of anecdotal notes and work samples for child portfolios as their primary method of data collection
5
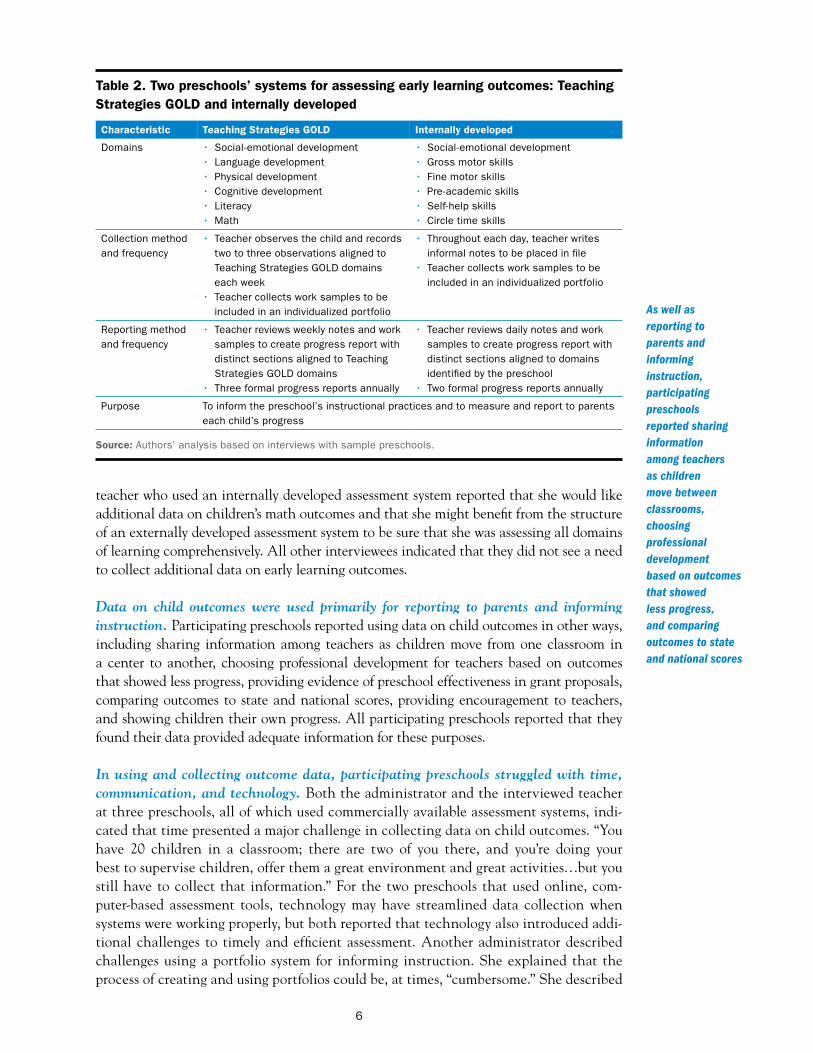
Table 2. Two preschools’ systems for assessing early learning outcomes: Teaching Strategies GOLD and internally developed
Characteristic Teaching Strategies GOLD Internally developed
Domains • Social-emotional development • Social-emotional development • Language development • Gross motor skills • Physical development • Fine motor skills • Cognitive development • Pre-academic skills • Literacy • Self-help skills • Math • Circle time skills
Collection method • Teacher observes the child and records • Throughout each day, teacher writes and frequency two to three observations aligned to informal notes to be placed in file
Teaching Strategies GOLD domains • Teacher collects work samples to be each week included in an individualized portfolio
• Teacher collects work samples to be included in an individualized portfolio As well as
Reporting method • Teacher reviews weekly notes and work • Teacher reviews daily notes and work and frequency samples to create progress report with samples to create progress report with
distinct sections aligned to Teaching distinct sections aligned to domains Strategies GOLD domains identified by the preschool
• Three formal progress reports annually • Two formal progress reports annually
Purpose To inform the preschool’s instructional practices and to measure and report to parents each child’s progress
Source: Authors’ analysis based on interviews with sample preschools.
teacher who used an internally developed assessment system reported that she would like additional data on children’s math outcomes and that she might benefit from the structure of an externally developed assessment system to be sure that she was assessing all domains of learning comprehensively. All other interviewees indicated that they did not see a need to collect additional data on early learning outcomes.
Data on child outcomes were used primarily for reporting to parents and informing instruction. Participating preschools reported using data on child outcomes in other ways, including sharing information among teachers as children move from one classroom in a center to another, choosing professional development for teachers based on outcomes that showed less progress, providing evidence of preschool effectiveness in grant proposals, comparing outcomes to state and national scores, providing encouragement to teachers, and showing children their own progress. All participating preschools reported that they found their data provided adequate information for these purposes.
In using and collecting outcome data, participating preschools struggled with time, communication, and technology. Both the administrator and the interviewed teacher at three preschools, all of which used commercially available assessment systems, indicated that time presented a major challenge in collecting data on child outcomes. “You have 20 children in a classroom; there are two of you there, and you’re doing your best to supervise children, offer them a great environment and great activities…but you still have to collect that information.” For the two preschools that used online, com-puter-based assessment tools, technology may have streamlined data collection when systems were working properly, but both reported that technology also introduced additional challenges to timely and efficient assessment. Another administrator described challenges using a portfolio system for informing instruction. She explained that the process of creating and using portfolios could be, at times, “cumbersome.” She described
reporting to parents and informing instruction, participating preschools reported sharing information among teachers as children move between classrooms, choosing professional development based on outcomes that showed less progress, and comparing outcomes to state and national scores
6
how teachers sometimes struggled with deciding how to categorize work samples as indicators of learning, particularly when one piece of work might be related to multiple learning domains.
Finally, among the three preschools that used assessment systems with quantitative output data, all administrators reported that they encountered difficulty knowing how best to communicate the data to various audiences. They described challenges in appropriately framing results for parents in ways that provided sufficient detail but were also easy to understand, not laden with jargon or complex figures. One administrator expressed a desire to share data with the general public, as a way of increasing awareness of the value of early childhood education. She also shared apprehension about being able to communicate something so complex in a way that anyone could understand: “I think that’s the challenge…figuring out how to pull the data, and then how do we communicate it to [the people] we need to communicate it to?”
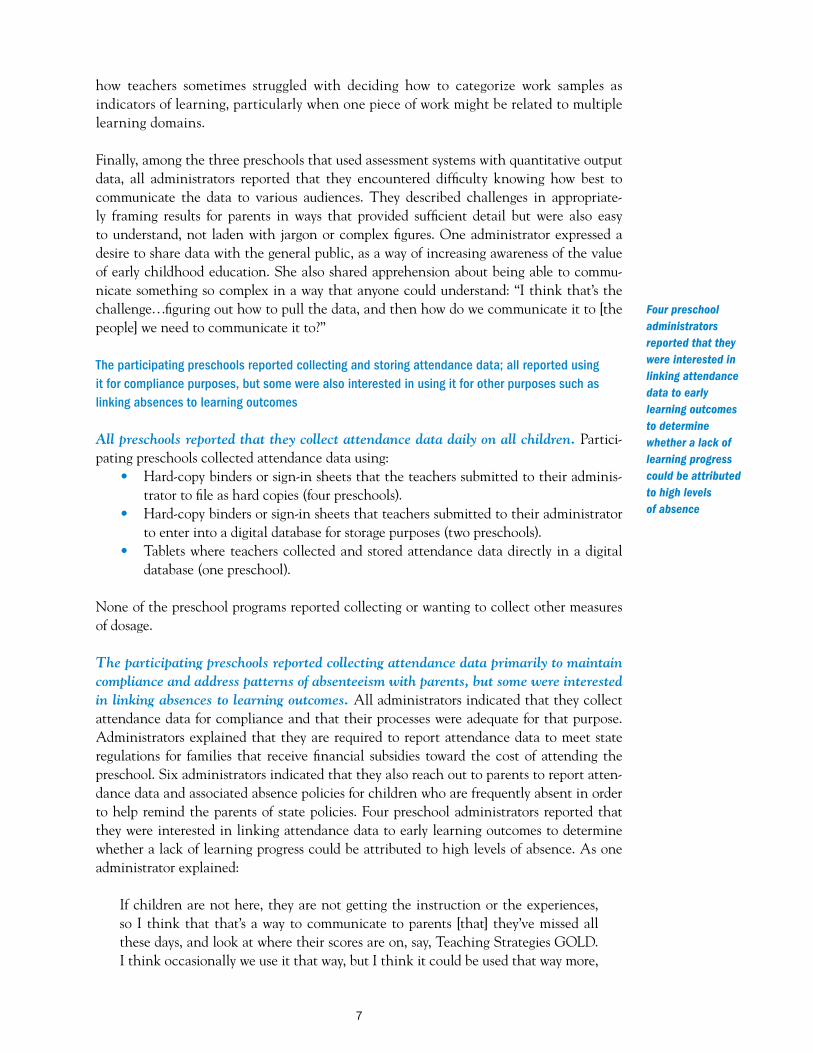
The participating preschools reported collecting and storing attendance data; all reported using it for compliance purposes, but some were also interested in using it for other purposes such as linking absences to learning outcomes
All preschools reported that they collect attendance data daily on all children. Participating preschools collected attendance data using:
• Hard-copy binders or sign-in sheets that the teachers submitted to their administrator to file as hard copies (four preschools).
• Hard-copy binders or sign-in sheets that teachers submitted to their administrator to enter into a digital database for storage purposes (two preschools).
• Tablets where teachers collected and stored attendance data directly in a digital database (one preschool).
None of the preschool programs reported collecting or wanting to collect other measures of dosage.
The participating preschools reported collecting attendance data primarily to maintain compliance and address patterns of absenteeism with parents, but some were interested in linking absences to learning outcomes. All administrators indicated that they collect attendance data for compliance and that their processes were adequate for that purpose. Administrators explained that they are required to report attendance data to meet state regulations for families that receive financial subsidies toward the cost of attending the preschool. Six administrators indicated that they also reach out to parents to report attendance data and associated absence policies for children who are frequently absent in order to help remind the parents of state policies. Four preschool administrators reported that they were interested in linking attendance data to early learning outcomes to determine whether a lack of learning progress could be attributed to high levels of absence. As one administrator explained:
If children are not here, they are not getting the instruction or the experiences, so I think that that’s a way to communicate to parents [that] they’ve missed all these days, and look at where their scores are on, say, Teaching Strategies GOLD. I think occasionally we use it that way, but I think it could be used that way more,
Four preschool administrators reported that they were interested in linking attendance data to early learning outcomes to determine whether a lack of learning progress could be attributed to high levels of absence
7
to really help parents understand why attendance, even at this young age, is really important.
The participating preschools did not encounter challenges regarding the quality of attendance data. Only one administrator reported that the quality of attendance data could be improved with a continued focus on accuracy of data and making sure that data are entered into the system in a timely manner. When asked about challenges that administrators face when using attendance data, administrators gave mixed responses:
• Four administrators reported no significant challenges. • One administrator reported challenges identifying patterns of absences quickly
enough to alert parents if attendance data were not entered and reviewed until the end of the month.
• One administrator explained that “a common obstacle in our field is families actually reading and being receptive to [the information provided].” She indicated that materials are often overlooked and it would be helpful to think about how best to provide the information.
Although all participating preschools reported conducting classroom observations to inform teacher practice, the structure and formality of the processes varied
Three preschools used externally developed classroom quality instruments, one developed its own instrument, and the remaining three did not use instruments. A classroom quality instrument is a tool to measure a defined set of teacher practices or classroom environment characteristics. Administrators from all seven preschools indicated that they regularly observed their preschool classrooms. Three preschools used the Early Childhood Environment Rating Scale–Revised, and two of those also used another observation instrument, the Arnett Caregiver Interaction Scale or the Classroom Assessment Scoring System. Of these, two conducted annual observations, and one conducted biannual observations.
The remaining four preschools used internally developed systems: • An instrument developed by the administrator consisting of four domains (class
room environment, interactions, planning and preparation, and personal qualities) and a three-point rating scale (needs improvement, satisfactory, exceeds work performance; one preschool).
• An open-ended form with observation notes and recommendations (one preschool). • Informal observations without instruments (two preschools).
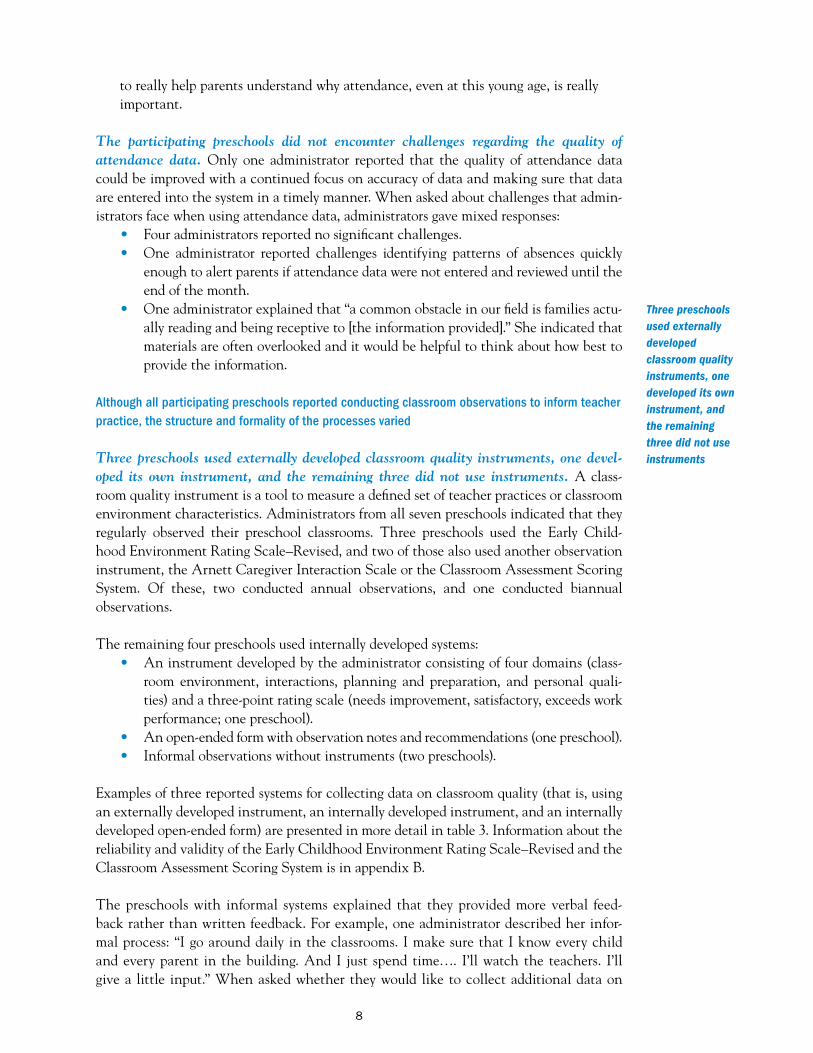
Examples of three reported systems for collecting data on classroom quality (that is, using an externally developed instrument, an internally developed instrument, and an internally developed open-ended form) are presented in more detail in table 3. Information about the reliability and validity of the Early Childhood Environment Rating Scale–Revised and the Classroom Assessment Scoring System is in appendix B.
The preschools with informal systems explained that they provided more verbal feedback rather than written feedback. For example, one administrator described her informal process: “I go around daily in the classrooms. I make sure that I know every child and every parent in the building. And I just spend time…. I’ll watch the teachers. I’ll give a little input.” When asked whether they would like to collect additional data on
Three preschools used externally developed classroom quality instruments, one developed its own instrument, and the remaining three did not use instruments
8

-
Table 3. Three preschools’ systems for assessing classroom quality
Characteristic Externally developed instrument
Internally developed instrument
Internally developed open ended form
Classroom quality instrument
• Early Childhood Environment Rating Scale–Revised
• Classroom Assessment
Internally developed score sheet with four domains: • Planning and preparation • Classroom environment
• Internally developed open-ended form that includes what the administrator observed and
Scoring System • Interactions • Personal qualities
recommendations
Collection method • Site directors, education • Administrator observes • Teachers observe and frequency mentors, and coordina
tors conduct observateachers every other month and takes notes
other teachers using a checklist
tions monthly • Observer completes
spreadsheets for each instrument with scores
• Administrator completes score sheet
• Administrator observes teachers monthly and completes a form that lists observations and
(paper for Early Childhood Environment Rating Scale–Revised; Excel for
recommendations
Classroom Assessment Scoring System)
Two preschools indicated that they addressed any concerns about the quality of the data on classroom
Reporting method • Administrator reviews • Administrator provides • Results are discussed in quality through the results with the the score sheets to individual conversations training or through teacher and creates an teachers during feed- and at staff meetings quality checks action plan; adminis- back sessions • Administrators and trators do not provide • Teachers and adminis- teachers keep a copy numbers but provide trator keep a copy a range (that is, low, medium, high)
• Administrators and teachers keep a copy
Note: See appendix B for information on the reliability and validity of the Early Childhood Environment Rating Scale–Revised and the Classroom Assessment Scoring System.
Source: Authors’ analysis based on interviews with sample preschools.
classroom quality, only one administrator and one teacher (from different preschools) indicated that they would like to conduct more formal observations but that there was not enough time.
Two preschools indicated that they addressed any concerns about the quality of the data on classroom quality through training or through quality checks. One administrator explained how she acknowledges that there is subjectivity when teachers do self-evaluations using the Early Childhood Environment Rating Scale–Revised but that the preschool provided training on the tools. Further, she stresses to the teachers that they should be critical because there are no penalties for low scores and “if we don’t really look at ourselves honestly, we can’t move forward.” The other administrator explained that when she is surprised by a score, she checks reliability by making additional observations with her colleagues and comparing scores. The remaining schools did not describe any concerns with the data, nor did they provide information about efforts to ensure reliability.
Teachers indicated that they examined the quality of their own classrooms, though the method for doing so varied. Of the three preschools in which administrators reported using the Early Childhood Environment Rating Scale–Revised to assess classroom quality,
9
-
one teacher mentioned this instrument when asked about the measure of quality used in her preschool. Teachers examined the quality of their classrooms in other ways, including:
• Conducting self-assessments (two teachers). • Setting goals (one teacher). • Providing a form for parents to complete anonymously (one teacher). • Observing other teachers or classrooms (two teachers).
There were two purposes for observing other teachers: providing feedback to the observed teachers and providing professional development for the observing teachers. As one teacher explained:
She’s gotten coverage so I could just go in and observe in the toddler room, where she just wanted me to make observations. And then she’ll actually use that information to talk with the teachers about what maybe they could change … but also asked me … what did I learn from it? So she wants me to write down a couple things that I’ve learned.
Classroom quality measures were used to improve teacher practice. Seven administrators and six teachers indicated that they used data on classroom quality to reflect on and improve their teaching practice. For example, one administrator stated that the purpose was “to reflect on what they’re doing in the classroom and make any adjustments to…their classroom management, the way that they’re interacting with children, or what they’re actually presenting for activities to the children to help develop the children.” Another program described how they use data on classroom quality to develop individual development plans. Three of the preschools also discussed compliance purposes, specifically the issue of inputting data on classroom quality in the state’s quality rating and improvement system database (box 4). In order to advance in this rating system, programs need to demonstrate sufficient classroom quality using specified assessment tools. This provides a strong impetus to collect data on classroom quality.
The participating preschools reported challenges related to finding time to conduct observations and changing their practices. When asked about the challenges that they face, three administrators reported that time was a challenge. For example, one administrator noted that the process takes four to five hours for each teacher. Two of the teachers reported that receiving criticism and changing practices could be challenging. However, none of the teachers indicated that they needed additional support.
Box 4. Quality rating and improvement system overview
A quality rating and improvement system is a method to systematically assess the quality of
early childhood education programs (as well as home-based and afterschool programs) so that
this information can be communicated to inform consumers and can support the program in
advancing to higher quality. Although voluntary, programs choose to be rated and work toward
advancing their ratings because of several incentives: with higher ratings they may attract
more families to enroll their children, programs may be eligible for increased financial incen
tives as they move up the rating scale, and programs may become eligible for technical assis
tance through the quality rating and improvement system.
Seven administrators and six teachers indicated that they used data on classroom quality to reflect on and improve their teaching practice
10
Considerations for using Early Childhood program data
This section presents several ways that preschool programs could use data to inform program-level decisions as well as the challenges associated with compiling and analyzing data.
Preschools could use child data to inform program-level decisions
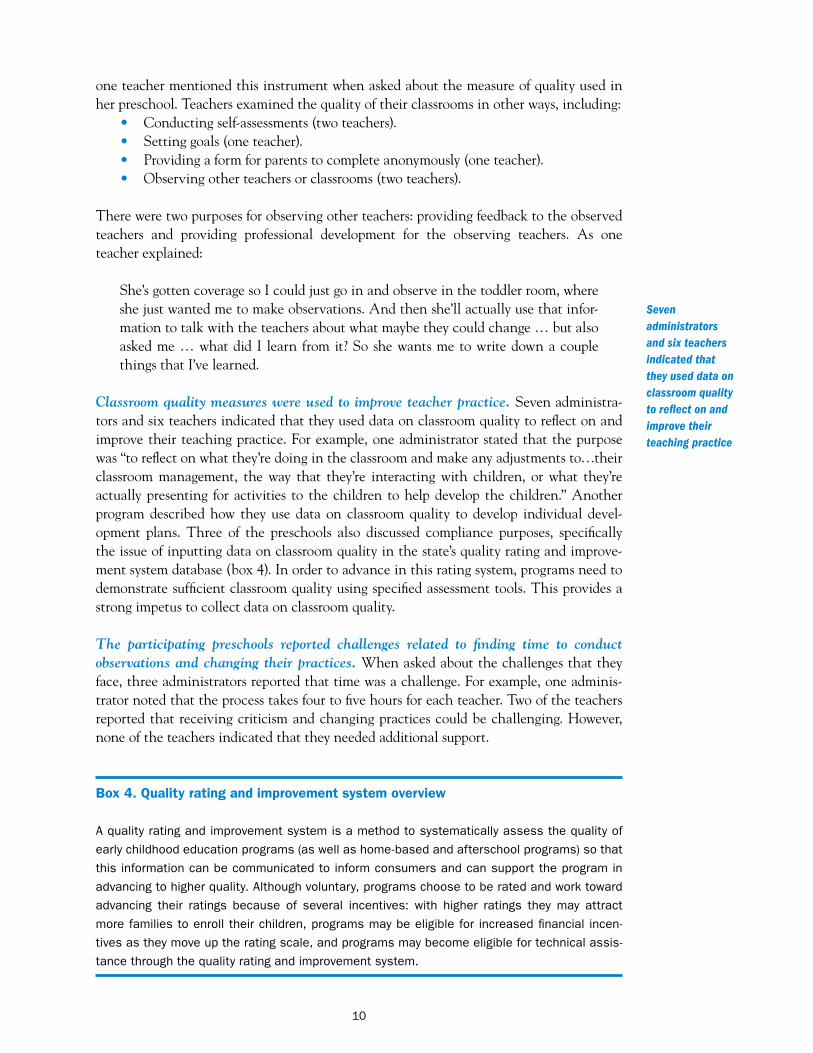
Although the participating preschools used data on early learning outcomes primarily to determine progress or growth for individual students, preschools may also benefit from examining scores for all children in a classroom or in a program. For example, Program B might examine its data on early learning outcomes (in this case, Teaching Strategies GOLD data) to see how children perform at the program level. Students in Program B scored significantly higher in the spring than in the fall in all three domains (figure 1). By reviewing these data, a preschool administrator may consider:
• Whether children’s scores align with expectations. • How children’s scores compare to national averages. • Where to target professional development. • What policies or practices they want to consider to increase children’s scores the
following year.
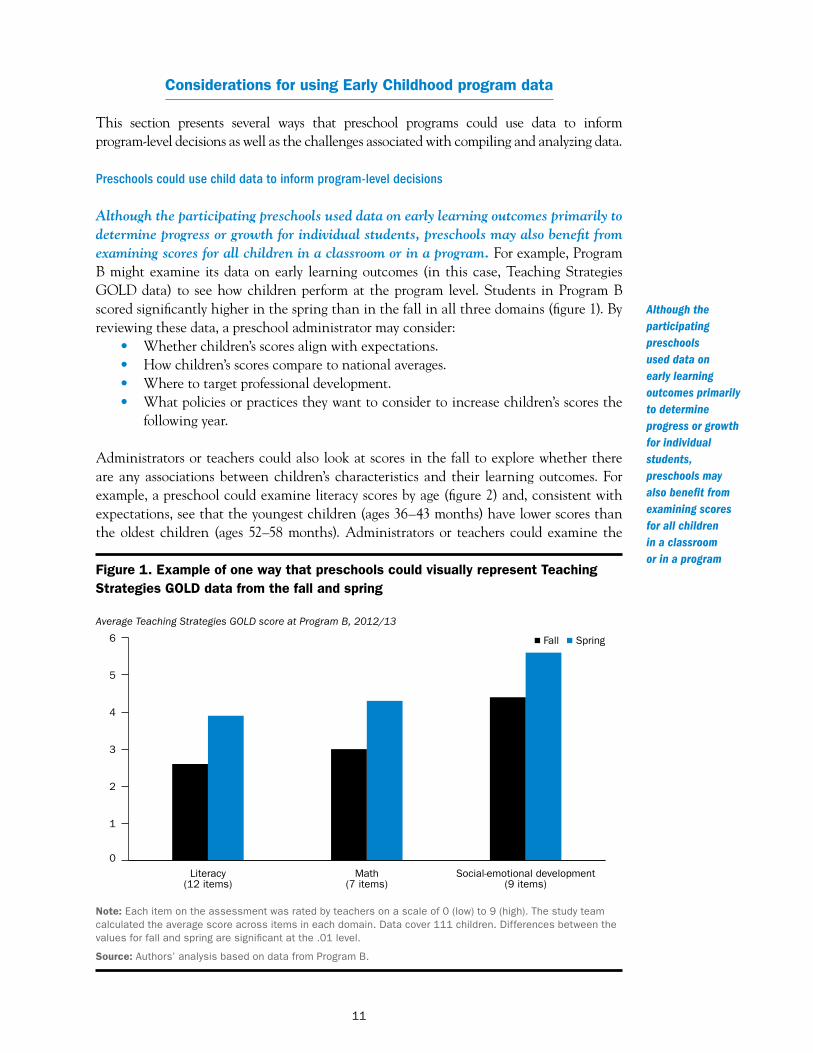
Administrators or teachers could also look at scores in the fall to explore whether there are any associations between children’s characteristics and their learning outcomes. For example, a preschool could examine literacy scores by age (figure 2) and, consistent with expectations, see that the youngest children (ages 36–43 months) have lower scores than the oldest children (ages 52–58 months). Administrators or teachers could examine the
Figure 1. Example of one way that preschools could visually represent Teaching Strategies GOLD data from the fall and spring
Average Teaching Strategies GOLD score at Program B, 2012/13
6
5
4
3
2
1
0 Literacy Math Social-emotional development
(12 items) (7 items) (9 items)
Fall Spring
Note: Each item on the assessment was rated by teachers on a scale of 0 (low) to 9 (high). The study team calculated the average score across items in each domain. Data cover 111 children. Differences between the values for fall and spring are significant at the .01 level.
Source: Authors’ analysis based on data from Program B.
Although the participating preschools used data on early learning outcomes primarily to determine progress or growth for individual students, preschools may also benefit from examining scores for all children in a classroom or in a program
11
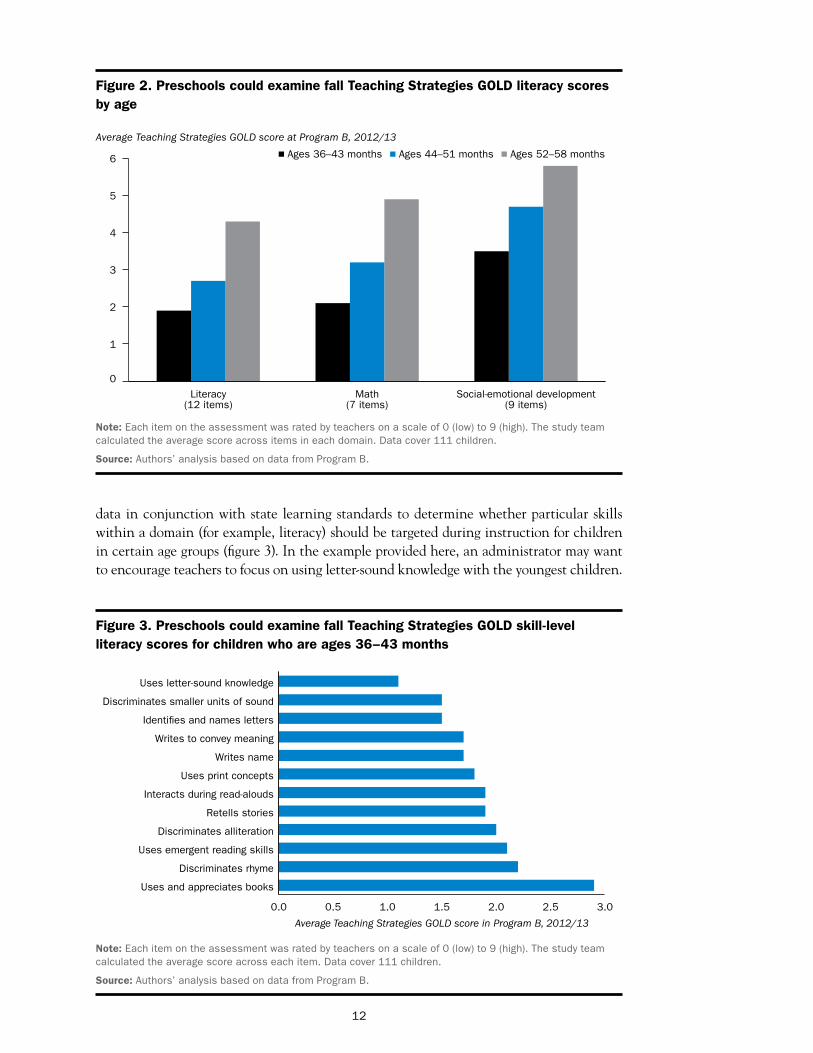
Figure 2. Preschools could examine fall Teaching Strategies GOLD literacy scores by age
Average Teaching Strategies GOLD score at Program B, 2012/13
6
5
4
3
2
1
0
Ages 36–43 months Ages 44–51 months Ages 52–58 months
Literacy Math Social-emotional development (12 items) (7 items) (9 items)
Note: Each item on the assessment was rated by teachers on a scale of 0 (low) to 9 (high). The study team calculated the average score across items in each domain. Data cover 111 children.
Source: Authors’ analysis based on data from Program B.
data in conjunction with state learning standards to determine whether particular skills within a domain (for example, literacy) should be targeted during instruction for children in certain age groups (figure 3). In the example provided here, an administrator may want to encourage teachers to focus on using letter-sound knowledge with the youngest children.
Figure 3. Preschools could examine fall Teaching Strategies GOLD skill-level literacy scores for children who are ages 36–43 months
Uses letter-sound knowledge
Discriminates smaller units of sound
Identifies and names letters
Writes to convey meaning
Writes name
Uses print concepts
Interacts during read-alouds
Retells stories
Discriminates alliteration
Uses emergent reading skills
Discriminates rhyme
Uses and appreciates books
0.0 0.5 1.0 1.5 2.0 2.5
Average Teaching Strategies GOLD score in Program B, 2012/13
Note: Each item on the assessment was rated by teachers on a scale of 0 (low) to 9 (high). The study team calculated the average score across each item. Data cover 111 children.
Source: Authors’ analysis based on data from Program B.
12
3.0
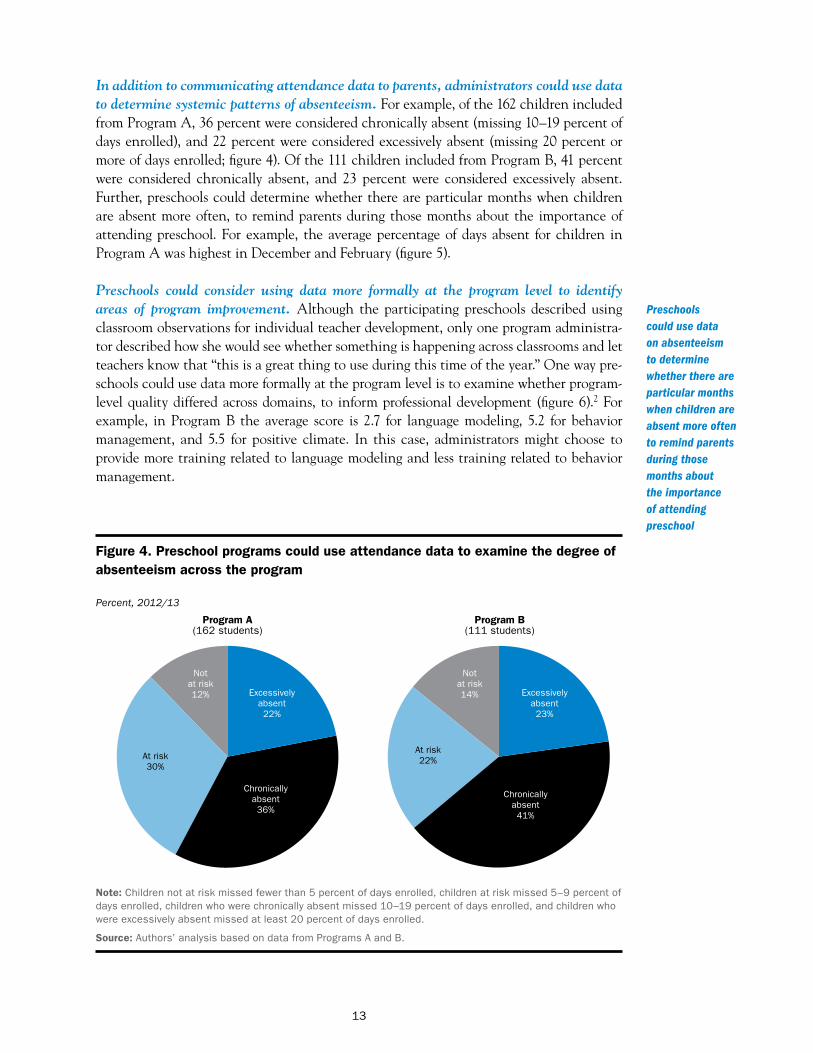
In addition to communicating attendance data to parents, administrators could use data to determine systemic patterns of absenteeism. For example, of the 162 children included from Program A, 36 percent were considered chronically absent (missing 10–19 percent of days enrolled), and 22 percent were considered excessively absent (missing 20 percent or more of days enrolled; figure 4). Of the 111 children included from Program B, 41 percent were considered chronically absent, and 23 percent were considered excessively absent. Further, preschools could determine whether there are particular months when children are absent more often, to remind parents during those months about the importance of attending preschool. For example, the average percentage of days absent for children in Program A was highest in December and February (figure 5).
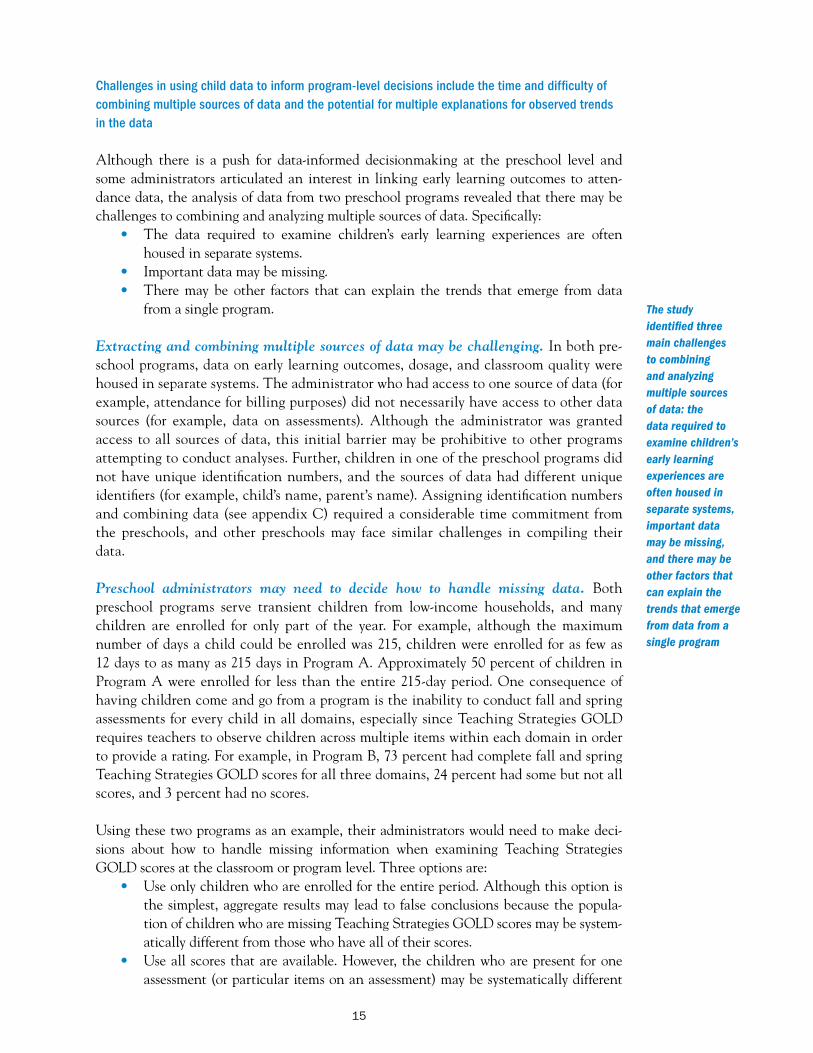
Preschools could consider using data more formally at the program level to identify areas of program improvement. Although the participating preschools described using classroom observations for individual teacher development, only one program administrator described how she would see whether something is happening across classrooms and let teachers know that “this is a great thing to use during this time of the year.” One way preschools could use data more formally at the program level is to examine whether program-level quality differed across domains, to inform professional development (figure 6).2 For example, in Program B the average score is 2.7 for language modeling, 5.2 for behavior management, and 5.5 for positive climate. In this case, administrators might choose to provide more training related to language modeling and less training related to behavior management.
Figure 4. Preschool programs could use attendance data to examine the degree of absenteeism across the program
Percent, 2012/13
Program A Program B (162 students) (111 students)
Excessively absent 22%
Excessively absent 23%
At risk 30%
At risk 22%
Not at risk 12%
Not at risk 14%
Chronically absent 36%
Chronically absent 41%
Note: Children not at risk missed fewer than 5 percent of days enrolled, children at risk missed 5–9 percent of days enrolled, children who were chronically absent missed 10–19 percent of days enrolled, and children who were excessively absent missed at least 20 percent of days enrolled.
Source: Authors’ analysis based on data from Programs A and B.
Preschools could use data on absenteeism to determine whether there are particular months when children are absent more often to remind parents during those months about the importance of attending preschool
13
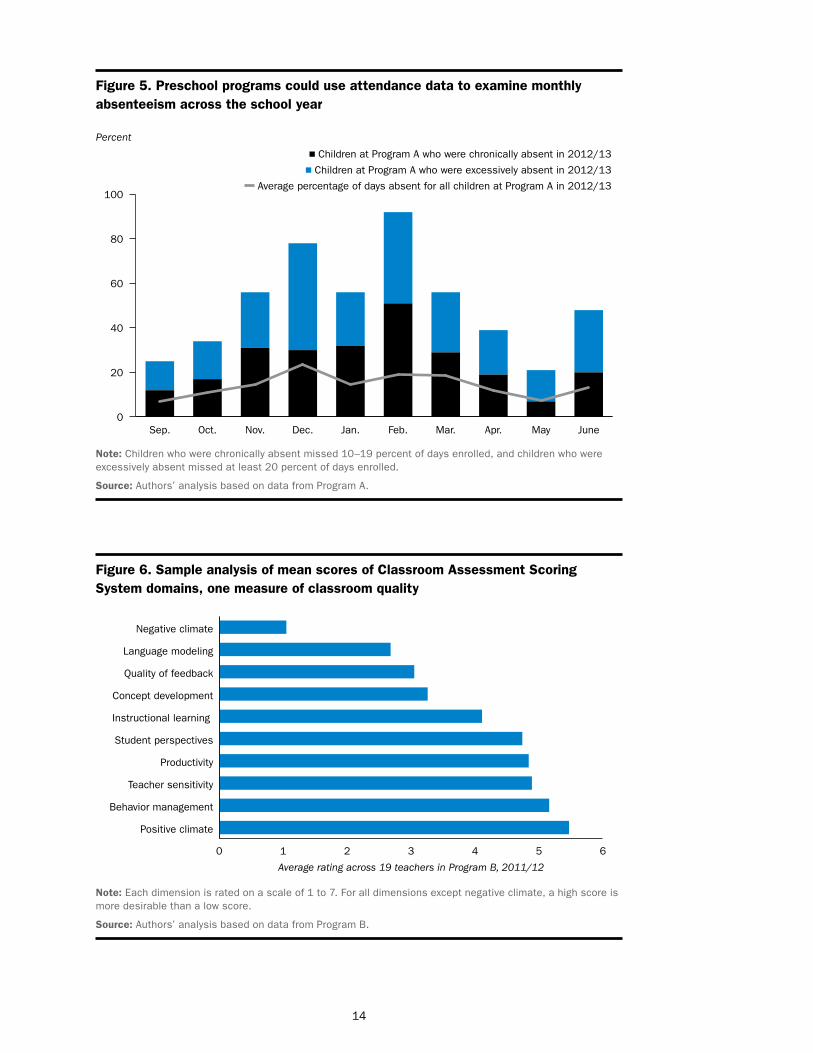
Figure 5. Preschool programs could use attendance data to examine monthly absenteeism across the school year
Percent
Children at Program A who were chronically absent in 2012/13
Children at Program A who were excessively absent in 2012/13
Average percentage of days absent for all children at Program A in 2012/13 100
80
60
40
20
0
Note: Children who were chronically absent missed 10–19 percent of days enrolled, and children who were excessively absent missed at least 20 percent of days enrolled.
Source: Authors’ analysis based on data from Program A.
Sep. Oct. Nov. Dec. Jan. Feb. Mar. Apr. May June
Figure 6. Sample analysis of mean scores of Classroom Assessment Scoring System domains, one measure of classroom quality
Negative climate
Language modeling
Quality of feedback
Concept development
Instructional learning
Student perspectives
Productivity
Teacher sensitivity
Behavior management
Positive climate
0 1 2 3 4 5
Average rating across 19 teachers in Program B, 2011/12
Note: Each dimension is rated on a scale of 1 to 7. For all dimensions except negative climate, a high score is more desirable than a low score.
Source: Authors’ analysis based on data from Program B.
14
6
Challenges in using child data to inform program-level decisions include the time and difficulty of combining multiple sources of data and the potential for multiple explanations for observed trends in the data
Although there is a push for data-informed decisionmaking at the preschool level and some administrators articulated an interest in linking early learning outcomes to attendance data, the analysis of data from two preschool programs revealed that there may be challenges to combining and analyzing multiple sources of data. Specifically:
• The data required to examine children’s early learning experiences are often housed in separate systems.
• Important data may be missing. • There may be other factors that can explain the trends that emerge from data
from a single program.
Extracting and combining multiple sources of data may be challenging. In both preschool programs, data on early learning outcomes, dosage, and classroom quality were housed in separate systems. The administrator who had access to one source of data (for example, attendance for billing purposes) did not necessarily have access to other data sources (for example, data on assessments). Although the administrator was granted access to all sources of data, this initial barrier may be prohibitive to other programs attempting to conduct analyses. Further, children in one of the preschool programs did not have unique identification numbers, and the sources of data had different unique identifiers (for example, child’s name, parent’s name). Assigning identification numbers and combining data (see appendix C) required a considerable time commitment from the preschools, and other preschools may face similar challenges in compiling their data.
Preschool administrators may need to decide how to handle missing data. Both preschool programs serve transient children from low-income households, and many children are enrolled for only part of the year. For example, although the maximum number of days a child could be enrolled was 215, children were enrolled for as few as 12 days to as many as 215 days in Program A. Approximately 50 percent of children in Program A were enrolled for less than the entire 215-day period. One consequence of having children come and go from a program is the inability to conduct fall and spring assessments for every child in all domains, especially since Teaching Strategies GOLD requires teachers to observe children across multiple items within each domain in order to provide a rating. For example, in Program B, 73 percent had complete fall and spring Teaching Strategies GOLD scores for all three domains, 24 percent had some but not all scores, and 3 percent had no scores.
Using these two programs as an example, their administrators would need to make decisions about how to handle missing information when examining Teaching Strategies GOLD scores at the classroom or program level. Three options are:
• Use only children who are enrolled for the entire period. Although this option is the simplest, aggregate results may lead to false conclusions because the population of children who are missing Teaching Strategies GOLD scores may be systematically different from those who have all of their scores.
• Use all scores that are available. However, the children who are present for one assessment (or particular items on an assessment) may be systematically different
The study identified three main challenges to combining and analyzing multiple sources of data: the data required to examine children’s early learning experiences are often housed in separate systems, important data may be missing, and there may be other factors that can explain the trends that emerge from data from a single program
15
from those who are there for another assessment. For example, comparing fall and spring scores of different populations of children may prove misleading.
• Substitute missing scores with an approximation. However, this requires a technical process of either data imputation or mean replacement, both of which would be beyond the capacity of a typical preschool administrator. (The study team imputed data; see appendix B.)
Knowledge of these concerns may improve a preschool administrator’s interpretation of the results. An administrator who pursued the first option would know that the results apply to the children who are enrolled for the full period. An administrator who pursued the second option could look at the differences in the characteristics of the children included in the fall and spring (for example, income level) and how those difference might influence the results; that administrator could also consider what other sources of data may help inform decisionmaking.
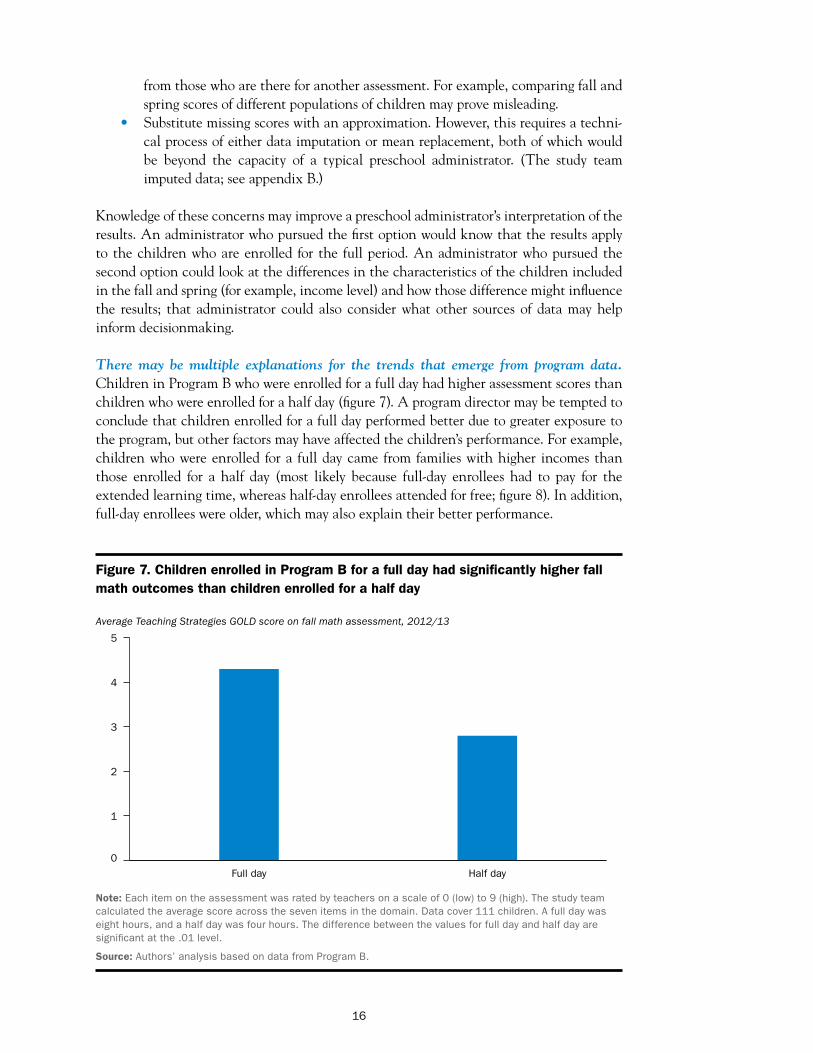
There may be multiple explanations for the trends that emerge from program data. Children in Program B who were enrolled for a full day had higher assessment scores than children who were enrolled for a half day (figure 7). A program director may be tempted to conclude that children enrolled for a full day performed better due to greater exposure to the program, but other factors may have affected the children’s performance. For example, children who were enrolled for a full day came from families with higher incomes than those enrolled for a half day (most likely because full-day enrollees had to pay for the extended learning time, whereas half-day enrollees attended for free; figure 8). In addition, full-day enrollees were older, which may also explain their better performance.
Figure 7. Children enrolled in Program B for a full day had significantly higher fall math outcomes than children enrolled for a half day
Average Teaching Strategies GOLD score on fall math assessment, 2012/13
5
4
3
2
1
0 Full day Half day
Note: Each item on the assessment was rated by teachers on a scale of 0 (low) to 9 (high). The study team calculated the average score across the seven items in the domain. Data cover 111 children. A full day was eight hours, and a half day was four hours. The difference between the values for full day and half day are significant at the .01 level.
Source: Authors’ analysis based on data from Program B.
16
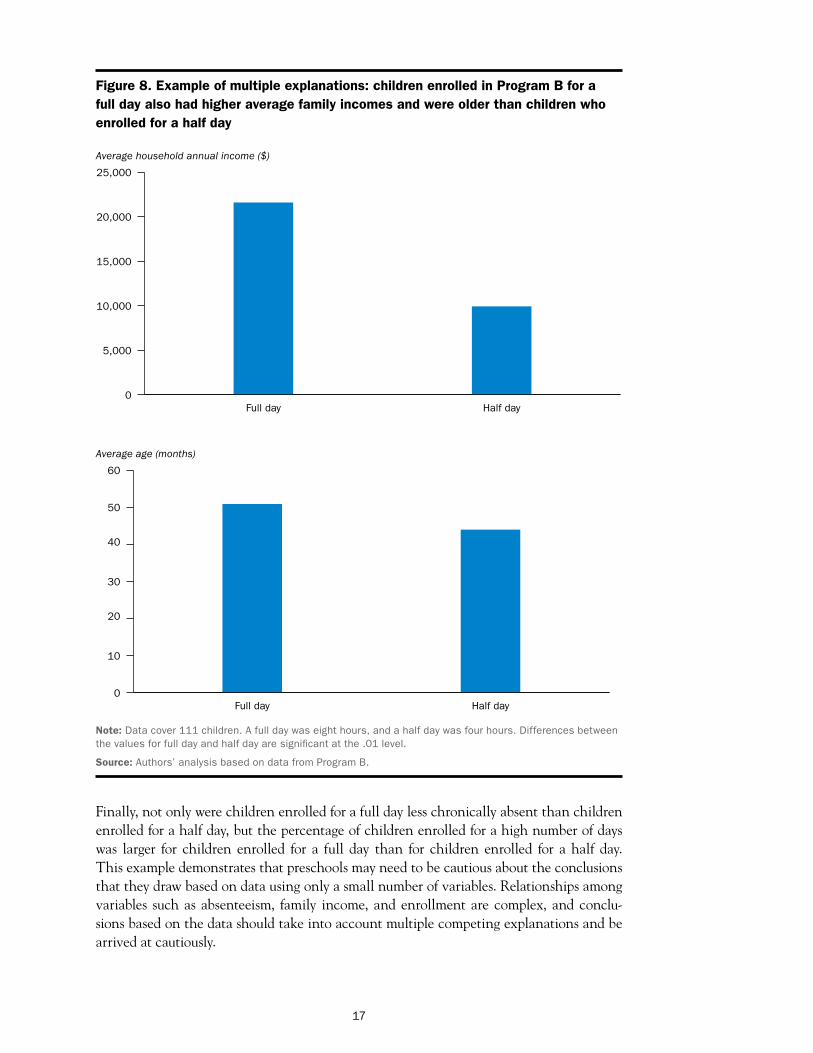
Figure 8. Example of multiple explanations: children enrolled in Program B for a full day also had higher average family incomes and were older than children who enrolled for a half day
Average household annual income ($)
Full day Half day
Average age (months)
Full day Half day
Note: Data cover 111 children. A full day was eight hours, and a half day was four hours. Differences between the values for full day and half day are significant at the .01 level.
Source: Authors’ analysis based on data from Program B.
0
5,000
10,000
15,000
20,000
25,000
0
10
20
30
40
50
60
Finally, not only were children enrolled for a full day less chronically absent than children enrolled for a half day, but the percentage of children enrolled for a high number of days was larger for children enrolled for a full day than for children enrolled for a half day. This example demonstrates that preschools may need to be cautious about the conclusions that they draw based on data using only a small number of variables. Relationships among variables such as absenteeism, family income, and enrollment are complex, and conclusions based on the data should take into account multiple competing explanations and be arrived at cautiously.
17
Limitations of the study
This study has several limitations: • The participants in this study are not representative of all preschool adminis
trators or teachers in the study city. Participants were not randomly selected but were recruited based on the criteria discussed above and agreed to participate in the study. Further, the teachers in the participating centers were selected to participate by the administrators. In addition, the preschools in this study are from one mid-sized city in the Northeast Region and are not representative of all preschools. Although the findings from this study may be relevant to preschools in other areas, the study would need to be replicated in order to draw widespread conclusions.
• The study team hypothesizes that preschools that do not use data in a systematic way would be less likely to agree to participate in this study. Programs that do not systematically collect or use data may not be comfortable describing their data use. Thus, the systems to collect and use data presented in this report may not represent the full spectrum of data use in preschools.
• This study focuses on how data are collected and used by the participating preschools; it does not provide information about the quality of internally developed data collection tools (for example, reliability or validity) or processes to use data.
• The sample size is small for both the interviews and the preschools that provided data. The study team conducted interviews with seven teachers and seven administrators. The data analysis is based on two preschools: Program A included 162 children and 12 teachers, and Program B included 111 children and 19 teachers. Thus, the findings from this study are illustrative but not generalizable.
• There were missing data from the two preschool programs. Approximately 30 percent of children in Program A and 73 percent of children in Program B had Teaching Strategies GOLD data for all items in the fall and spring. Thus, the study team imputed missing data (see appendix B).
Implications of the study
There are six main implications of this study: • Early childhood education programs may benefit from guidance on effective methods for
presenting information to parents about children’s progress and about the importance of attending preschool. The participating preschools used data on early learning outcomes and attendance for outreach to parents; however, they expressed difficulty in knowing how best to present data to different audiences.
• Preschool administrators could benefit from more state guidance about successful data practices and structures. According to the Early Childhood Data Collaborative (2014), 32 states have designated an early childhood education data governance entity to guide the development and use of state-coordinated longitudinal early childhood education data systems. These governance structures could help guide preschools as they collect and use data.
• Before instituting additional requirements for data collection, policymakers may want to weigh the benefits of additional data collection against the needs of practitioners and the time required to collect the information. Regardless of the instruments used or methods for collecting data on early learning outcomes, dosage, or classroom quality, the participating preschools generally did not want to collect additional
18
data. Administrators and teachers considered their current data collection efforts to be sufficient.
• The process of combining data would be simplified by unique identifiers, an integrated system to capture all information about children, and a data governance plan. There are challenges to using data at the classroom or program level to inform policy or practice, including the time and difficulty of combining multiple sources of data and the potential for multiple explanations for trends in the data.
• Practitioners and policymakers should be cautious when drawing conclusions from analyses based on program data. Looking for trends in the data may be useful, but administrators also need to consider whether there may be multiple explanations for observed trends and whether additional data may help them better understand the patterns that emerge.
• Further research is needed to determine the most promising methods of practitioner data use that may lead to better outcomes for children. The participating preschools employed a variety of methods to collect and use data on early learning outcomes, dosage, and classroom quality. Although preschools could draw on existing research on data use in K–12 education, evidence on what data use methods in K–12 education help improve student performance is inconclusive (Hamilton et al., 2009).
19
Appendix A. Methodology for interviews
This appendix describes the sample, recruitment strategy, interview protocol, and procedures for analyzing the interviews with administrators and teachers at preschool programs in a mid-sized city in the Northeast Region.
The study city was chosen for several reasons: • The size and demographic characteristics of the city population are similar to
those of other mid-sized cities in the region. • The size of the city meant that there would be a reasonably sized pool of potential
interviewees. • Information from state leaders indicated that the data necessary to complete
example analyses existed at two large preschools.
Sample
The population of preschools that were contacted for interviews included state-licensed center-based preschool programs that:
• Accepted children full-time (that is, not afterschool programs). • Served at least 40 preschool-age children (defined by the state to be 33 months to
5 years). • Operated in the study city or a town within 10 miles of the study city.
The list of preschools was obtained from the state’s registry of licensed early childhood centers, and the inclusion criteria were assessed based on the center’s profile. A center-based preschool program is an early childhood education program delivered in a community- or school-based setting.
Two preschools were recruited to provide data in addition to participating in interviews. These preschools represented two of the largest providers of preschool education in the study city, were willing to share the data needed for the current study, and were chosen based on the recommendation of the state commissioner. Five preschools were recruited for interviews in addition to the two preschools that provided data. The study team focused on recruiting preschools located within the study city and in towns within a 10 mile radius of the study city. Of the 38 preschools that were identified and contacted, 5 agreed to participate. A total of seven preschools were interviewed, including the two preschools that provided data.
All preschools invited to participate in the study received an initial recruitment email and a letter sent via the U.S. Postal Service. Within one week of sending the initial recruitment emails and letters, the study team contacted preschools by phone to address any questions regarding the study and to determine whether each preschool was interested in participating. Recruitment concluded in November 2013 with one administrator and one teacher from each of seven preschools agreeing to participate in face-to-face interviews. The study team interviewed either the administrator who received the recruitment email or a designee. Teacher interviewees were chosen by their administrators.
All the preschools enrolled children full time, and five of them accepted children part-time. The average number of children per classroom was approximately 15. Five of the
A-1
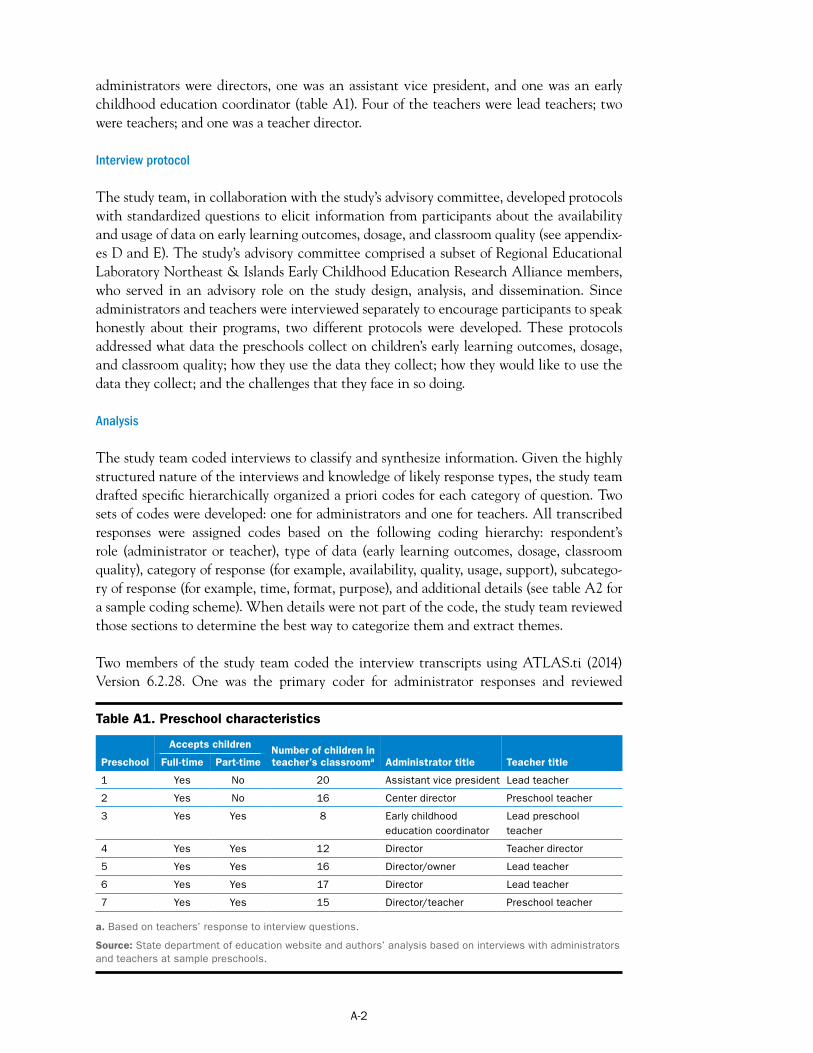
’-
administrators were directors, one was an assistant vice president, and one was an early childhood education coordinator (table A1). Four of the teachers were lead teachers; two were teachers; and one was a teacher director.
Interview protocol
The study team, in collaboration with the study’s advisory committee, developed protocols with standardized questions to elicit information from participants about the availability and usage of data on early learning outcomes, dosage, and classroom quality (see appendixes D and E). The study’s advisory committee comprised a subset of Regional Educational Laboratory Northeast & Islands Early Childhood Education Research Alliance members, who served in an advisory role on the study design, analysis, and dissemination. Since administrators and teachers were interviewed separately to encourage participants to speak honestly about their programs, two different protocols were developed. These protocols addressed what data the preschools collect on children’s early learning outcomes, dosage, and classroom quality; how they use the data they collect; how they would like to use the data they collect; and the challenges that they face in so doing.
Analysis
The study team coded interviews to classify and synthesize information. Given the highly structured nature of the interviews and knowledge of likely response types, the study team drafted specific hierarchically organized a priori codes for each category of question. Two sets of codes were developed: one for administrators and one for teachers. All transcribed responses were assigned codes based on the following coding hierarchy: respondent’s role (administrator or teacher), type of data (early learning outcomes, dosage, classroom quality), category of response (for example, availability, quality, usage, support), subcategory of response (for example, time, format, purpose), and additional details (see table A2 for a sample coding scheme). When details were not part of the code, the study team reviewed those sections to determine the best way to categorize them and extract themes.
Two members of the study team coded the interview transcripts using ATLAS.ti (2014) Version 6.2.28. One was the primary coder for administrator responses and reviewed
Table A1. Preschool characteristics
Preschool
Accepts children Number of children in teacher s classrooma Administrator title Teacher title Full time Part-time
1 Yes No 20 Assistant vice president Lead teacher
2 Yes No 16 Center director Preschool teacher
3 Yes Yes 8 Early childhood Lead preschool education coordinator teacher
4 Yes Yes 12 Director Teacher director
5 Yes Yes 16 Director/owner Lead teacher
6 Yes Yes 17 Director Lead teacher
7 Yes Yes 15 Director/teacher Preschool teacher
a. Based on teachers’ response to interview questions.
Source: State department of education website and authors’ analysis based on interviews with administrators and teachers at sample preschools.
A-2
’-
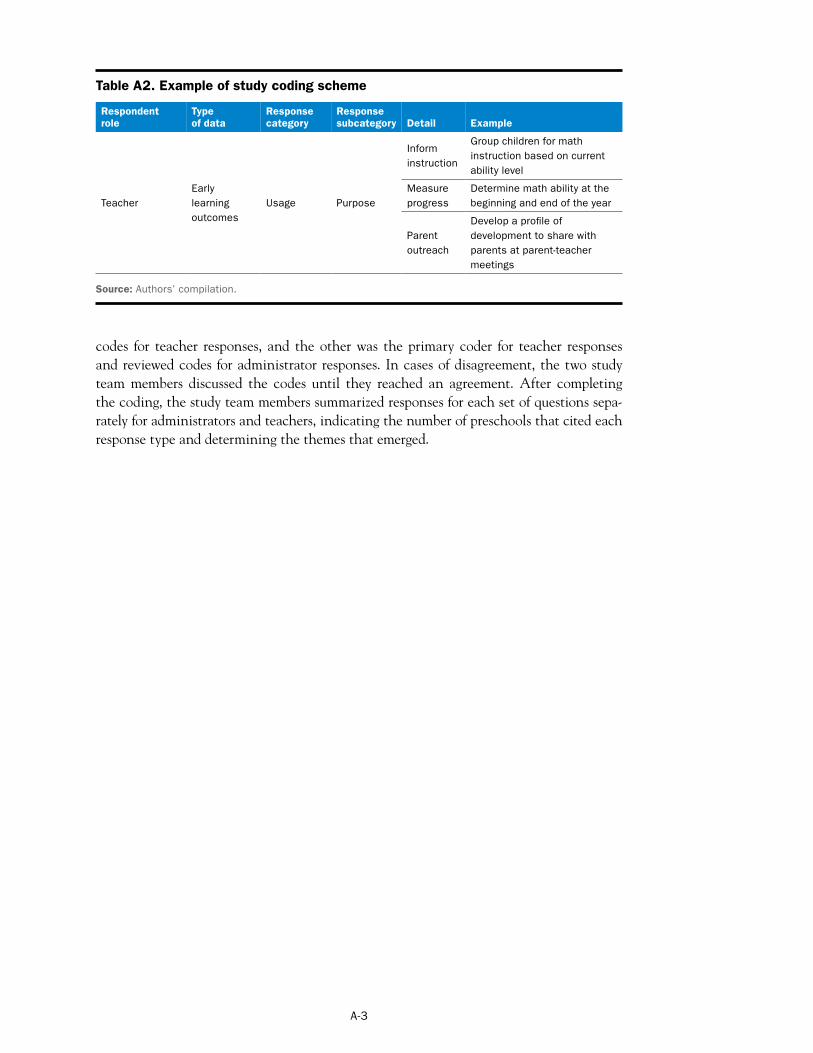
Table A2. Example of study coding scheme
Respondent role
Type of data
Response category
Response subcategory Detail Example
Early Teacher learning Usage Purpose
outcomes
Source: Authors’ compilation.
Group children for math Inform
instruction based on current instruction
ability level
Measure Determine math ability at the progress beginning and end of the year
Develop a profile of Parent development to share with outreach parents at parent-teacher
meetings
codes for teacher responses, and the other was the primary coder for teacher responses and reviewed codes for administrator responses. In cases of disagreement, the two study team members discussed the codes until they reached an agreement. After completing the coding, the study team members summarized responses for each set of questions separately for administrators and teachers, indicating the number of preschools that cited each response type and determining the themes that emerged.
A-3
Appendix B. Methodology for data analysis
This appendix describes the sample, variables, and methodology used to analyze the data from two preschool programs. The tables and analysis in this appendix should not be used to draw conclusions about early learning experiences or outcomes in general; rather, the appendix describes the process for analyzing the data for the tables and graphs in the report.
Sample
The study team approached four of the largest programs in the study city at the recommendation of the state commissioner based on the availability of data to conduct example analyses; two agreed to participate.
Program A was a private, nonprofit organization that provided early childhood programming for children from birth through kindergarten. It offered a full-day, year-round program, and children attended for an average of eight hours per day. Funding for this program came from the state and consisted of early education slots, vouchers, and other subsidies. The sample consisted of all 12 preschool teachers and 162 children (age 3 or 4 on September 1, 2012) across three centers in the study city. Preschool teachers are required to enter their children into the Teaching Strategies GOLD system, and thus children in the system for each of the 12 teachers were included in the analysis; 6 children did not have birthdates in the administrative data provided and were dropped from the study because it was not possible to determine whether they met the inclusion criteria. Additional information about the completeness of the Teaching Strategies GOLD data is discussed in the analysis section.
Program B was a federally funded early education program with six centers in the study city. It offered half-day year-round early childhood education programs at no cost to families who met income eligibility requirements as well as a full-day option on a sliding fee scale. The sample included all 19 preschool teachers and a nonrandom sample of 111 children who were age 3 or 4 on September 1, 2012, and who returned a consent form. Consent forms were required per Program B’s data-sharing policies. Three children had no Teaching Strategies GOLD scores. Approximately, 64 percent of children returned a consent form. Because information on the children who did not complete the form is not available, the study team cannot make claims about the representativeness of the sample. Additional information about the completeness of the Teaching Strategies GOLD data is discussed in the analysis section.
Data
The variables collected through this study can be categorized according to children’s characteristics, teacher characteristics, early learning outcomes, dosage, and measures of classroom quality.
Children’s characteristics. Both programs provided information on children’s race/ethnicity, sex, and age. Some 58 percent of children in Program A were female, and 38 percent in Program B were female (table B1). The average age was a little more than four years old in Program A and three years nine months in Program B. Program B also provided
B-1
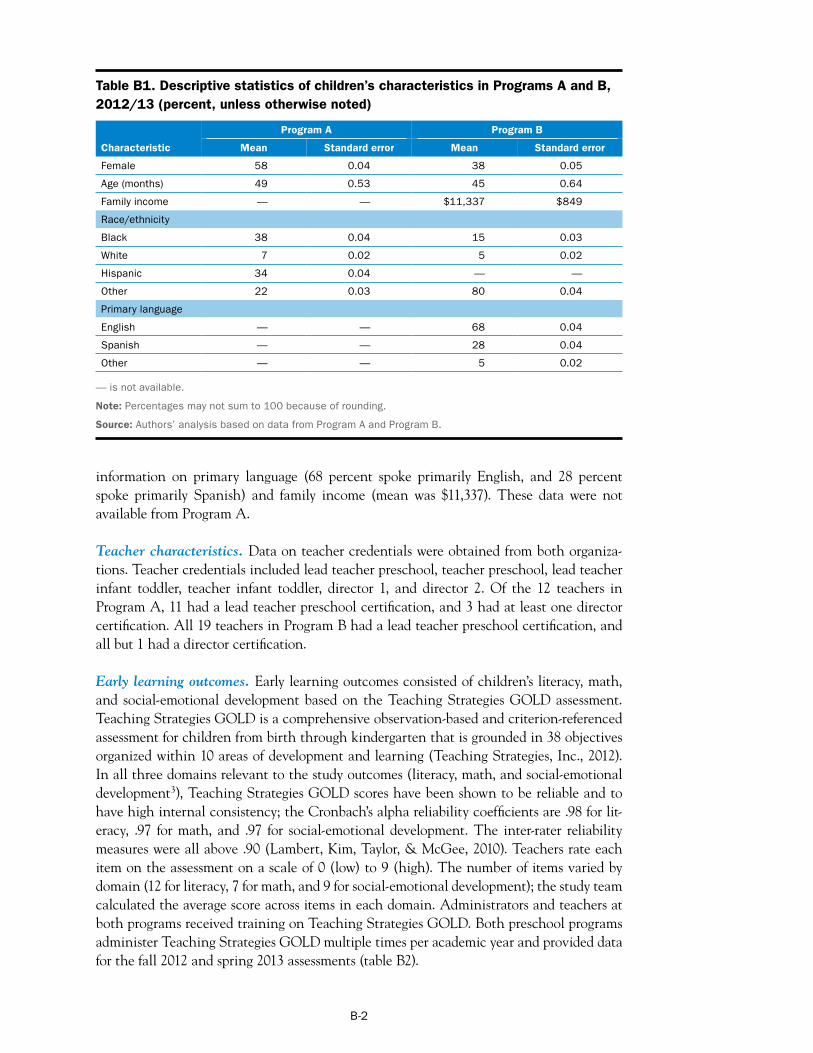
Table B1. Descriptive statistics of children’s characteristics in Programs A and B, 2012/13 (percent, unless otherwise noted)
Characteristic
Program A Program B
Mean Standard error Mean Standard error
Female 58 0.04 38 0.05
Age (months) 49 0.53 45 0.64
Black 38 0.04 15 0.03
White 7 0.02 5 0.02
Family income — — $11,337 $849
Race/ethnicity
Hispanic 34 0.04 — —
Other 22 0.03 80 0.04
English — — 68 0.04
Spanish — — 28 0.04
Primary language
Other — — 5 0.02
— is not available.
Note: Percentages may not sum to 100 because of rounding.
Source: Authors’ analysis based on data from Program A and Program B.
information on primary language (68 percent spoke primarily English, and 28 percent spoke primarily Spanish) and family income (mean was $11,337). These data were not available from Program A.
Teacher characteristics. Data on teacher credentials were obtained from both organizations. Teacher credentials included lead teacher preschool, teacher preschool, lead teacher infant toddler, teacher infant toddler, director 1, and director 2. Of the 12 teachers in Program A, 11 had a lead teacher preschool certification, and 3 had at least one director certification. All 19 teachers in Program B had a lead teacher preschool certification, and all but 1 had a director certification.
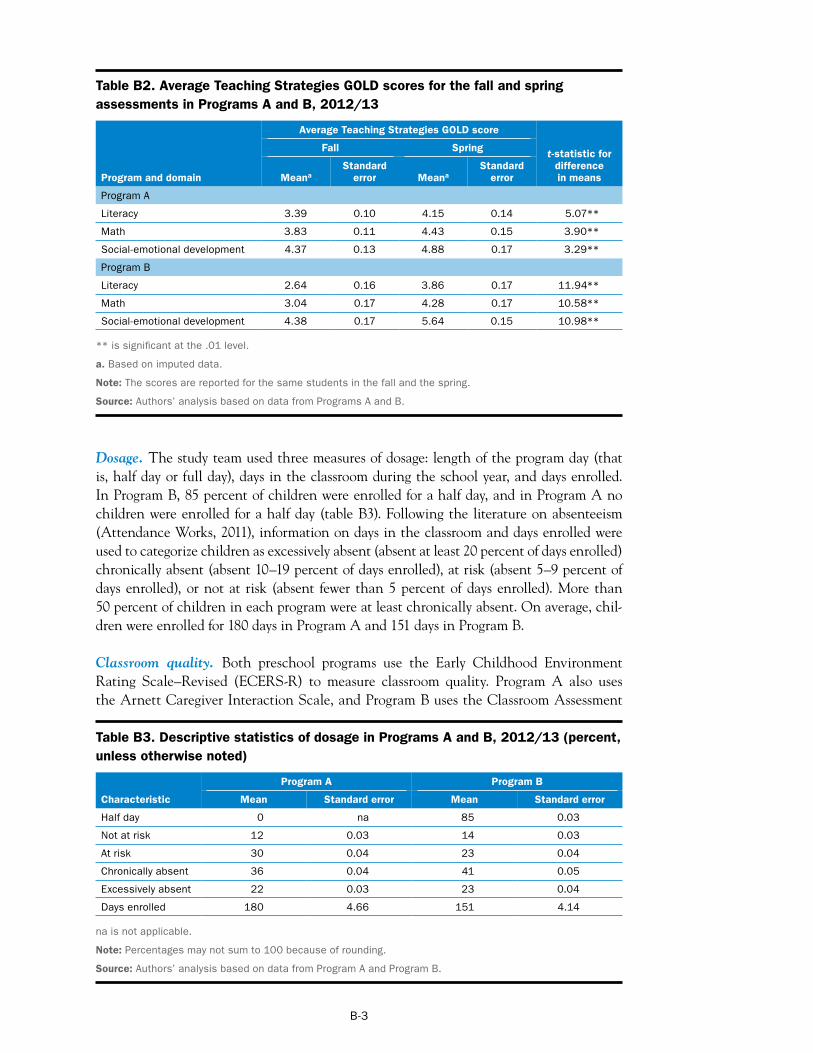
Early learning outcomes. Early learning outcomes consisted of children’s literacy, math, and social-emotional development based on the Teaching Strategies GOLD assessment. Teaching Strategies GOLD is a comprehensive observation-based and criterion-referenced assessment for children from birth through kindergarten that is grounded in 38 objectives organized within 10 areas of development and learning (Teaching Strategies, Inc., 2012). In all three domains relevant to the study outcomes (literacy, math, and social-emotional development3), Teaching Strategies GOLD scores have been shown to be reliable and to have high internal consistency; the Cronbach’s alpha reliability coefficients are .98 for literacy, .97 for math, and .97 for social-emotional development. The inter-rater reliability measures were all above .90 (Lambert, Kim, Taylor, & McGee, 2010). Teachers rate each item on the assessment on a scale of 0 (low) to 9 (high). The number of items varied by domain (12 for literacy, 7 for math, and 9 for social-emotional development); the study team calculated the average score across items in each domain. Administrators and teachers at both programs received training on Teaching Strategies GOLD. Both preschool programs administer Teaching Strategies GOLD multiple times per academic year and provided data for the fall 2012 and spring 2013 assessments (table B2).
B-2
-
Table B2. Average Teaching Strategies GOLD scores for the fall and spring assessments in Programs A and B, 2012/13
Program and domain
Average Teaching Strategies GOLD score
t -statistic for difference in means
Fall Spring
Meana Standard
error Meana Standard
error
Program A
Literacy 3.39 0.10 4.15 0.14 5.07**
Math 3.83 0.11 4.43 0.15 3.90**
Literacy 2.64 0.16 3.86 0.17 11.94**
Math 3.04 0.17 4.28 0.17 10.58**
Social-emotional development 4.37 0.13 4.88 0.17 3.29**
Program B
Social-emotional development 4.38 0.17 5.64 0.15 10.98**
** is significant at the .01 level.
a. Based on imputed data.
Note: The scores are reported for the same students in the fall and the spring.
Source: Authors’ analysis based on data from Programs A and B.
Dosage. The study team used three measures of dosage: length of the program day (that is, half day or full day), days in the classroom during the school year, and days enrolled. In Program B, 85 percent of children were enrolled for a half day, and in Program A no children were enrolled for a half day (table B3). Following the literature on absenteeism (Attendance Works, 2011), information on days in the classroom and days enrolled were used to categorize children as excessively absent (absent at least 20 percent of days enrolled) chronically absent (absent 10–19 percent of days enrolled), at risk (absent 5–9 percent of days enrolled), or not at risk (absent fewer than 5 percent of days enrolled). More than 50 percent of children in each program were at least chronically absent. On average, children were enrolled for 180 days in Program A and 151 days in Program B.
Classroom quality. Both preschool programs use the Early Childhood Environment Rating Scale–Revised (ECERS-R) to measure classroom quality. Program A also uses the Arnett Caregiver Interaction Scale, and Program B uses the Classroom Assessment
Table B3. Descriptive statistics of dosage in Programs A and B, 2012/13 (percent, unless otherwise noted)
Characteristic
Program A Program B
Mean Standard error Mean Standard error
Half day 0 na 85 0.03
Not at risk 12 0.03 14 0.03
At risk 30 0.04 23 0.04
Chronically absent 36 0.04 41 0.05
Excessively absent 22 0.03 23 0.04
Days enrolled 180 4.66 151 4.14
na is not applicable.
Note: Percentages may not sum to 100 because of rounding.
Source: Authors’ analysis based on data from Program A and Program B.
B-3
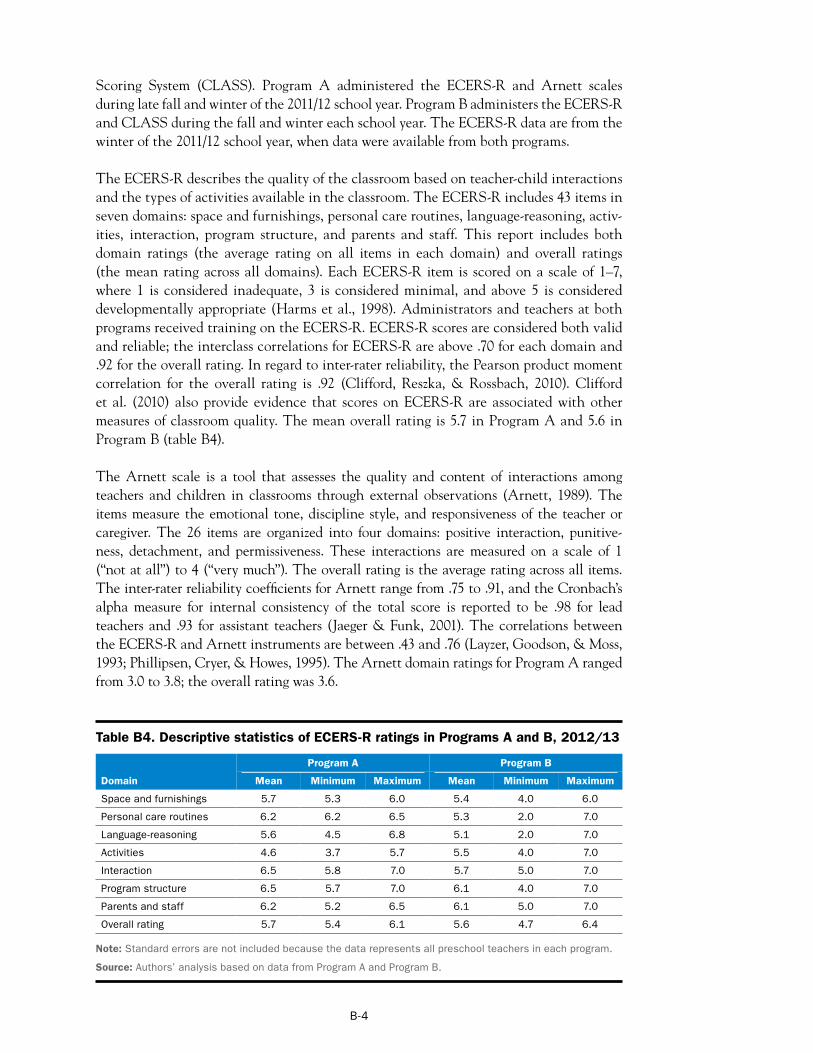
Scoring System (CLASS). Program A administered the ECERS-R and Arnett scales during late fall and winter of the 2011/12 school year. Program B administers the ECERS-R and CLASS during the fall and winter each school year. The ECERS-R data are from the winter of the 2011/12 school year, when data were available from both programs.
The ECERS-R describes the quality of the classroom based on teacher-child interactions and the types of activities available in the classroom. The ECERS-R includes 43 items in seven domains: space and furnishings, personal care routines, language-reasoning, activities, interaction, program structure, and parents and staff. This report includes both domain ratings (the average rating on all items in each domain) and overall ratings (the mean rating across all domains). Each ECERS-R item is scored on a scale of 1–7, where 1 is considered inadequate, 3 is considered minimal, and above 5 is considered developmentally appropriate (Harms et al., 1998). Administrators and teachers at both programs received training on the ECERS-R. ECERS-R scores are considered both valid and reliable; the interclass correlations for ECERS-R are above .70 for each domain and .92 for the overall rating. In regard to inter-rater reliability, the Pearson product moment correlation for the overall rating is .92 (Clifford, Reszka, & Rossbach, 2010). Clifford et al. (2010) also provide evidence that scores on ECERS-R are associated with other measures of classroom quality. The mean overall rating is 5.7 in Program A and 5.6 in Program B (table B4).
The Arnett scale is a tool that assesses the quality and content of interactions among teachers and children in classrooms through external observations (Arnett, 1989). The items measure the emotional tone, discipline style, and responsiveness of the teacher or caregiver. The 26 items are organized into four domains: positive interaction, punitiveness, detachment, and permissiveness. These interactions are measured on a scale of 1 (“not at all”) to 4 (“very much”). The overall rating is the average rating across all items. The inter-rater reliability coefficients for Arnett range from .75 to .91, and the Cronbach’s alpha measure for internal consistency of the total score is reported to be .98 for lead teachers and .93 for assistant teachers (Jaeger & Funk, 2001). The correlations between the ECERS-R and Arnett instruments are between .43 and .76 (Layzer, Goodson, & Moss, 1993; Phillipsen, Cryer, & Howes, 1995). The Arnett domain ratings for Program A ranged from 3.0 to 3.8; the overall rating was 3.6.
Table B4. Descriptive statistics of ECERS-R ratings in Programs A and B, 2012/13
Domain
Program A Program B
Mean Minimum Maximum Mean Minimum Maximum
Space and furnishings 5.7 5.3 6.0 5.4 4.0 6.0
Personal care routines 6.2 6.2 6.5 5.3 2.0 7.0
Language-reasoning 5.6 4.5 6.8 5.1 2.0 7.0
Activities 4.6 3.7 5.7 5.5 4.0 7.0
Interaction 6.5 5.8 7.0 5.7 5.0 7.0
Program structure 6.5 5.7 7.0 6.1 4.0 7.0
Parents and staff 6.2 5.2 6.5 6.1 5.0 7.0
Overall rating 5.7 5.4 6.1 5.6 4.7 6.4
Note: Standard errors are not included because the data represents all preschool teachers in each program.
Source: Authors’ analysis based on data from Program A and Program B.
B-4
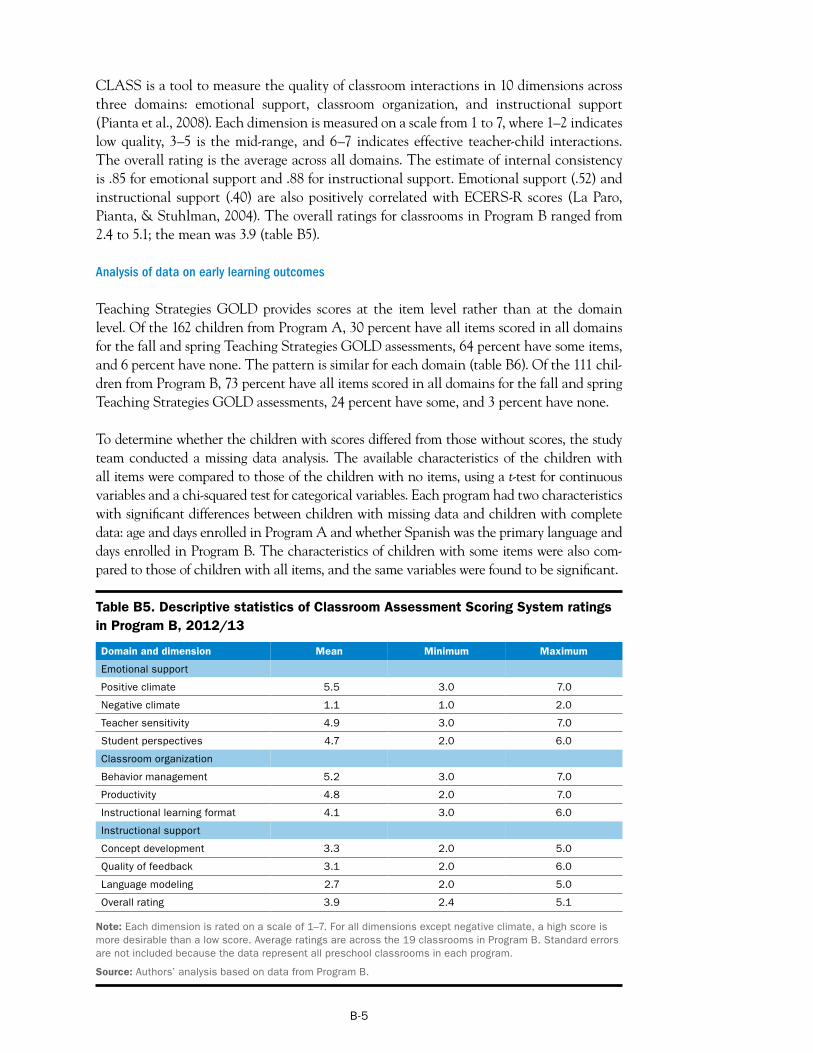
CLASS is a tool to measure the quality of classroom interactions in 10 dimensions across three domains: emotional support, classroom organization, and instructional support (Pianta et al., 2008). Each dimension is measured on a scale from 1 to 7, where 1–2 indicates low quality, 3–5 is the mid-range, and 6–7 indicates effective teacher-child interactions. The overall rating is the average across all domains. The estimate of internal consistency is .85 for emotional support and .88 for instructional support. Emotional support (.52) and instructional support (.40) are also positively correlated with ECERS-R scores (La Paro, Pianta, & Stuhlman, 2004). The overall ratings for classrooms in Program B ranged from 2.4 to 5.1; the mean was 3.9 (table B5).
Analysis of data on early learning outcomes
Teaching Strategies GOLD provides scores at the item level rather than at the domain level. Of the 162 children from Program A, 30 percent have all items scored in all domains for the fall and spring Teaching Strategies GOLD assessments, 64 percent have some items, and 6 percent have none. The pattern is similar for each domain (table B6). Of the 111 children from Program B, 73 percent have all items scored in all domains for the fall and spring Teaching Strategies GOLD assessments, 24 percent have some, and 3 percent have none.
To determine whether the children with scores differed from those without scores, the study team conducted a missing data analysis. The available characteristics of the children with all items were compared to those of the children with no items, using a t-test for continuous variables and a chi-squared test for categorical variables. Each program had two characteristics with significant differences between children with missing data and children with complete data: age and days enrolled in Program A and whether Spanish was the primary language and days enrolled in Program B. The characteristics of children with some items were also compared to those of children with all items, and the same variables were found to be significant.
Table B5. Descriptive statistics of Classroom Assessment Scoring System ratings in Program B, 2012/13
Domain and dimension Mean Minimum Maximum
Emotional support
Positive climate 5.5 3.0 7.0
Negative climate 1.1 1.0 2.0
Teacher sensitivity 4.9 3.0 7.0
Student perspectives 4.7 2.0 6.0
Classroom organization
Behavior management 5.2 3.0 7.0
Productivity 4.8 2.0 7.0
Instructional learning format 4.1 3.0 6.0
Instructional support
Concept development 3.3 2.0 5.0
Quality of feedback 3.1 2.0 6.0
Language modeling 2.7 2.0 5.0
Overall rating 3.9 2.4 5.1
Note: Each dimension is rated on a scale of 1–7. For all dimensions except negative climate, a high score is more desirable than a low score. Average ratings are across the 19 classrooms in Program B. Standard errors are not included because the data represent all preschool classrooms in each program.
Source: Authors’ analysis based on data from Program B.
B-5
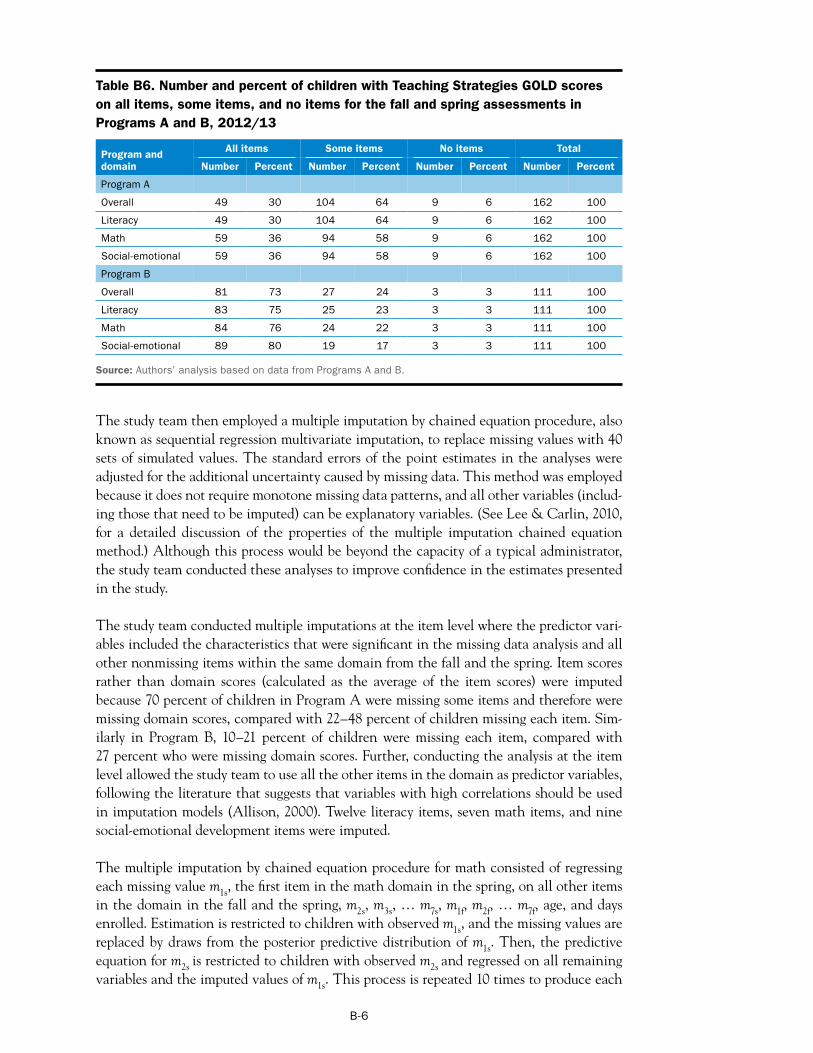
Table B6. Number and percent of children with Teaching Strategies GOLD scores on all items, some items, and no items for the fall and spring assessments in Programs A and B, 2012/13
Program and domain
All items Some items No items Total
Number Percent Number Percent Number Percent Number Percent
Program A
Overall 49 30 104 64 9 6 162 100
Literacy 49 30 104 64 9 6 162 100
Math 59 36 94 58 9 6 162 100
Social-emotional 59 36 94 58 9 6 162 100
Overall 81 73 27 24 3 3 111 100
Literacy 83 75 25 23 3 3 111 100
Program B
Math 84 76 24 22 3 3 111 100
Social-emotional 89 80 19 17 3 3 111 100
Source: Authors’ analysis based on data from Programs A and B.
The study team then employed a multiple imputation by chained equation procedure, also known as sequential regression multivariate imputation, to replace missing values with 40 sets of simulated values. The standard errors of the point estimates in the analyses were adjusted for the additional uncertainty caused by missing data. This method was employed because it does not require monotone missing data patterns, and all other variables (including those that need to be imputed) can be explanatory variables. (See Lee & Carlin, 2010, for a detailed discussion of the properties of the multiple imputation chained equation method.) Although this process would be beyond the capacity of a typical administrator, the study team conducted these analyses to improve confidence in the estimates presented in the study.
The study team conducted multiple imputations at the item level where the predictor variables included the characteristics that were significant in the missing data analysis and all other nonmissing items within the same domain from the fall and the spring. Item scores rather than domain scores (calculated as the average of the item scores) were imputed because 70 percent of children in Program A were missing some items and therefore were missing domain scores, compared with 22–48 percent of children missing each item. Similarly in Program B, 10–21 percent of children were missing each item, compared with 27 percent who were missing domain scores. Further, conducting the analysis at the item level allowed the study team to use all the other items in the domain as predictor variables, following the literature that suggests that variables with high correlations should be used in imputation models (Allison, 2000). Twelve literacy items, seven math items, and nine social-emotional development items were imputed.
The multiple imputation by chained equation procedure for math consisted of regressing each missing value m1s, the first item in the math domain in the spring, on all other items in the domain in the fall and the spring, m2s, m3s, … m7s, m1f, m2f, … m7f, age, and days enrolled. Estimation is restricted to children with observed m1s, and the missing values are replaced by draws from the posterior predictive distribution of m1s. Then, the predictive equation for m2s is restricted to children with observed m2s and regressed on all remaining variables and the imputed values of m1s. This process is repeated 10 times to produce each
B-6
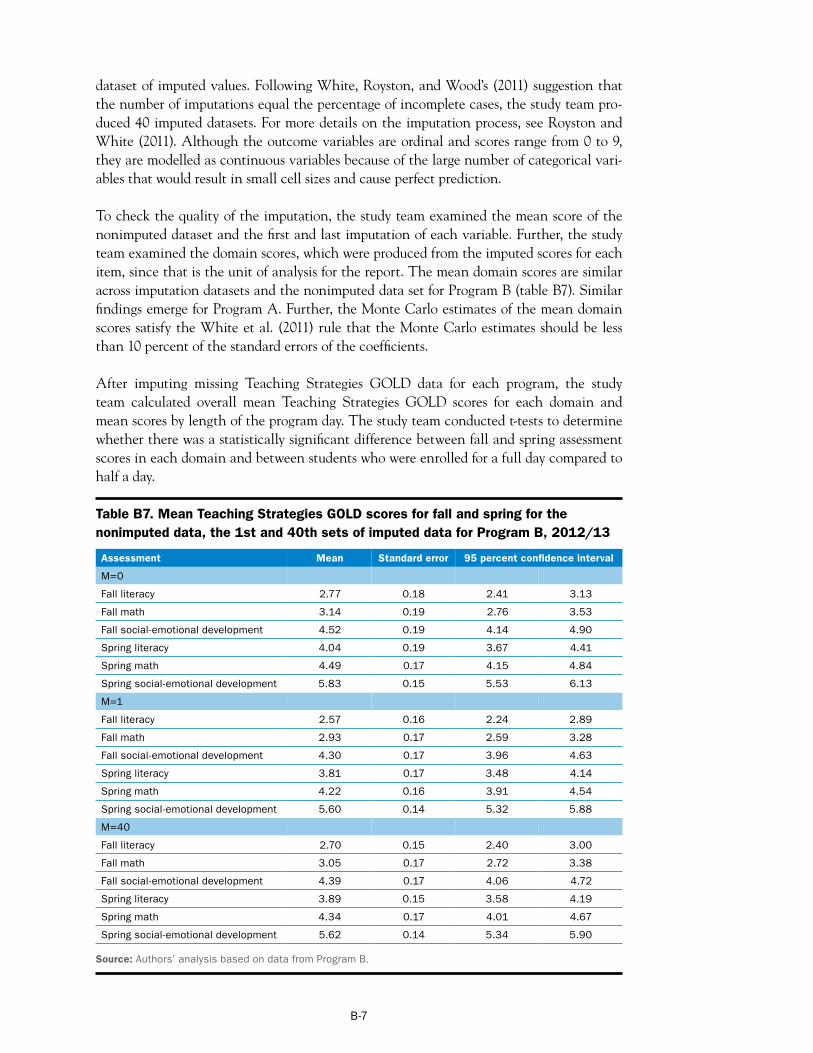
dataset of imputed values. Following White, Royston, and Wood’s (2011) suggestion that the number of imputations equal the percentage of incomplete cases, the study team produced 40 imputed datasets. For more details on the imputation process, see Royston and White (2011). Although the outcome variables are ordinal and scores range from 0 to 9, they are modelled as continuous variables because of the large number of categorical variables that would result in small cell sizes and cause perfect prediction.
To check the quality of the imputation, the study team examined the mean score of the nonimputed dataset and the first and last imputation of each variable. Further, the study team examined the domain scores, which were produced from the imputed scores for each item, since that is the unit of analysis for the report. The mean domain scores are similar across imputation datasets and the nonimputed data set for Program B (table B7). Similar findings emerge for Program A. Further, the Monte Carlo estimates of the mean domain scores satisfy the White et al. (2011) rule that the Monte Carlo estimates should be less than 10 percent of the standard errors of the coefficients.
After imputing missing Teaching Strategies GOLD data for each program, the study team calculated overall mean Teaching Strategies GOLD scores for each domain and mean scores by length of the program day. The study team conducted t-tests to determine whether there was a statistically significant difference between fall and spring assessment scores in each domain and between students who were enrolled for a full day compared to half a day.
Table B7. Mean Teaching Strategies GOLD scores for fall and spring for the nonimputed data, the 1st and 40th sets of imputed data for Program B, 2012/13
Assessment Mean Standard error 95 percent confidence interval
M=0
Fall literacy 2.77 0.18 2.41 3.13
Fall math 3.14 0.19 2.76 3.53
Fall social-emotional development
Spring literacy
4.52
4.04
0.19
0.19
4.14
3.67
4.90
4.41
Spring math 4.49 0.17 4.15 4.84
Fall literacy 2.57 0.16 2.24 2.89
Fall math 2.93 0.17 2.59 3.28
Spring social-emotional development 5.83 0.15 5.53 6.13
M=1
Fall social-emotional development
Spring literacy
4.30
3.81
0.17
0.17
3.96
3.48
4.63
4.14
Spring math 4.22 0.16 3.91 4.54
Spring social-emotional development 5.60 0.14 5.32 5.88
Fall literacy 2.70 0.15 2.40 3.00
Fall math 3.05 0.17 2.72 3.38
M=40
Fall social-emotional development 4.39 0.17 4.06 4.72
Spring literacy 3.89 0.15 3.58 4.19
Spring math 4.34 0.17 4.01 4.67
Spring social-emotional development 5.62 0.14 5.34 5.90
Source: Authors’ analysis based on data from Program B.
B-7
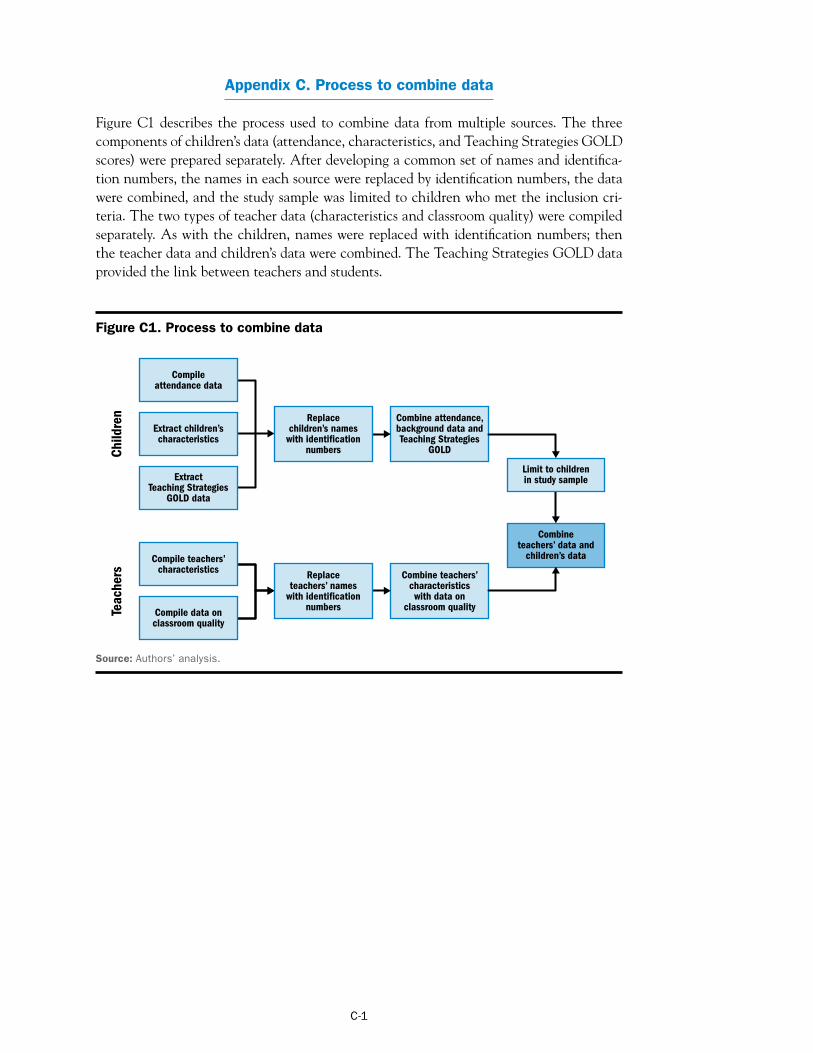
Appendix C. Process to combine data
Figure C1 describes the process used to combine data from multiple sources. The three components of children’s data (attendance, characteristics, and Teaching Strategies GOLD scores) were prepared separately. After developing a common set of names and identification numbers, the names in each source were replaced by identification numbers, the data were combined, and the study sample was limited to children who met the inclusion criteria. The two types of teacher data (characteristics and classroom quality) were compiled separately. As with the children, names were replaced with identification numbers; then the teacher data and children’s data were combined. The Teaching Strategies GOLD data provided the link between teachers and students.
Figure C1. Process to combine data
Combine attendance, background data and Teaching Strategies
GOLD
Replace children’s names
with identification numbers
Compile attendance data
Extract children’s characteristics
Extract Teaching Strategies
GOLD data
Replace teachers’ names
with identification numbers
Compile teachers’ characteristics
Compile data on classroom quality
Source: Authors’ analysis.
Teac
hers
Ch
ildre
n
Combine teachers’ data and
children’s data
Limit to children in study sample
Combine teachers’ characteristics with data on
classroom quality
C-1
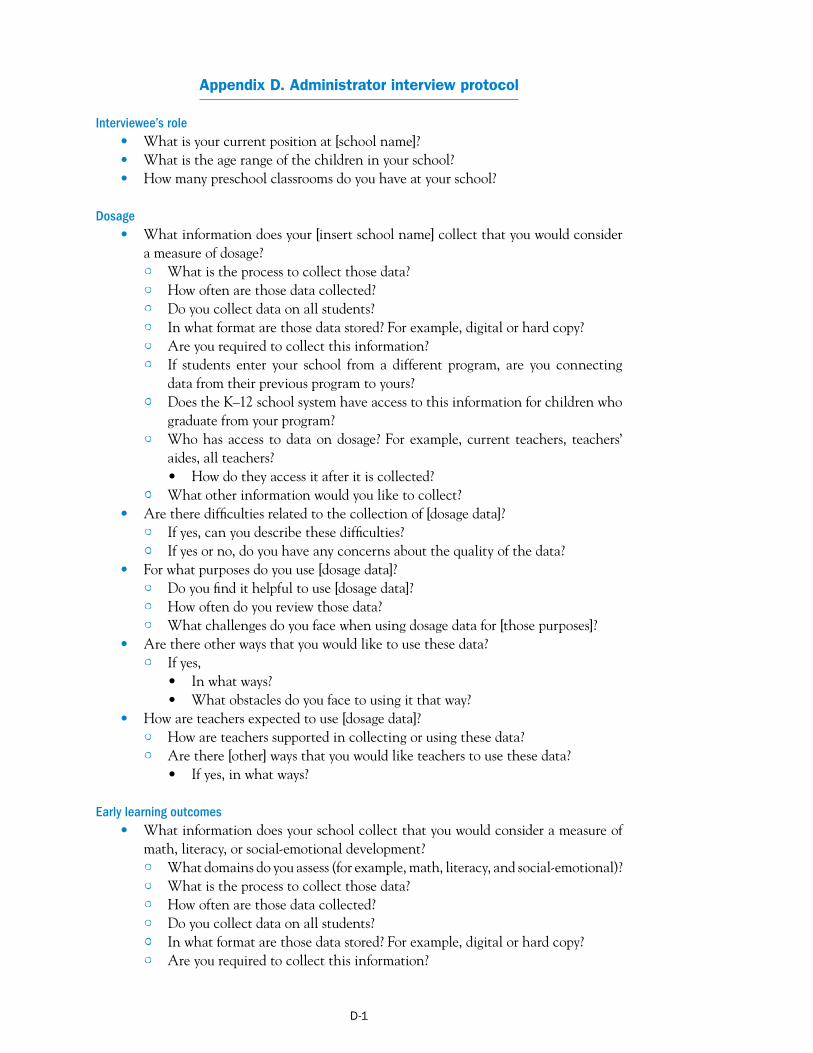
Appendix D. Administrator interview protocol
Interviewee’s role • What is your current position at [school name]? • What is the age range of the children in your school? • How many preschool classrooms do you have at your school?
Dosage • What information does your [insert school name] collect that you would consider
a measure of dosage? • What is the process to collect those data? • How often are those data collected? • Do you collect data on all students? • In what format are those data stored? For example, digital or hard copy? • Are you required to collect this information? • If students enter your school from a different program, are you connecting
data from their previous program to yours? • Does the K–12 school system have access to this information for children who
graduate from your program? • Who has access to data on dosage? For example, current teachers, teachers’
aides, all teachers? • How do they access it after it is collected?
• What other information would you like to collect? • Are there difficulties related to the collection of [dosage data]?
• If yes, can you describe these difficulties? • If yes or no, do you have any concerns about the quality of the data?
• For what purposes do you use [dosage data]? • Do you find it helpful to use [dosage data]? • How often do you review those data? • What challenges do you face when using dosage data for [those purposes]?
• Are there other ways that you would like to use these data? • If yes,
• In what ways? • What obstacles do you face to using it that way?
• How are teachers expected to use [dosage data]? • How are teachers supported in collecting or using these data? • Are there [other] ways that you would like teachers to use these data?
• If yes, in what ways?
Early learning outcomes • What information does your school collect that you would consider a measure of
math, literacy, or social-emotional development? • What domains do you assess (for example, math, literacy, and social-emotional)? • What is the process to collect those data? • How often are those data collected? • Do you collect data on all students? • In what format are those data stored? For example, digital or hard copy? • Are you required to collect this information?
D-1
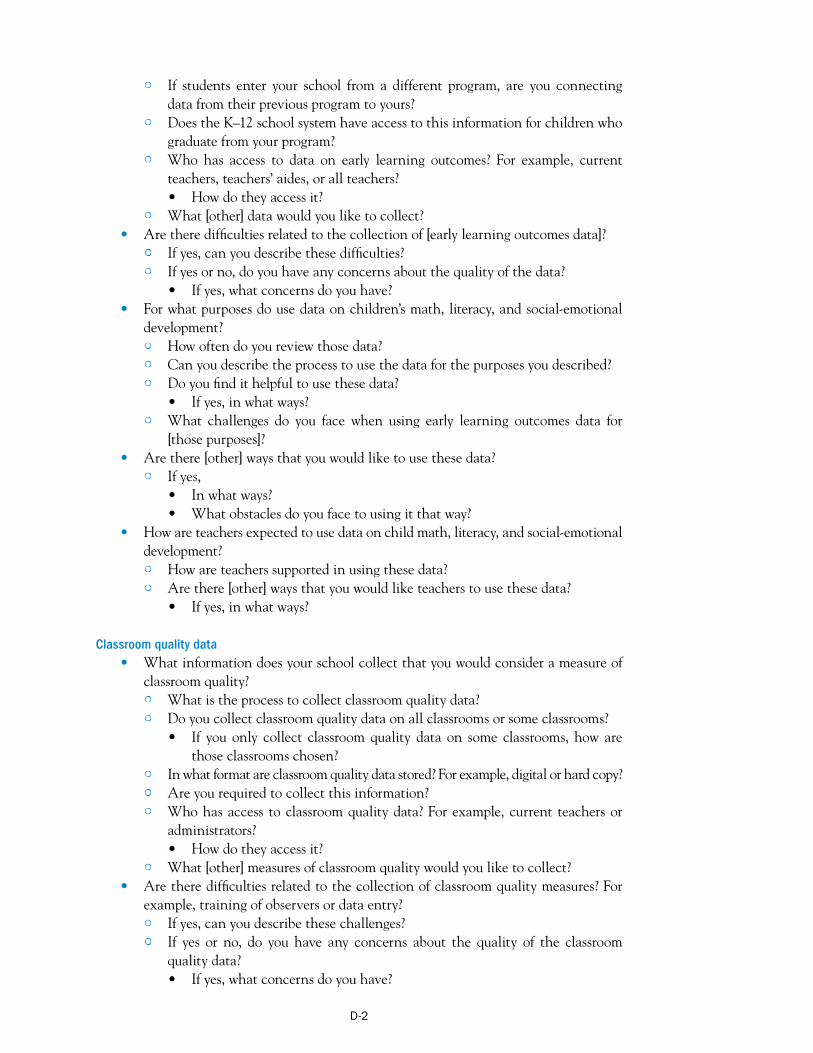
• If students enter your school from a different program, are you connecting data from their previous program to yours?
• Does the K–12 school system have access to this information for children who graduate from your program?
• Who has access to data on early learning outcomes? For example, current teachers, teachers’ aides, or all teachers? • How do they access it?
• What [other] data would you like to collect? • Are there difficulties related to the collection of [early learning outcomes data]?
• If yes, can you describe these difficulties? • If yes or no, do you have any concerns about the quality of the data?
• If yes, what concerns do you have? • For what purposes do use data on children’s math, literacy, and social-emotional
development? • How often do you review those data? • Can you describe the process to use the data for the purposes you described? • Do you find it helpful to use these data?
• If yes, in what ways? • What challenges do you face when using early learning outcomes data for
[those purposes]? • Are there [other] ways that you would like to use these data?
• If yes, • In what ways? • What obstacles do you face to using it that way?
• How are teachers expected to use data on child math, literacy, and social-emotional development? • How are teachers supported in using these data? • Are there [other] ways that you would like teachers to use these data?
• If yes, in what ways?
Classroom quality data • What information does your school collect that you would consider a measure of
classroom quality? • What is the process to collect classroom quality data? • Do you collect classroom quality data on all classrooms or some classrooms?
• If you only collect classroom quality data on some classrooms, how are those classrooms chosen?
• In what format are classroom quality data stored? For example, digital or hard copy? • Are you required to collect this information? • Who has access to classroom quality data? For example, current teachers or
administrators? • How do they access it?
• What [other] measures of classroom quality would you like to collect? • Are there difficulties related to the collection of classroom quality measures? For
example, training of observers or data entry? • If yes, can you describe these challenges? • If yes or no, do you have any concerns about the quality of the classroom
quality data? • If yes, what concerns do you have?
D-2
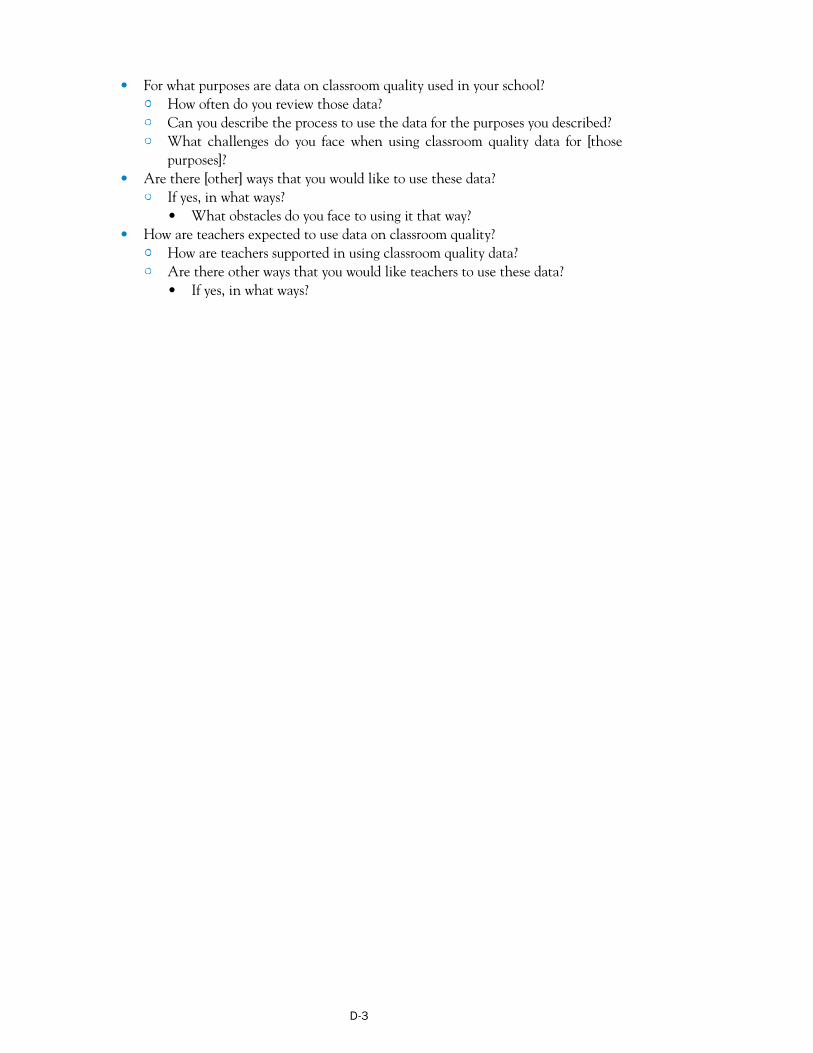
• For what purposes are data on classroom quality used in your school? • How often do you review those data? • Can you describe the process to use the data for the purposes you described? • What challenges do you face when using classroom quality data for [those
purposes]? • Are there [other] ways that you would like to use these data?
• If yes, in what ways? • What obstacles do you face to using it that way?
• How are teachers expected to use data on classroom quality? • How are teachers supported in using classroom quality data? • Are there other ways that you would like teachers to use these data?
• If yes, in what ways?
D-3
Appendix E. Teacher interview protocol
Interviewee’s role • What is your current position at [school name]? • Are you a full-time or part-time? • What is the age range of the children in your classroom? • How many children are in your class?
Dosage • What information do you collect about the children in your classroom that you
would consider a measure of dosage? • What is the process to collect it? • Are there any challenges you face when collecting it? • Does your school require that you collect this information?
• If yes, what information is required by your school? • Do you have access to those data after you collect them?
• If yes, • In what format do you receive them (for example, spreadsheets)? • How often do you review those data?
• What [other] information on dosage would be helpful for you to have available? • For what purposes do you use [dosage data]?
• Do you find it helpful to use [dosage data]? • If yes, in what ways?
• Can you describe the process to use the data for the purposes you described? • What challenges do you face when using dosage data for [those purposes]?
• Are there [other] ways that you would like to use [dosage data]? • If yes,
• In what ways? • What obstacles do you face to using it that way?
• How are you supported in using these data? • Did you receive training in collecting or using [dosage] data? When? From whom? • Does someone provide ongoing support to you in using these data? • Are there [other] ways that you would like to be supported?
• If yes, in what ways?
Early learning outcomes • What information do you collect that you would consider a measure of math, liter
acy, or social-emotional development? • What domains do you assess? • What is the process to collect it? • How often are those data collected? • Are there any challenges you face when collecting it?
• If yes, can you describe these challenges? • Does your school require that you collect this information? • Do you have access to the data after they are collected?
• If yes: • How often do you review those data? • How is the information presented (for example, raw data, graphs,
charts, tables, Excel document)?
E-1
• Do you receive aggregate (for example, classroom level) and student-level data?
• Is the presentation of information user-friendly? • If no, would you like to have access to it?
• What [other] information about children’s math, literacy, and social-emotional development would be helpful for you to have available?
• For what purposes do you use [these data]? • Do you find it helpful to use these data?
• If yes, in what ways? • Can you describe the process to use the data for the purposes you described? • What challenges do you face when using early learning outcomes data for
[those purposes]? • Are there [other] ways that you would like to use these data?
• If yes, • In what ways? • What obstacles do you face to using it that way?
• Do you feel comfortable using [these] data to inform your instructional practice? • How are you supported in using [early learning outcomes data])?
• Did you receive training in collecting or using early learning outcomes data? • If yes, When? From whom?
• Does someone provide ongoing support to you in using these data? • Are there [other] ways that you would like to be supported?
• If yes, in what ways?
Classroom quality • What information does [your school] collect about teachers or their classrooms
that you would consider a measure of quality? • Does your [your school] collect that information about you or your classroom?
• How often is that information collected? • Do you have access to [classroom quality data]?
• If yes, • How often do you review [classroom quality data]? • In what format are they provided to you?
• If no, would you like to have access to them? • What [other] information on classroom quality would be helpful for you to
have available? • Are you involved in the collection of classroom quality data (for example, of peers
or assistants)? • If yes,
• What is the process to collect them? • Are there any challenges you face when collecting them? • Does your school require that you collect this information?
• If yes, what information is required by your school? • For what purposes do you use [classroom quality data]?
• Do you find it helpful to use these data? • If yes, in what ways?
• Can you describe the process to use the data for the purposes you described? • What challenges do you face when using classroom quality data for [those purposes]?
• Are there [other] ways that you would like to use classroom quality data?
E-2

• If yes, in what ways? • What obstacles do you face to using it that way?
• How are you supported in using [classroom quality data]? • Did you receive training on how to collect or use classroom quality data?
When? From whom? • Does someone provide ongoing support to you on using these data (for
example, coach, another teacher, program coordinator)? • Are there [other] ways that you would like to be supported?
• If yes, in what ways?
E-3
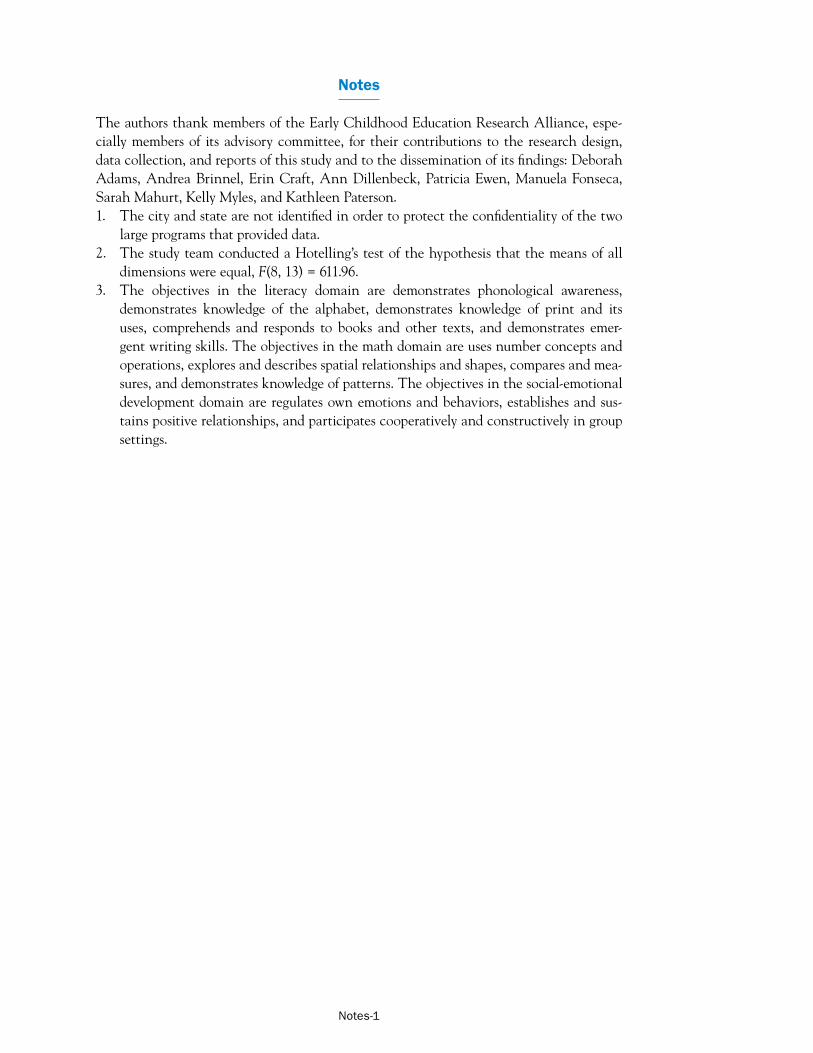
Notes
The authors thank members of the Early Childhood Education Research Alliance, especially members of its advisory committee, for their contributions to the research design, data collection, and reports of this study and to the dissemination of its findings: Deborah Adams, Andrea Brinnel, Erin Craft, Ann Dillenbeck, Patricia Ewen, Manuela Fonseca, Sarah Mahurt, Kelly Myles, and Kathleen Paterson. 1. The city and state are not identified in order to protect the confidentiality of the two
large programs that provided data. 2. The study team conducted a Hotelling’s test of the hypothesis that the means of all
dimensions were equal, F(8, 13) = 611.96. 3. The objectives in the literacy domain are demonstrates phonological awareness,
demonstrates knowledge of the alphabet, demonstrates knowledge of print and its uses, comprehends and responds to books and other texts, and demonstrates emergent writing skills. The objectives in the math domain are uses number concepts and operations, explores and describes spatial relationships and shapes, compares and measures, and demonstrates knowledge of patterns. The objectives in the social-emotional development domain are regulates own emotions and behaviors, establishes and sustains positive relationships, and participates cooperatively and constructively in group settings.
Notes-1
References
Allison, P. D. (2000). Multiple imputation for missing data: A cautionary tale. Sociological Methods and Research, 28(3), 301–309.
Arnett, J. (1989). Arnett Caregiver Interaction Scale. Retrieved March 6, 2013, from http:// www.mass.gov/edu/docs/eec/2013/20110121-arnett-scale.pdf.
ATLAS.ti (Version 6.2.28). (2014). [Computer software]. Berlin: Scientific Software Development.
Attendance Works. (2011). Attendance in early elementary grades: Associations with student characteristics, school readiness, and third grade outcomes. Retrieved May 8, 2014, from http://www.attendanceworks.org/wordpress/wp-content/uploads/2010/12/ASR-Mini -Report-Attendance-Readiness-and-Third-Grade-Outcomes-7–8-11.pdf.
Burchinal, M. R., Kainz, K., & Cai, Y. (2011). How well are our measures of quality predicting to child outcomes: A meta-analysis and coordinated analyses of data from large scale studies of early childhood settings. In M. Zaslow, I. Martinez-Beck, K. Tout & T. Halle (Eds.), Measuring quality in early childhood settings (pp. 11–31). Baltimore: Brookes Publishing.
Burchinal, M. R., Kainz, K., Cai, Y., Tout, K., Zaslow, M., Martinez-Beck, I., & Rathgeb, C. (2009, May). Early care and education quality and child outcomes (Research-to-Policy Research-to-Practice Brief: OPRE Research-to-Policy Brief #1). Washington, DC: U.S. Department of Health and Human Services, Administratrion for Children and Families, Office of Planning, Research and Evaluation, and Child Trends.
Clifford, R. M., Reszka, S. S., & Rossback, H. (2010). Reliability and validity of the Early Childhood Environment Rating Scale. Retrieved May 30, 2010, from http://ers.fpg.unc. edu/sites/ers.fpg.unc.edu /files/ReliabilityEcers.pdf.
Crommey, A. (2000). Using student assessment data: What can we learn from schools? Oak Brook, IL: North Central Regional Educational Laboratory. http://eric.ed.gov/ ?id=ED452593
Datnow, A., Park, V., & Wohlstetter, P. (2007). Achieving with data: How high-performing school systems use data to improve instruction for elementary students. Los Angeles: Center on Educational Governance. Retrieved May 8, 2014, from http://www.newschools.org/ wp/wp-content/uploads/AchievingWithData.pdf.
Earl, L., & Katz, S. (2006). Leading schools in a data-rich world. Thousand Oaks, CA: Corwin Press.
Early Childhood Data Collaborative. (2014). 2013 state of states’ early childhood data systems. Retrieved on March 3, 2014 from http://www.ecedata.org/files/2013%20State%20of%20 States%27%20Early%20Childhood%20Data%20Systems.pdf
Ref-1
Glascoe, F. (2002). Technical report for the Brigance Screens—Revised. North Billerica, MA: Curriculum Associates.
Halle, T., Zaslow, M., Wessel, J., Moodie, S., & Darling-Churchill, K. (2011). Understanding and choosing assessments and developmental screeners for young children ages 3–5: Profiles of selected measures. Washington, DC: U.S. Department of Health and Human Services, Administration for Children and Families, Office of Planning, Research, and Evaluation.
Hamilton, L., Halverson, R., Jackson, S., Mandinach, E., Supovitz, J., & Wayman, J. (2009). Using student achievement data to support instructional decision making (NCEE Report No. 2009–4067). Washington, DC: U.S. Department of Education, Institute of Education Sciences, National Center for Education Evaluation and Regional Assistance. Retrieved May 8, 2014, from http://ies.ed.gov/ncee/wwc/publications/practiceguides/.
Harms, T., Clifford, R. M., & Cryer, D. (1998). Early Childhood Environment Rating Scale– Revised Edition (ECERS-R). New York: Teachers College Press.
Jaeger, E., & Funk, S. (2001). The Philadelphia child care quality study: An examination of quality in selected early education and care settings. Philadelphia: Saint Joseph’s University.
Lambert, R. G., Kim, D.-H., Taylor, H., & McGee, J. R. (2010). Technical manual for the Teaching Strategies GOLDTM Assessment System. Charlotte, NC: Center for Educational Measurement and Evaluation at UNC Charlotte. Retrieved March 6, 2013, from https://www.k12.wa.us/assessment/pubdocs/GOLDTechnicalManual2ndEdition Lambert2.pdf.
La Paro, L., Pianta, R., & Stuhlman, M. (2004). Classroom Assessment Scoring System (CLASS): Findings from the pre-K year. Elementary School Journal, 104(5), 409–426.
Layzer, J. I., Goodson, B. D., & Moss, M. (1993). Observational study of early childhood programs, final report: Vol. 1. Life in preschool. Cambridge, MA: Abt Associates.
Lee, K., & Carlin, J. (2010). Multiple imputation for missing data: Fully conditional specification versus multivariate normal imputation. American Journal of Epidemiology, 171(5), 624–632.
McCartney, K., Burchinal, M. R., Clarke-Stewart, A., Bub, K. L., Owen, M. T., & Belsky, J. (2010). Testing a series of causal propositions relating time in child care to children’s externalizing behavior. Developmental Psychology, 46(1), 1–17. http://eric.ed.gov/?id=EJ871399
Meisels, S. J., Marsden, D. B., Jablon, J. R., Dorfman, A. B., & Dichtelmiller, M. (2012). Work Sampling System. San Antonio, TX: Pearson.
Meisels, S. J., Marsden, D. B., Wiske, M. S., & Henderson, L. W. (2008). Early Screening Inventory–Revised, 2008 edition (ESI-R). San Antonio, TX: Pearson.
Ref-2
NICHD Early Child Care Research Network. (2000). The relation of child care to cognitive and language development. Child Development, 71(4), 960–980. http://eric.ed.gov/ ?id=EJ620372
Peisner-Feinberg, E., Burchinal, M., Clifford, R., Culkin, M., Howes, C., Kagan, S., & Yazegian, N. (2001). The relation of preschool child-care quality to children’s cognitive and social development trajectories through second grade. Child Development, 72(5), 1534–1553.
Phillipsen, L., Cryer, D., & Howes, C. (1995). Classroom process and classroom structure. In S. Helburn (Ed.), Cost, quality, and child outcomes in child care centers (pp. 125–158). Denver, CO: University of Colorado at Denver, Department of Economics, Center for Research in Economics and Social Policy.
Pianta, R. C., La Paro, K. M., & Hamre, B. K (2008). Classroom Assessment Scoring System (CLASS) manual, Pre-K. Baltimore: Brookes.
Robin, K. B., Frede, E. C., & Barnett, W. S. (2006). Is more better? The effects of full-day vs. half-day preschool on early school achievement (NIEER Working Paper). New Brunswick, NJ: Rutgers University, National Institute for Early Education Research.
Royston, P., & White, I. (2011). Multiple imputation by chained equations (MICE): Implementation in Stata. Journal of Statistical Software, 45(4), 1–20.
Teaching Strategies, Inc. (2012). Teaching Strategies GOLD birth through kindergarten touring guide. Washington, DC: Author. Retrieved March 6, 2013, from http://www. teachingstrategies.com/content/pageDocs/Teaching-Strategies-GOLD-Assessment -Touring-Guide-WEB.pdf.
U.S. Census Bureau. (2010a). 2007–2011 American Community Survey 5-year estimates. Retrieved January 4, 2013, from http://quickfacts.census.gov/qfd/index.html#.
U.S. Census Bureau. (2010b). United States 2010 decennial census. Retrieved January 4, 2013, from http://www.census.gov/2010census/data/.
White, I., Royston, P., & Wood, A. (2011). Multiple imputation using chained equations: Issues and guidance for practice. Statistics in Medicine, 30, 377–399.
Yazejian, N., & Bryant, D. (2013). Embedded, collaborative, comprehensive: One model of data utilization. Early Education and Development, 24(1), 68–70.
Ref-3
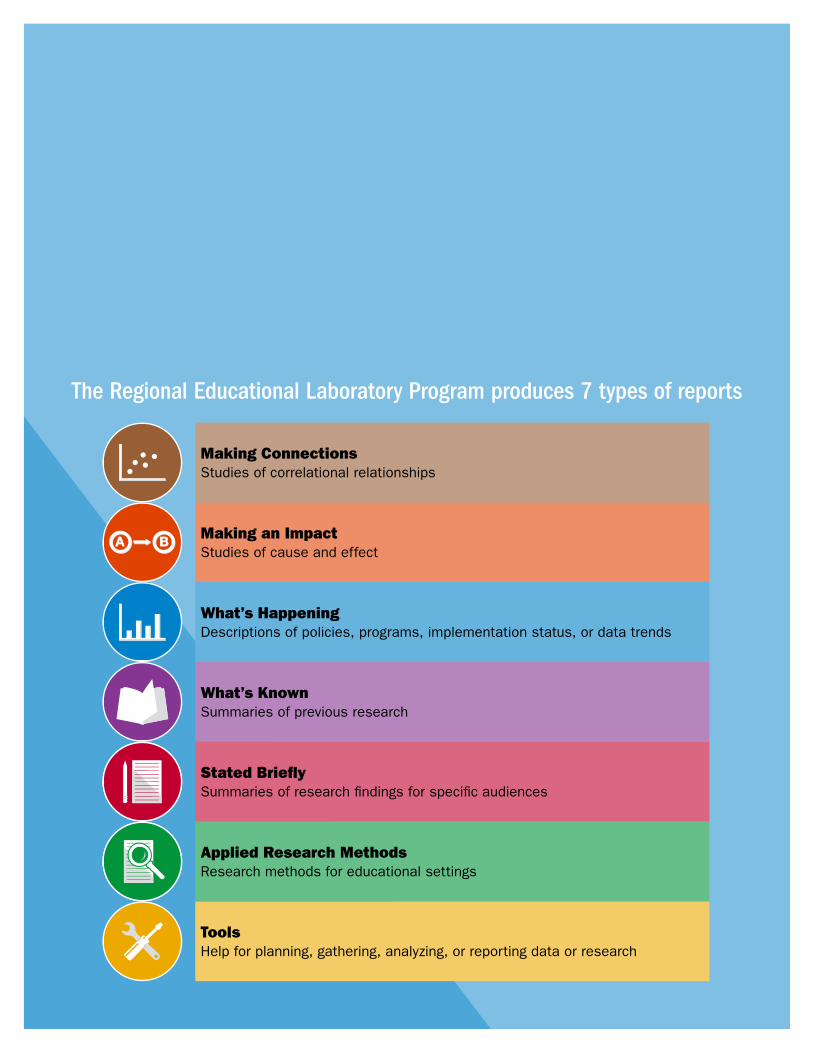
The Regional Educational Laboratory Program produces 7 types of reports
Making Connections Studies of correlational relationships
Making an Impact Studies of cause and effect
What’s Happening Descriptions of policies, programs, implementation status, or data trends
What’s Known Summaries of previous research
Stated Briefly Summaries of research findings for specific audiences
Applied Research Methods Research methods for educational settings
Tools Help for planning, gathering, analyzing, or reporting data or research