das india kulkarni etal presentation 2008&09
TRANSCRIPT
7/31/2019 Das India Kulkarni Etal Presentation 2008&09
http://slidepdf.com/reader/full/das-india-kulkarni-etal-presentation-200809 1/73
Dr. Debendra Kumar DasMr. Devdatta P. Kulkarni
Mr. Praveen K. NamburuMr. Ravikanth VajjhaMr. Bhaskar C. Sahoo
Mechanical Engineering DepartmentUniversity of Alaska Fairbanks
USA
Fluid Dynamics & Thermal Performance of Nanofluids

7/31/2019 Das India Kulkarni Etal Presentation 2008&09
http://slidepdf.com/reader/full/das-india-kulkarni-etal-presentation-200809 2/73
Topics of DiscussionIntroduction
Example of nano and micro scalesAdvantages of NanofluidRheology of Nanofluids
Copper oxide (CuO) in water (5 to 15% Volume)Copper oxide in propylene glycol/water (1 to 6% Volume)
Effect on the Prandtl NumberFigure of Merit: Mouromtseff NumberHeat Transfer and Fluid Dynamic Performance of SiO 2 ,CuO and Al 2O3 nanofluidCase I: Application of Nanofluid in Building HeatingCase II: Application of Nanofluid as Coolant in DieselElectric Generator (DEG)Acknowledgements 2
7/31/2019 Das India Kulkarni Etal Presentation 2008&09
http://slidepdf.com/reader/full/das-india-kulkarni-etal-presentation-200809 3/73
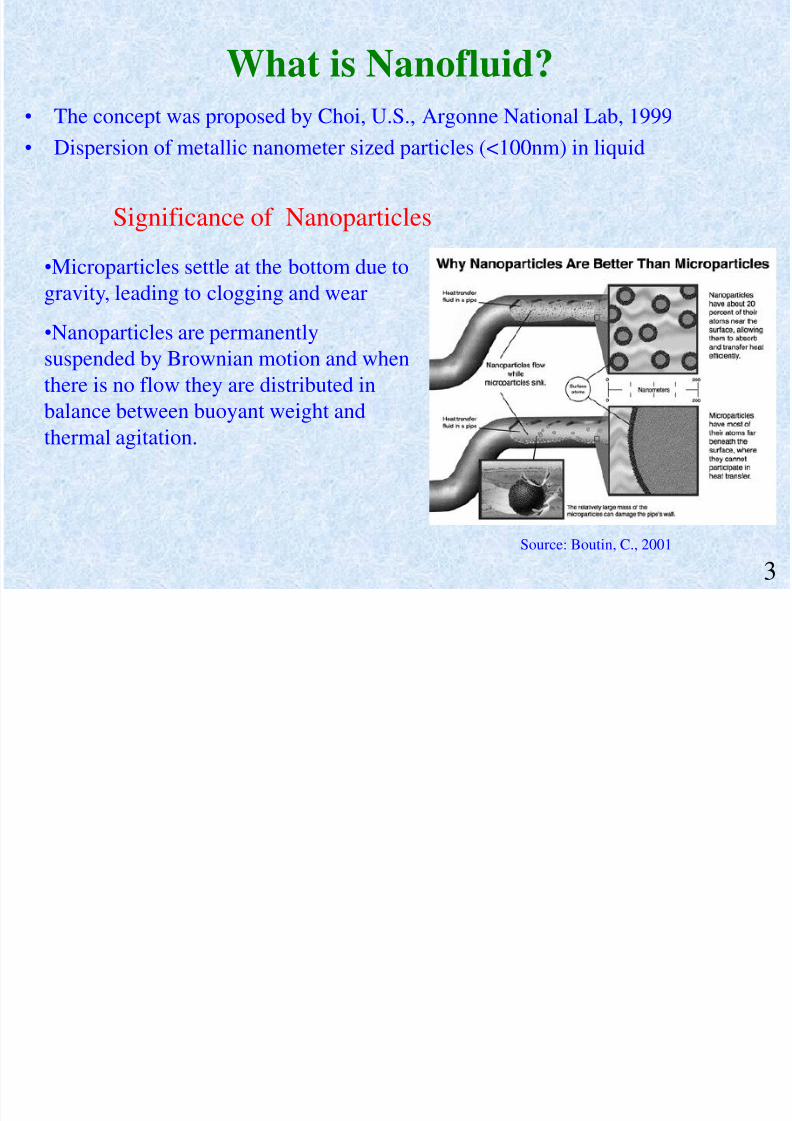
What is Nanofluid?• The concept was proposed by Choi, U.S., Argonne National Lab, 1999• Dispersion of metallic nanometer sized particles (<100nm) in liquid
Source: Boutin, C., 2001
Significance of Nanoparticles
•Microparticles settle at the bottom due togravity, leading to clogging and wear
•Nanoparticles are permanentlysuspended by Brownian motion and whenthere is no flow they are distributed in
balance between buoyant weight andthermal agitation.
3
7/31/2019 Das India Kulkarni Etal Presentation 2008&09
http://slidepdf.com/reader/full/das-india-kulkarni-etal-presentation-200809 4/73
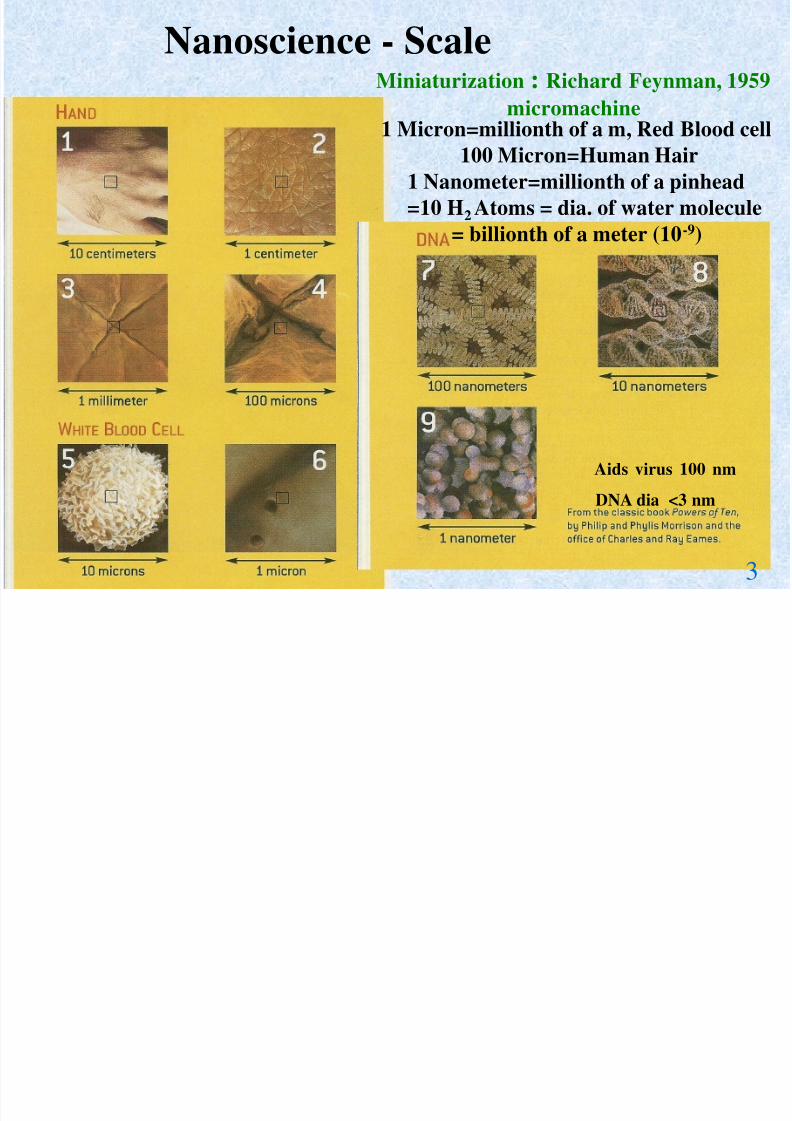
Nanoscience - Scale
1 Micron=millionth of a m, Red Blood cell100 Micron=Human Hair1 Nanometer=millionth of a pinhead=10 H 2 Atoms = dia. of water molecule
= billionth of a meter (10 -9)
Miniaturization : Richard Feynman, 1959micromachine
Aids virus 100 nm
DNA dia <3 nm
3
7/31/2019 Das India Kulkarni Etal Presentation 2008&09
http://slidepdf.com/reader/full/das-india-kulkarni-etal-presentation-200809 5/73
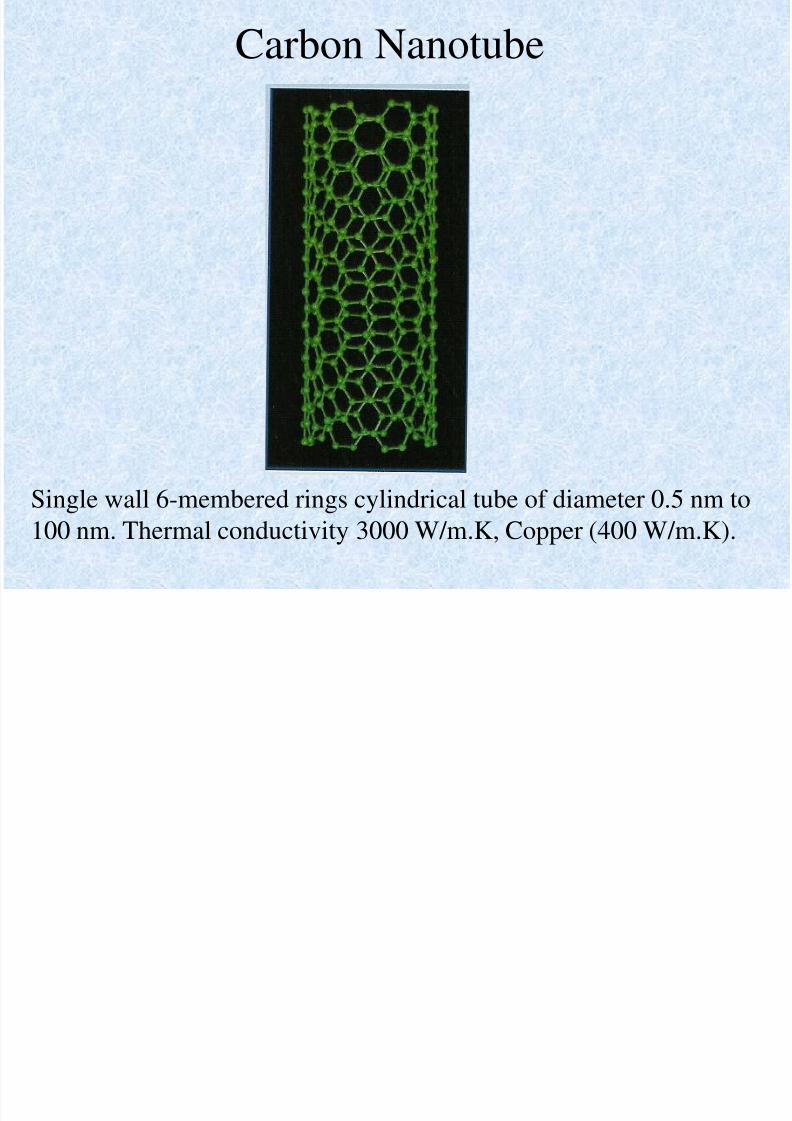
Carbon Nanotube
Single wall 6-membered rings cylindrical tube of diameter 0.5 nm to100 nm. Thermal conductivity 3000 W/m.K, Copper (400 W/m.K).
7/31/2019 Das India Kulkarni Etal Presentation 2008&09
http://slidepdf.com/reader/full/das-india-kulkarni-etal-presentation-200809 6/73
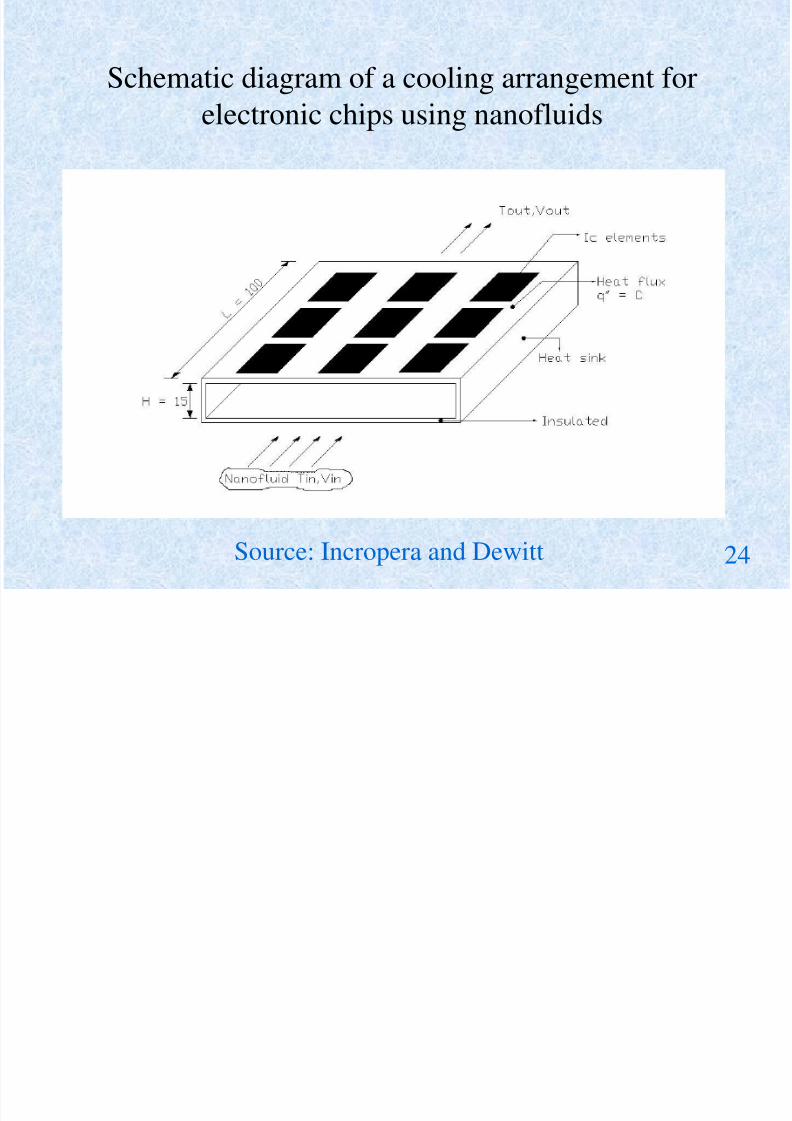
Schematic diagram of a cooling arrangement forelectronic chips using nanofluids
Source: Incropera and Dewitt 24
7/31/2019 Das India Kulkarni Etal Presentation 2008&09
http://slidepdf.com/reader/full/das-india-kulkarni-etal-presentation-200809 7/73
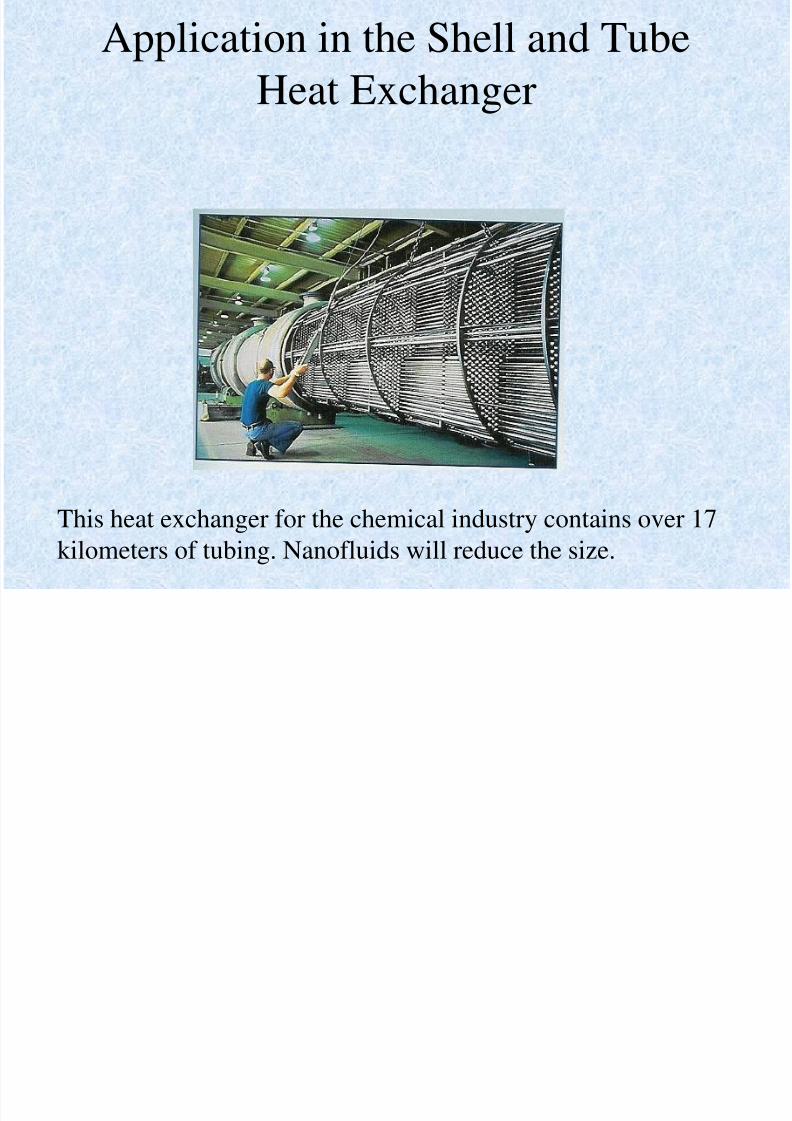
Application in the Shell and TubeHeat Exchanger
This heat exchanger for the chemical industry contains over 17
kilometers of tubing. Nanofluids will reduce the size.
7/31/2019 Das India Kulkarni Etal Presentation 2008&09
http://slidepdf.com/reader/full/das-india-kulkarni-etal-presentation-200809 8/73
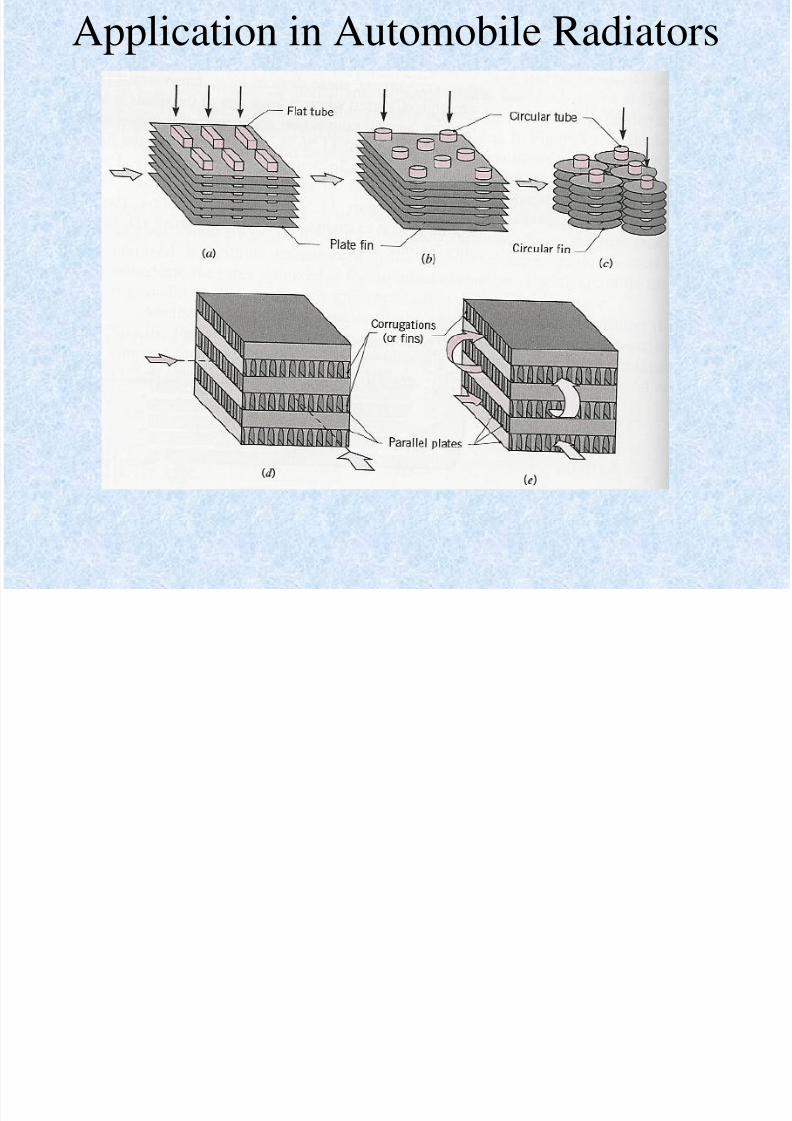
Application in Automobile Radiators
7/31/2019 Das India Kulkarni Etal Presentation 2008&09
http://slidepdf.com/reader/full/das-india-kulkarni-etal-presentation-200809 9/73
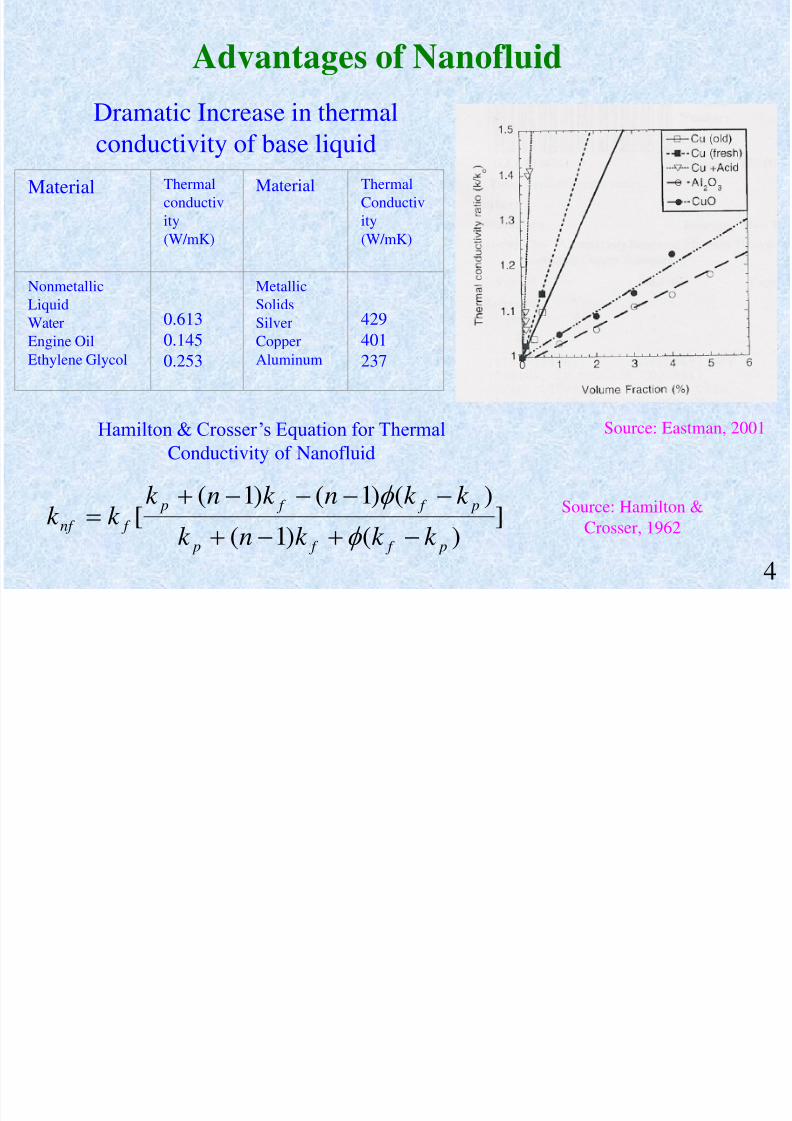
Advantages of Nanofluid
Source: Eastman, 2001
Dramatic Increase in thermalconductivity of base liquid
Material Thermalconductivity(W/mK)
Material ThermalConductivity(W/mK)
NonmetallicLiquidWaterEngine OilEthylene Glycol
0.6130.1450.253
MetallicSolidsSilverCopperAluminum
429401237
])()1(
)()1()1([
p f f p
p f f p f nf k k k nk
k k nk nk k k
Hamilton & Crosser’s Equation for ThermalConductivity of Nanofluid
Source: Hamilton &Crosser, 1962
4
7/31/2019 Das India Kulkarni Etal Presentation 2008&09
http://slidepdf.com/reader/full/das-india-kulkarni-etal-presentation-200809 10/73
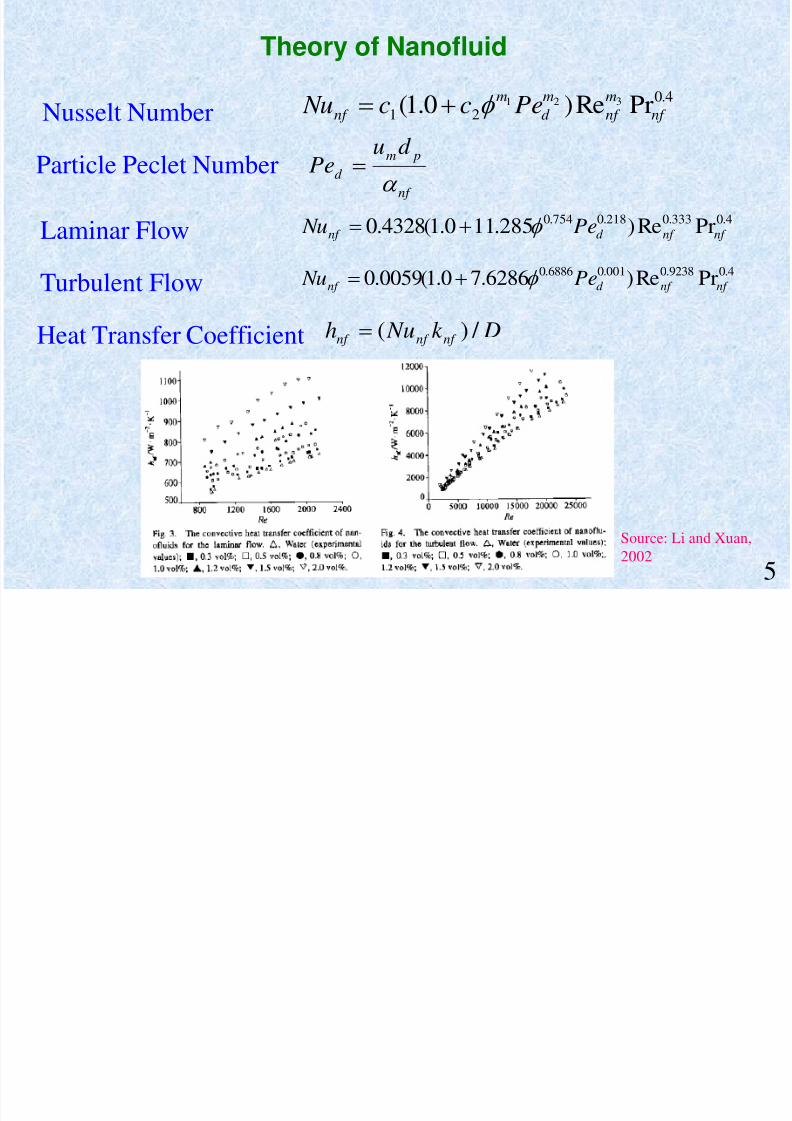
Theory of Nanofluid
4.021 PrRe)0.1( 321
nf mnf
md
mnf Pecc Nu Nusselt Number
nf
pmd
d uPe
Particle Peclet Number
4.0333.0218.0754.0 PrRe)285.110.1(4328.0 nf nf d nf Pe Nu
4.09238.0001.06886.0 PrRe)6286.70.1(0059.0 nf nf d nf Pe Nu
Laminar Flow
Turbulent Flow
Dk Nuh nf nf nf / )(Heat Transfer Coefficient
Source: Li and Xuan,2002
5
7/31/2019 Das India Kulkarni Etal Presentation 2008&09
http://slidepdf.com/reader/full/das-india-kulkarni-etal-presentation-200809 11/73
Topic of Discussion
Rheology of NanofluidsCopper oxide (CuO) in water (5 to 15% Volume)
6

7/31/2019 Das India Kulkarni Etal Presentation 2008&09
http://slidepdf.com/reader/full/das-india-kulkarni-etal-presentation-200809 12/73
Rheology of Nanofluids
Einstein ’s Correlation: )5.21( f s
Batchelors ’s Correlation: )25.65.21( 2 f s
Brinkman ’s Correlation: 5.2)1(1
f s
= suspension viscosity, = viscosity of base fluid and
is volume fraction of nanoparticles
s f
White Correlation: 200
0
)()(lnT
T c
T
T ba f
7
7/31/2019 Das India Kulkarni Etal Presentation 2008&09
http://slidepdf.com/reader/full/das-india-kulkarni-etal-presentation-200809 13/73
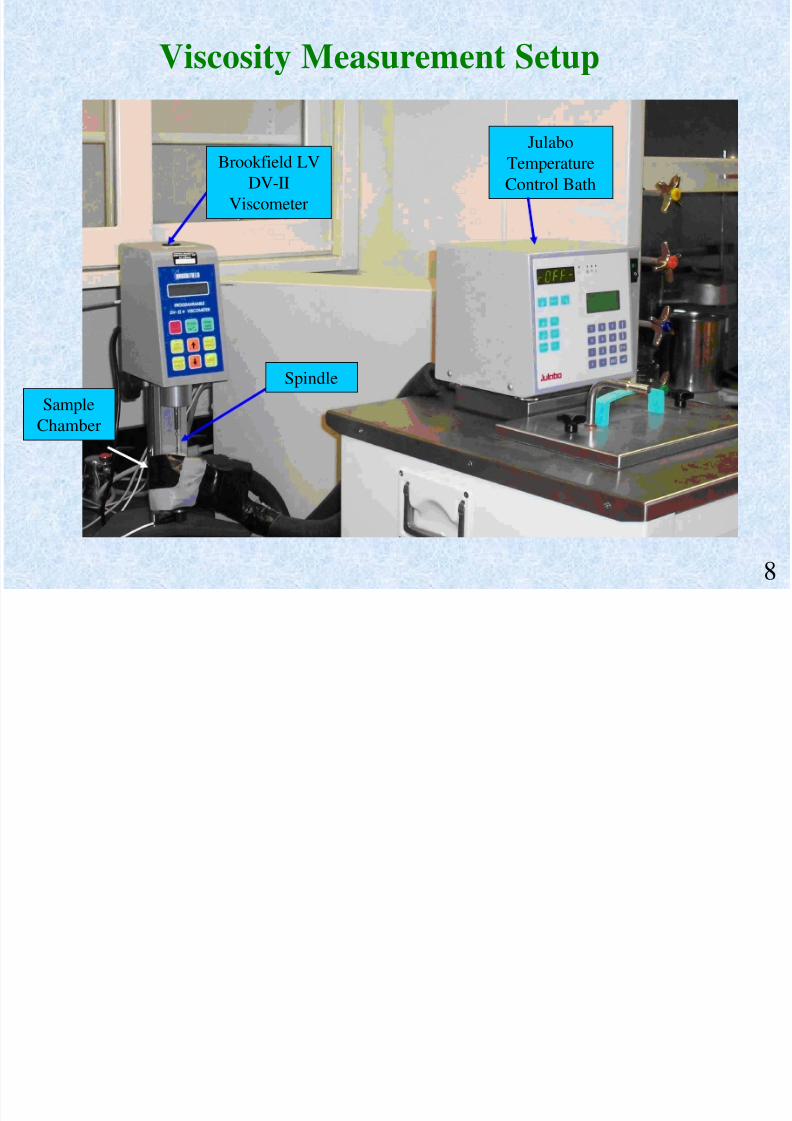
Viscosity Measurement Setup
SampleChamber
Brookfield LVDV-II
Viscometer
JulaboTemperatureControl Bath
Spindle
8

7/31/2019 Das India Kulkarni Etal Presentation 2008&09
http://slidepdf.com/reader/full/das-india-kulkarni-etal-presentation-200809 14/73
Temperature Control for Nanofluids
9
7/31/2019 Das India Kulkarni Etal Presentation 2008&09
http://slidepdf.com/reader/full/das-india-kulkarni-etal-presentation-200809 15/73
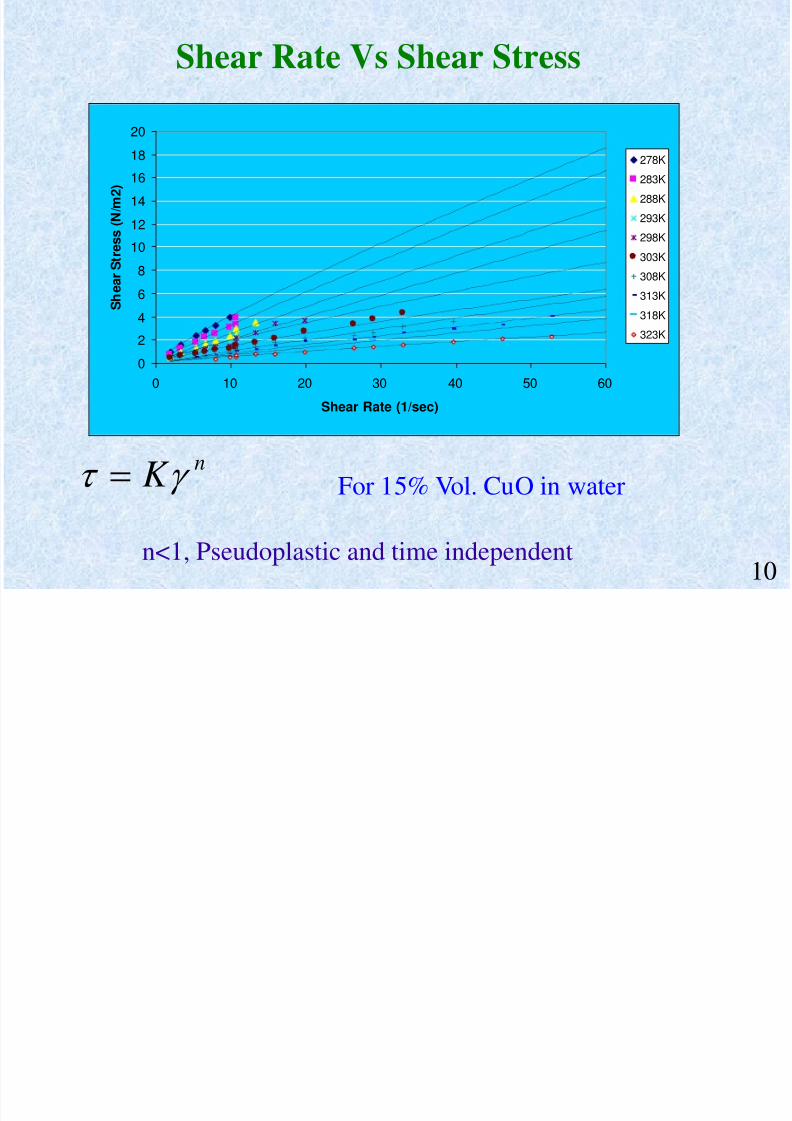
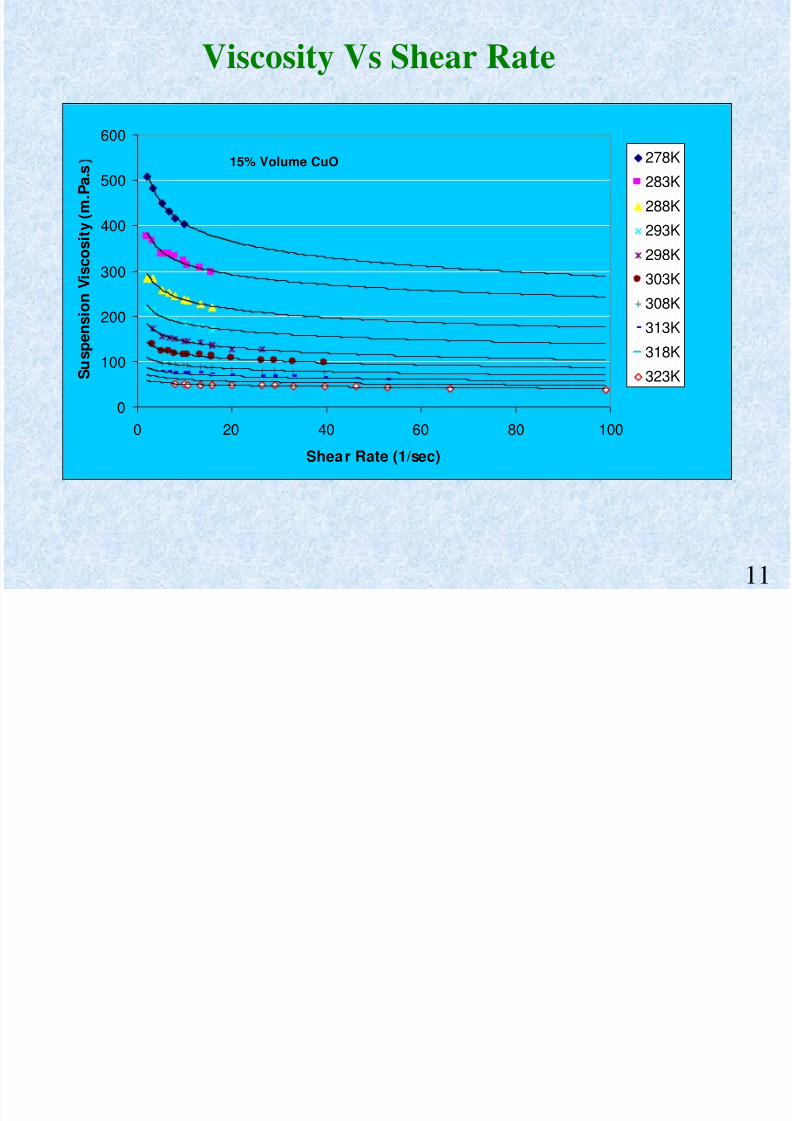
Shear Rate Vs Shear Stress
0
2
4
68
10
12
14
16
18
20
0 10 20 30 40 50 60
Shear Rate (1/sec)
S h e a r
S t r e s s ( N / m 2 )
278K
283K
288K
293K
298K
303K
308K313K
318K
323K
For 15% Vol. CuO in waternK
10n<1, Pseudoplastic and time independent
7/31/2019 Das India Kulkarni Etal Presentation 2008&09
http://slidepdf.com/reader/full/das-india-kulkarni-etal-presentation-200809 16/73
7/31/2019 Das India Kulkarni Etal Presentation 2008&09
http://slidepdf.com/reader/full/das-india-kulkarni-etal-presentation-200809 17/73
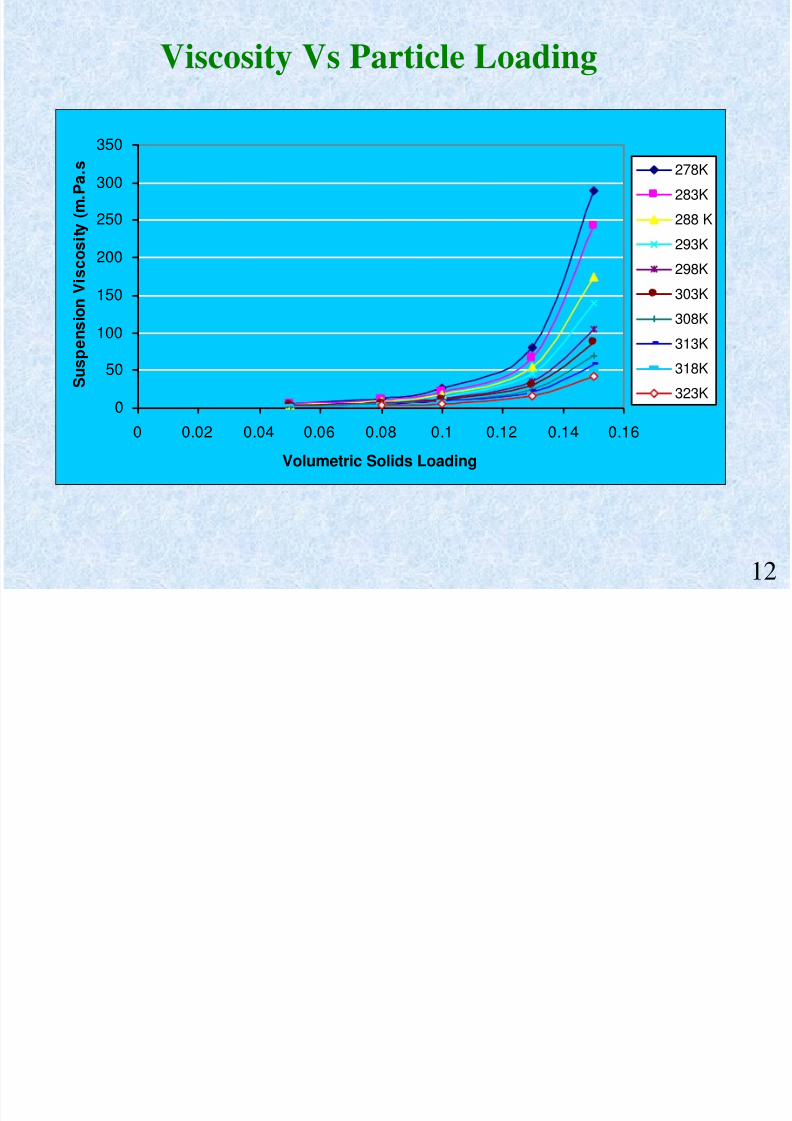
Viscosity Vs Particle Loading
0
50
100
150
200
250
300
350
0 0.02 0.04 0.06 0.08 0.1 0.12 0.14 0.16
Volumetric Solids Loading
S u s p e n s
i o n
V i s c o s
i t y ( m
. P a . s 278K
283K
288 K
293K
298K
303K
308K
313K
318K
323K
12
7/31/2019 Das India Kulkarni Etal Presentation 2008&09
http://slidepdf.com/reader/full/das-india-kulkarni-etal-presentation-200809 18/73
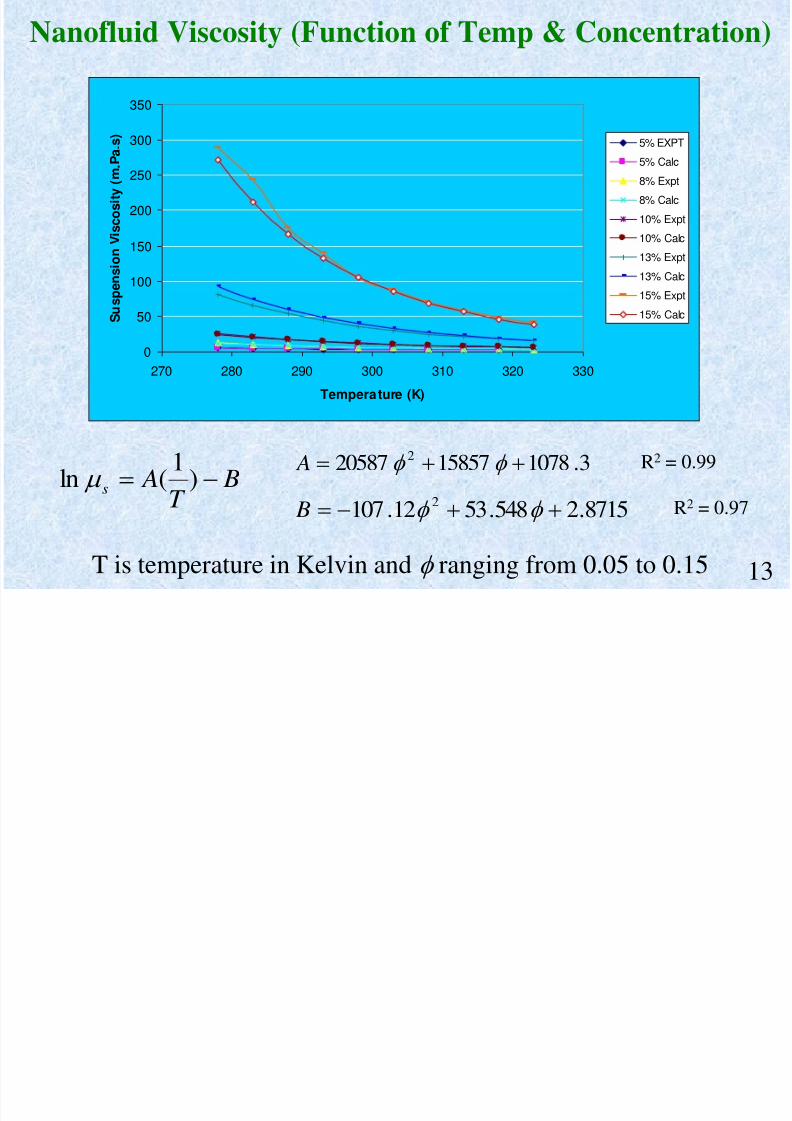
Nanofluid Viscosity (Function of Temp & Concentration)
0
50
100
150
200
250
300
350
270 280 290 300 310 320 330
Temperature (K)
S u s p e n s
i o n
V i s c o s
i t y ( m
. P a . s
)5% EXPT5% Calc
8% Expt
8% Calc
10% Expt
10% Calc
13% Expt
13% Calc15% Expt
15% Calc
BT
As )1
(ln 3.10781585720587 2 A
8715.2548.5312.107 2 B
R2 = 0.99
R2 = 0.97
T is temperature in Kelvin and ranging from 0.05 to 0.15 13

7/31/2019 Das India Kulkarni Etal Presentation 2008&09
http://slidepdf.com/reader/full/das-india-kulkarni-etal-presentation-200809 19/73
Topic of Discussion
Rheology of NanofluidsCopper oxide in propylene glycol/water (1 to 6% Volume)
14
7/31/2019 Das India Kulkarni Etal Presentation 2008&09
http://slidepdf.com/reader/full/das-india-kulkarni-etal-presentation-200809 20/73
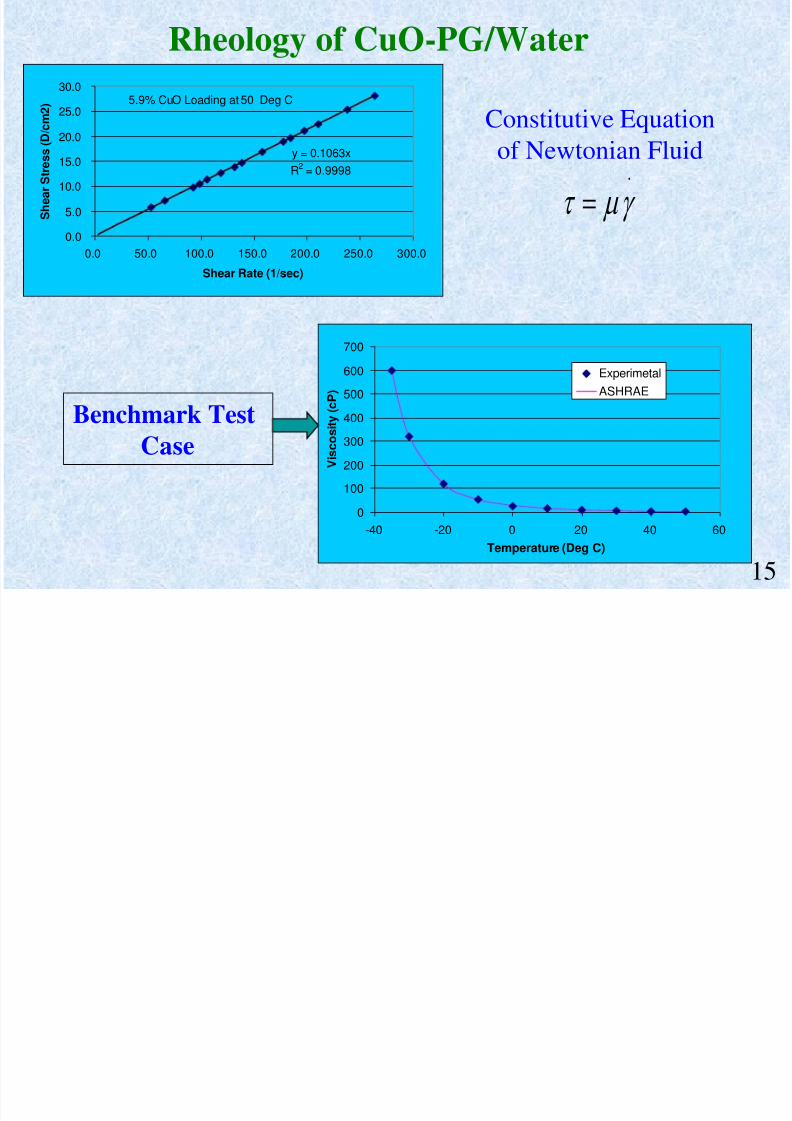
Rheology of CuO-PG/Water
y = 0.1063xR2 = 0.9998
0.0
5.0
10.0
15.020.0
25.0
30.0
0.0 50.0 100.0 150.0 200.0 250.0 300.0
Shear Rate (1/sec)
S h e a r
S t r e s s ( D
/ c m 2 ) 5.9% CuO Loading at 50 Deg C
0
100
200
300
400
500
600
700
-40 -20 0 20 40 60Temperature (Deg C)
V i s c o s
i t y ( c P )
ExperimetalASHRAE
.
Constitutive Equationof Newtonian Fluid
Benchmark TestCase
15
7/31/2019 Das India Kulkarni Etal Presentation 2008&09
http://slidepdf.com/reader/full/das-india-kulkarni-etal-presentation-200809 21/73
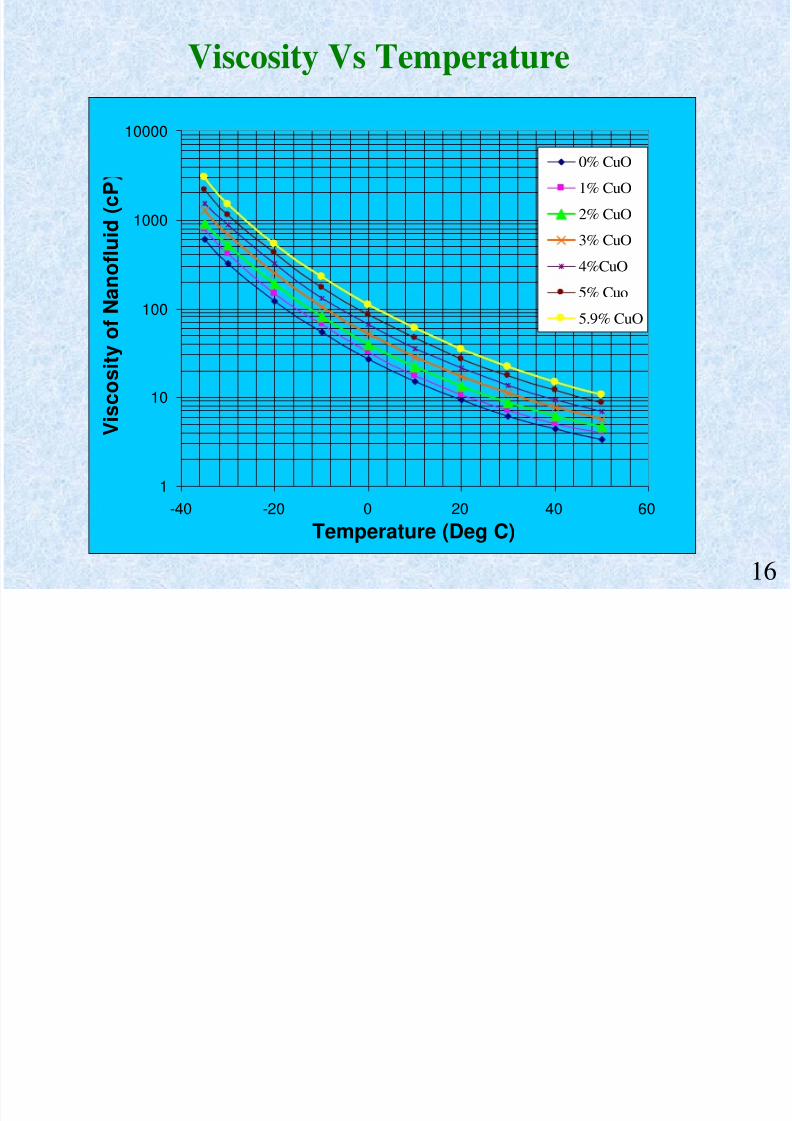
Viscosity Vs Temperature
1
10
100
1000
10000
-40 -20 0 20 40 60
Temperature (Deg C)
V i s c o s
i t y o
f N a n o
f l u i d ( c P
0% CuO
1% CuO
2% CuO
3% CuO
4%CuO
5% Cuo
5.9% CuO
16

7/31/2019 Das India Kulkarni Etal Presentation 2008&09
http://slidepdf.com/reader/full/das-india-kulkarni-etal-presentation-200809 22/73
Relative Viscosity of Nanofluid
0
1
2
3
4
5
6
-40 -20 0 20 40 60
Temperature (Deg C)
M u r
( M u s
/ M u f )
1% CuO2% CuO
3% CuO
4% Cuo5% CuO
5.9% Cuo
0
0.5
1
1.5
2
2.5
3
3.5
4
0 0.01 0.02 0.03 0.04 0.05 0.06 0.07
Volume Fraction
M u r
ExperimentalBatchelor Equation
Relative Viscosity as aFunction of Temperature
Comparison of Experiments with
Batchelor’s Equation
17
7/31/2019 Das India Kulkarni Etal Presentation 2008&09
http://slidepdf.com/reader/full/das-india-kulkarni-etal-presentation-200809 23/73
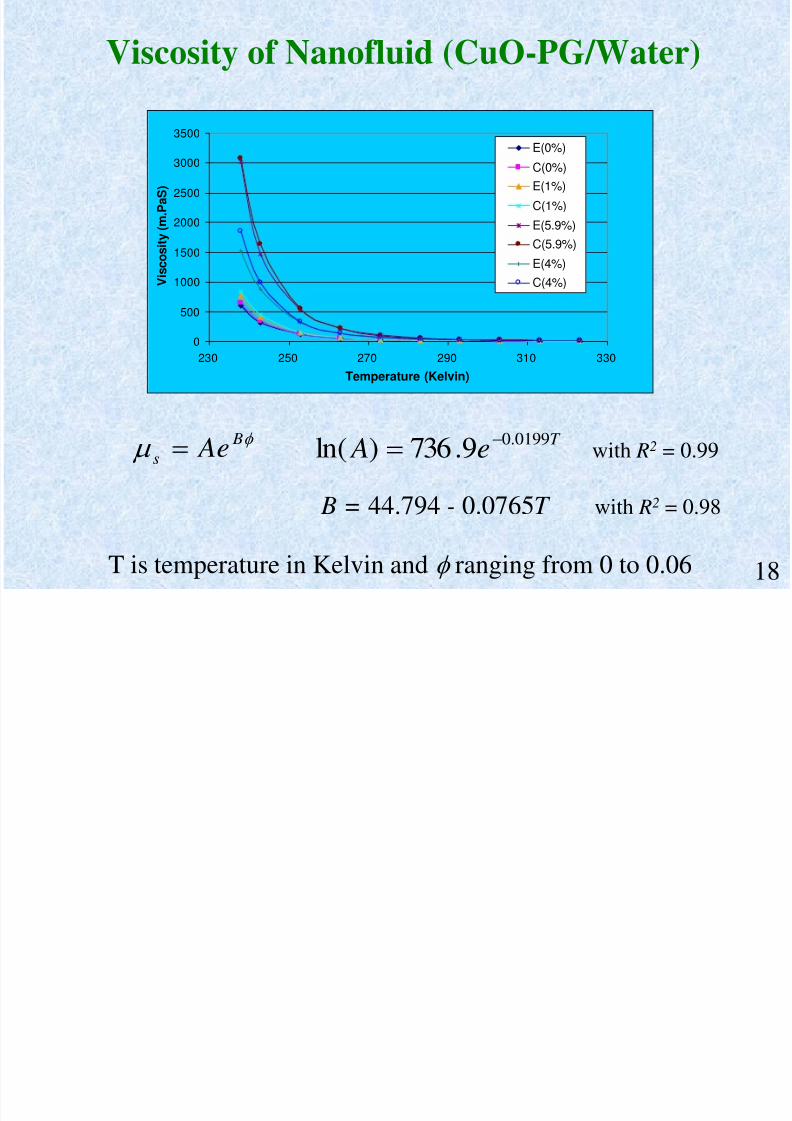
Viscosity of Nanofluid (CuO-PG/Water)
0
500
1000
1500
2000
2500
3000
3500
230 250 270 290 310 330
Temperature (Kelvin)
V i s c o s
i t y ( m
. P a
S )
E(0%)
C(0%)E(1%)
C(1%)
E(5.9%)C(5.9%)
E(4%)
C(4%)
Bs Ae T e A 0199.09.736)ln(
B = 44.794 - 0.0765 T with R2 = 0.98
with R2 = 0.99
T is temperature in Kelvin and ranging from 0 to 0.06 18
7/31/2019 Das India Kulkarni Etal Presentation 2008&09
http://slidepdf.com/reader/full/das-india-kulkarni-etal-presentation-200809 24/73
Conclusions: Rheology I
For CuO-WaterNanofluids with 5 to 15% vol. concentration behaved
as time-independent, shear thinning, pseudoplastic fluid.
The viscosity was found to be a strong function of temperature and the volumetric concentration.
A new correlation for viscosity of these nanofluids asa function of temperature and volumetric concentration
was developed.The curve fit correlation of viscosity verses
temperature agrees within 10% of the experimentalmeasurements.
19
7/31/2019 Das India Kulkarni Etal Presentation 2008&09
http://slidepdf.com/reader/full/das-india-kulkarni-etal-presentation-200809 25/73
Conclusions: Rheology IIFor CuO-PG/Water
Viscosity measurement for a 60:40 propylene glycol/water mixturewithout any nanoparticle suspension shows excellent agreement with theASHRAE data.
The viscosity of a CuO nanofluid in propylene glycol and water solution
is an exponential function of volume percentage and temperature. The behavior of this nanofluid up to a volume percentage of 5.9% is
Newtonian in nature.
The deviation from Batchelor’s classical equation is observed to be
substantial for nanofluids.Relative viscosity curves display higher slopes at low temperatures.
A new correlation has been developed for this type of nanofluid. Thedeviation between experimental data and values given by this correlation iswithin 10%.
20

7/31/2019 Das India Kulkarni Etal Presentation 2008&09
http://slidepdf.com/reader/full/das-india-kulkarni-etal-presentation-200809 26/73
Topic of Discussion
Effect on the Prandtl Number
21
7/31/2019 Das India Kulkarni Etal Presentation 2008&09
http://slidepdf.com/reader/full/das-india-kulkarni-etal-presentation-200809 27/73
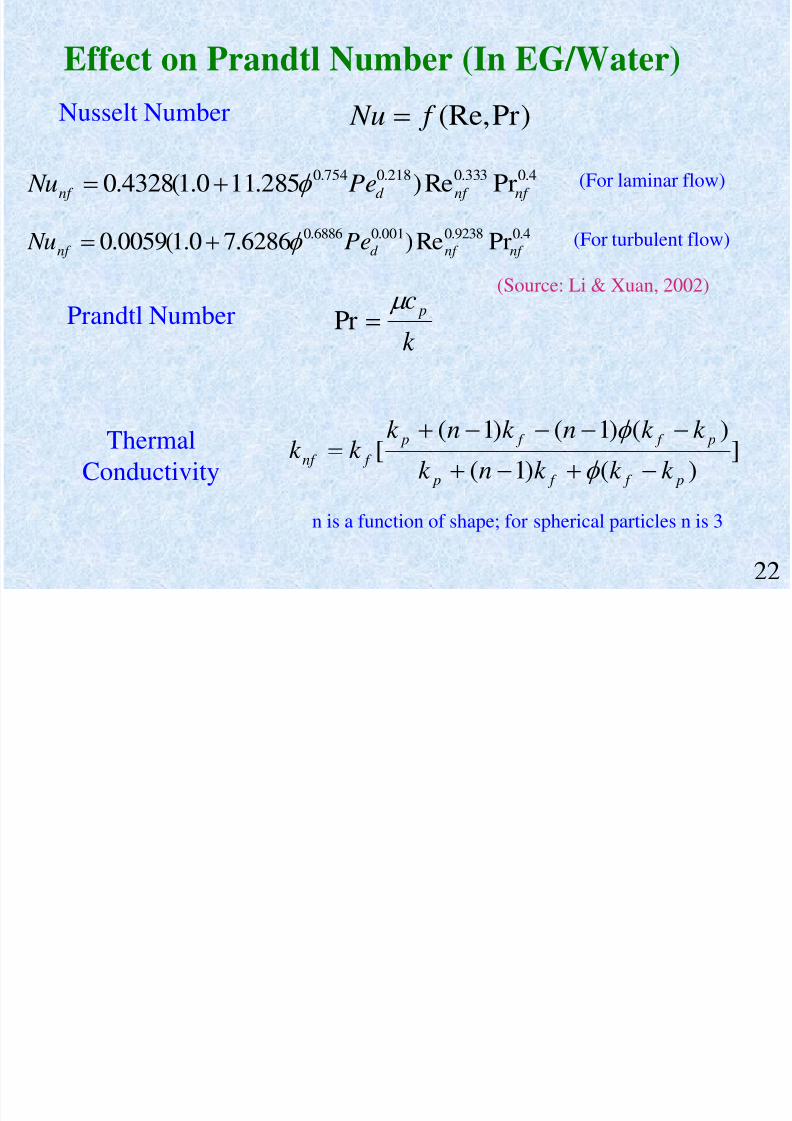
Effect on Prandtl Number (In EG/Water)
Pr)(Re, f Nu
4.0333.0218.0754.0 PrRe)285.110.1(4328.0 nf nf d nf Pe Nu
4.09238.0001.06886.0 PrRe)6286.70.1(0059.0 nf nf d nf Pe Nu
(For laminar flow)
(For turbulent flow)
(Source: Li & Xuan, 2002)
k
c p Pr
Nusselt Number
Prandtl Number
])()1(
)()1()1([
p f f p
p f f p f nf k k k nk
k k nk nk k k
ThermalConductivity
n is a function of shape; for spherical particles n is 3
22
7/31/2019 Das India Kulkarni Etal Presentation 2008&09
http://slidepdf.com/reader/full/das-india-kulkarni-etal-presentation-200809 28/73
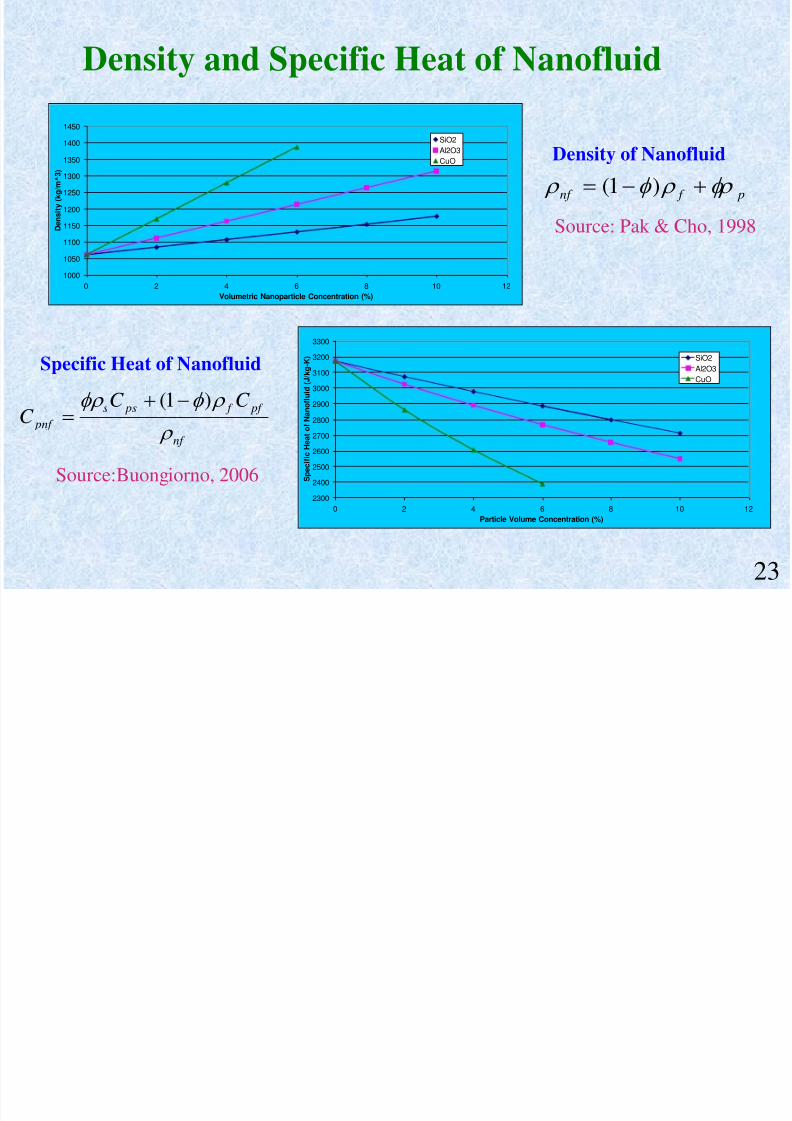
Density and Specific Heat of Nanofluid
p f nf )1(Density of Nanofluid
Source: Pak & Cho, 1998
1000
1050
1100
1150
1200
1250
1300
1350
1400
1450
0 2 4 6 8 10 12Volumetric Nanoparticle Concentration (%)
D e n s
i t y ( k g
/ m ^ 3 )
SiO2Al2O3CuO
2300
2400
2500
2600
2700
2800
2900
3000
3100
3200
3300
0 2 4 6 8 10 12Particle Volume Concentration (%)
S p e c
i f i c H e a
t o
f N a n o
f l u i d ( J / k g - K
) SiO2Al2O3CuO
Specific Heat of Nanofluid
nf
pf f pss pnf
C C C
)1(
Source:Buongiorno, 2006
23
7/31/2019 Das India Kulkarni Etal Presentation 2008&09
http://slidepdf.com/reader/full/das-india-kulkarni-etal-presentation-200809 29/73
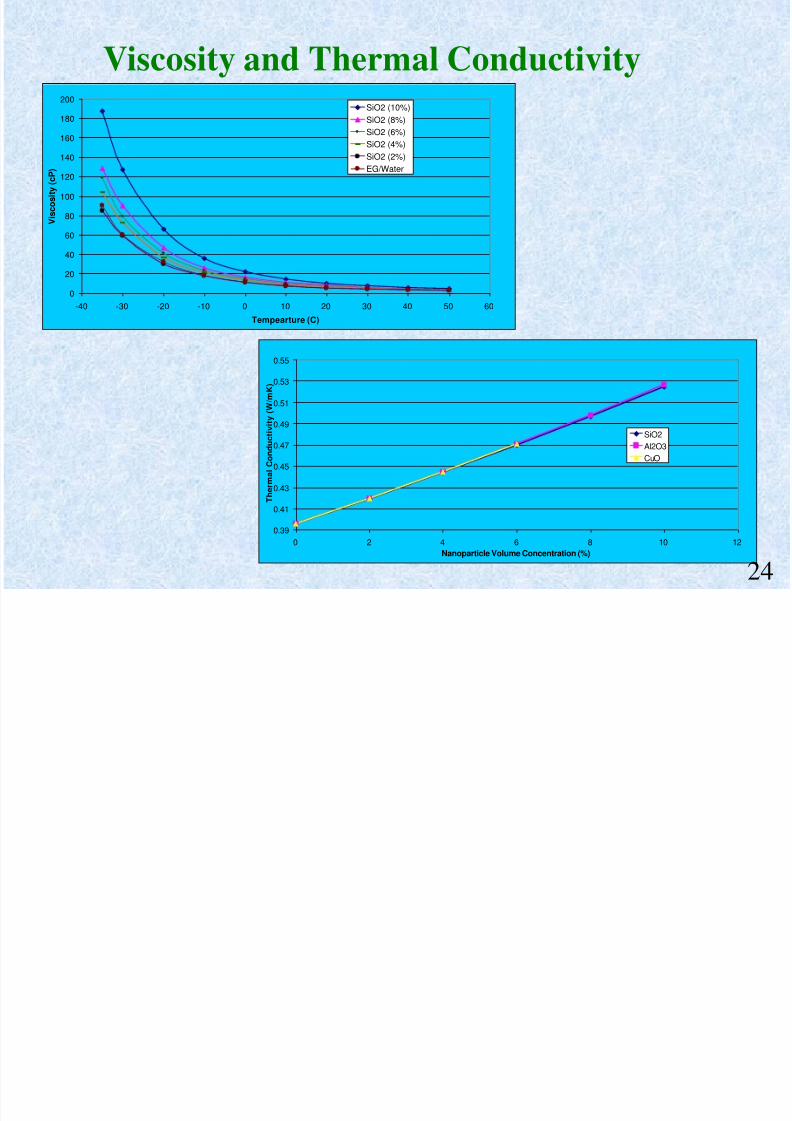
Viscosity and Thermal Conductivity
0.39
0.41
0.43
0.45
0.47
0.49
0.51
0.53
0.55
0 2 4 6 8 10 12
Nanoparticle Volume Concentration (%)
T h e r m a l
C o n
d u c t i v i t y
( W / m K )
SiO2Al2O3CuO
24
0
20
40
60
80
100
120
140160
180
200
-40 -30 -20 -10 0 10 20 30 40 50 60
Tempearture (C)
V i s c o s
i t y ( c P )
SiO2 (10%)SiO2 (8%)SiO2 (6%)
SiO2 (4%)SiO2 (2%)EG/Water
7/31/2019 Das India Kulkarni Etal Presentation 2008&09
http://slidepdf.com/reader/full/das-india-kulkarni-etal-presentation-200809 30/73
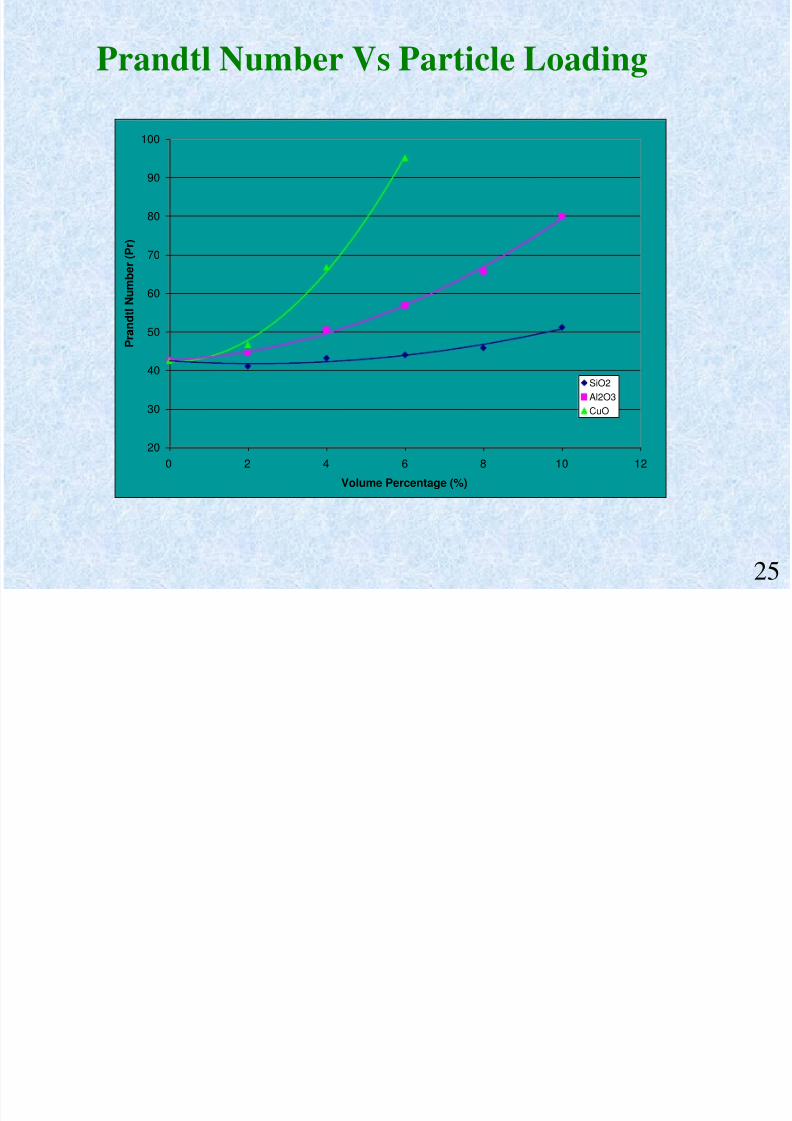
Prandtl Number Vs Particle Loading
20
30
40
50
60
70
80
90
100
0 2 4 6 8 10 12
Volume Percentage (%)
P r a n
d t l N u m
b e r
( P r )
SiO2Al2O3CuO
25

7/31/2019 Das India Kulkarni Etal Presentation 2008&09
http://slidepdf.com/reader/full/das-india-kulkarni-etal-presentation-200809 31/73
7/31/2019 Das India Kulkarni Etal Presentation 2008&09
http://slidepdf.com/reader/full/das-india-kulkarni-etal-presentation-200809 32/73
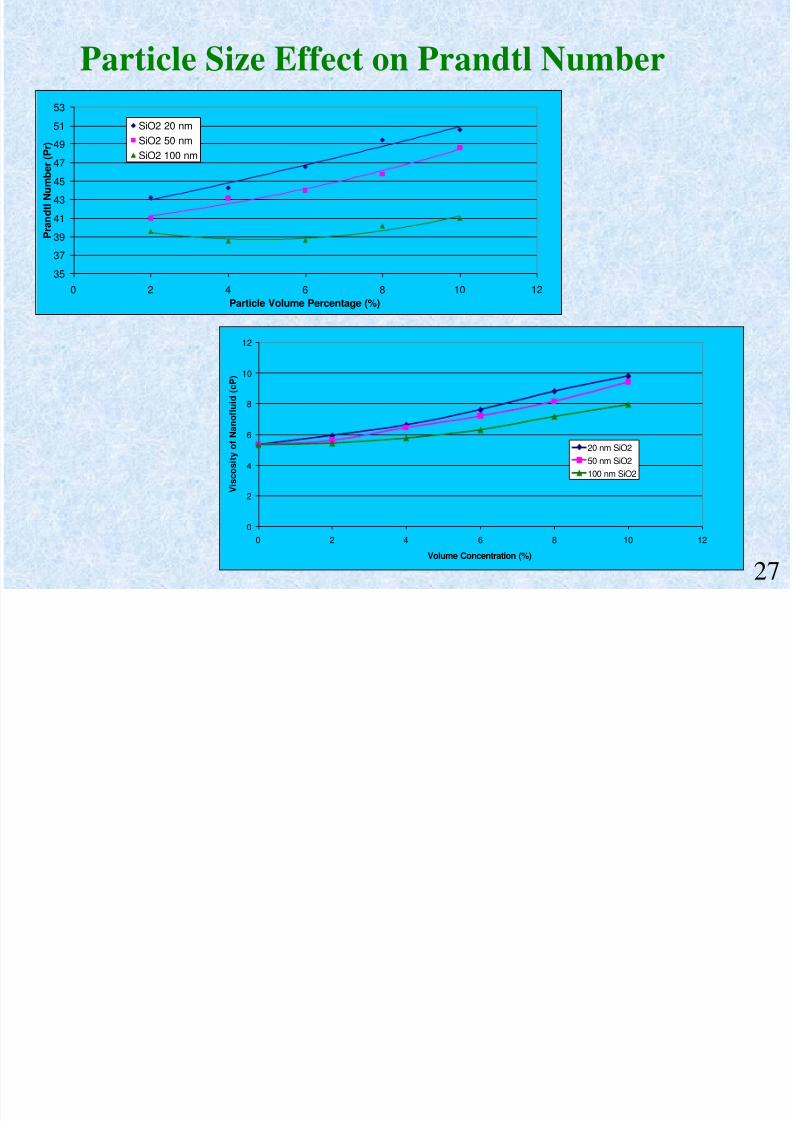
Particle Size Effect on Prandtl Number
35
37
39
41
43
45
4749
51
53
0 2 4 6 8 10 12Particle Volume Percentage (%)
P r a n
d t l N u m
b e r
( P r )
SiO2 20 nm
SiO2 50 nmSiO2 100 nm
0
2
4
6
8
10
12
0 2 4 6 8 10 12
Volume Concentration (%)
V i s c o s i t y o
f N a n o
f l u i d ( c P )
20 nm SiO250 nm SiO2100 nm SiO2
27
7/31/2019 Das India Kulkarni Etal Presentation 2008&09
http://slidepdf.com/reader/full/das-india-kulkarni-etal-presentation-200809 33/73
Conclusions: Prandtl Number
Nanofluid density increases as volume concentration increases. It increasesrapidly for higher density particles.
Adding nanoparticles to a base fluid reduces the specific heat of thenanofluid.
Viscosity is a strong function of volume concentration, temperature andparticle diameter of nanoparticles.
Prandtl number increases rapidly as particle volume concentration increases.Among the three fluids analyzed, it is highest for copper oxide nanofluidsand lowest for silicon dioxide nanofluids.
The Prandtl number also changes with particle diameter. The smaller thediameter, the higher is the Prandtl number.
The Prandtl number increases exponentially as the nanofluid is cooled belowsub zero temperatures.
28
7/31/2019 Das India Kulkarni Etal Presentation 2008&09
http://slidepdf.com/reader/full/das-india-kulkarni-etal-presentation-200809 34/73
Topic of Discussion
Figure of Merit: Mouromtseff Number
29

7/31/2019 Das India Kulkarni Etal Presentation 2008&09
http://slidepdf.com/reader/full/das-india-kulkarni-etal-presentation-200809 35/73
Comparison of Heat Transfer Rates of Nanofluids
Comparison on the basis of Mouromtseff number (Mo)
The Mouromtseff number is a Figure of Merit (FOM) for heattransfer fluids.
e
d p
ba C k Mo
Mouromtseff
Number
k , , C p and µ are thermal conductivity,density, specific heat and dynamic
viscosity of the fluid respectively
The exponents a, b, d, and e take on values appropriate to the heat transfer mode of interest and the corresponding heat transfer correlation
])()1(
)()1()1([
p f f p
p f f p f nf k k k nk
k k nk nk k k
s f nf )1(
BT
As )1
(ln nf
pf f pss pnf
C C C
)1(
Thermal Conductivity Density
ViscositySpecific Heat
30
7/31/2019 Das India Kulkarni Etal Presentation 2008&09
http://slidepdf.com/reader/full/das-india-kulkarni-etal-presentation-200809 36/73
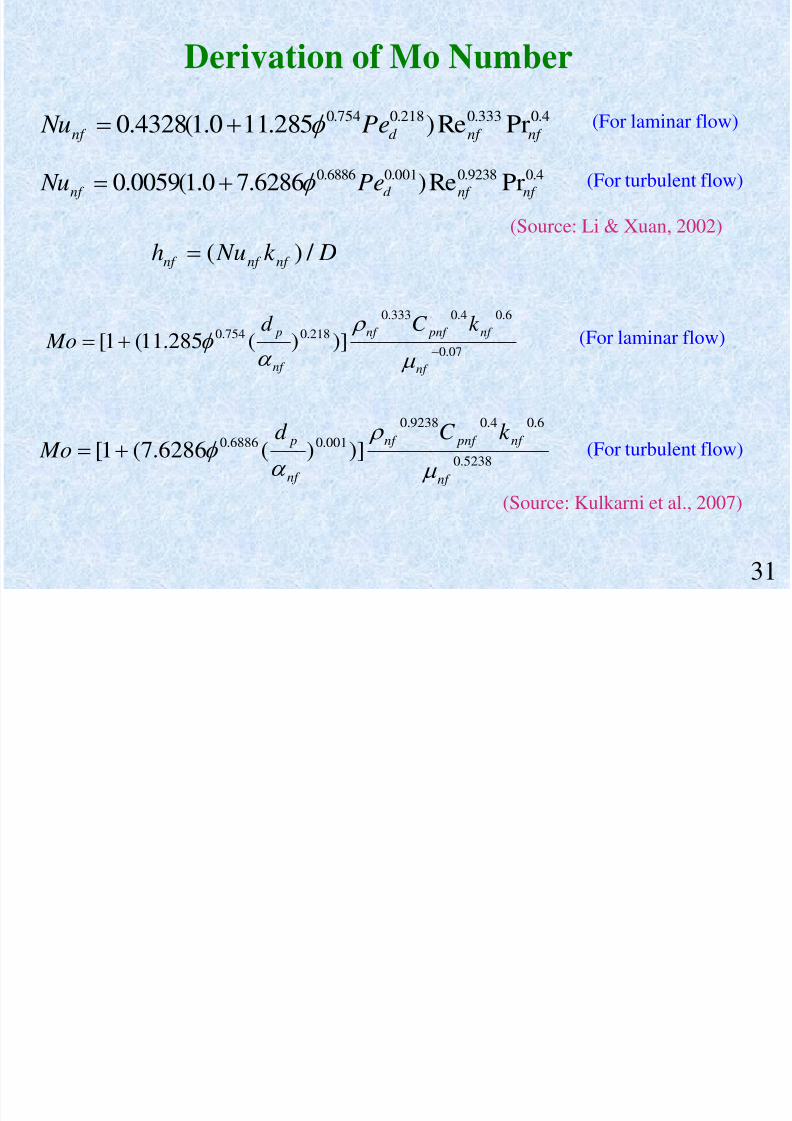
Derivation of Mo Number
4.0333.0218.0754.0 PrRe)285.110.1(4328.0 nf nf d nf Pe Nu
4.09238.0001.06886.0 PrRe)6286.70.1(0059.0 nf nf d nf Pe Nu
(For laminar flow)
(For turbulent flow)
(Source: Li & Xuan, 2002) Dk Nuh nf nf nf / )(
07.0
6.04.0333.0
218.0754.0 )])(285.11(1[nf
nf pnf nf
nf
p k C d Mo
5238.0
6.04.09238.0001.06886.0 )])(6286.7(1[
nf
nf pnf nf
nf
p k C d Mo
(For laminar flow)
(For turbulent flow)
(Source: Kulkarni et al., 2007)
31

7/31/2019 Das India Kulkarni Etal Presentation 2008&09
http://slidepdf.com/reader/full/das-india-kulkarni-etal-presentation-200809 37/73
Mo Number for Water
0
1
2
3
4
5
6
7
8
water 5 8 10 13 15
% of CuO Particles in Water
R e
l a t i v e
H e a
t T r a n s
f e r r a
t eLaminar
Turbulent
32

7/31/2019 Das India Kulkarni Etal Presentation 2008&09
http://slidepdf.com/reader/full/das-india-kulkarni-etal-presentation-200809 38/73
Mo Number forLaminar Flow
Laminar
0
0.5
1
1.5
2
2.5
60:40 EG/Water + CuONanoparticles
60:40 PG/water + CuONanoparticles
R e
l a t i v e
H e a t
T r a n s
f e r Water
0%
1%
2%
3%
4%
5%
6%
Turbulent
0
0.2
0.4
0.6
0.8
1
1.2
60:40 EG/Water + CuONanoparticles
60:40 PG/water + CuONanoparticles
R e
l a t i v e
H e a
t T r a n s
f eWater
0%
1%
2%3%
4%
5%
6%
Mo Number forTurbulent Flow
33
7/31/2019 Das India Kulkarni Etal Presentation 2008&09
http://slidepdf.com/reader/full/das-india-kulkarni-etal-presentation-200809 39/73
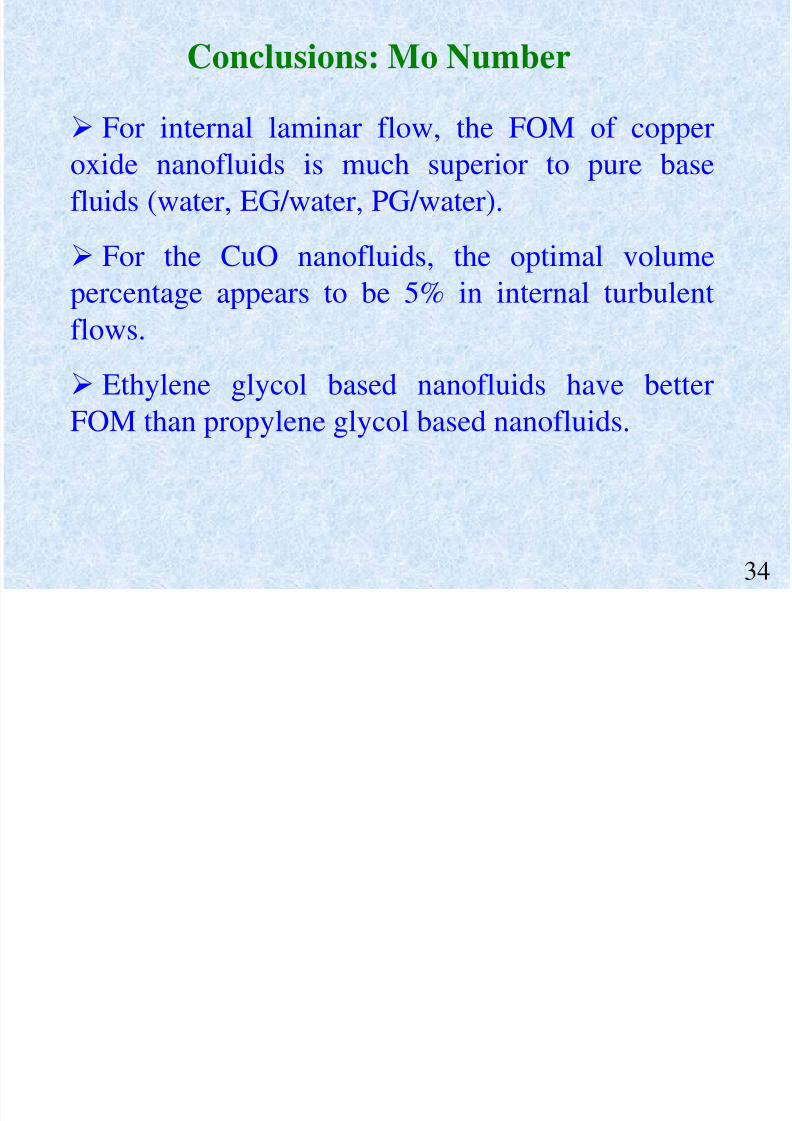
Conclusions: Mo Number
For internal laminar flow, the FOM of copperoxide nanofluids is much superior to pure basefluids (water, EG/water, PG/water).
For the CuO nanofluids, the optimal volumepercentage appears to be 5% in internal turbulentflows.
Ethylene glycol based nanofluids have better
FOM than propylene glycol based nanofluids.
34
7/31/2019 Das India Kulkarni Etal Presentation 2008&09
http://slidepdf.com/reader/full/das-india-kulkarni-etal-presentation-200809 40/73
Topic of Discussion
Heat Transfer and Fluid Dynamic Performance of SiO 2 ,CuO and Al 2O3 nanofluid
35
7/31/2019 Das India Kulkarni Etal Presentation 2008&09
http://slidepdf.com/reader/full/das-india-kulkarni-etal-presentation-200809 41/73
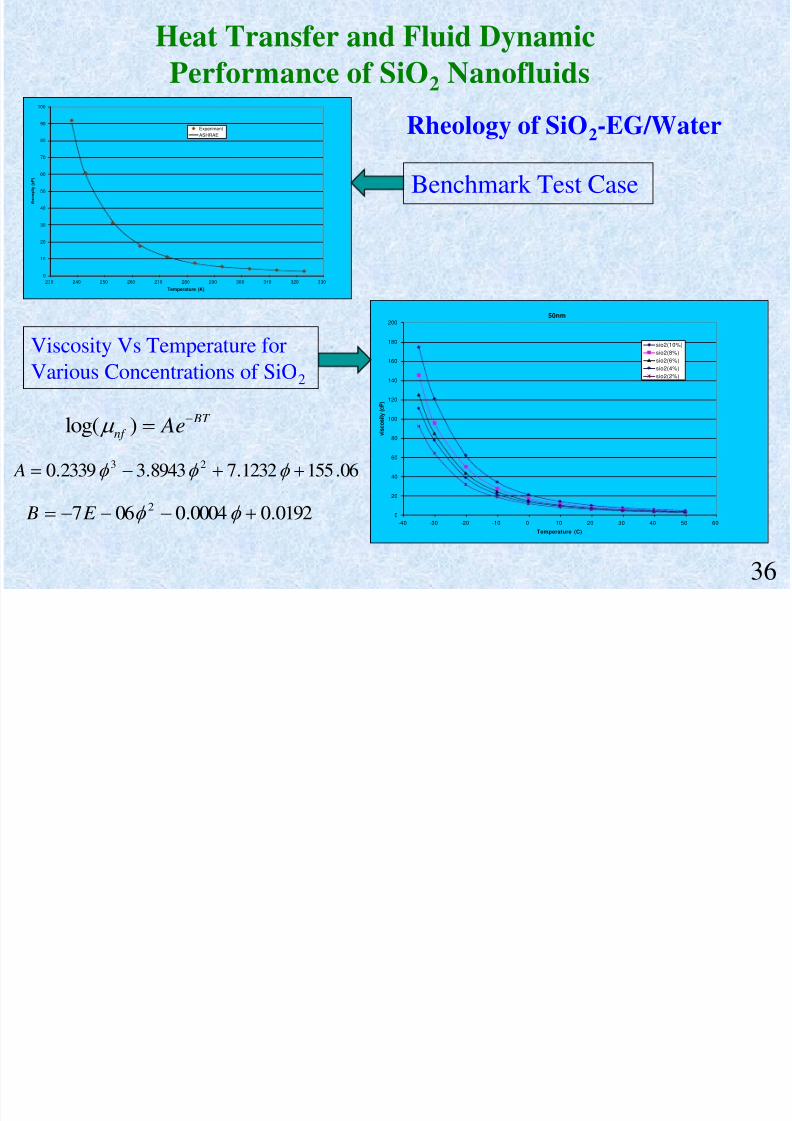
Heat Transfer and Fluid DynamicPerformance of SiO 2 Nanofluids
Rheology of SiO 2-EG/Water
0
10
20
30
40
50
60
70
80
90
100
230 240 250 260 270 280 290 300 310 320 330Temperature (K)
V i s c o s i t y ( c P )
ExperimentASHRAE
50nm
0
20
40
60
80
100
120
140
160
180
200
-40 -30 -20 -10 0 10 20 30 40 50 60
Temperature (C)
v i s c o s i t y ( c P )
sio2(10%)sio2(8%)sio2(6%)sio2(4%)sio2(2%)
Benchmark Test Case
Viscosity Vs Temperature forVarious Concentrations of SiO 2
BT nf Ae)log(
06.1551232.78943.32339.0 23 A
0192.00004.0067 2 E B
36
7/31/2019 Das India Kulkarni Etal Presentation 2008&09
http://slidepdf.com/reader/full/das-india-kulkarni-etal-presentation-200809 42/73
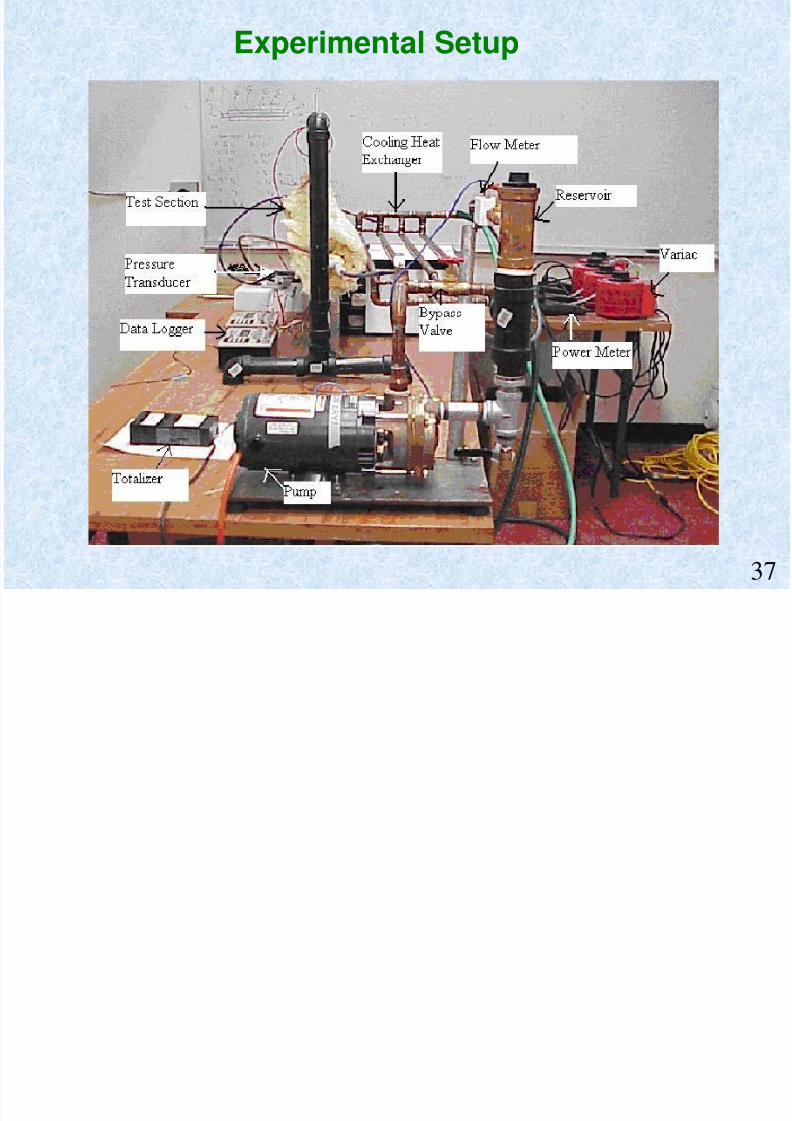
Experimental Setup
37

7/31/2019 Das India Kulkarni Etal Presentation 2008&09
http://slidepdf.com/reader/full/das-india-kulkarni-etal-presentation-200809 43/73
Determination of Heat Transfer Coefficient
f wnf T T
qh "
f p T C mq.
4.08.0
PrRe023.0 Nu
1
10
100
100 1000 10000 100000
Reynolds Number
N u
/ P r ^ 0 .
4
ExperimentDittus Boelter for EG/WaterBenchmark Case
Dittus Boelter Equationfor EG/water
Heat gained by fluid
Heat transfer coefficientof nanofluid
38
7/31/2019 Das India Kulkarni Etal Presentation 2008&09
http://slidepdf.com/reader/full/das-india-kulkarni-etal-presentation-200809 44/73
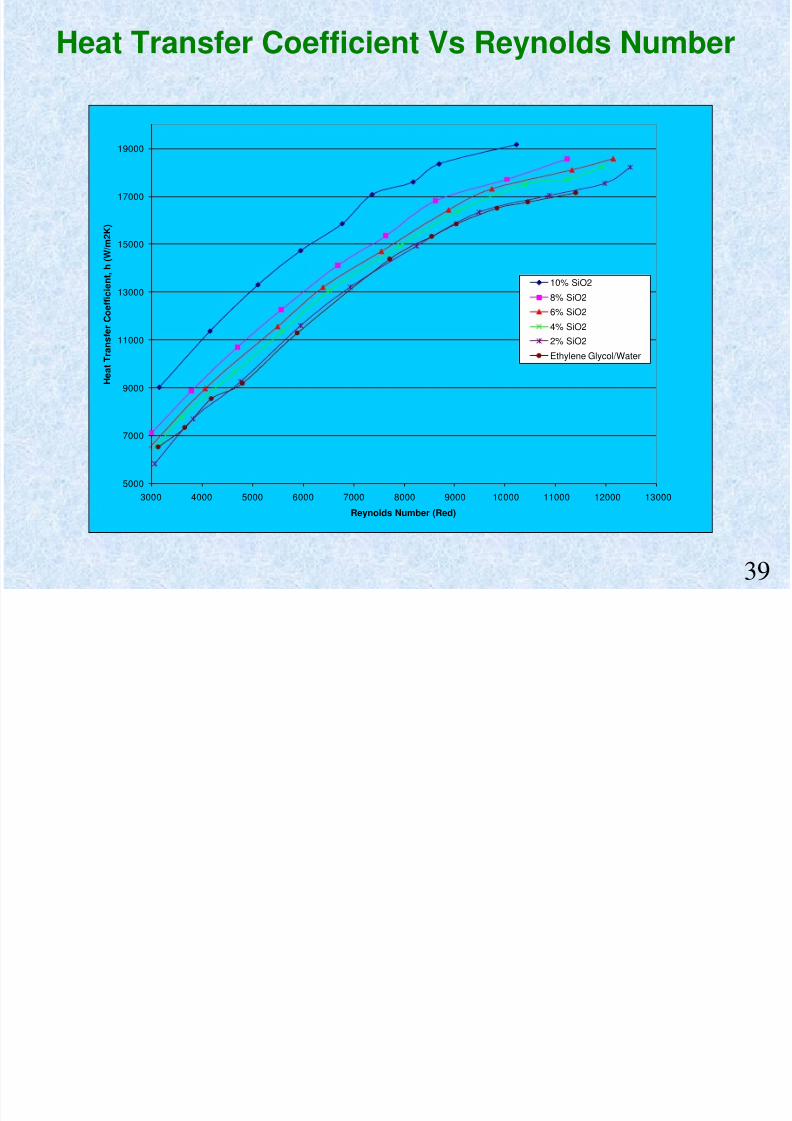
Heat Transfer Coefficient Vs Reynolds Number
5000
7000
9000
11000
13000
15000
17000
19000
3000 4000 5000 6000 7000 8000 9000 10000 11000 12000 13000
Reynolds Number (Red)
H e a t
T r a n s f e r
C o e f f i c i e n
t , h ( W / m 2 K )
10% SiO28% SiO2
6% SiO2
4% SiO2
2% SiO2
Ethylene Glycol/Water
39
7/31/2019 Das India Kulkarni Etal Presentation 2008&09
http://slidepdf.com/reader/full/das-india-kulkarni-etal-presentation-200809 45/73
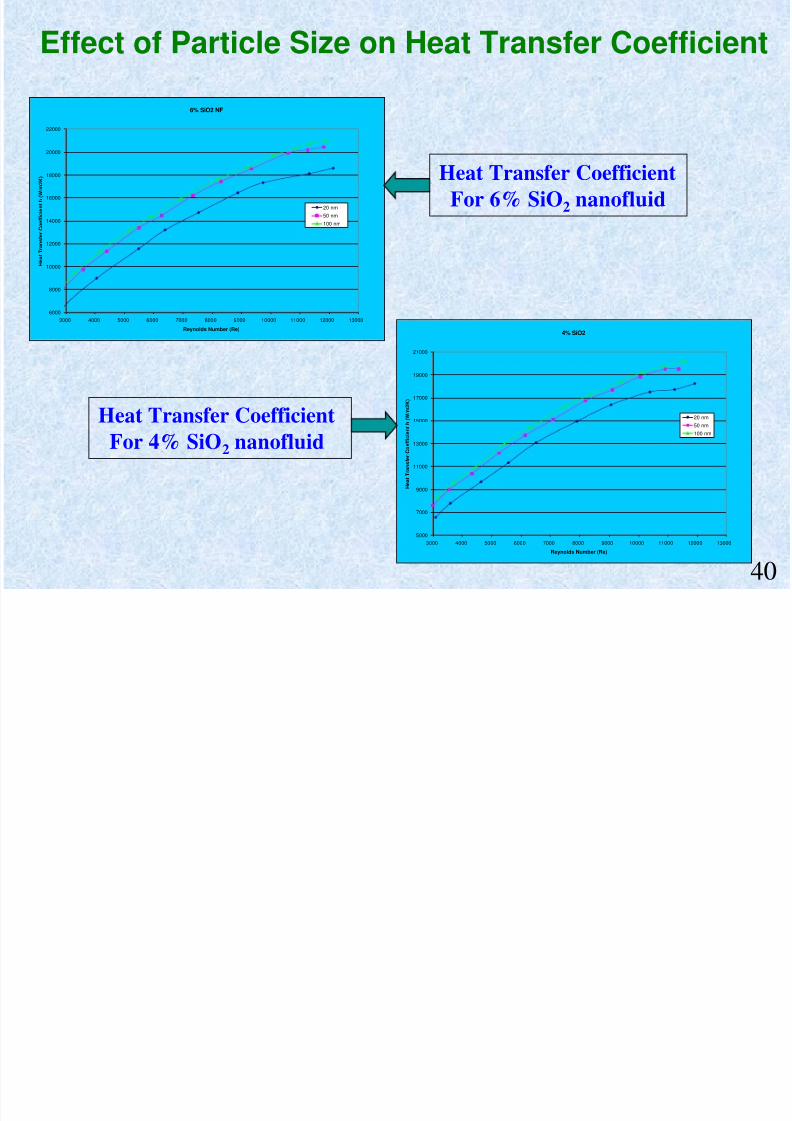
Effect of Particle Size on Heat Transfer Coefficient
6% SiO2 NF
6000
8000
10000
12000
14000
16000
18000
20000
22000
3000 4000 5000 6000 7000 8000 9000 10000 11000 12000 13000
Reynolds Number (Re)
H e a t
T r a n s f e r
C o e f f i c i e n
t h ( W / m 2 K )
20 nm50 nm100 nm
4% SiO2
5000
7000
9000
11000
13000
15000
17000
19000
21000
3000 4000 5000 6000 7000 8000 9000 10000 11000 12000 13000
Reynolds Number (Re)
H e a t
T r a n s
f e r C o e f f i c i e n
t h ( W / m 2 K )
20 nm50 nm100 nm
Heat Transfer CoefficientFor 6% SiO 2 nanofluid
Heat Transfer CoefficientFor 4% SiO 2 nanofluid
40
7/31/2019 Das India Kulkarni Etal Presentation 2008&09
http://slidepdf.com/reader/full/das-india-kulkarni-etal-presentation-200809 46/73
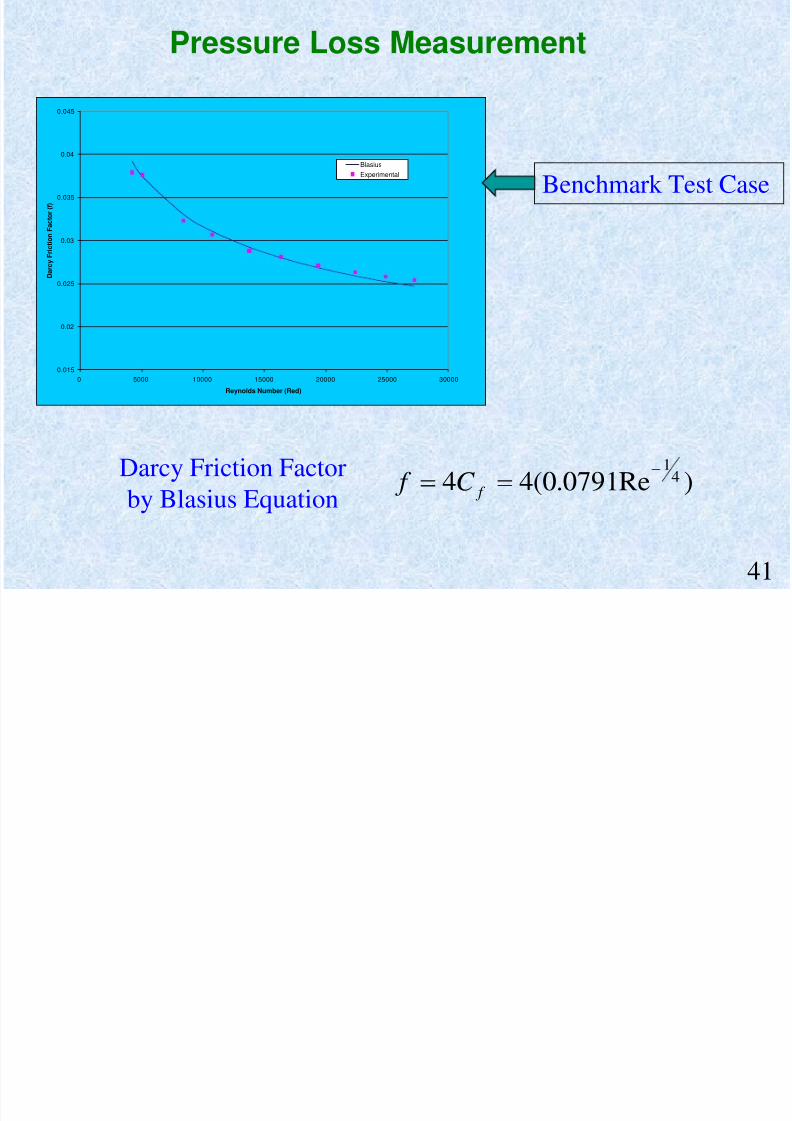
Pressure Loss Measurement
0.015
0.02
0.025
0.03
0.035
0.04
0.045
0 5000 10000 15000 20000 25000 30000
Reynolds Number (Red)
D a r c y
F r i c
t i o n
F a c
t o r
( f )
BlasiusExperimental
)Re0791.0(44 41
f C f Darcy Friction Factorby Blasius Equation
Benchmark Test Case
41

7/31/2019 Das India Kulkarni Etal Presentation 2008&09
http://slidepdf.com/reader/full/das-india-kulkarni-etal-presentation-200809 47/73
7/31/2019 Das India Kulkarni Etal Presentation 2008&09
http://slidepdf.com/reader/full/das-india-kulkarni-etal-presentation-200809 48/73
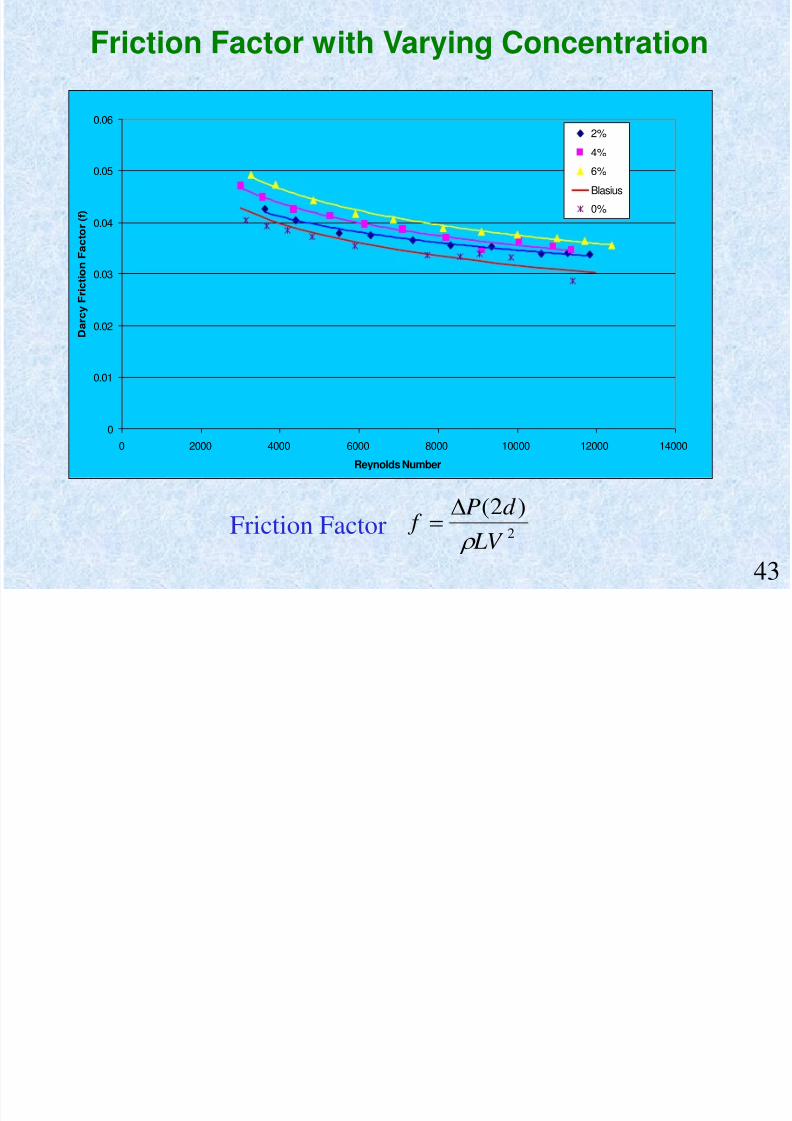
Friction Factor with Varying Concentration
0
0.01
0.02
0.03
0.04
0.05
0.06
0 2000 4000 6000 8000 10000 12000 14000
Reynolds Number
D a r c y
F r i c
t i o n
F a c
t o r
( f )
2%
4%
6%
Blasius
0%
2
)2( LV
d P f
Friction Factor
43
7/31/2019 Das India Kulkarni Etal Presentation 2008&09
http://slidepdf.com/reader/full/das-india-kulkarni-etal-presentation-200809 49/73
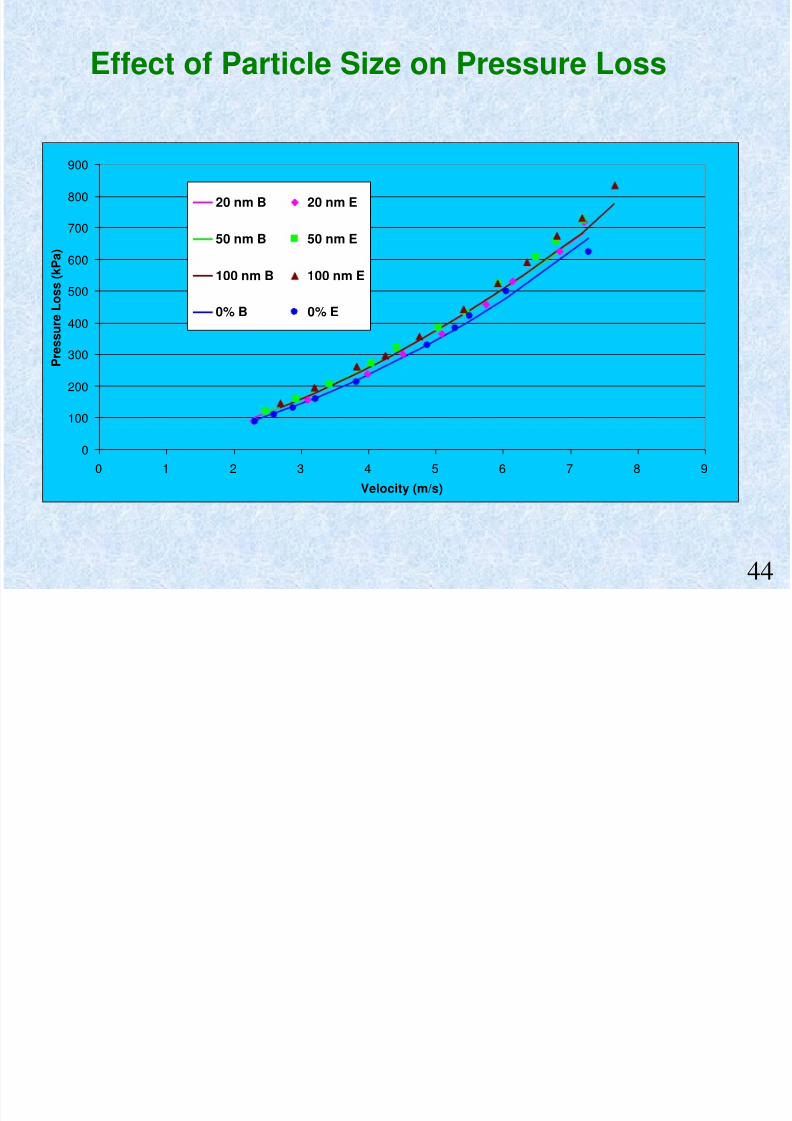
Effect of Particle Size on Pressure Loss
0
100
200
300
400
500
600
700
800
900
0 1 2 3 4 5 6 7 8 9
Velocity (m/s)
P r e s s u r e
L o s s
( k P a
)
20 nm B 20 nm E
50 nm B 50 nm E
100 nm B 100 nm E
0% B 0% E
44
l
7/31/2019 Das India Kulkarni Etal Presentation 2008&09
http://slidepdf.com/reader/full/das-india-kulkarni-etal-presentation-200809 50/73
ConclusionsViscosity of a nanofluid is a function of nanoparticle
concentration, increasing as the concentration increases.
As particle size increases, the viscosity of nanofluids decreases.
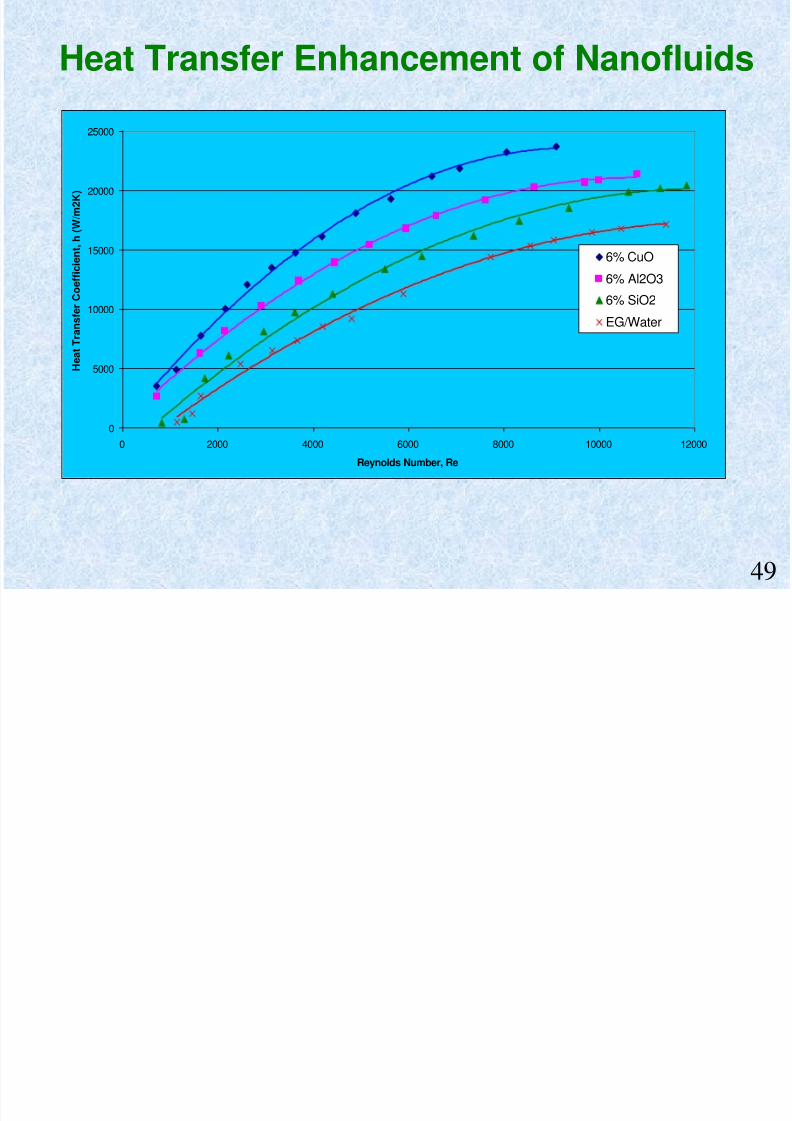
Heat transfer coefficients of nanofluids increase with volumeconcentration. A typical enhancement of heat transfer coefficient is
about 16% at a concentration of 10% with 20 nm particle diameterat Re = 10,000.
Particle size influences the heat transfer coefficient. The largerthe diameter, the higher the heat transfer coefficient.
Pressure loss is a function of the concentration, increasing withincreasing concentration. This is because the viscosity increaseswith concentration.
No appreciable change in pressure loss was observed withdifferent particle diameters. 45

7/31/2019 Das India Kulkarni Etal Presentation 2008&09
http://slidepdf.com/reader/full/das-india-kulkarni-etal-presentation-200809 51/73
A li i f N fl id i H i B ildi
7/31/2019 Das India Kulkarni Etal Presentation 2008&09
http://slidepdf.com/reader/full/das-india-kulkarni-etal-presentation-200809 52/73
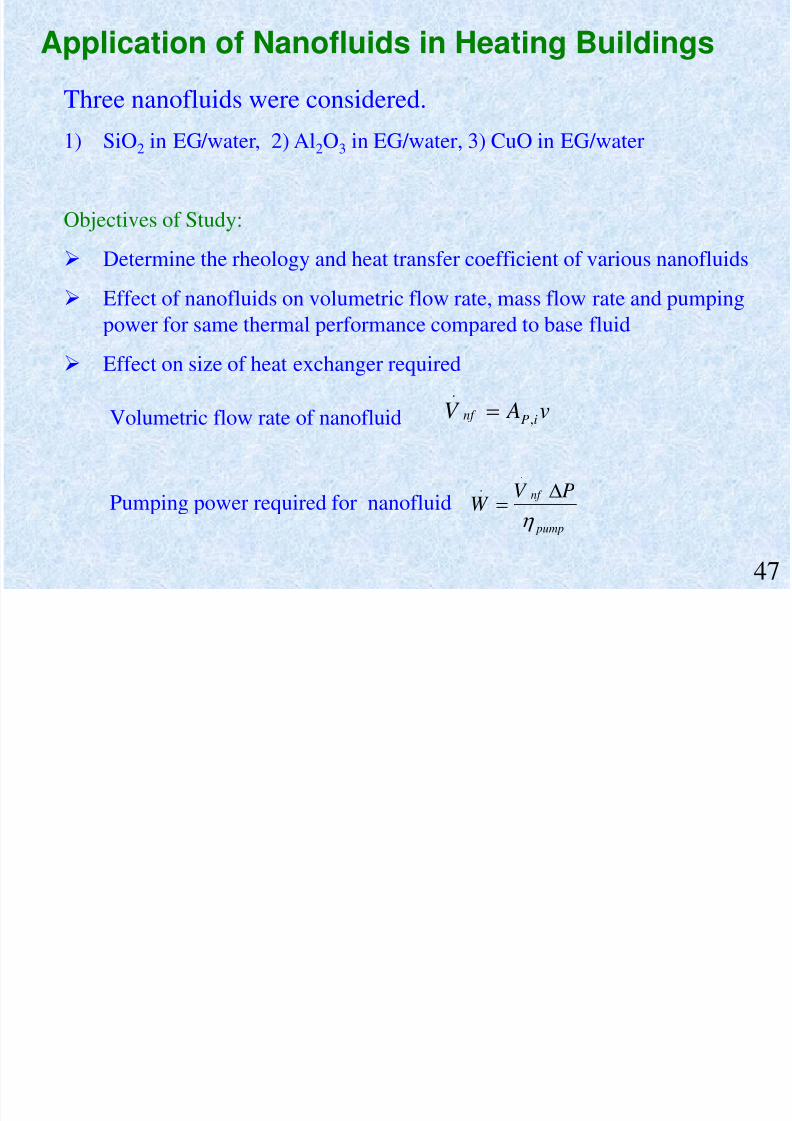
Application of Nanofluids in Heating Buildings
Three nanofluids were considered.
1) SiO 2 in EG/water, 2) Al 2O3 in EG/water, 3) CuO in EG/water
Objectives of Study:
Determine the rheology and heat transfer coefficient of various nanofluids
Effect of nanofluids on volumetric flow rate, mass flow rate and pumpingpower for same thermal performance compared to base fluid
Effect on size of heat exchanger required
pump
nf PV W
.
.
v AV iPnf
,
.
Volumetric flow rate of nanofluid
Pumping power required for nanofluid
47
Vi i f V i N fl id

7/31/2019 Das India Kulkarni Etal Presentation 2008&09
http://slidepdf.com/reader/full/das-india-kulkarni-etal-presentation-200809 53/73
Viscosity of Various Nanofluids
0
50
100
150
200
250
300
350
400
450
-40 -30 -20 -10 0 10 20 30 40 50 60
Temperature (Deg C)
V i s c o s i t y o
f N a n o
f l u i d ( m P a .
S )
EG/Water
6% Cuo
6% Al2O3
6% SiO2
48
7/31/2019 Das India Kulkarni Etal Presentation 2008&09
http://slidepdf.com/reader/full/das-india-kulkarni-etal-presentation-200809 54/73
Heat Transfer Enhancement of Nanofluids
0
5000
10000
15000
20000
25000
0 2000 4000 6000 8000 10000 12000
Reynolds Number, Re
H e a t
T r a n s f e r
C o e
f f i c i e n t , h ( W / m 2 K )
6% CuO
6% Al2O36% SiO2
EG/Water
49

7/31/2019 Das India Kulkarni Etal Presentation 2008&09
http://slidepdf.com/reader/full/das-india-kulkarni-etal-presentation-200809 55/73
Pressure Loss of Various Nanofluids
0
200
400
600
800
1000
1200
3000 4000 5000 6000 7000 8000 9000 10000 11000 12000 13000
Reynolds Number (Re)
P r e s s u r e
L o s s
( k P a
)
EG/Water6% CuO6% Al2O36% SiO2
50

7/31/2019 Das India Kulkarni Etal Presentation 2008&09
http://slidepdf.com/reader/full/das-india-kulkarni-etal-presentation-200809 56/73
N fl id i Ai H t E h g
7/31/2019 Das India Kulkarni Etal Presentation 2008&09
http://slidepdf.com/reader/full/das-india-kulkarni-etal-presentation-200809 57/73
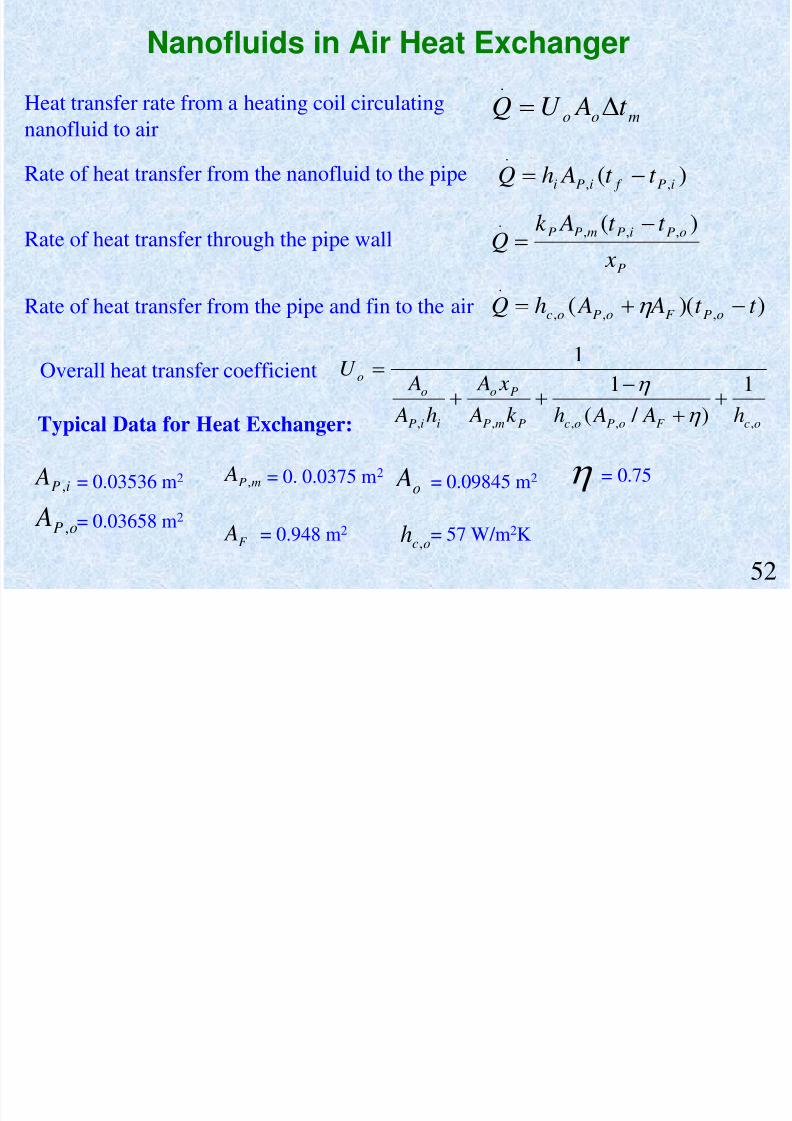
Nanofluids in Air Heat Exchanger
moo t AU Q.
)( ,,
.
iP f iPi t t AhQ
P
oPiPmPP
x
t t Ak Q
)( ,,,.
))(( ,,,
.t t A AhQ oPF oPoc
ocF oPocPmP
Po
iiP
oo
h A Ahk A
x A
h A
AU
,,,,,
1
) / (
11
Heat transfer rate from a heating coil circulatingnanofluid to air
Rate of heat transfer from the nanofluid to the pipe
Rate of heat transfer through the pipe wall
Rate of heat transfer from the pipe and fin to the air
Overall heat transfer coefficient
Typical Data for Heat Exchanger:
iP A ,
oP A ,
mP A ,
F A
o A
och ,
= 0.03536 m 2
= 0.03658 m 2
= 0. 0.0375 m 2
= 0.948 m 2
= 0.09845 m 2
= 57 W/m 2K
= 0.75
52
R d ti i S f A ith N fl id
7/31/2019 Das India Kulkarni Etal Presentation 2008&09
http://slidepdf.com/reader/full/das-india-kulkarni-etal-presentation-200809 58/73
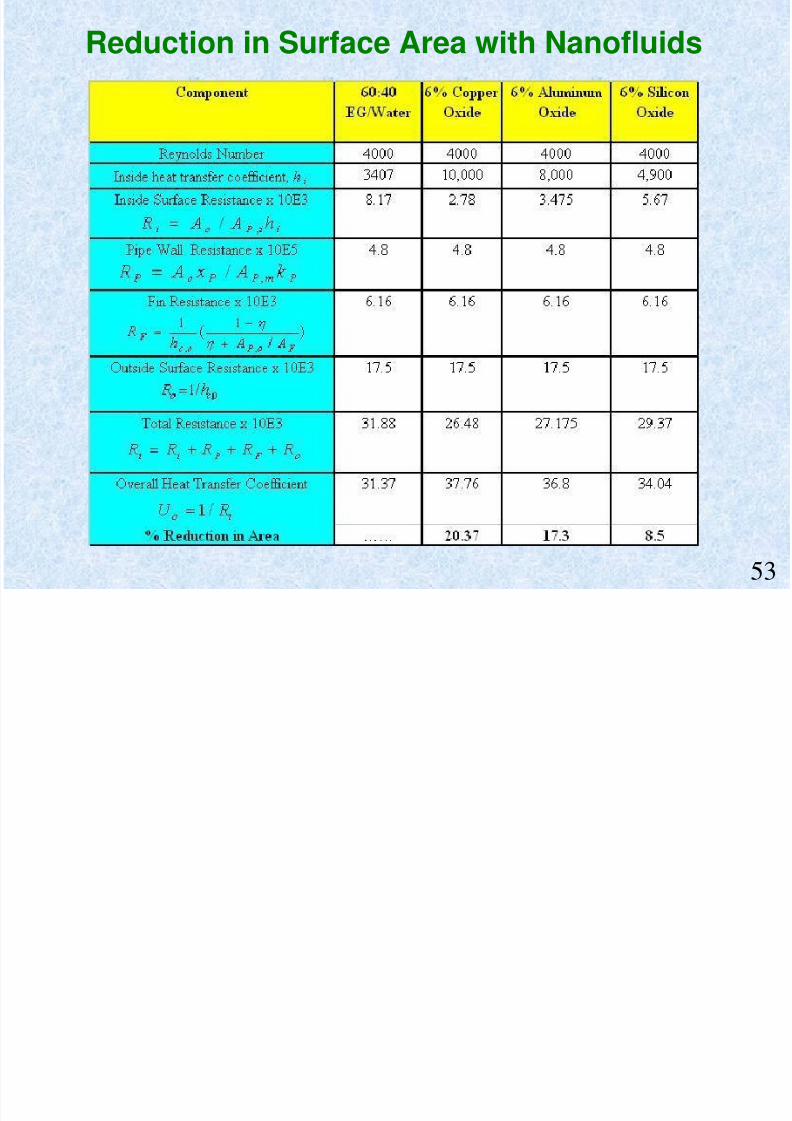
Reduction in Surface Area with Nanofluids
53
7/31/2019 Das India Kulkarni Etal Presentation 2008&09
http://slidepdf.com/reader/full/das-india-kulkarni-etal-presentation-200809 59/73
Topic of Discussion
7/31/2019 Das India Kulkarni Etal Presentation 2008&09
http://slidepdf.com/reader/full/das-india-kulkarni-etal-presentation-200809 60/73
Topic of Discussion
Case II: Application of Nanofluid as Coolant in DieselElectric Generator (DEG)
55
Application of Nanofl ids in Diesel Electric Generator

7/31/2019 Das India Kulkarni Etal Presentation 2008&09
http://slidepdf.com/reader/full/das-india-kulkarni-etal-presentation-200809 61/73
Application of Nanofluids in Diesel Electric Generator
56
Cogeneration Efficiency

7/31/2019 Das India Kulkarni Etal Presentation 2008&09
http://slidepdf.com/reader/full/das-india-kulkarni-etal-presentation-200809 62/73
Cogeneration Efficiency
cogen = ( Electrical Power + Rate of Heat Recovered)/ FuelConsumption energy rate
CogenerationEfficiency
V f H H V Q..
Heat rate from diesel fuel
H
JW el
cogen
Q
QW .
..
JW nf JW V m..
)(..
out JW in JW pJW JW JW T T C mQ
)(..
inSW out SW pSW SW SW T T C mQ
s f nf )1(
Mass flow rate of jacket water
Density of jacket water/nanofluid
Heat transfer from jacket water
Heat transfer from shop water
57
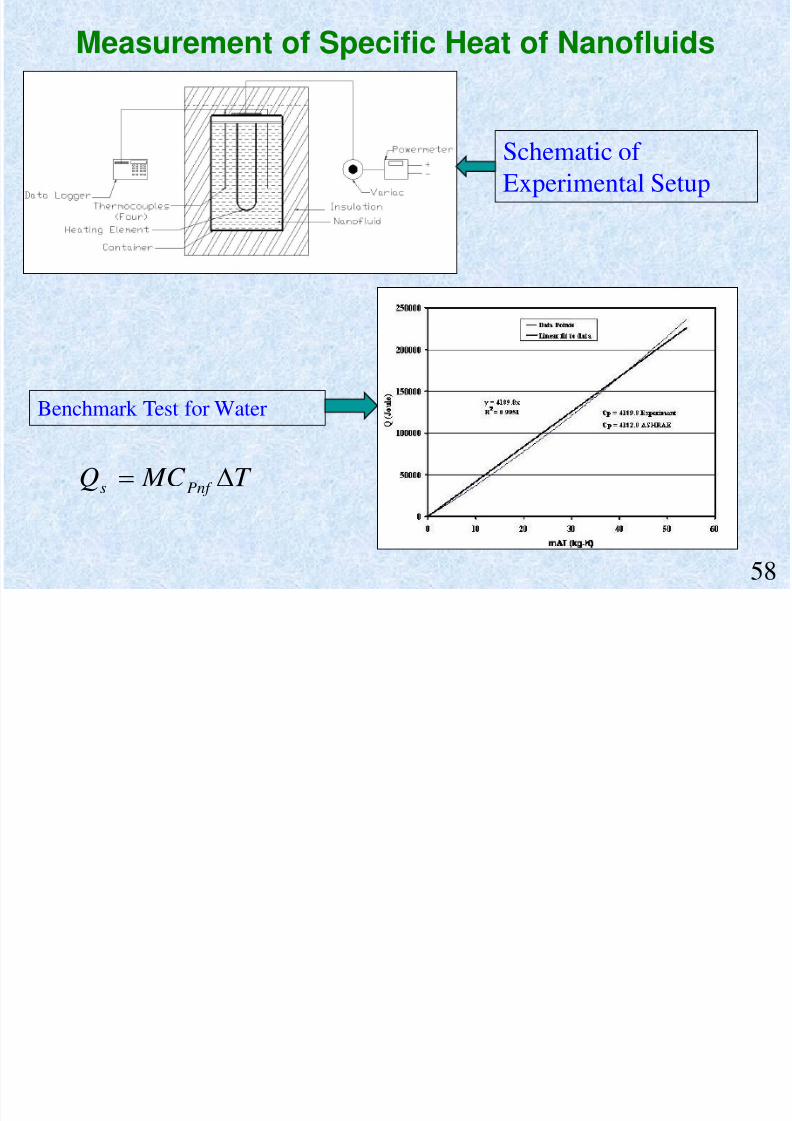
Measurement of Specific Heat of Nanofluids
7/31/2019 Das India Kulkarni Etal Presentation 2008&09
http://slidepdf.com/reader/full/das-india-kulkarni-etal-presentation-200809 63/73
Measurement of Specific Heat of Nanofluids
Benchmark Test for Water
Schematic of Experimental Setup
T MC Q Pnf s
58
Heating Time for Nanofluids

7/31/2019 Das India Kulkarni Etal Presentation 2008&09
http://slidepdf.com/reader/full/das-india-kulkarni-etal-presentation-200809 64/73
Heating Time for Nanofluids
Heat Input = 35.5 W59
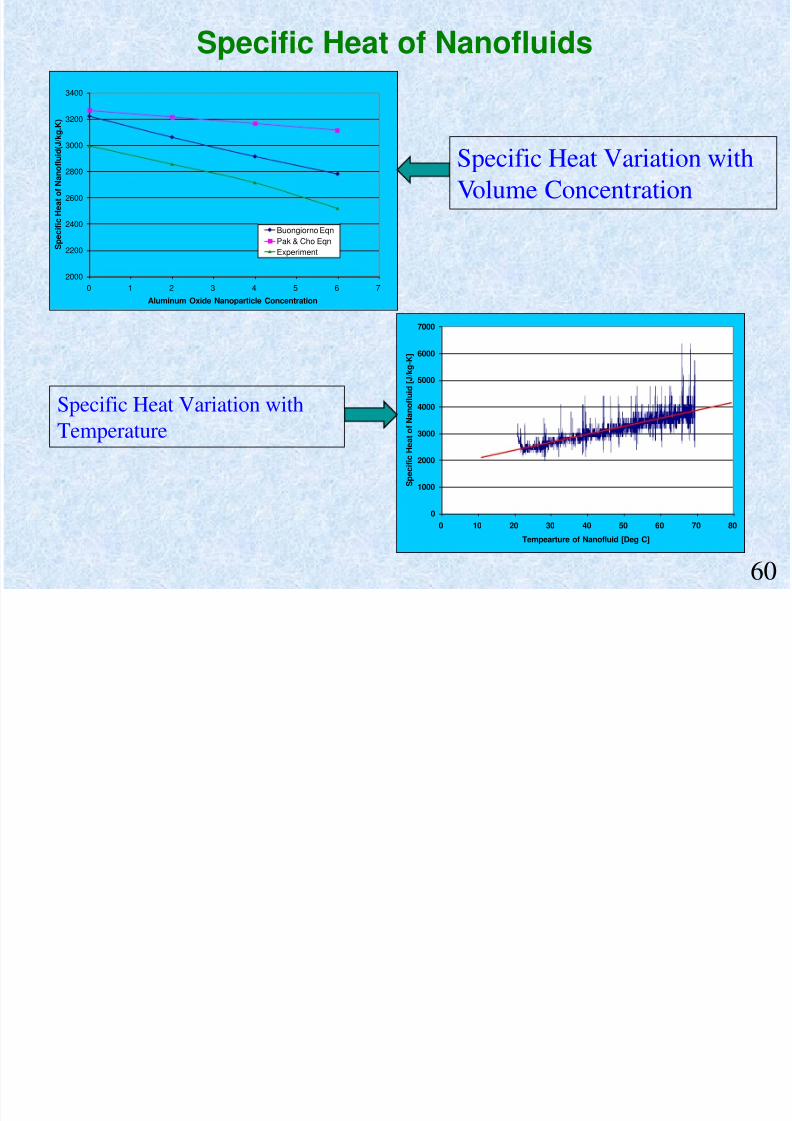
Specific Heat of Nanofluids
7/31/2019 Das India Kulkarni Etal Presentation 2008&09
http://slidepdf.com/reader/full/das-india-kulkarni-etal-presentation-200809 65/73
Specific Heat of Nanofluids
0
1000
2000
3000
4000
5000
6000
7000
0 10 20 30 40 50 60 70 80
Tempearture of Nanofluid [Deg C]
S p e c i f i c
H e a t o f
N a n o f l u i d
[ J / k g - K
]
2000
2200
2400
2600
2800
3000
3200
3400
0 1 2 3 4 5 6 7Aluminum Oxide Nanoparticle Concentration
S p e c i f i c
H e a t o f N a n o
f l u i d ( J / k g . K )
Buongiorno EqnPak & Cho EqnExperiment
Specific Heat Variation withTemperature
Specific Heat Variation withVolume Concentration
60
El t i l L d DEG

7/31/2019 Das India Kulkarni Etal Presentation 2008&09
http://slidepdf.com/reader/full/das-india-kulkarni-etal-presentation-200809 66/73
Electrical Load on DEG
2% Al2O3 Electrical Load [kW] vs Time [sec]
0.000
5.000
10.000
15.000
20.000
25.000
30.000
35.000
0 500 1000 1500 2000 2500 3000 3500
Time [sec]
E l e c t r i c a l O u t p u
t [ k W ]
61
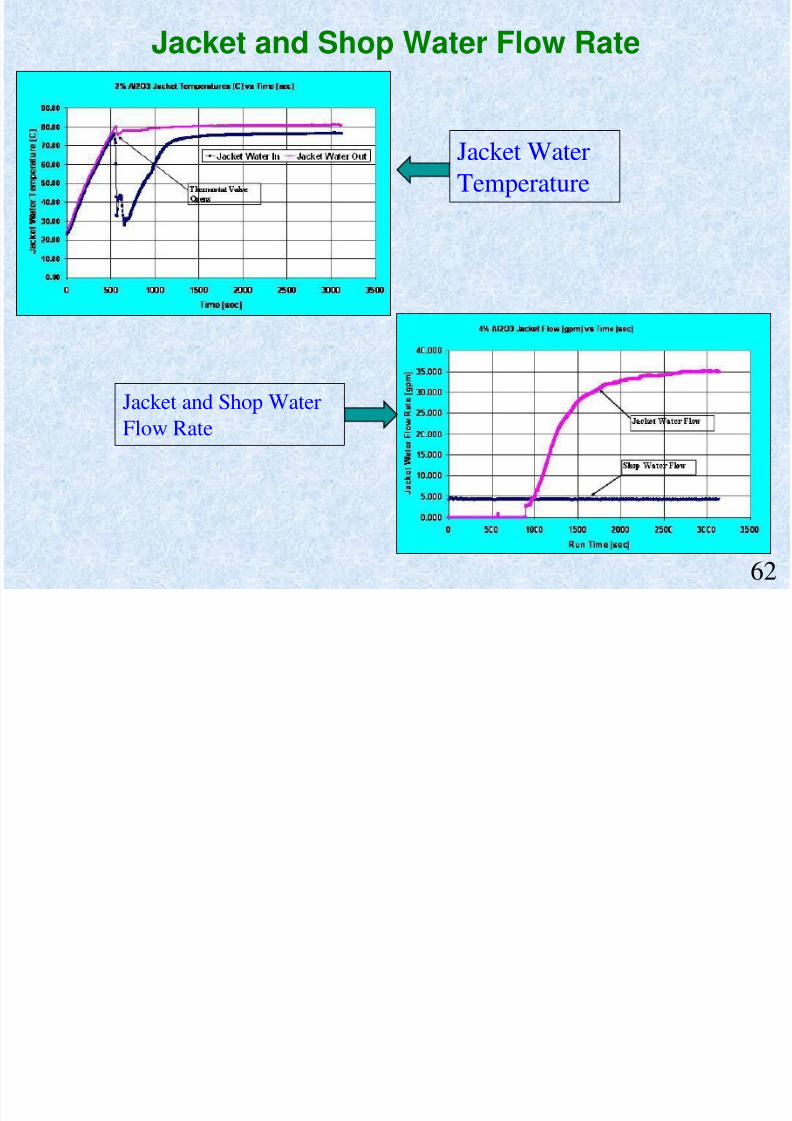
Jacket and Shop Water Flow Rate
7/31/2019 Das India Kulkarni Etal Presentation 2008&09
http://slidepdf.com/reader/full/das-india-kulkarni-etal-presentation-200809 67/73
Jacket and Shop Water Flow Rate
Jacket and Shop WaterFlow Rate
Jacket WaterTemperature
62

7/31/2019 Das India Kulkarni Etal Presentation 2008&09
http://slidepdf.com/reader/full/das-india-kulkarni-etal-presentation-200809 68/73
Fuel Flow Measurement
6% Al2O3 Fuel Volume [gal] vs. Time [sec]
y = -6.369409E-04x + 8.848424E+00R2 = 9.988593E-01
6.5
6.7
6.9
7.1
7.3
7.5
7.7
7.9
8.1
8.3
8.5
1000 1500 2000 2500 3000 3500 4000
Time [sec]
V o
l u m e
F u e l R e m a i n
i n g
[ g a l l o n s ]
63
Cogeneration Efficiency

7/31/2019 Das India Kulkarni Etal Presentation 2008&09
http://slidepdf.com/reader/full/das-india-kulkarni-etal-presentation-200809 69/73
Cogeneration EfficiencyCogeneration Efficiencies vs Fluid )
50-50 2% Al2O3
4% Al2O3
6% Al2O3
74.50%
75.00%
75.50%
76.00%
76.50%
77.00%
77.50%
78.00%
78.50%
79.00%
79.50%
1Type of Nanofluid
C o g e n e r a t i o n
E f f i c i e n c y
50-502% Al2O34% Al2O3
6% Al2O3
Cogenration Efficiency Considering Shop Water Heat
65.65
65.7
65.75
65.8
65.85
65.9
65.95
66
66.05
66.1
66.15
1Type of Fluid
C o g e n r a t i o n E
f f i c i e n c y
[ % ]
50/50 EG/Water2%Al2O34% Al2O36% Al2O3
Using Shop Water HeatRecovery
Using Jacket WaterHeat Recovery
64

7/31/2019 Das India Kulkarni Etal Presentation 2008&09
http://slidepdf.com/reader/full/das-india-kulkarni-etal-presentation-200809 70/73
Heat Exchanger Efficiency in DEG
76.5
77
77.5
78
78.5
79
79.5
80
80.5
81
81.5
1Type of Nanofluid
H e a t
E x c a h n g e r
E f f i c i e n c y
[ % ]
50/50-EG/Water2%Al2O34% Al2O36% Al2O3
65
Conclusions

7/31/2019 Das India Kulkarni Etal Presentation 2008&09
http://slidepdf.com/reader/full/das-india-kulkarni-etal-presentation-200809 71/73
The specific heat of nanofluids decreases as nanoparticleconcentration increases. The specific heat of nanofluids
increases with temperature.
The heating time for nanofluids decreases as nanoparticlesconcentration in the base fluid increases. However, when theheat rate is quite large, the time difference for heating is veryminimal.
The cogeneration efficiency of diesel generator decreases asnanoparticle concentration increases because the specific
heat decreases as particle concentration increases.
Heat exchanger efficiency increases as particleconcentration increases because of the higher heat transfer
coefficients of nanofluids. 66
Acknowledgements
7/31/2019 Das India Kulkarni Etal Presentation 2008&09
http://slidepdf.com/reader/full/das-india-kulkarni-etal-presentation-200809 72/73
Acknowledgements
Sarah Hall, Sandra Boatwright, Kala Hansen, Eric JohansenNed Manning, Tom McCarty & Gary Porter
Financial Support: Arctic Region Supercomputing Center, UAF
Graduate School, University of Alaska Fairbanks
Department of Mechanical Engineering, UAF
Center for Nanosensor Technology (DMEA), UAF
Petroleum Development Lab, UAF
Family & Friends
67

7/31/2019 Das India Kulkarni Etal Presentation 2008&09
http://slidepdf.com/reader/full/das-india-kulkarni-etal-presentation-200809 73/73