daniel maier carvalho carlos henrique costa ribeiro · command and control (c2) systems operator....
TRANSCRIPT

Daniel Maier de CarvalhoCarlos Henrique Costa Ribeiro
IntroductionScience and Technology Department –Brazilian Army
Aeronautics Institute of Technology (ITA)Brazilian Air Force

Goal
To present a Brazilian experiment about visual automatic alerts and its effects in the
situation awareness of a net‐centric command and control (C2) systems operator.
Summary
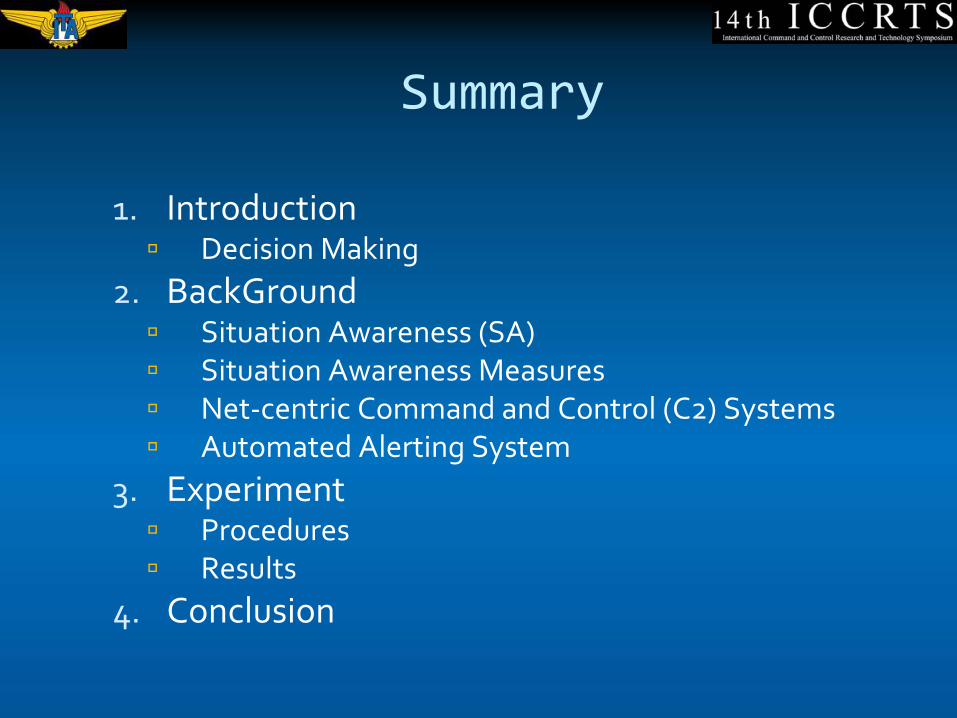
1.
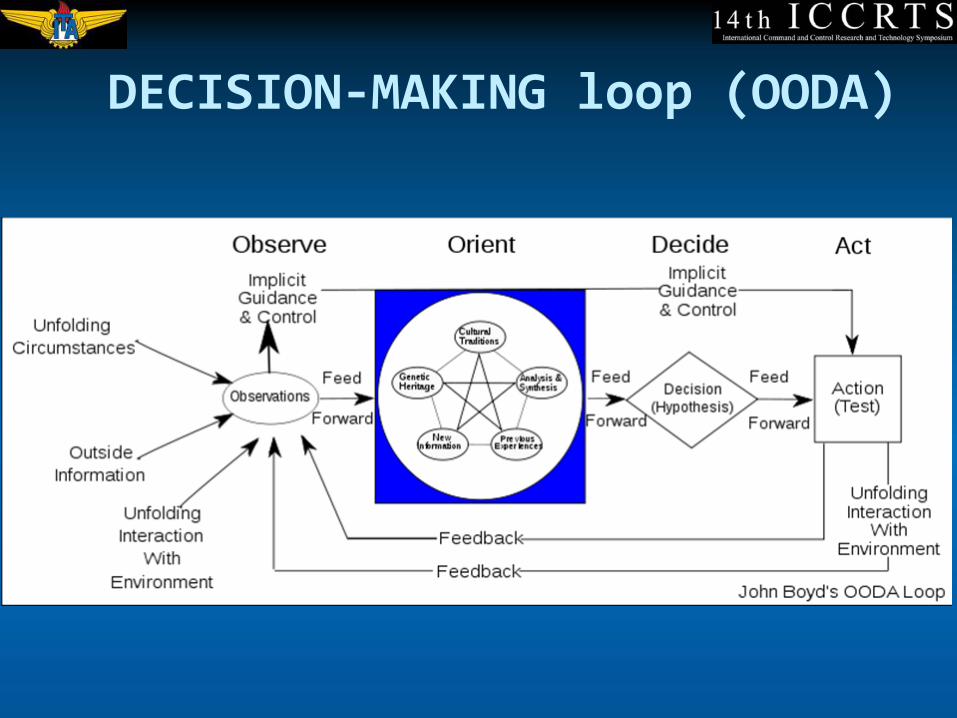
Introduction
Decision Making
2.
BackGround
Situation Awareness (SA)
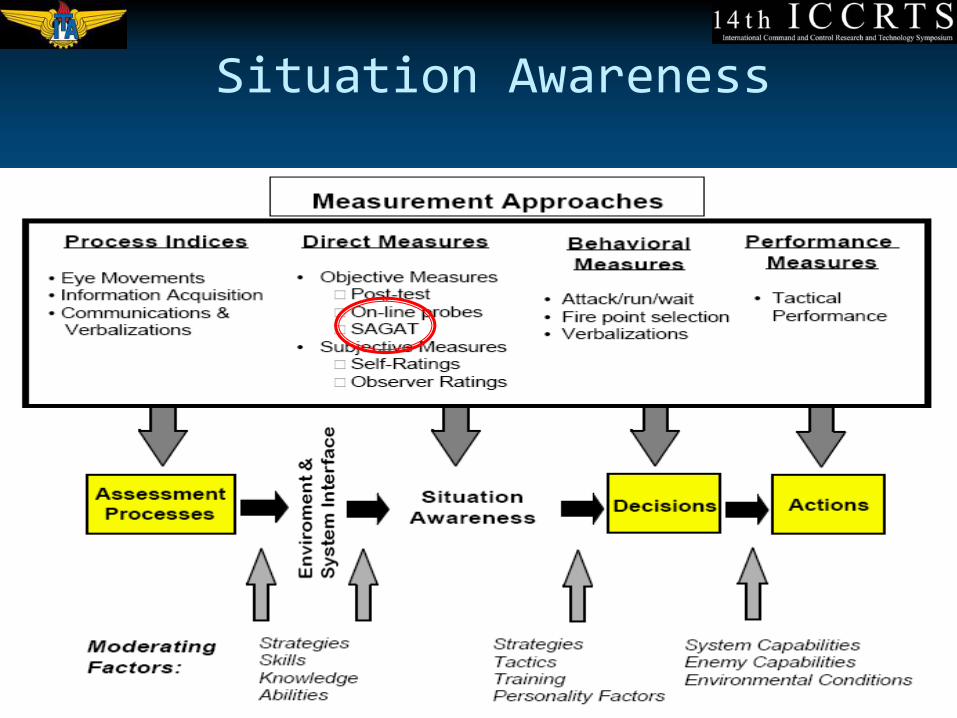
Situation Awareness Measures
Net‐centric Command and Control (C2) Systems
Automated Alerting System
3.
Experiment
Procedures
Results
4.
Conclusion
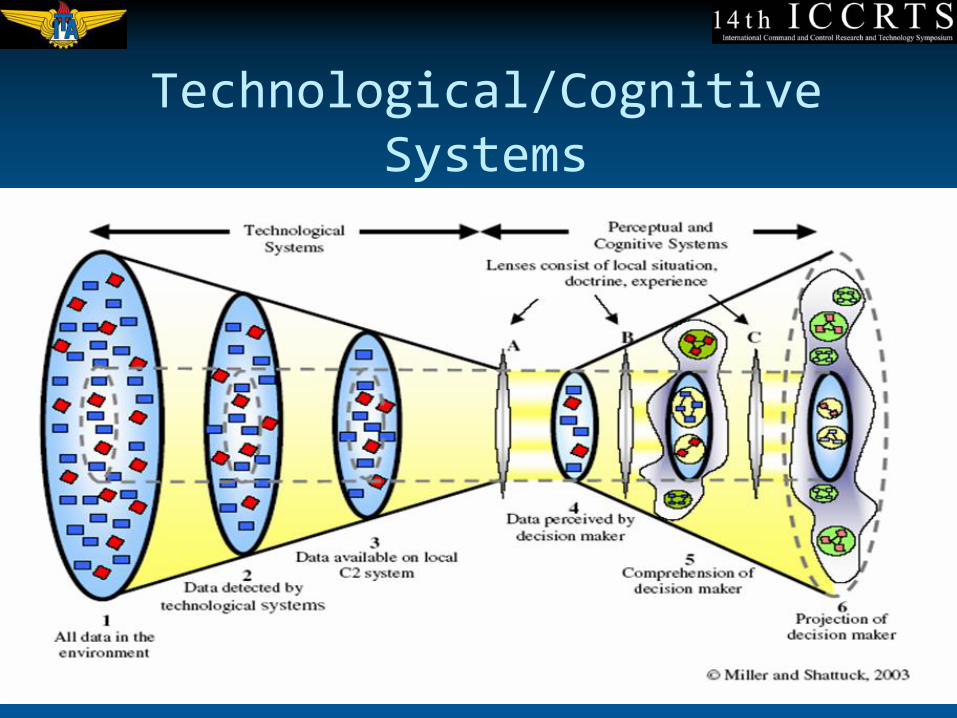
Technological/Cognitive Systems
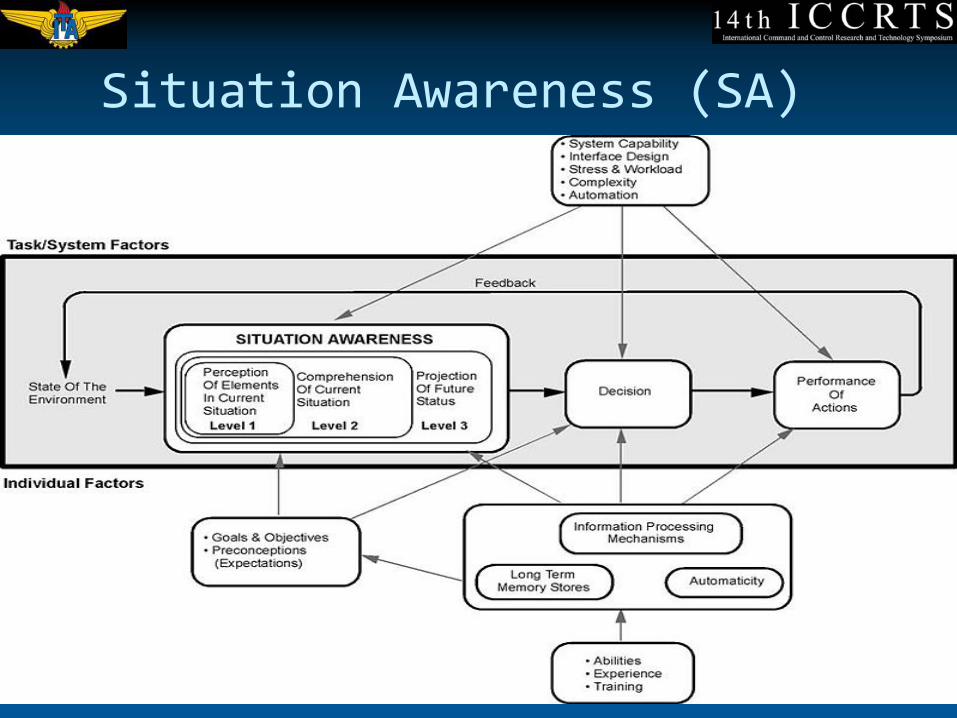
Situation Awareness (SA)
Situation Awareness
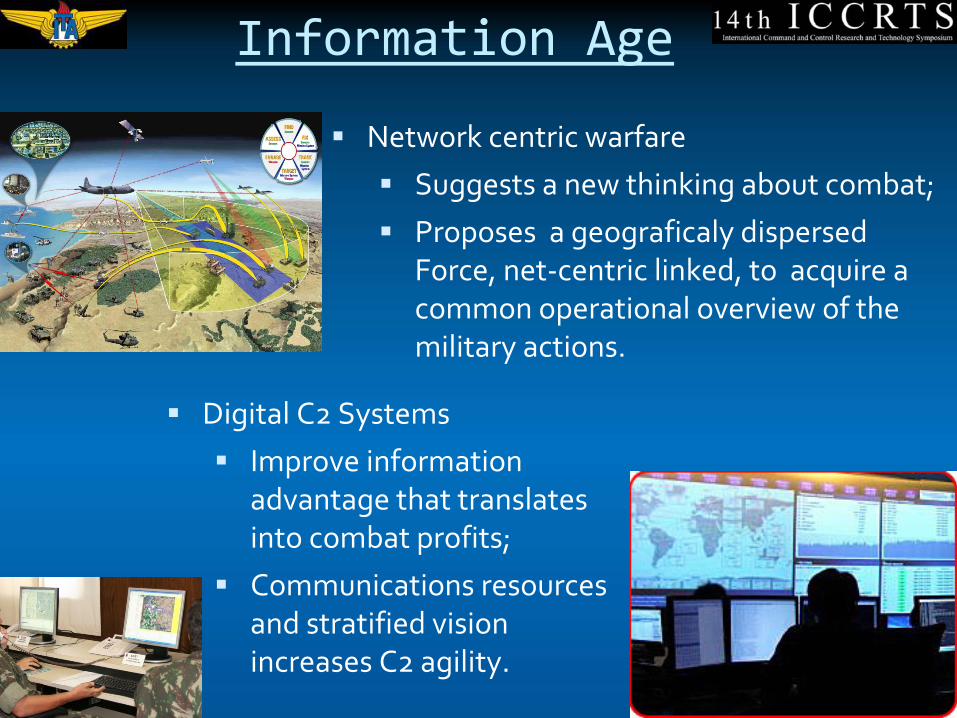
Information Age
Network centric warfare
Suggests a new thinking about combat;
Proposes a geograficaly dispersed
Force, net‐centric linked, to acquire a
common operational overview of the
military actions.
Digital C2 Systems
Improve information
advantage that translates
into combat profits;
Communications resources
and stratified vision
increases C2 agility.
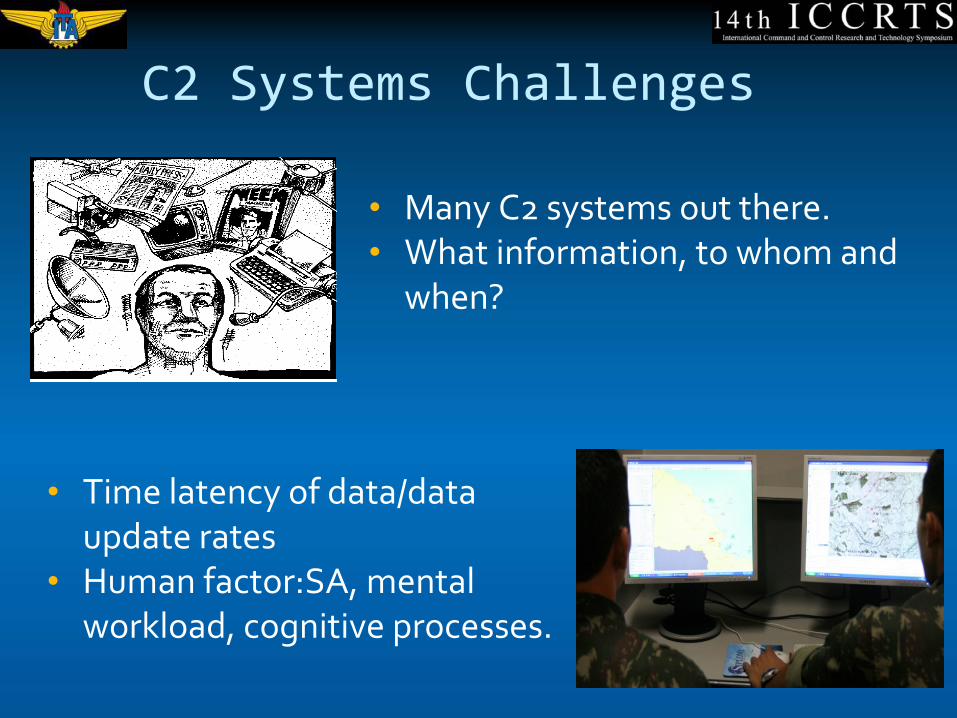
C2 Systems Challenges
•
Many C2 systems out there.•
What information, to whom and
when?
•
Time latency of data/data update rates
•
Human factor:SA, mental workload, cognitive processes.
Promissing Technology ...
a computer system to monitor the data stream and provide alerts when critical events
occur to ensure they are not missed by the operator.
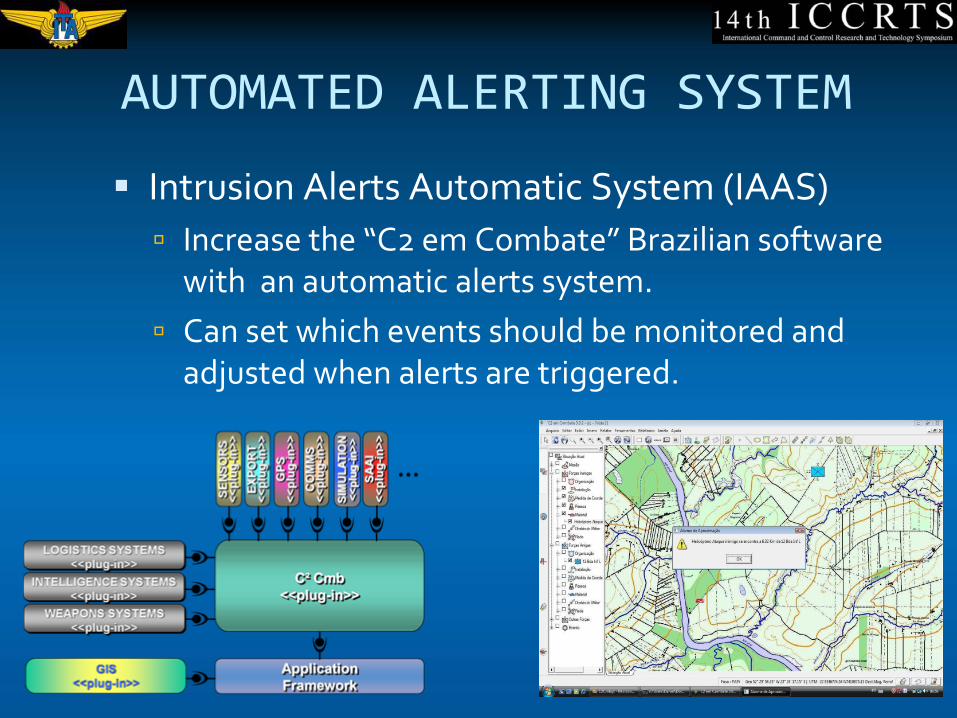
AUTOMATED ALERTING SYSTEM
Intrusion Alerts Automatic System (IAAS)
Increase the “C2 em Combate”
Brazilian software
with an automatic alerts system.
Can set which events should be monitored and
adjusted when alerts are triggered.
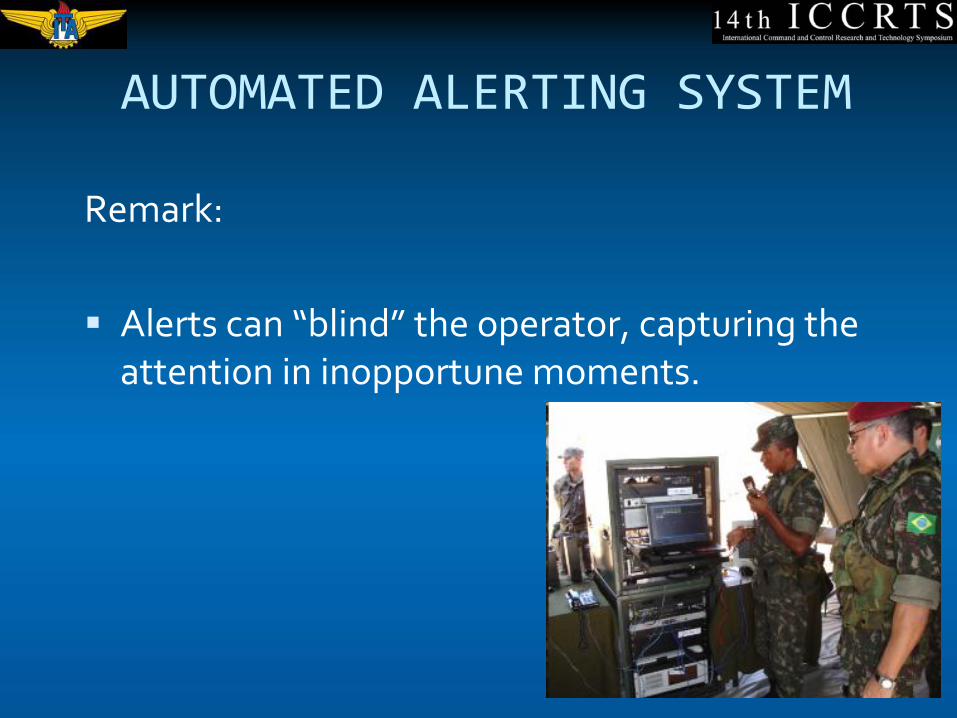
AUTOMATED ALERTING SYSTEM
Remark:
Alerts can “blind”
the operator, capturing the attention in inopportune moments.
Experiment
Issue:
How immediate feedback from an automated alerting system affects SA under changeable workload conditions?
Experiment: hypotheses
Null hypothesis: the SA is equal in both conditions of alerts (enabled or disabled).
Alternative hypothesis: the SA is different from enabled alerts to disabled alerts
The hypotheses were tested under different workload conditions.

Experiment: procedure
Participants:
fifteen Brazilian Army Infantry Soldiers.
Material:
“C2 em Combate”
software.
“IAAS”
alerts system.
SAGAT Questionnaire .
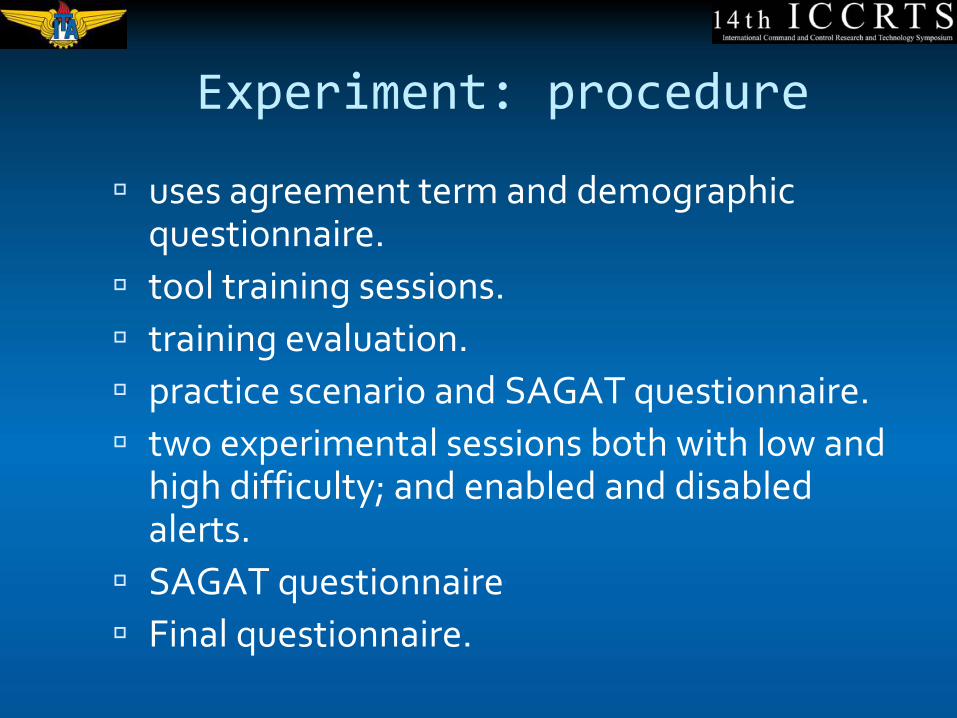
Experiment: procedure
uses agreement term and demographic questionnaire.
tool training sessions.
training evaluation.
practice scenario and SAGAT questionnaire.
two experimental sessions both with low and
high difficulty; and enabled and disabled alerts.
SAGAT questionnaire
Final questionnaire.
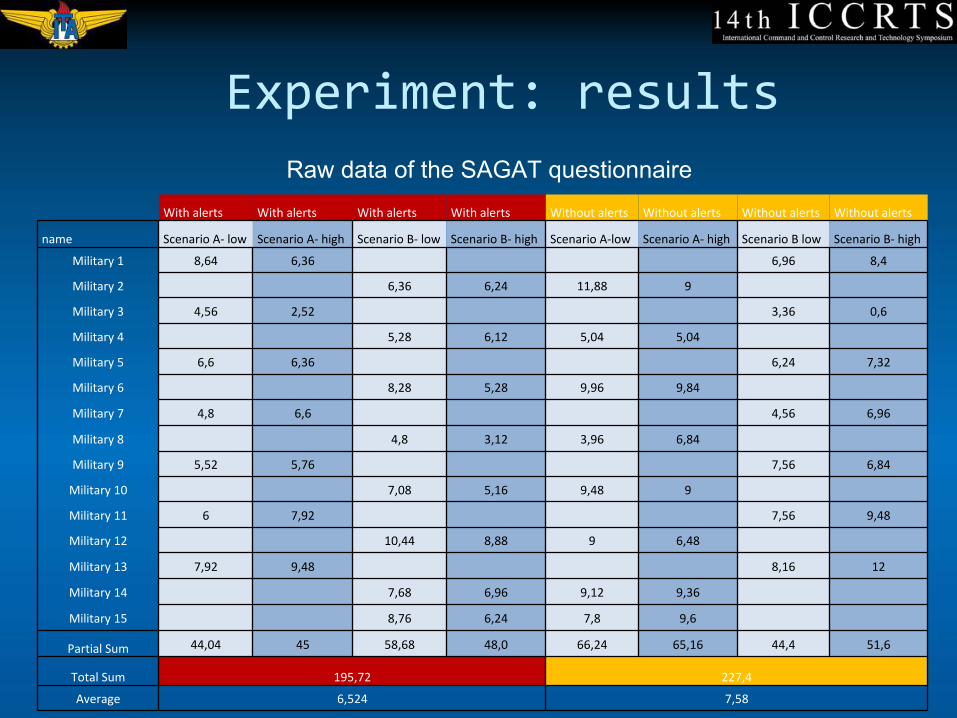
Experiment: results
With alerts With alerts With alerts With alerts Without alerts Without alerts Without alerts Without alerts
name Scenario A‐
low Scenario A‐
high Scenario B‐
low Scenario B‐
high Scenario A‐low Scenario A‐
high Scenario B low Scenario B‐
high
Military 1 8,64 6,36 6,96 8,4
Military 2 6,36 6,24 11,88 9
Military 3 4,56 2,52 3,36 0,6
Military 4 5,28 6,12 5,04 5,04
Military 5 6,6 6,36 6,24 7,32
Military 6 8,28 5,28 9,96 9,84
Military 7 4,8 6,6 4,56 6,96
Military 8 4,8 3,12 3,96 6,84
Military 9 5,52 5,76 7,56 6,84
Military 10 7,08 5,16 9,48 9
Military 11 6 7,92 7,56 9,48
Military 12 10,44 8,88 9 6,48
Military 13 7,92 9,48 8,16 12
Military 14 7,68 6,96 9,12 9,36
Military 15 8,76 6,24 7,8 9,6
Partial Sum 44,04 45 58,68 48,0 66,24 65,16 44,4 51,6
Total Sum 195,72 227,4
Average 6,524 7,58
Raw data of the SAGAT questionnaire
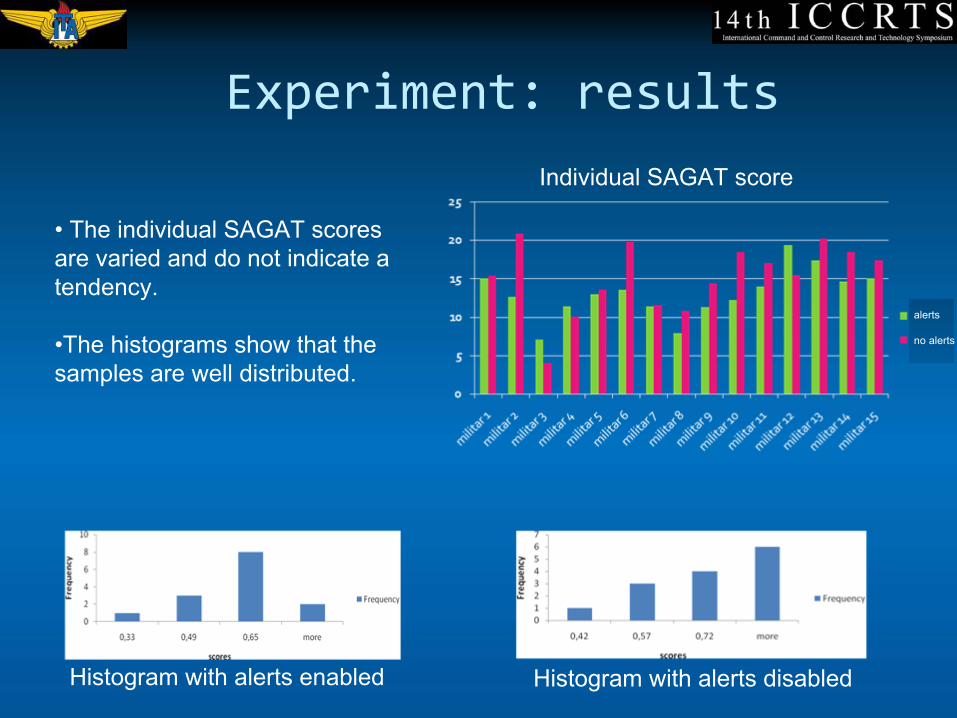
Experiment: resultsIndividual SAGAT score
•
The individual SAGAT scores are varied and do not indicate a tendency.
•The histograms show that the samples are well distributed.
Histogram with alerts enabled Histogram with alerts disabled
alerts
no alerts
Experiment: results
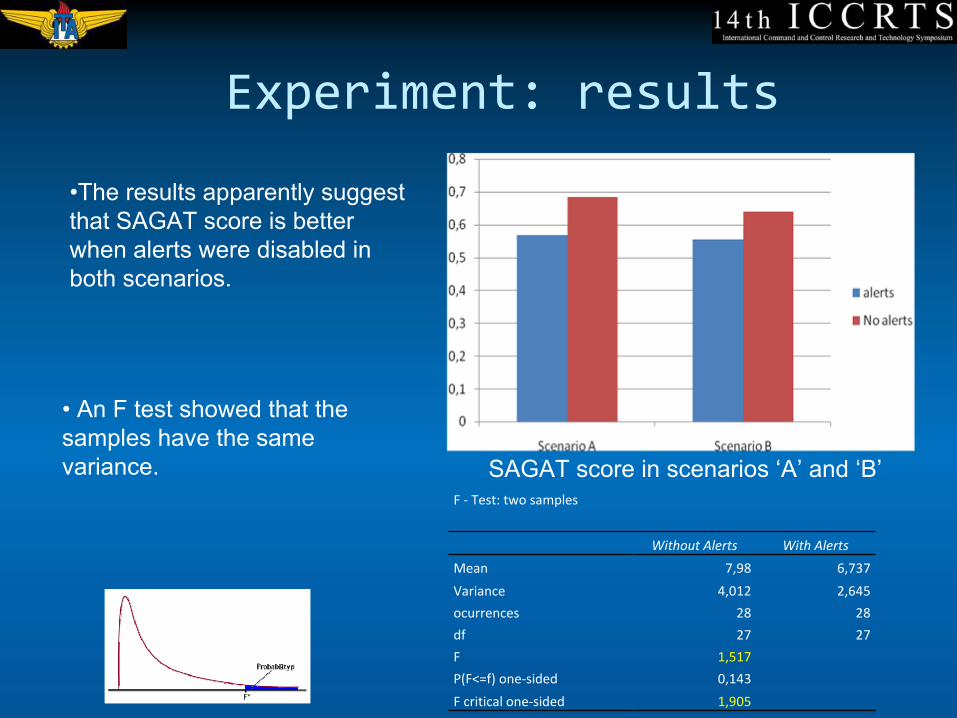
•The results apparently suggest that SAGAT score is better when alerts were disabled in both scenarios.
SAGAT score in scenarios ‘A’
and ‘B’F ‐
Test: two samples
Without Alerts With Alerts
Mean 7,98 6,737
Variance 4,012 2,645
ocurrences 28 28
df 27 27
F 1,517
P(F<=f) one‐sided 0,143
F critical one‐sided 1,905
•
An F test showed that the samples have the same variance.
Experiment: results
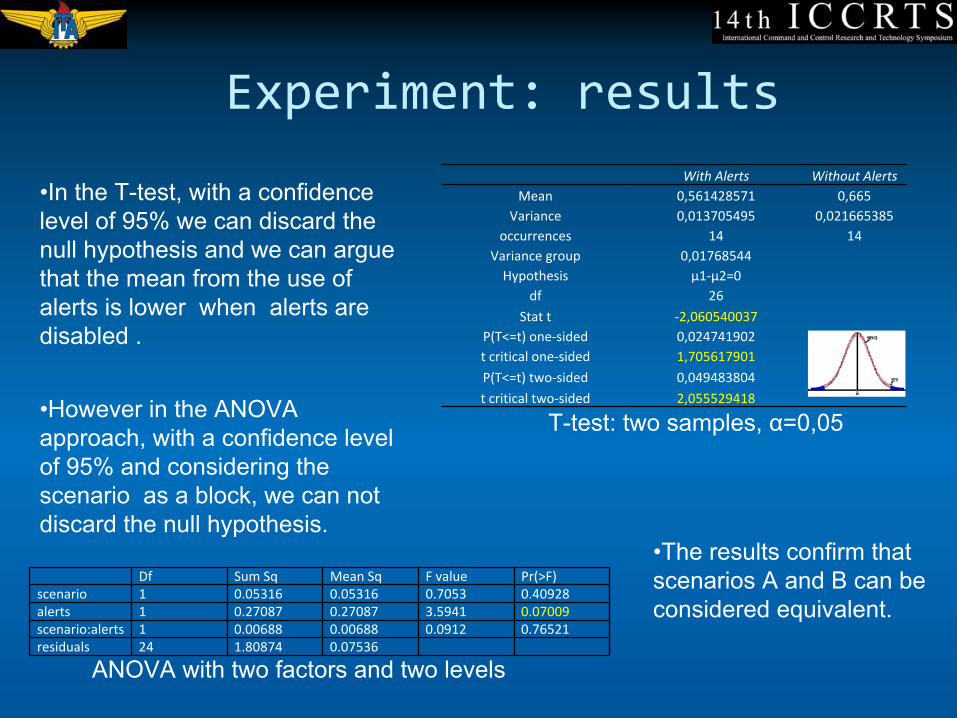
•In the T-test, with a confidence level of 95% we can discard the null hypothesis and we can argue that the mean from the use of alerts is lower when alerts are disabled .
With Alerts Without AlertsMean 0,561428571 0,665
Variance 0,013705495 0,021665385occurrences 14 14
Variance group 0,01768544Hypothesis µ1‐µ2=0
df 26Stat t ‐2,060540037
P(T<=t) one‐sided 0,024741902t critical one‐sided 1,705617901
P(T<=t) two‐sided 0,049483804t critical two‐sided 2,055529418
Df Sum Sq Mean Sq F value Pr(>F)scenario 1 0.05316 0.05316 0.7053 0.40928alerts 1 0.27087 0.27087 3.5941 0.07009scenario:alerts 1 0.00688 0.00688 0.0912 0.76521 residuals 24 1.80874 0.07536
ANOVA with two factors and two levels
T-test: two samples, α=0,05
•The results confirm that scenarios A and B can be considered equivalent.
•However in the ANOVA approach, with a confidence level of 95% and considering the scenario as a block, we can not discard the null hypothesis.
Experiment: results
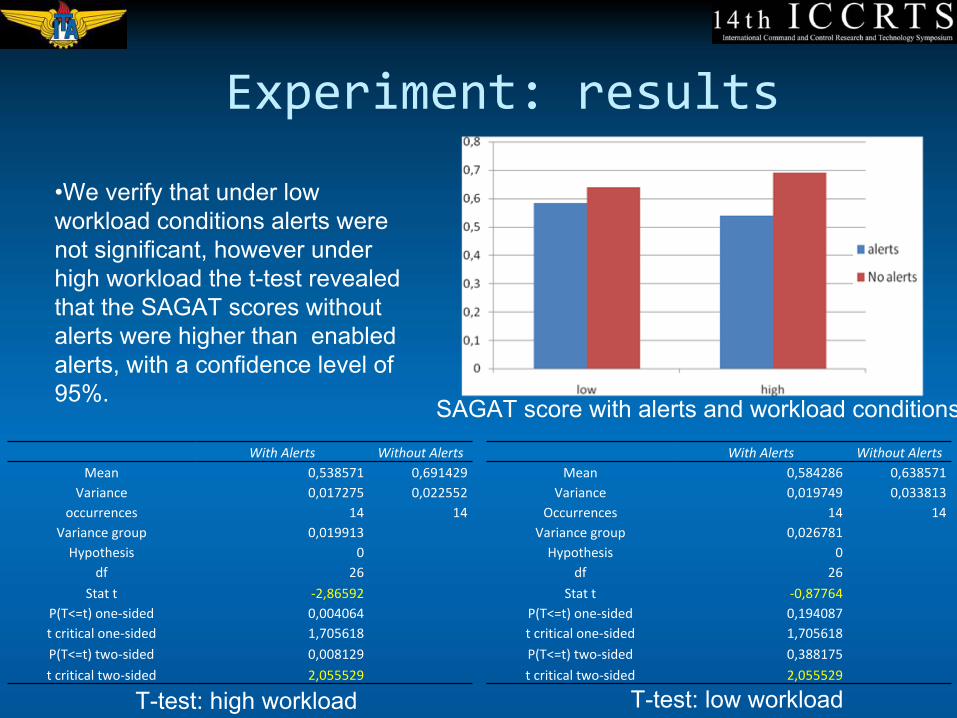
•We verify that under low workload conditions alerts were not significant, however under high workload the t-test revealed that the SAGAT scores without alerts were higher than enabled alerts, with a confidence level of 95%. SAGAT score with alerts and workload conditions
With Alerts Without AlertsMean 0,538571 0,691429
Variance 0,017275 0,022552occurrences 14 14
Variance group 0,019913Hypothesis 0
df 26
Stat t ‐2,86592P(T<=t) one‐sided 0,004064t critical one‐sided 1,705618P(T<=t) two‐sided 0,008129
t critical two‐sided 2,055529
With Alerts Without AlertsMean 0,584286 0,638571
Variance 0,019749 0,033813Occurrences 14 14
Variance group 0,026781Hypothesis 0
df 26
Stat t ‐0,87764P(T<=t) one‐sided 0,194087t critical one‐sided 1,705618P(T<=t) two‐sided 0,388175
t critical two‐sided 2,055529
T-test: low workloadT-test: high workload
Experiment: results
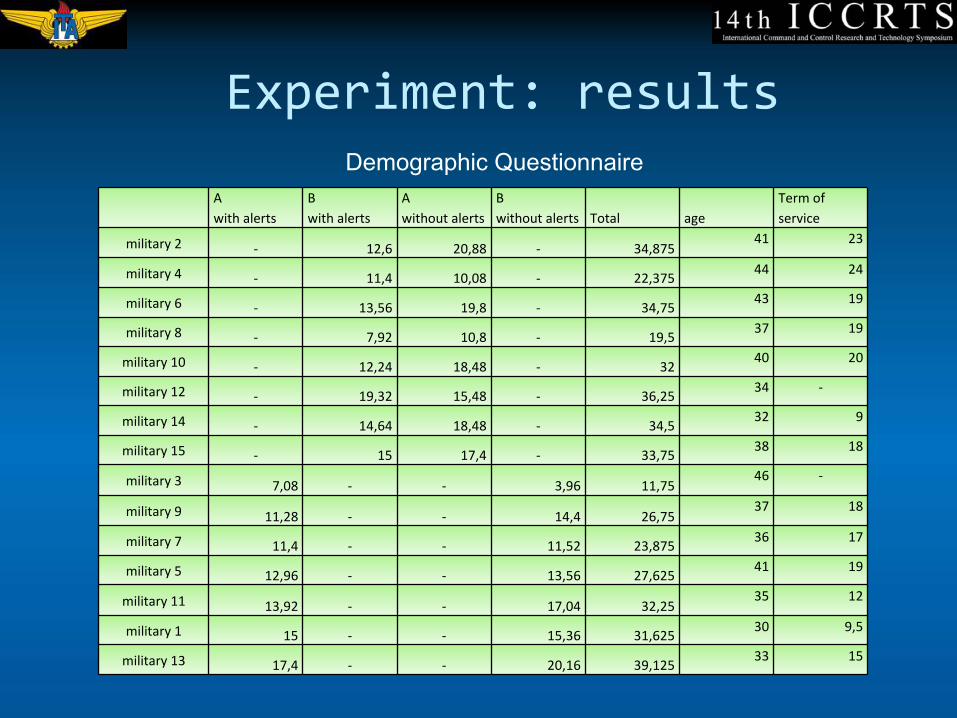
A
with alertsB
with alertsA
without alertsB
without alerts Total ageTerm of
service
military 2 ‐ 12,6 20,88 ‐ 34,87541 23
military 4 ‐ 11,4 10,08 ‐ 22,37544 24
military 6 ‐ 13,56 19,8 ‐ 34,7543 19
military 8 ‐ 7,92 10,8 ‐ 19,537 19
military 10 ‐ 12,24 18,48 ‐ 3240 20
military 12 ‐ 19,32 15,48 ‐ 36,2534 ‐
military 14 ‐ 14,64 18,48 ‐ 34,532 9
military 15 ‐ 15 17,4 ‐ 33,7538 18
military 3 7,08 ‐ ‐ 3,96 11,7546 ‐
military 9 11,28 ‐ ‐ 14,4 26,7537 18
military 7 11,4 ‐ ‐ 11,52 23,87536 17
military 5 12,96 ‐ ‐ 13,56 27,62541 19
military 11 13,92 ‐ ‐ 17,04 32,2535 12
military 1 15 ‐ ‐ 15,36 31,62530 9,5
military 13 17,4 ‐ ‐ 20,16 39,12533 15
Demographic Questionnaire
Experiment: results
The results indicated that alerts did not affect SA as a whole, but under high workload
conditions these alerts decreased the SA.
Alerts sometimes confuse the monitoring of the
situation and distract the operator. Once an alert appears, the operator concentrate on it and temporarily loses the overview.
Curiously, most of the operators reported that the alerts system influenced their performance in a positive way.
Conclusion
The results suggest that automated alerting systems diminish the SA in high levels of
workload.
This result should not necessarily be interpreted as a suggestion of not using
alerts, rather than, attention should be given to the relationship between workload and
the use of alerts in order to not disturbing agility.
Conclusion