dallas dart tod presentation
TRANSCRIPT

DALLAS AREA’S RAPID TRANSIT
ORIENTED DEVELOPMENT:LIGHT RAIL
By: Andrew Pagano

OUTLINE
• System overview
• What is TOD?
• Analysis Methods
• 2003 Study
• 2014 Study
• Regional Projects
• Conclusions
& Recommendations

DALLAS &
REGION
METRO City
Pop: 6.9 Mil Pop: 1.2 Mil
Density: 634/sq. mi. Density: 3,645/sq.mi.
Area: 9,286 sq. mi Area: 385.8 sq. mi.
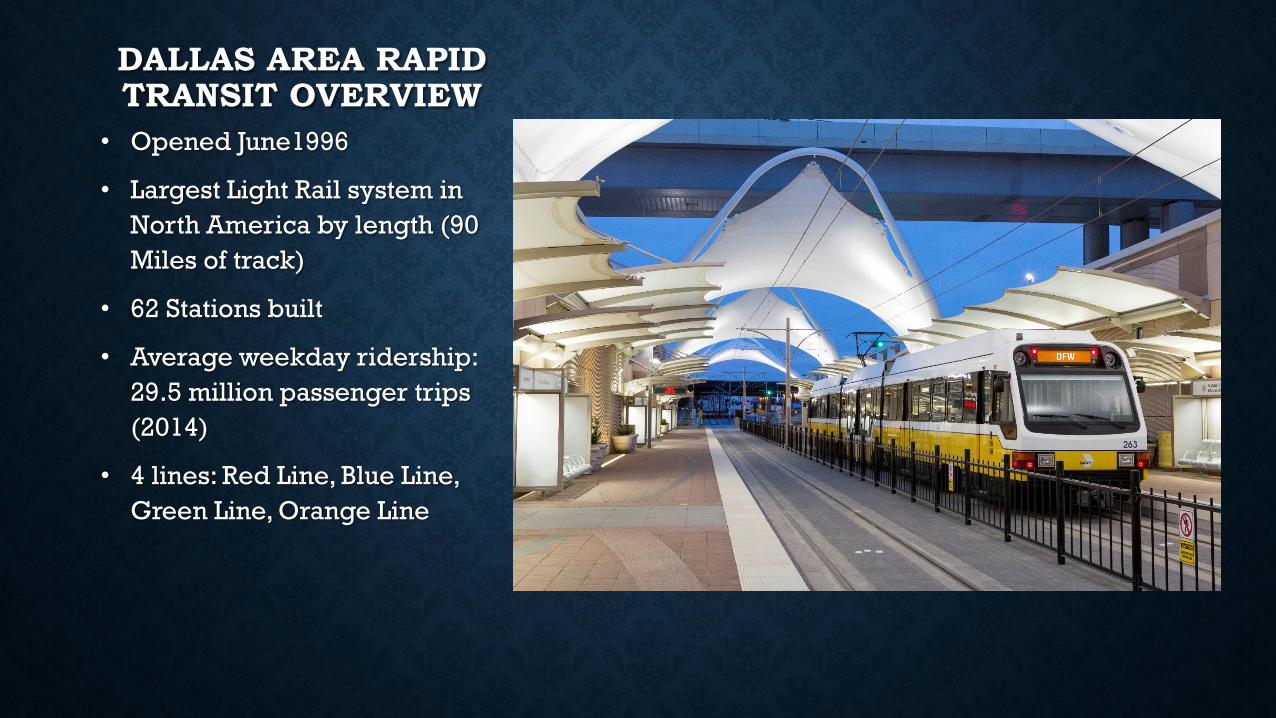
DALLAS AREA RAPID TRANSIT OVERVIEW
• Opened June1996
• Largest Light Rail system in
North America by length (90
Miles of track)
• 62 Stations built
• Average weekday ridership:
29.5 million passenger trips
(2014)
• 4 lines: Red Line, Blue Line,
Green Line, Orange Line
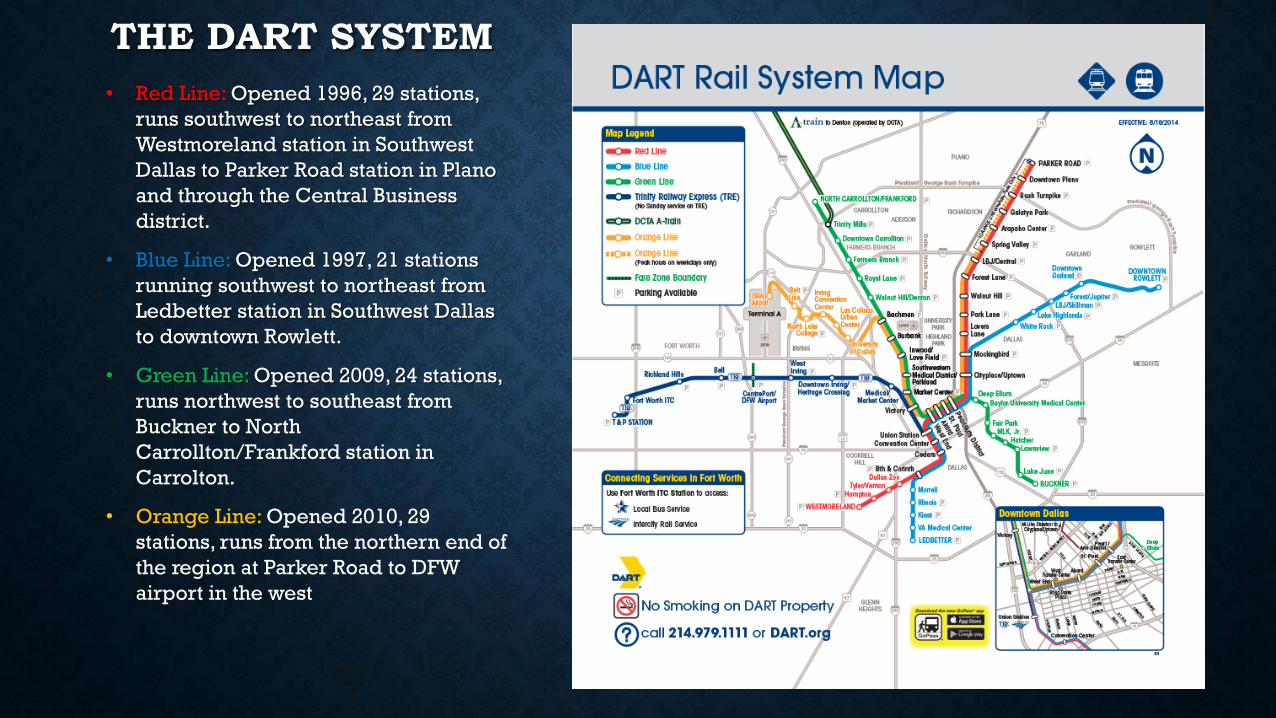
THE DART SYSTEM
• Red Line: Opened 1996, 29 stations,
runs southwest to northeast from
Westmoreland station in Southwest
Dallas to Parker Road station in Plano
and through the Central Business
district.
• Blue Line: Opened 1997, 21 stations
running southwest to northeast from
Ledbetter station in Southwest Dallas
to downtown Rowlett.
• Green Line: Opened 2009, 24 stations,
runs northwest to southeast from
Buckner to North
Carrollton/Frankford station in
Carrolton.
• Orange Line: Opened 2010, 29
stations, runs from the northern end of
the region at Parker Road to DFW
airport in the west

WHAT IS TRANSIT-ORIENTED
DEVELOPMENT
• TOD: commonly defined as high-
density, mixed-use development
within walking distance (a 1/2 mile)
of a transit station.
• Provides a range of benefits
including increased transit ridership,
reduced regional congestion and
pollution, and healthier, more
walkable neighborhoods.
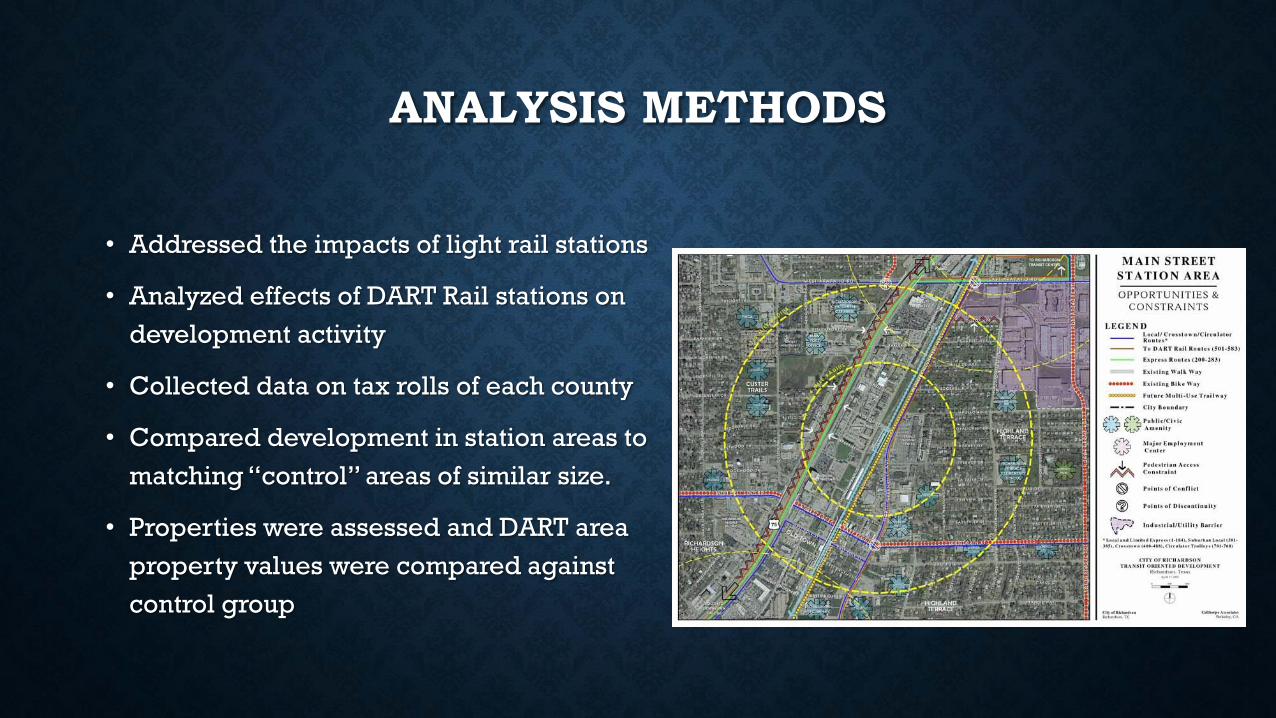
ANALYSIS METHODS
• Addressed the impacts of light rail stations
• Analyzed effects of DART Rail stations on
development activity
• Collected data on tax rolls of each county
• Compared development in station areas to
matching “control” areas of similar size.
• Properties were assessed and DART area
property values were compared against
control group
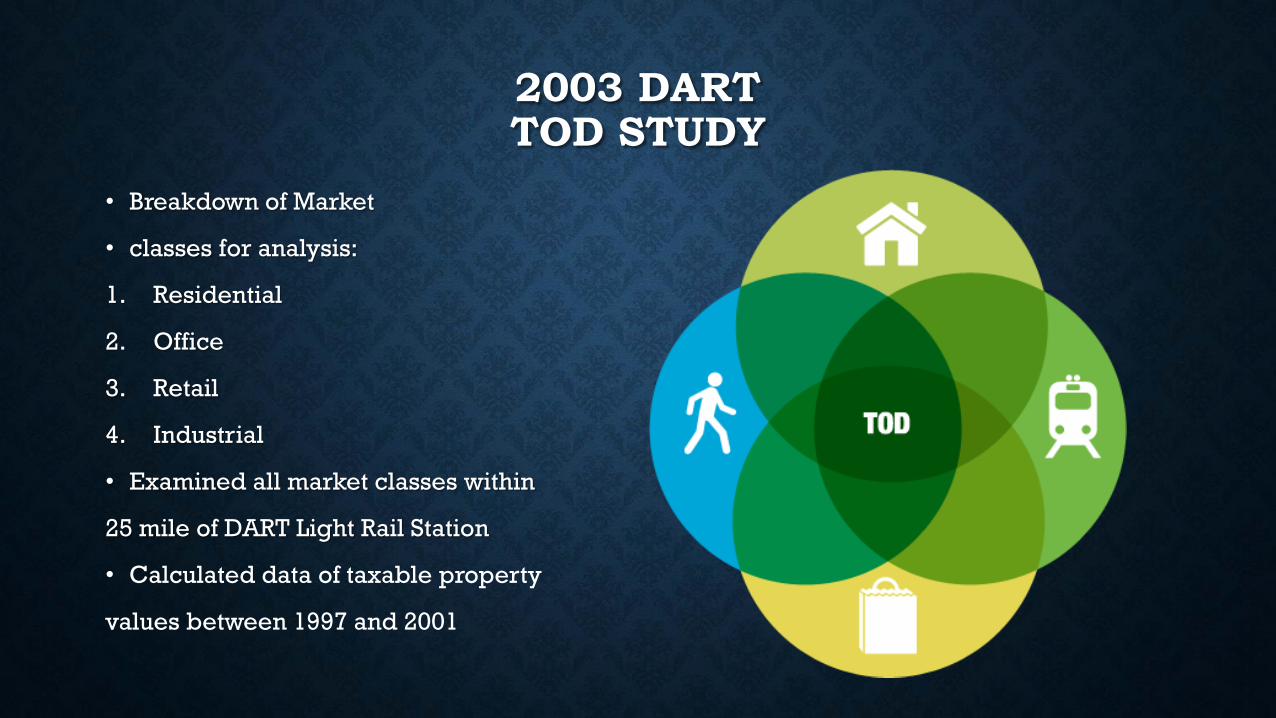
2003 DART TOD STUDY
• Breakdown of Market
• classes for analysis:
1. Residential
2. Office
3. Retail
4. Industrial
• Examined all market classes within
25 mile of DART Light Rail Station
• Calculated data of taxable property
values between 1997 and 2001
2003 DART TOD STUDY
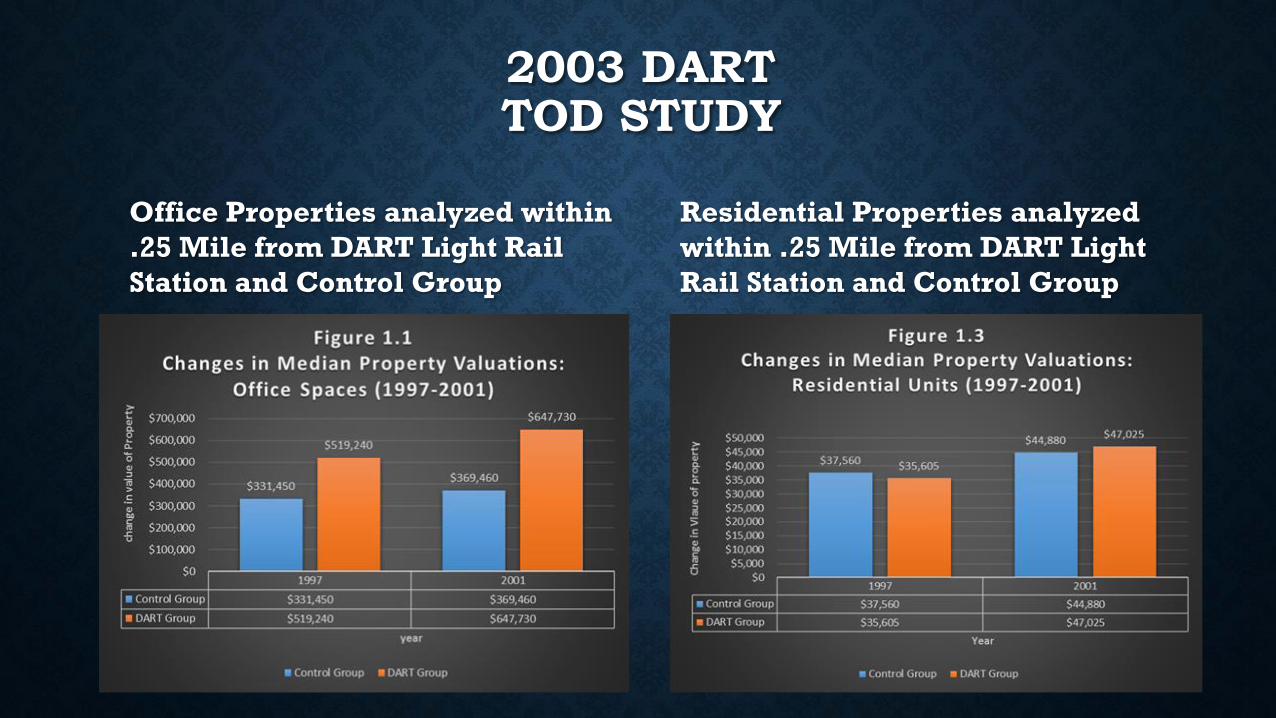
Office Properties analyzed within
.25 Mile from DART Light Rail
Station and Control Group
Residential Properties analyzed
within .25 Mile from DART Light
Rail Station and Control Group
2003 DART TOD STUDY
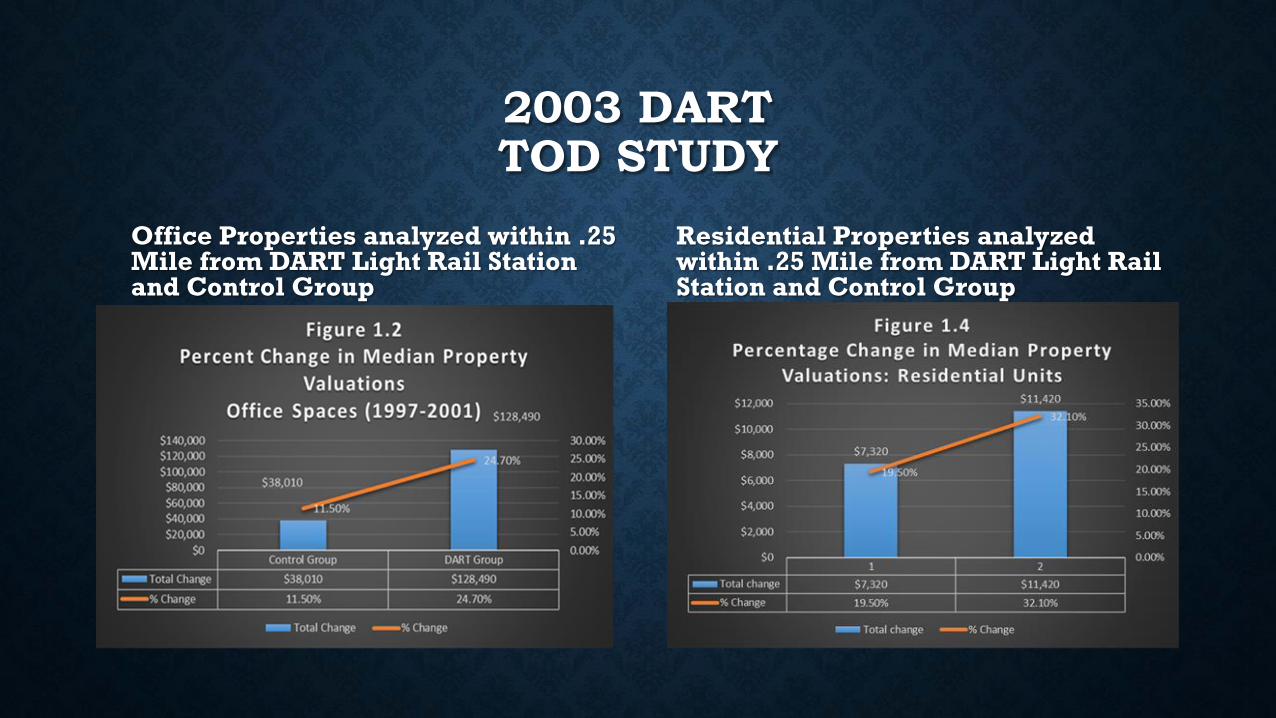
Office Properties analyzed within .25 Mile from DART Light Rail Station and Control Group
Residential Properties analyzed within .25 Mile from DART Light Rail Station and Control Group
2003 DART TOD STUDY
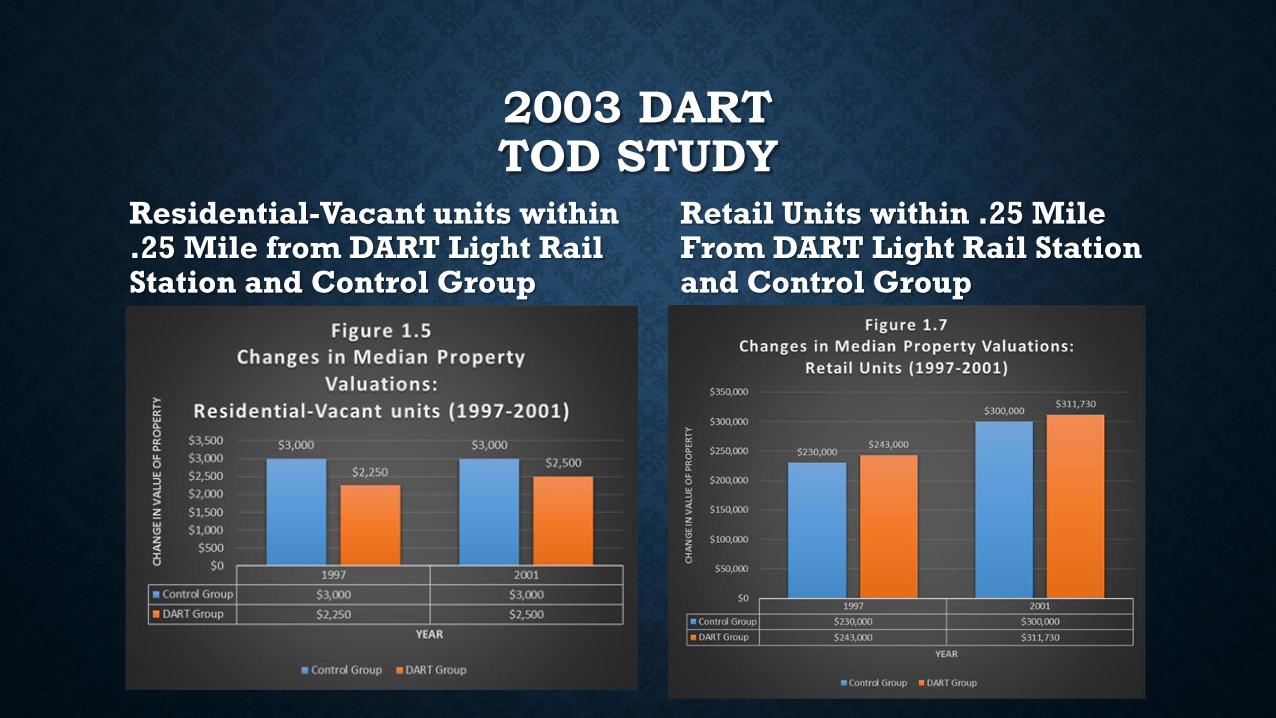
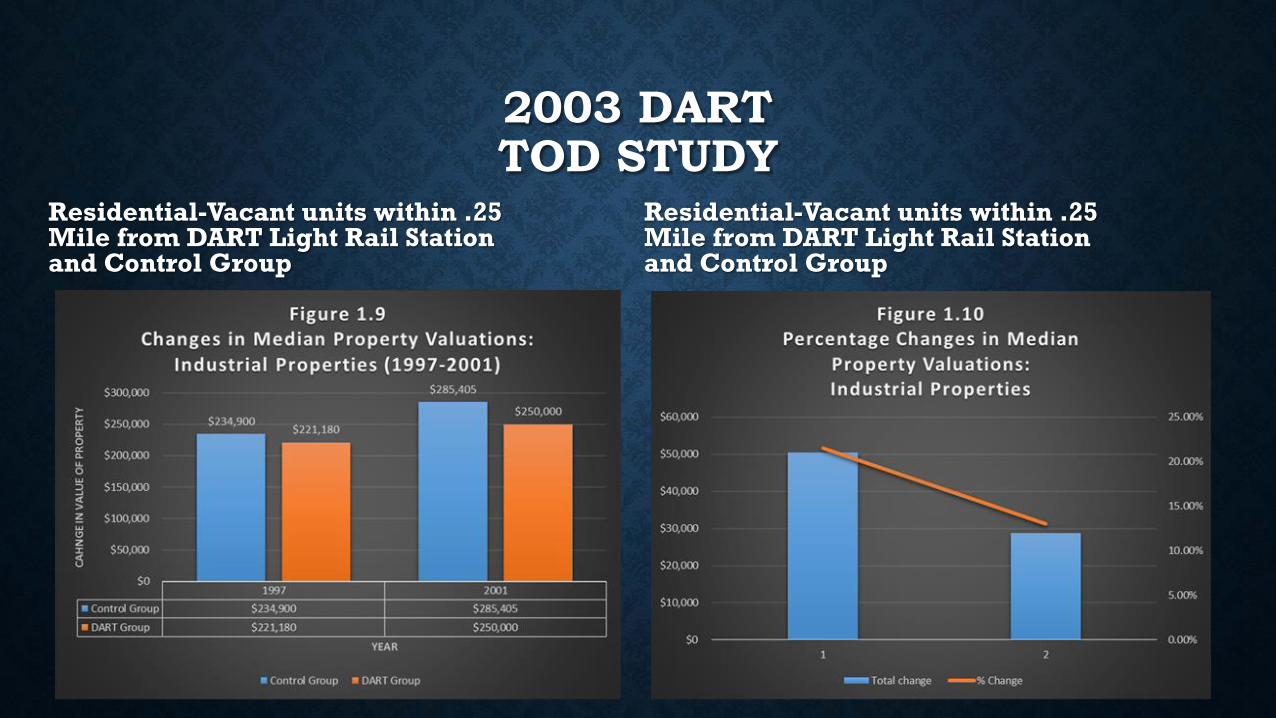
Residential-Vacant units within .25 Mile from DART Light Rail Station and Control Group
Retail Units within .25 Mile From DART Light Rail Station and Control Group
2003 DART TOD STUDY
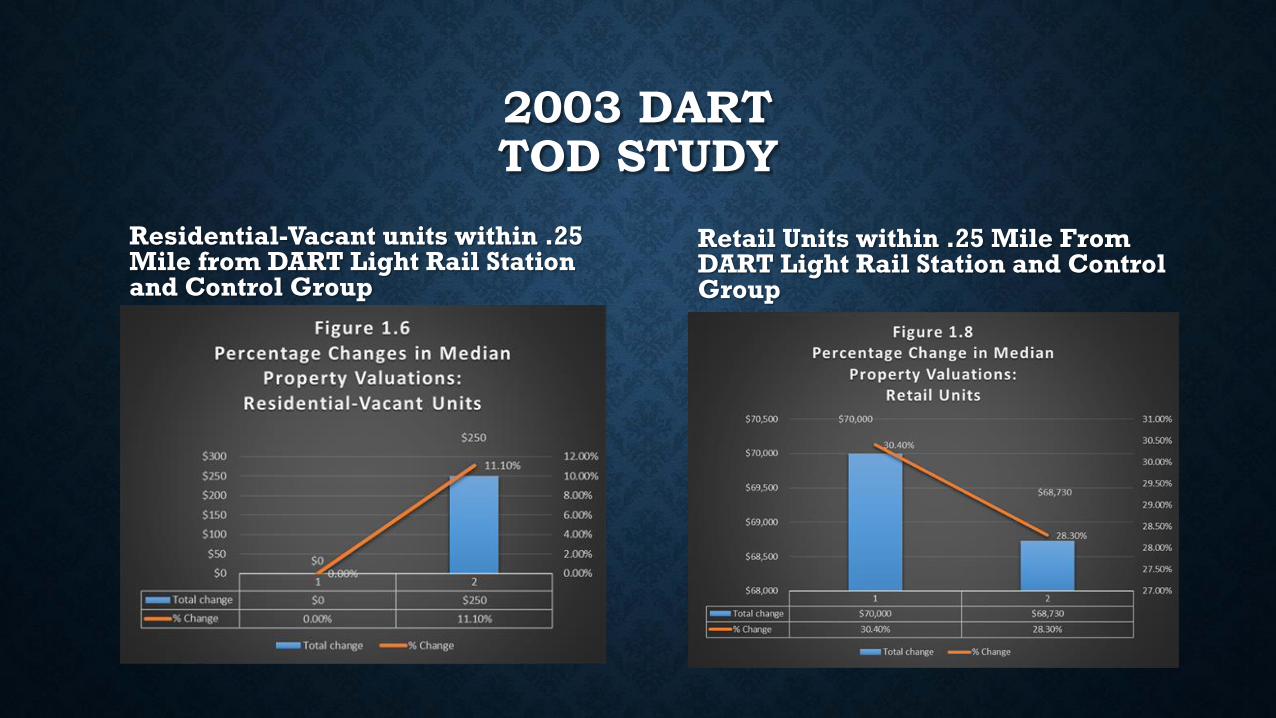
Residential-Vacant units within .25 Mile from DART Light Rail Station and Control Group
Retail Units within .25 Mile From DART Light Rail Station and Control Group
2003 DART TOD STUDY
Residential-Vacant units within .25 Mile from DART Light Rail Station and Control Group
Residential-Vacant units within .25 Mile from DART Light Rail Station and Control Group
2003 DART TOD STUDY
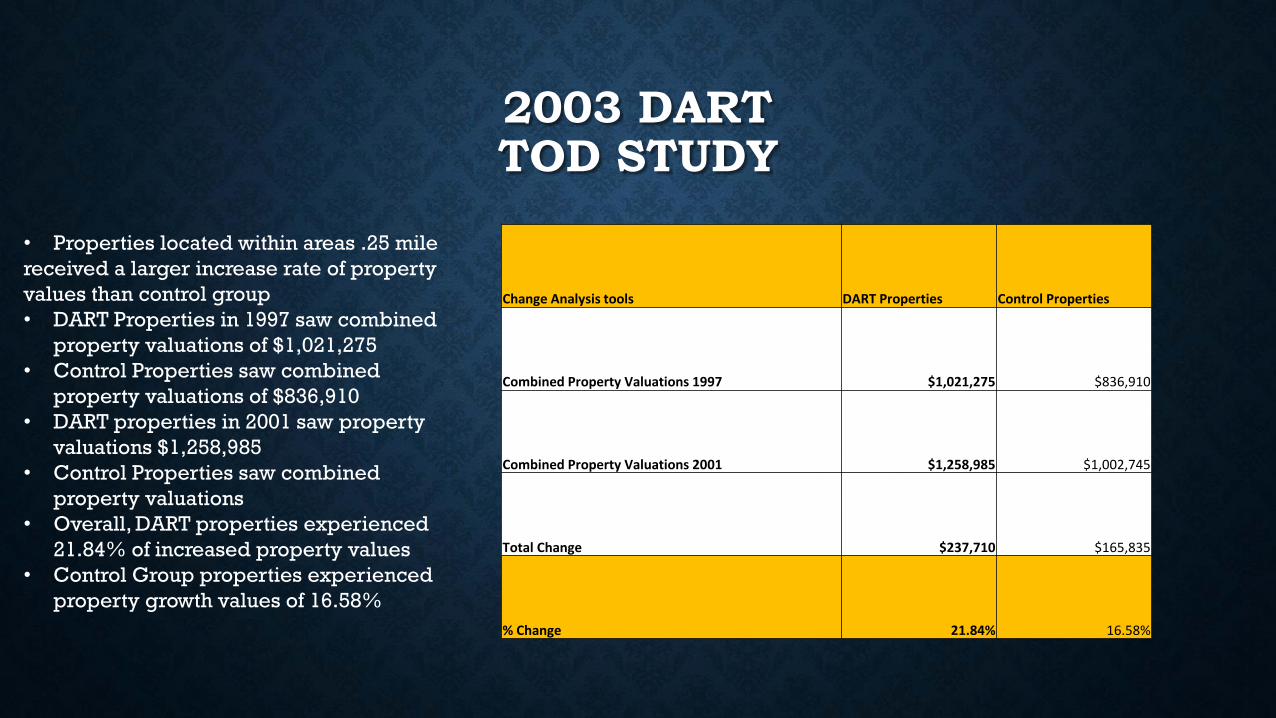
Change Analysis tools DART Properties Control Properties
Combined Property Valuations 1997 $1,021,275 $836,910
Combined Property Valuations 2001 $1,258,985 $1,002,745
Total Change $237,710 $165,835
% Change 21.84% 16.58%
• Properties located within areas .25 mile
received a larger increase rate of property
values than control group
• DART Properties in 1997 saw combined
property valuations of $1,021,275
• Control Properties saw combined
property valuations of $836,910
• DART properties in 2001 saw property
valuations $1,258,985
• Control Properties saw combined
property valuations
• Overall, DART properties experienced
21.84% of increased property values
• Control Group properties experienced
property growth values of 16.58%
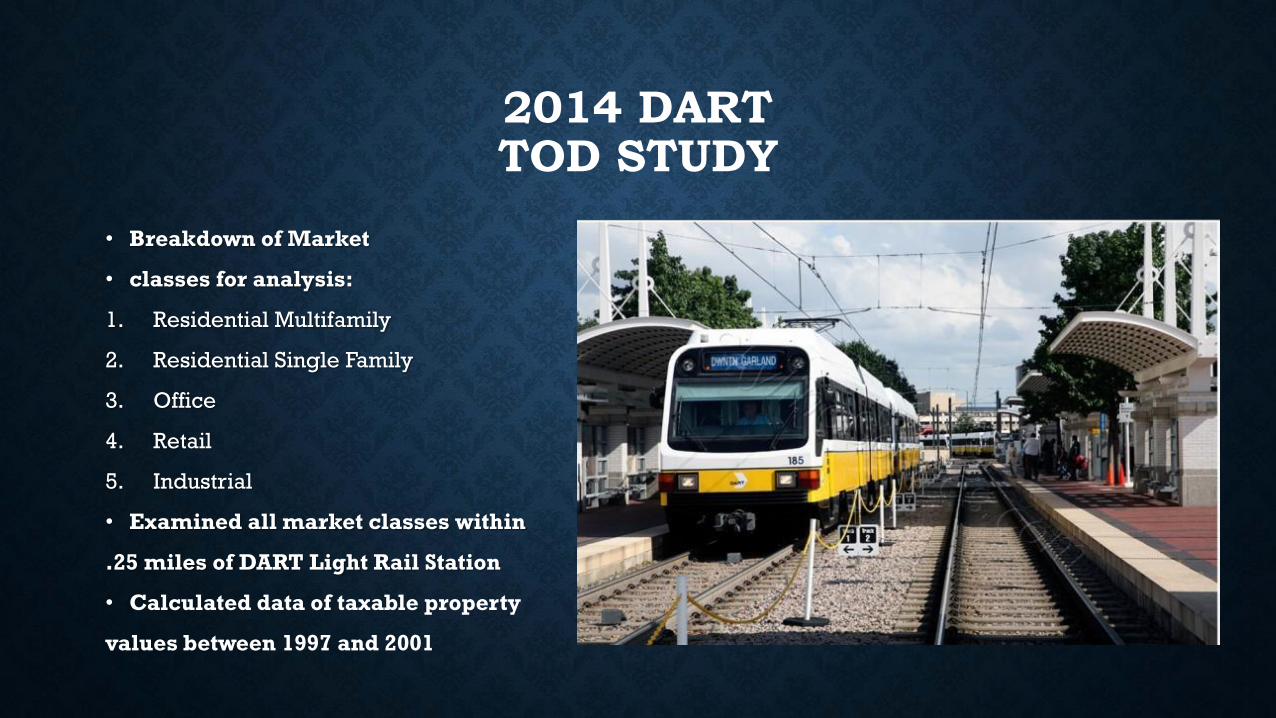
2014 DARTTOD STUDY
• Breakdown of Market
• classes for analysis:
1. Residential Multifamily
2. Residential Single Family
3. Office
4. Retail
5. Industrial
• Examined all market classes within
.25 miles of DART Light Rail Station
• Calculated data of taxable property
values between 1997 and 2001
2014 DARTTOD STUDY
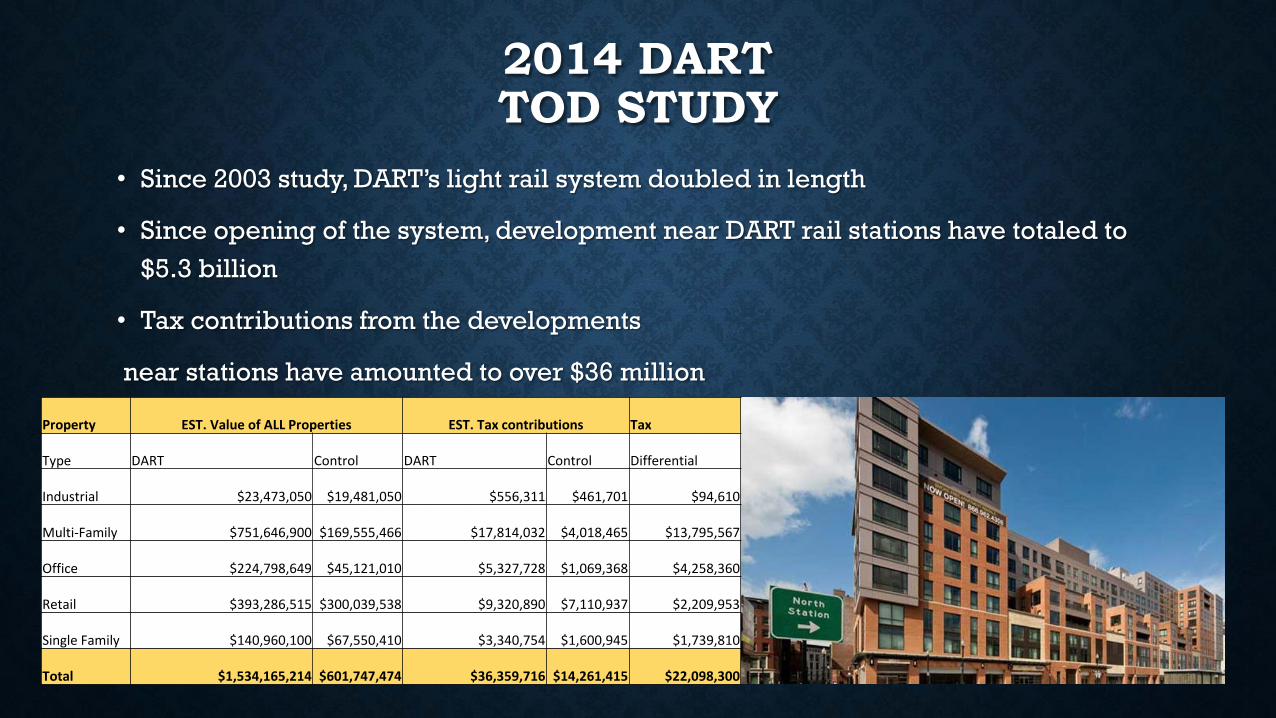
• Since 2003 study, DART’s light rail system doubled in length
• Since opening of the system, development near DART rail stations have totaled to
$5.3 billion
• Tax contributions from the developments
near stations have amounted to over $36 million
Property EST. Value of ALL Properties EST. Tax contributions Tax
Type DART Control DART Control Differential
Industrial $23,473,050 $19,481,050 $556,311 $461,701 $94,610
Multi-Family $751,646,900 $169,555,466 $17,814,032 $4,018,465 $13,795,567
Office $224,798,649 $45,121,010 $5,327,728 $1,069,368 $4,258,360
Retail $393,286,515 $300,039,538 $9,320,890 $7,110,937 $2,209,953
Single Family $140,960,100 $67,550,410 $3,340,754 $1,600,945 $1,739,810
Total $1,534,165,214 $601,747,474 $36,359,716 $14,261,415 $22,098,300
2014 DARTTOD STUDY
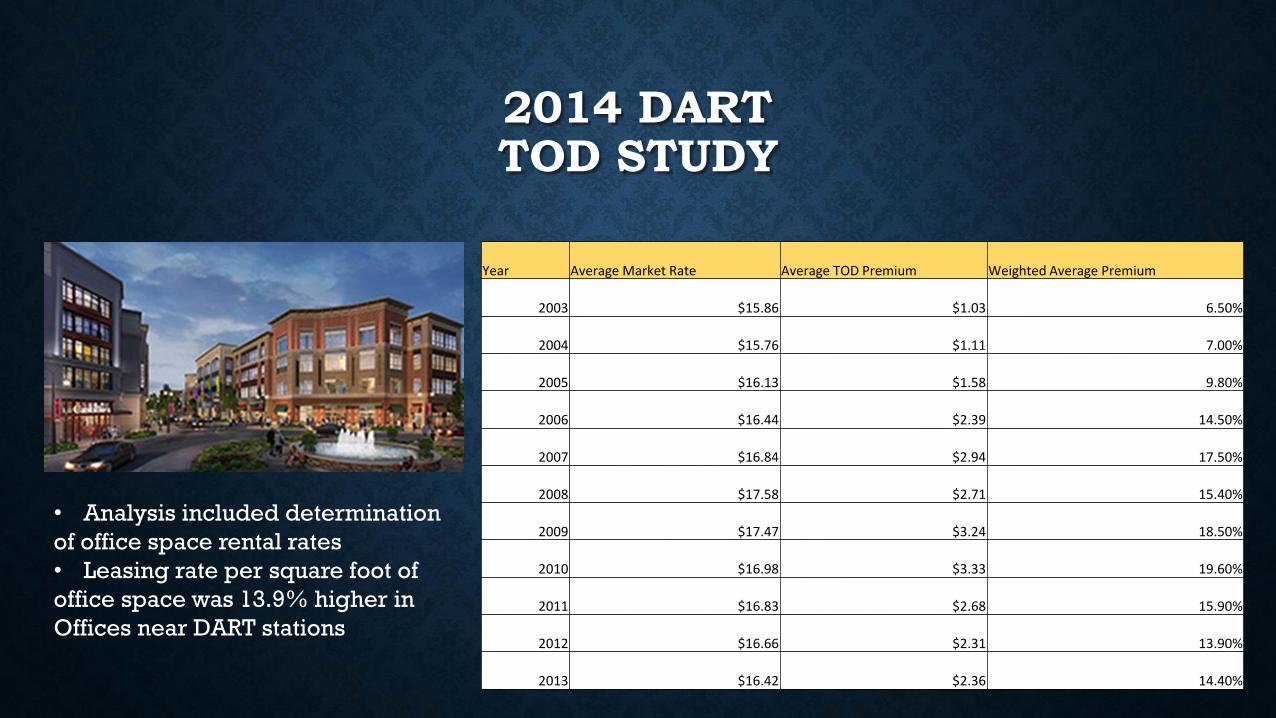
Year Average Market Rate Average TOD Premium Weighted Average Premium
2003 $15.86 $1.03 6.50%
2004 $15.76 $1.11 7.00%
2005 $16.13 $1.58 9.80%
2006 $16.44 $2.39 14.50%
2007 $16.84 $2.94 17.50%
2008 $17.58 $2.71 15.40%
2009 $17.47 $3.24 18.50%
2010 $16.98 $3.33 19.60%
2011 $16.83 $2.68 15.90%
2012 $16.66 $2.31 13.90%
2013 $16.42 $2.36 14.40%
• Analysis included determination
of office space rental rates
• Leasing rate per square foot of
office space was 13.9% higher in
Offices near DART stations
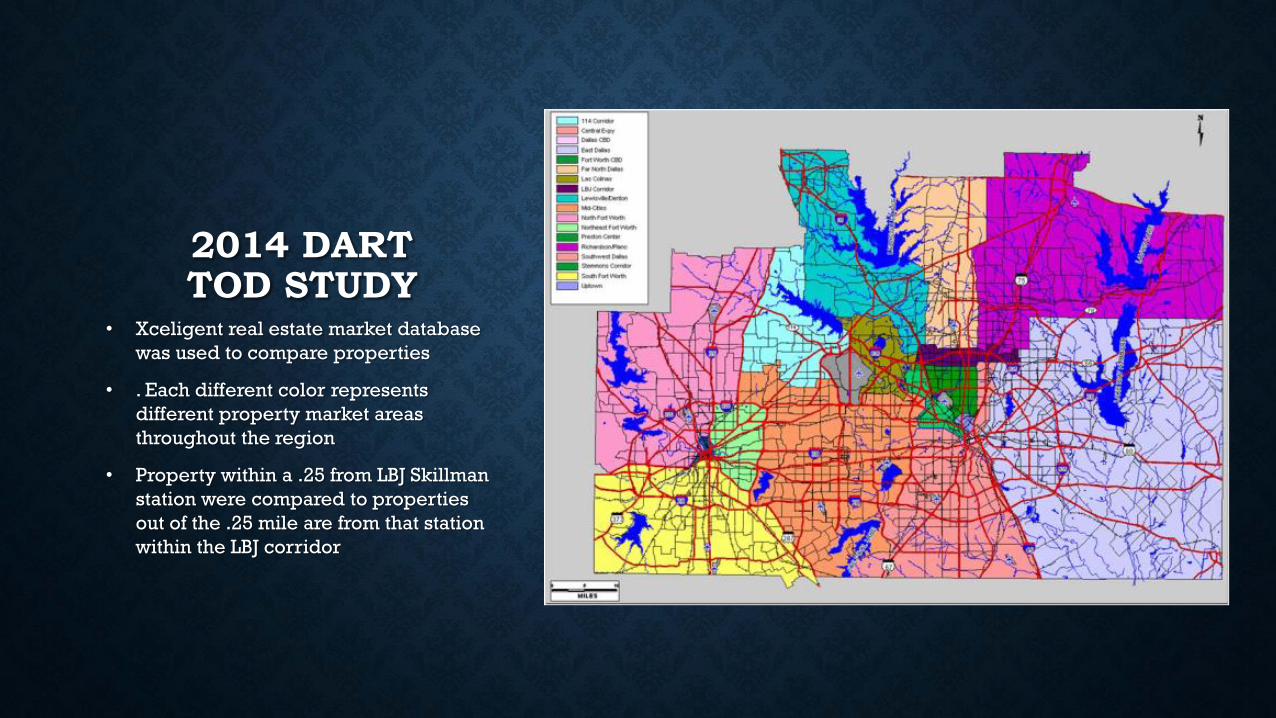
2014 DART TOD STUDY
• Xceligent real estate market database
was used to compare properties
• . Each different color represents
different property market areas
throughout the region
• Property within a .25 from LBJ Skillman
station were compared to properties
out of the .25 mile are from that station
within the LBJ corridor
2014 DART TOD STUDY
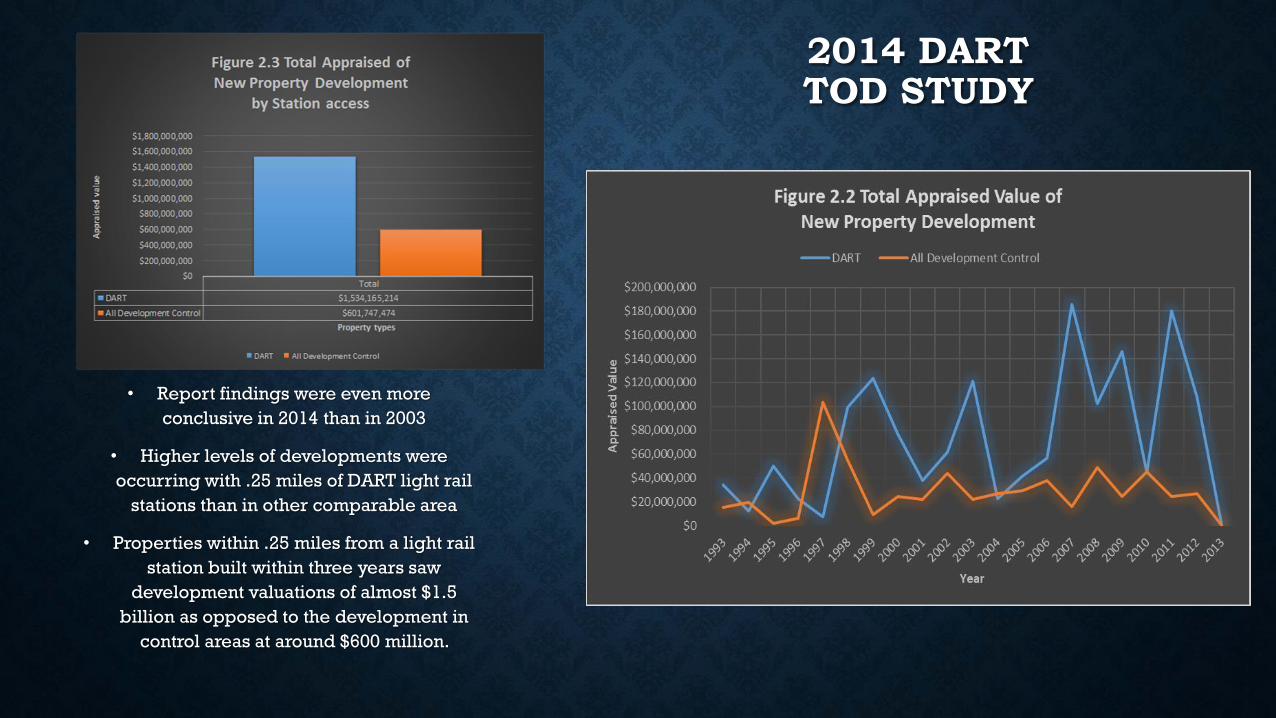
• Report findings were even more
conclusive in 2014 than in 2003
• Higher levels of developments were
occurring with .25 miles of DART light rail
stations than in other comparable area
• Properties within .25 miles from a light rail
station built within three years saw
development valuations of almost $1.5
billion as opposed to the development in
control areas at around $600 million.
2014 DART TOD STUDY
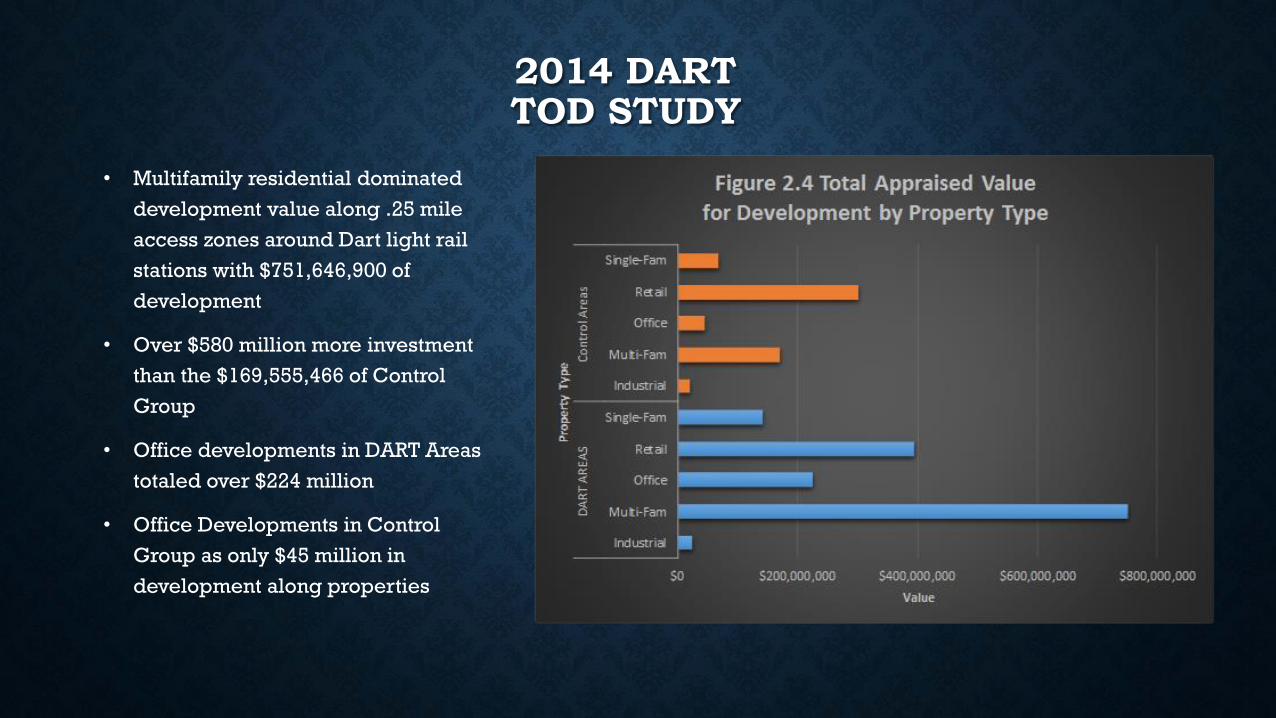
• Multifamily residential dominated
development value along .25 mile
access zones around Dart light rail
stations with $751,646,900 of
development
• Over $580 million more investment
than the $169,555,466 of Control
Group
• Office developments in DART Areas
totaled over $224 million
• Office Developments in Control
Group as only $45 million in
development along properties
REGIONAL PROJECTS
• $1.2 billion of new commercial
and residential developments constructed
walking distance from DART (2004)
• All occurred without any subsidies or TOD planning
or supportive policies by the regional planning agency
• Three projects:
1. Mockingbird station
2. The Cedars station
3. Downtown Plano station
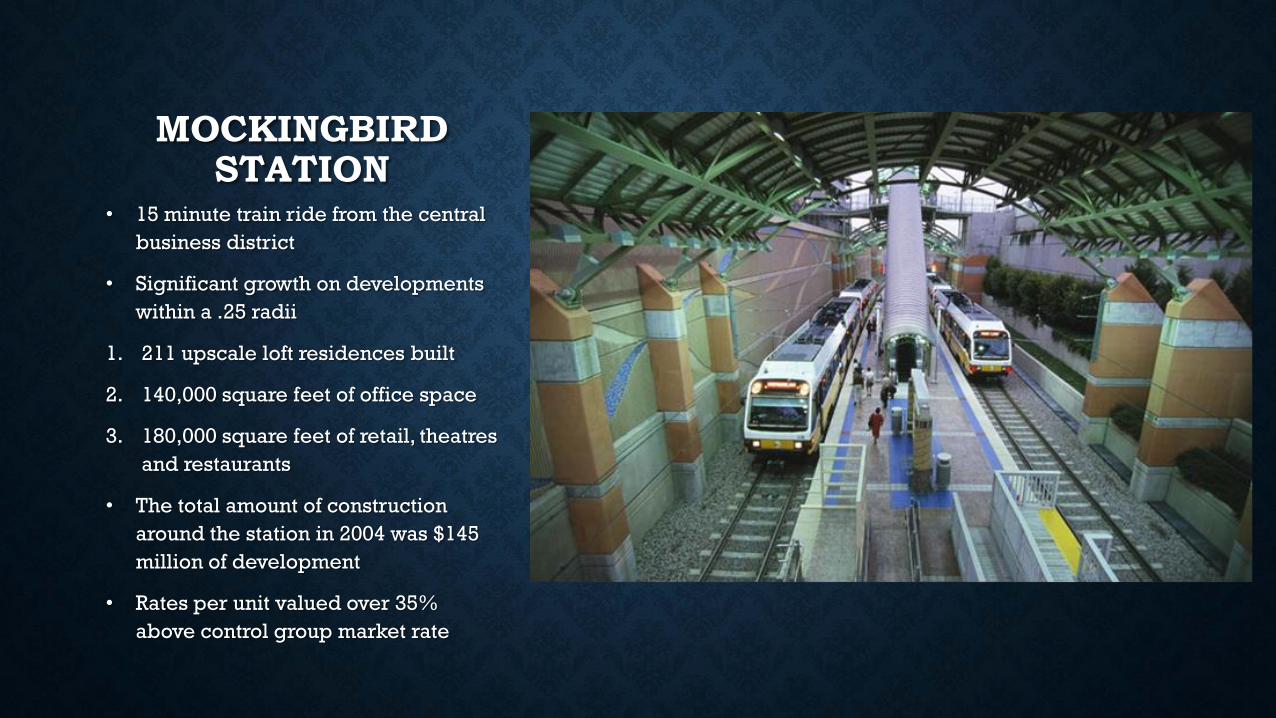
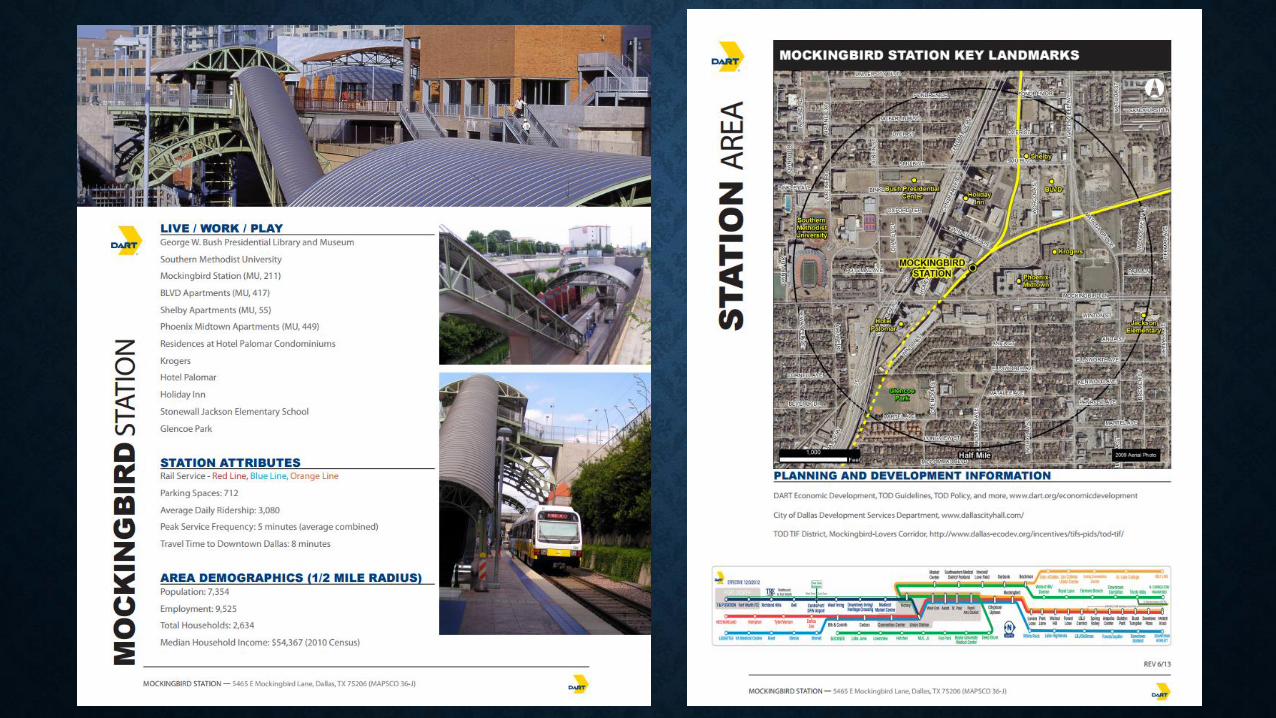
MOCKINGBIRD STATION
• 15 minute train ride from the central
business district
• Significant growth on developments
within a .25 radii
1. 211 upscale loft residences built
2. 140,000 square feet of office space
3. 180,000 square feet of retail, theatres
and restaurants
• The total amount of construction
around the station in 2004 was $145
million of development
• Rates per unit valued over 35%
above control group market rate

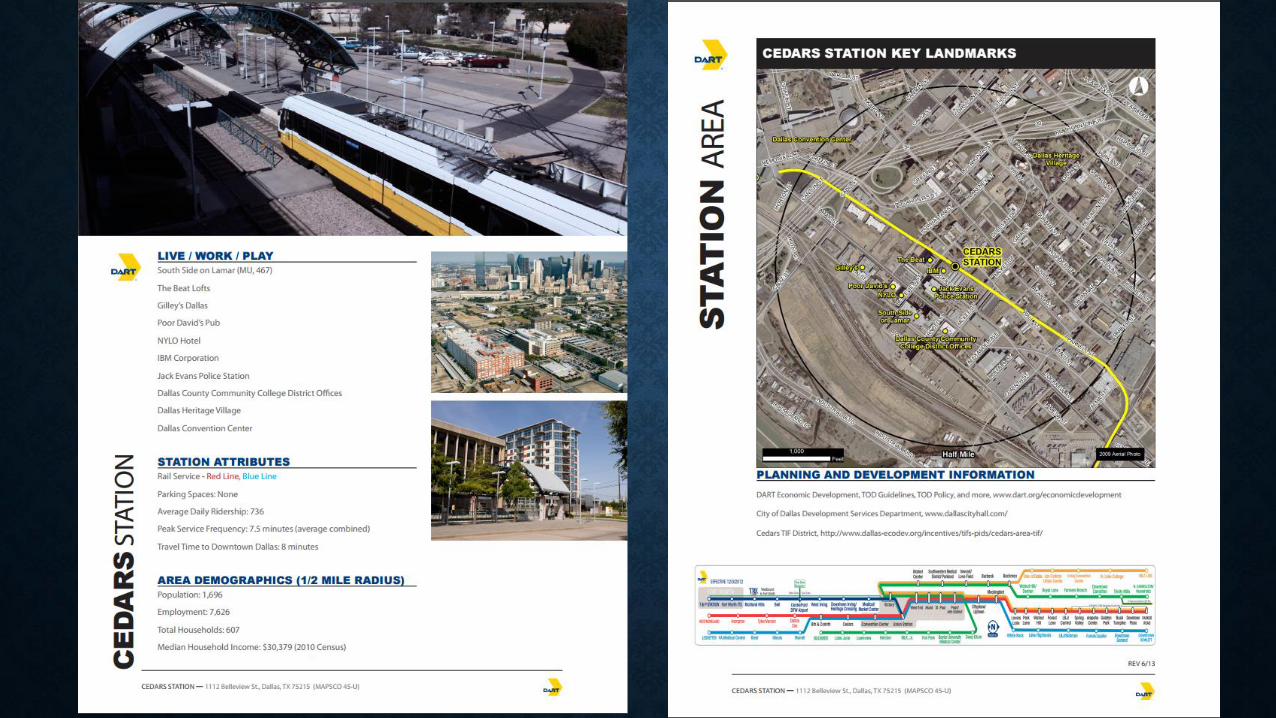
THE CEDARS STATION
• Former industrial center 7.5 min from
CBD including a provision of industrial
warehousing
• Redevelopment stages focused on
building up residential base ,transit –
friendly access ,additional parking, bus
bays, and bike racks
• 1.4 million square feet of development
was catalyzed by the construction of
the station.
• Development included 455 lofts, 20,000
sq.ft of retail space, 100,000 sq.ft of
office space, and a concert venue
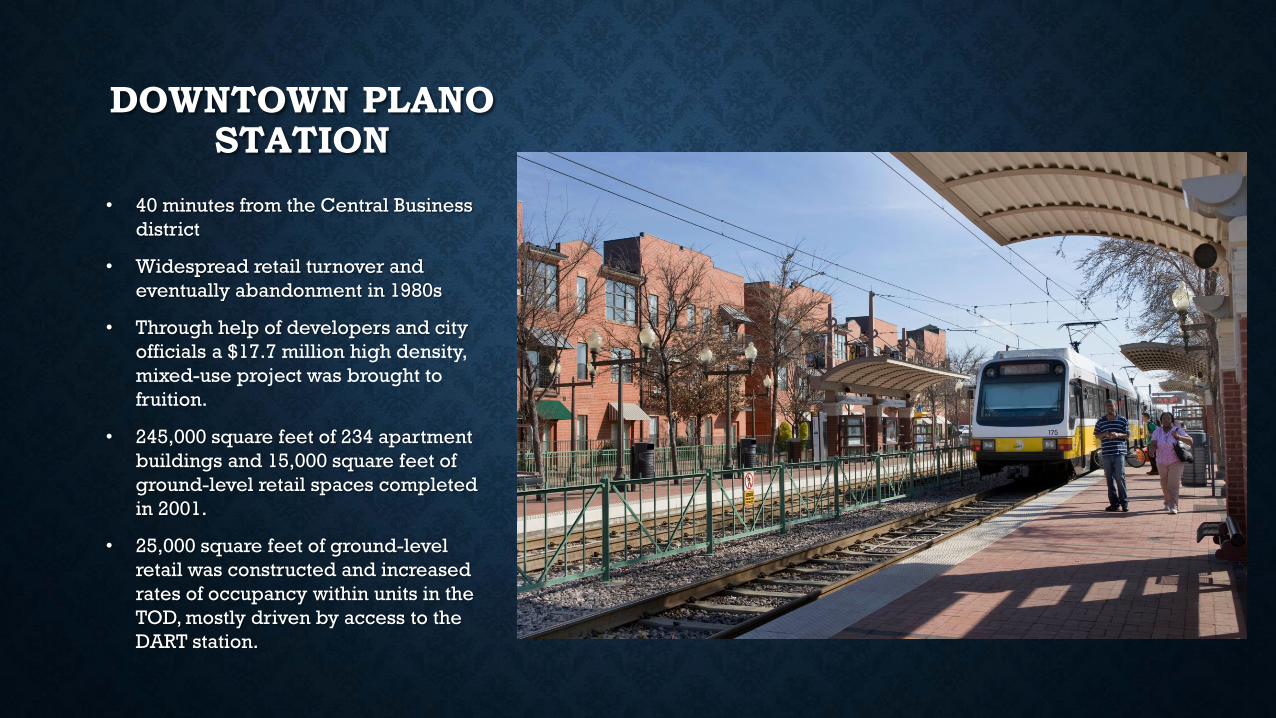
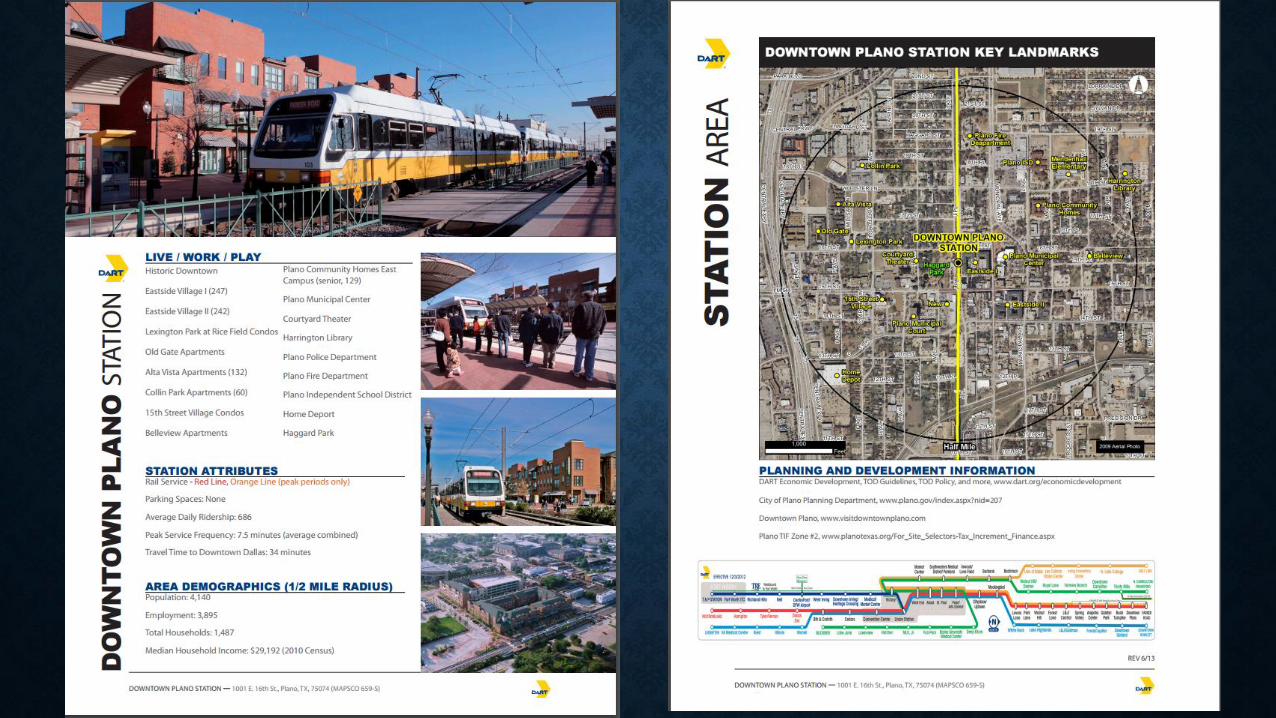
DOWNTOWN PLANO STATION
• 40 minutes from the Central Business
district
• Widespread retail turnover and
eventually abandonment in 1980s
• Through help of developers and city
officials a $17.7 million high density,
mixed-use project was brought to
fruition.
• 245,000 square feet of 234 apartment
buildings and 15,000 square feet of
ground-level retail spaces completed
in 2001.
• 25,000 square feet of ground-level
retail was constructed and increased
rates of occupancy within units in the
TOD, mostly driven by access to the
DART station.
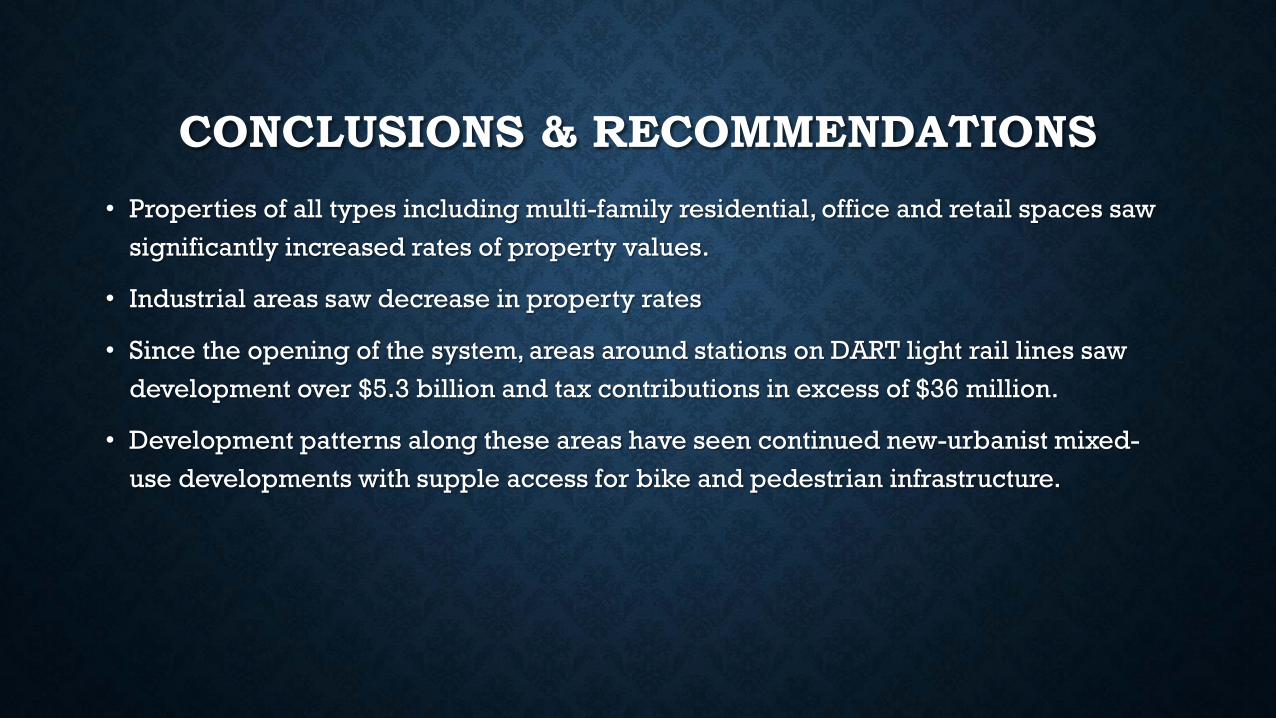
CONCLUSIONS & RECOMMENDATIONS
• Properties of all types including multi-family residential, office and retail spaces saw
significantly increased rates of property values.
• Industrial areas saw decrease in property rates
• Since the opening of the system, areas around stations on DART light rail lines saw
development over $5.3 billion and tax contributions in excess of $36 million.
• Development patterns along these areas have seen continued new-urbanist mixed-
use developments with supple access for bike and pedestrian infrastructure.
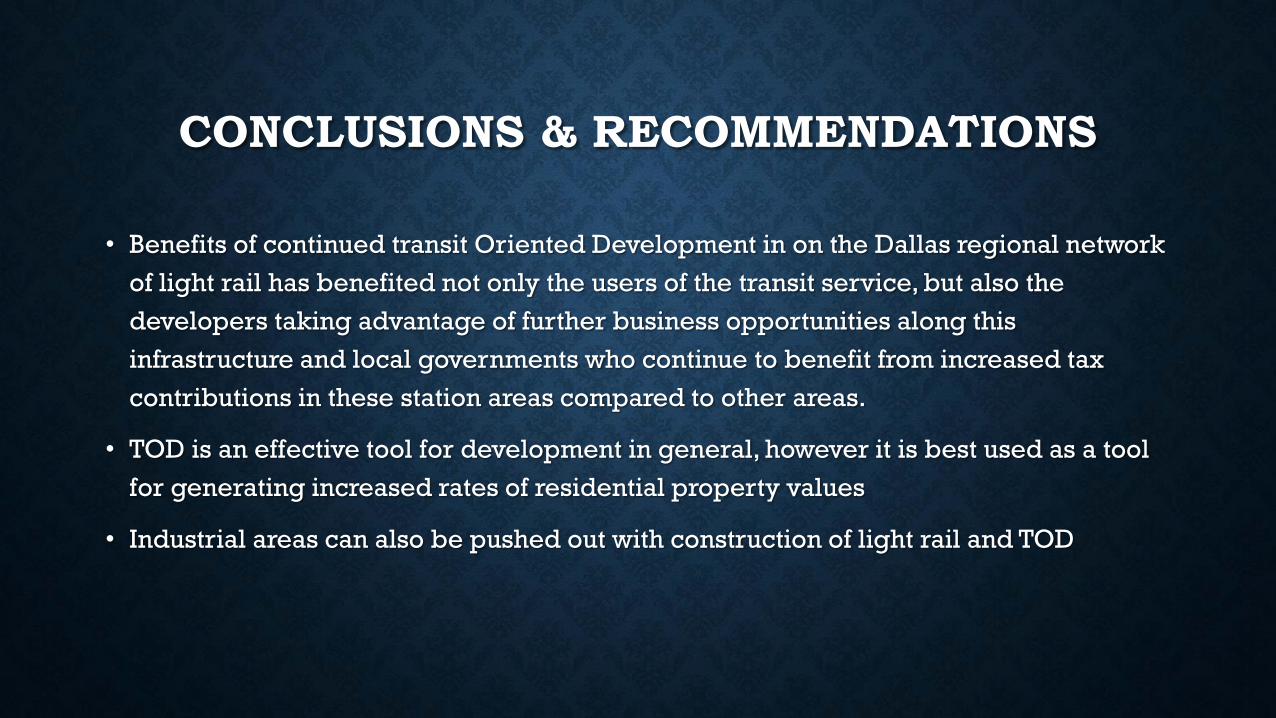
CONCLUSIONS & RECOMMENDATIONS
• Benefits of continued transit Oriented Development in on the Dallas regional network
of light rail has benefited not only the users of the transit service, but also the
developers taking advantage of further business opportunities along this
infrastructure and local governments who continue to benefit from increased tax
contributions in these station areas compared to other areas.
• TOD is an effective tool for development in general, however it is best used as a tool
for generating increased rates of residential property values
• Industrial areas can also be pushed out with construction of light rail and TOD

THANK YOU
References: