dallas county profile - alabama labor market … county.pdfalabama department of labor labor market...
TRANSCRIPT
Alabama Department of LaborLabor Market Information Division
Dallas County Profile
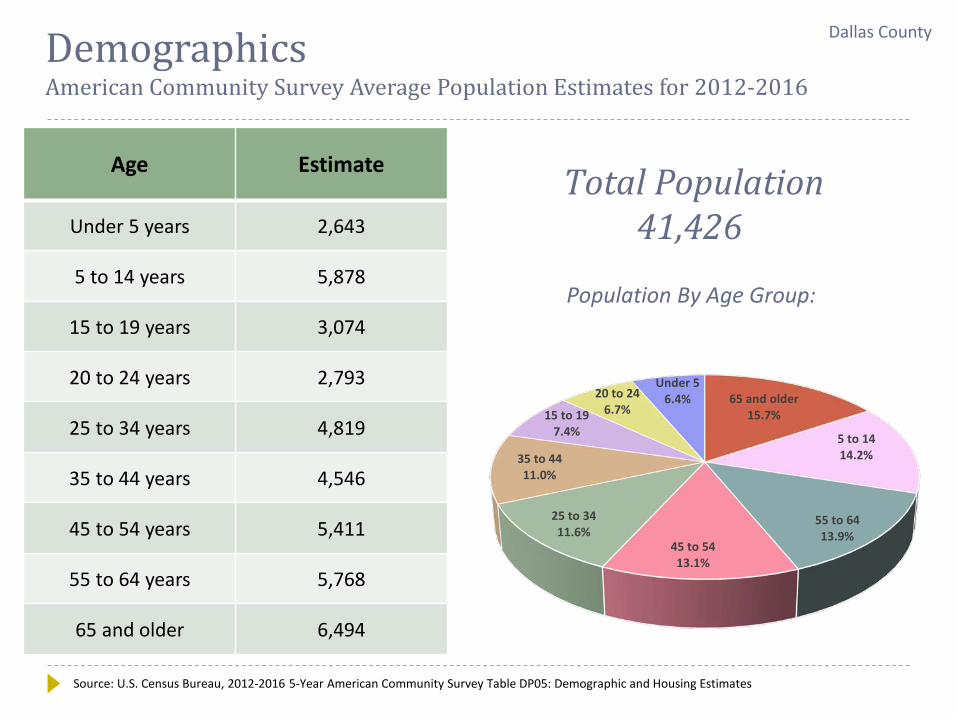
DemographicsAmerican Community Survey Average Population Estimates for 2012-2016
Age Estimate
Under 5 years 2,643
5 to 14 years 5,878
15 to 19 years 3,074
20 to 24 years 2,793
25 to 34 years 4,819
35 to 44 years 4,546
45 to 54 years 5,411
55 to 64 years 5,768
65 and older 6,494
Total Population41,426
Source: U.S. Census Bureau, 2012-2016 5-Year American Community Survey Table DP05: Demographic and Housing Estimates
Dallas County
65 and older15.7%
5 to 14 14.2%
55 to 64 13.9%
45 to 54 13.1%
25 to 34 11.6%
35 to 44 11.0%
15 to 19 7.4%
20 to 24 6.7%
Under 5 6.4%
Population By Age Group:
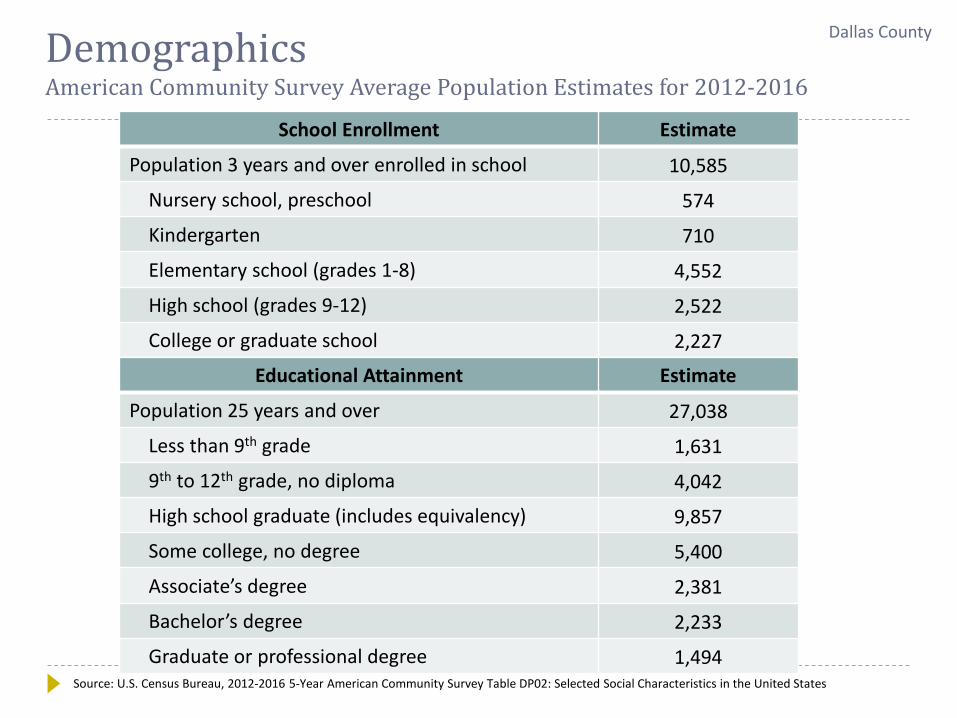
School Enrollment Estimate
Population 3 years and over enrolled in school 10,585
Nursery school, preschool 574
Kindergarten 710
Elementary school (grades 1-8) 4,552
High school (grades 9-12) 2,522
College or graduate school 2,227
DemographicsAmerican Community Survey Average Population Estimates for 2012-2016
Source: U.S. Census Bureau, 2012-2016 5-Year American Community Survey Table DP02: Selected Social Characteristics in the United States
Dallas County
Educational Attainment Estimate
Population 25 years and over 27,038
Less than 9th grade 1,631
9th to 12th grade, no diploma 4,042
High school graduate (includes equivalency) 9,857
Some college, no degree 5,400
Associate’s degree 2,381
Bachelor’s degree 2,233
Graduate or professional degree 1,494
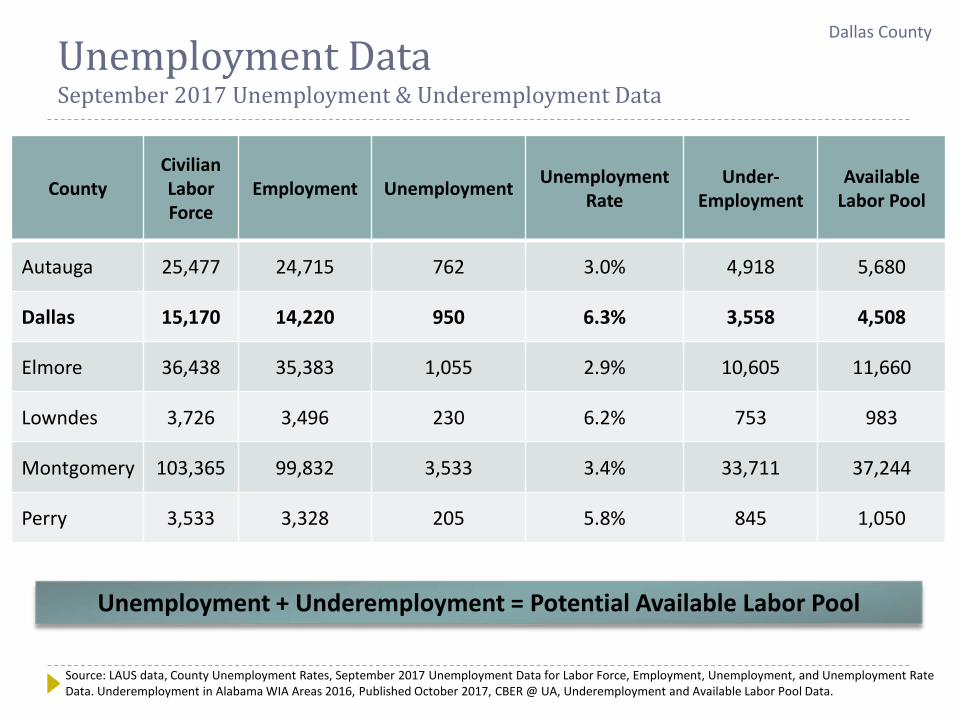
Unemployment DataSeptember 2017 Unemployment & Underemployment Data
CountyCivilian Labor Force
Employment Unemployment Unemployment Rate
Under-Employment
Available Labor Pool
Autauga 25,477 24,715 762 3.0% 4,918 5,680
Dallas 15,170 14,220 950 6.3% 3,558 4,508
Elmore 36,438 35,383 1,055 2.9% 10,605 11,660
Lowndes 3,726 3,496 230 6.2% 753 983
Montgomery 103,365 99,832 3,533 3.4% 33,711 37,244
Perry 3,533 3,328 205 5.8% 845 1,050
Unemployment + Underemployment = Potential Available Labor Pool
Source: LAUS data, County Unemployment Rates, September 2017 Unemployment Data for Labor Force, Employment, Unemployment, and Unemployment Rate Data. Underemployment in Alabama WIA Areas 2016, Published October 2017, CBER @ UA, Underemployment and Available Labor Pool Data.
Dallas County
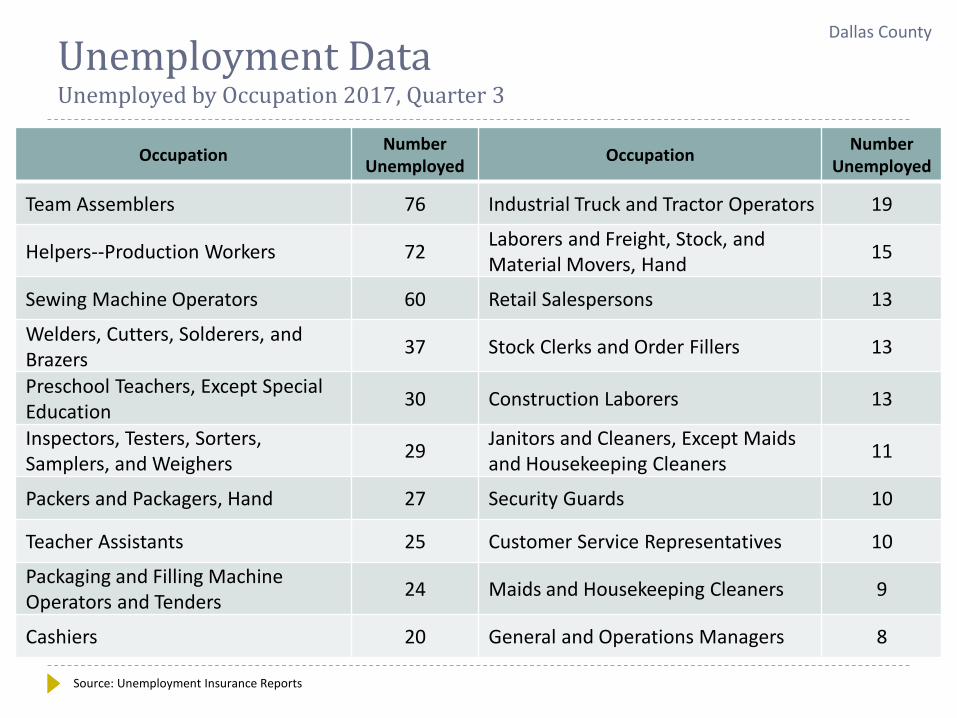
Unemployment DataUnemployed by Occupation 2017, Quarter 3
Occupation Number Unemployed Occupation Number
Unemployed
Team Assemblers 76 Industrial Truck and Tractor Operators 19
Helpers--Production Workers 72 Laborers and Freight, Stock, and Material Movers, Hand 15
Sewing Machine Operators 60 Retail Salespersons 13
Welders, Cutters, Solderers, and Brazers 37 Stock Clerks and Order Fillers 13
Preschool Teachers, Except Special Education 30 Construction Laborers 13
Inspectors, Testers, Sorters, Samplers, and Weighers 29 Janitors and Cleaners, Except Maids
and Housekeeping Cleaners 11
Packers and Packagers, Hand 27 Security Guards 10
Teacher Assistants 25 Customer Service Representatives 10
Packaging and Filling Machine Operators and Tenders 24 Maids and Housekeeping Cleaners 9
Cashiers 20 General and Operations Managers 8
Source: Unemployment Insurance Reports
Dallas County
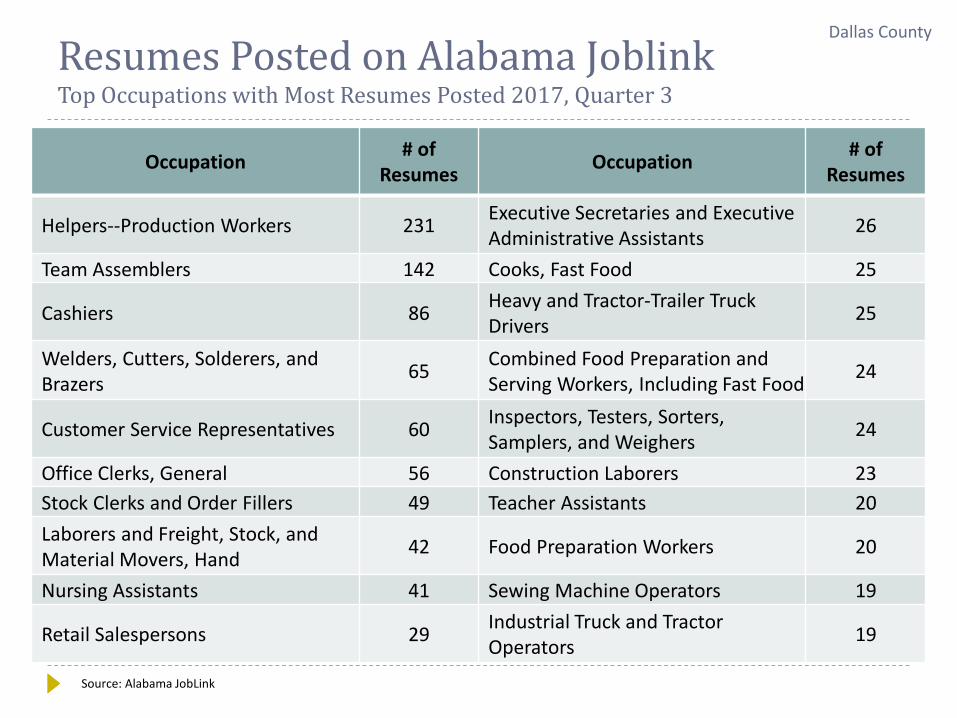
Resumes Posted on Alabama JoblinkTop Occupations with Most Resumes Posted 2017, Quarter 3
Occupation # of Resumes Occupation # of
Resumes
Helpers--Production Workers 231 Executive Secretaries and Executive Administrative Assistants 26
Team Assemblers 142 Cooks, Fast Food 25
Cashiers 86 Heavy and Tractor-Trailer Truck Drivers 25
Welders, Cutters, Solderers, and Brazers 65 Combined Food Preparation and
Serving Workers, Including Fast Food 24
Customer Service Representatives 60 Inspectors, Testers, Sorters, Samplers, and Weighers 24
Office Clerks, General 56 Construction Laborers 23Stock Clerks and Order Fillers 49 Teacher Assistants 20Laborers and Freight, Stock, and Material Movers, Hand 42 Food Preparation Workers 20
Nursing Assistants 41 Sewing Machine Operators 19
Retail Salespersons 29 Industrial Truck and Tractor Operators 19
Source: Alabama JobLink
Dallas County
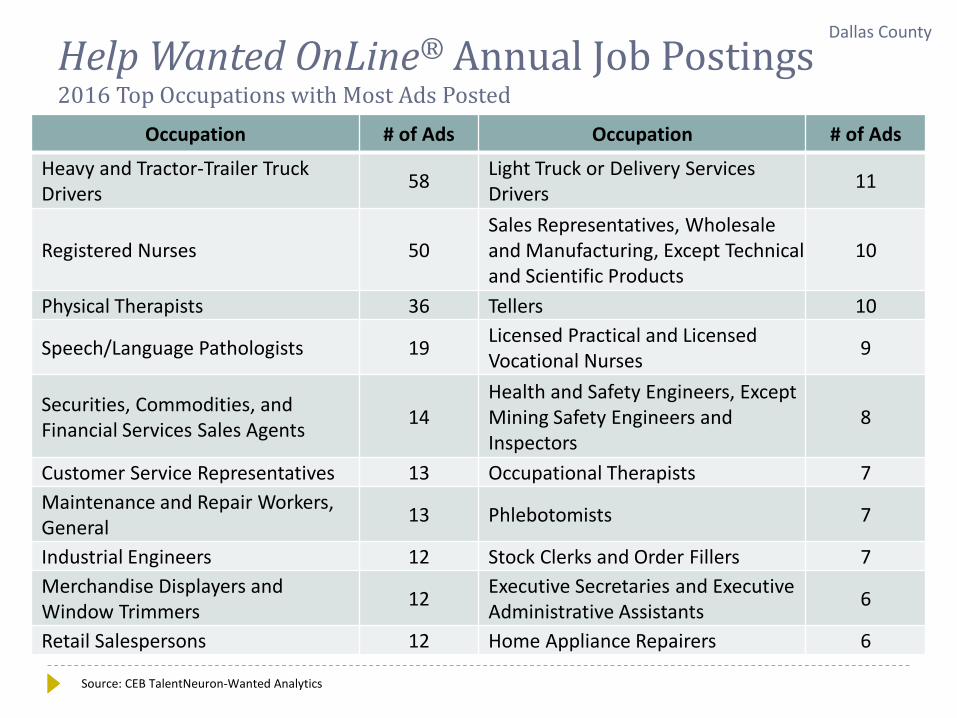
Help Wanted OnLine® Annual Job Postings2016 Top Occupations with Most Ads Posted
Occupation # of Ads Occupation # of Ads
Heavy and Tractor-Trailer Truck Drivers 58 Light Truck or Delivery Services
Drivers 11
Registered Nurses 50Sales Representatives, Wholesale and Manufacturing, Except Technical and Scientific Products
10
Physical Therapists 36 Tellers 10
Speech/Language Pathologists 19 Licensed Practical and Licensed Vocational Nurses 9
Securities, Commodities, and Financial Services Sales Agents 14
Health and Safety Engineers, Except Mining Safety Engineers and Inspectors
8
Customer Service Representatives 13 Occupational Therapists 7Maintenance and Repair Workers, General 13 Phlebotomists 7
Industrial Engineers 12 Stock Clerks and Order Fillers 7Merchandise Displayers and Window Trimmers 12 Executive Secretaries and Executive
Administrative Assistants 6
Retail Salespersons 12 Home Appliance Repairers 6
Source: CEB TalentNeuron-Wanted Analytics
Dallas County
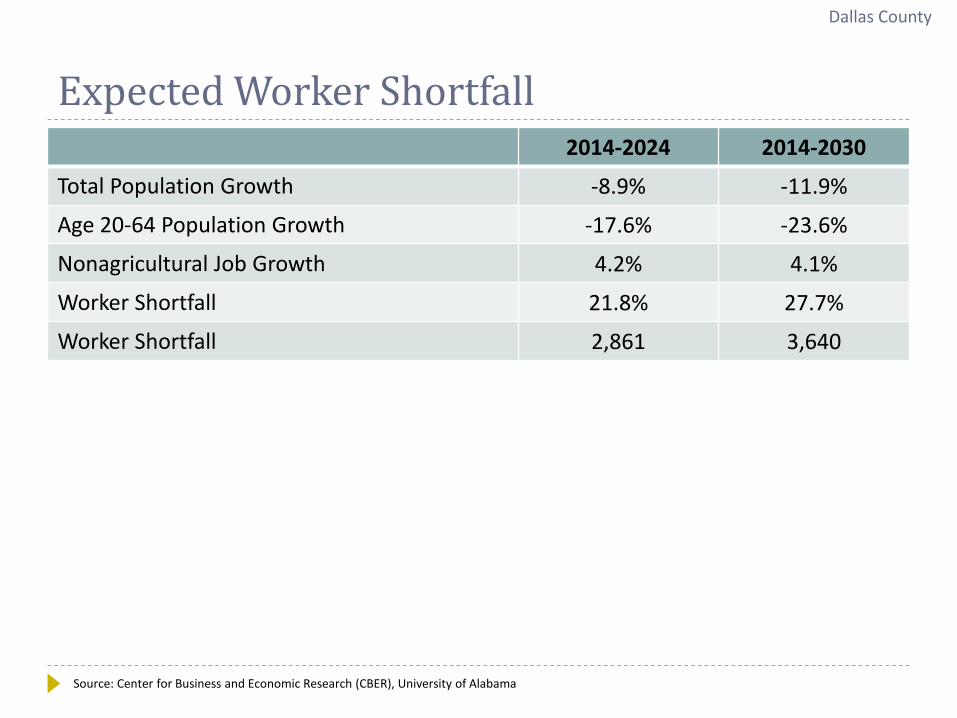
Expected Worker Shortfall2014-2024 2014-2030
Total Population Growth -8.9% -11.9%
Age 20-64 Population Growth -17.6% -23.6%
Nonagricultural Job Growth 4.2% 4.1%
Worker Shortfall 21.8% 27.7%
Worker Shortfall 2,861 3,640
Source: Center for Business and Economic Research (CBER), University of Alabama
Dallas County
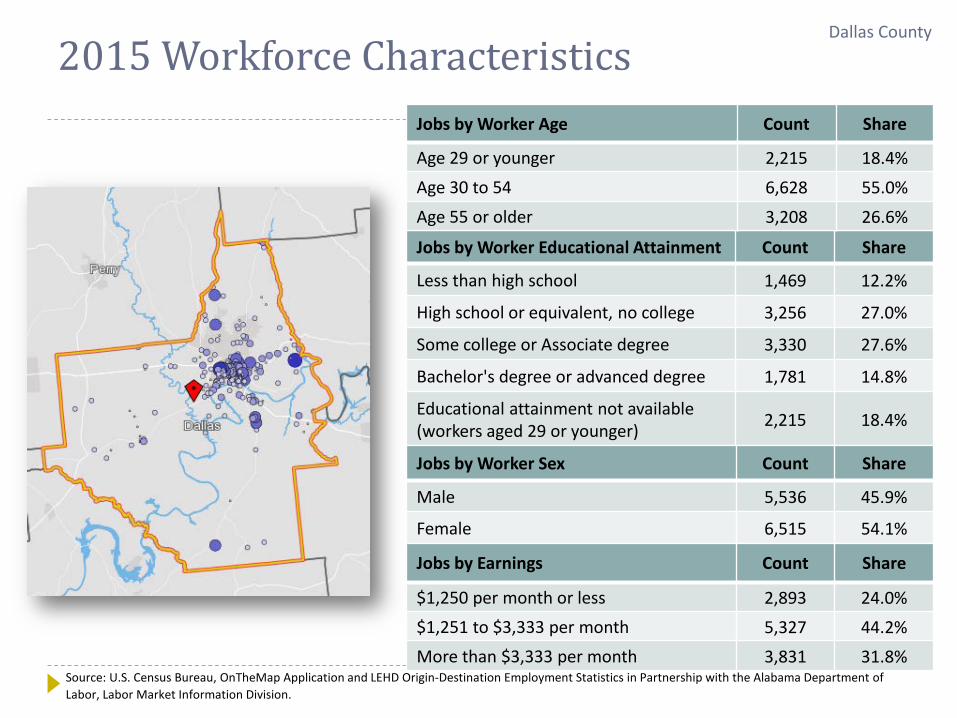
2015 Workforce Characteristics
Jobs by Worker Educational Attainment Count Share
Less than high school 1,469 12.2%
High school or equivalent, no college 3,256 27.0%
Some college or Associate degree 3,330 27.6%
Bachelor's degree or advanced degree 1,781 14.8%
Educational attainment not available (workers aged 29 or younger) 2,215 18.4%
Jobs by Worker Age Count Share
Age 29 or younger 2,215 18.4%Age 30 to 54 6,628 55.0%Age 55 or older 3,208 26.6%
Jobs by Worker Sex Count Share
Male 5,536 45.9%
Female 6,515 54.1%
Jobs by Earnings Count Share
$1,250 per month or less 2,893 24.0%$1,251 to $3,333 per month 5,327 44.2%More than $3,333 per month 3,831 31.8%
Source: U.S. Census Bureau, OnTheMap Application and LEHD Origin-Destination Employment Statistics in Partnership with the Alabama Department of Labor, Labor Market Information Division.
Dallas County
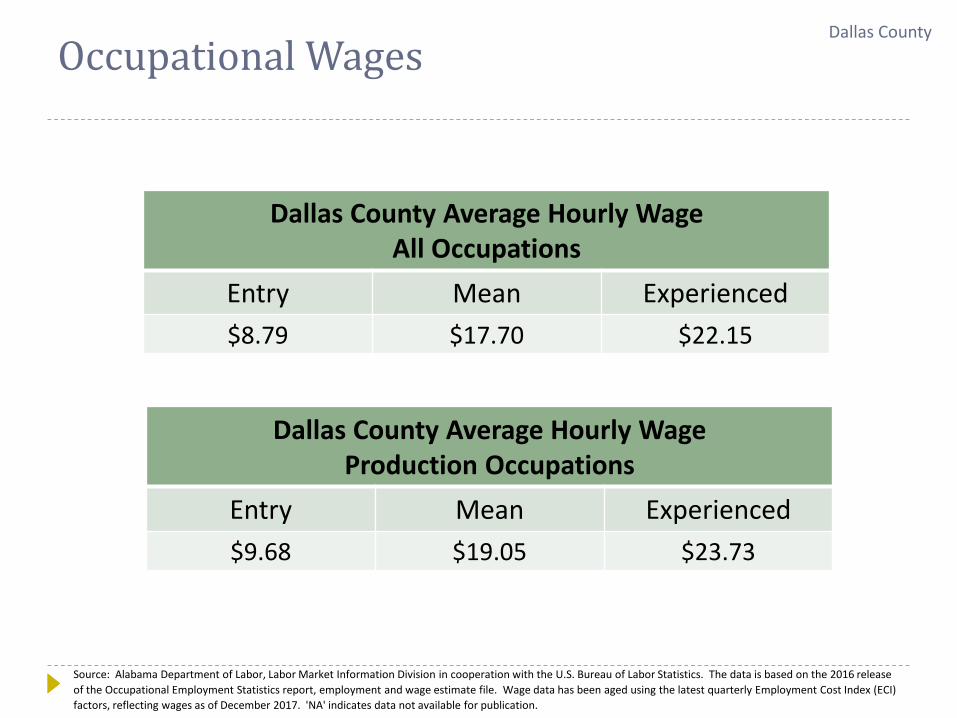
Occupational Wages
Dallas County Average Hourly WageAll Occupations
Entry Mean Experienced$8.79 $17.70 $22.15
Dallas County Average Hourly WageProduction Occupations
Entry Mean Experienced$9.68 $19.05 $23.73
Source: Alabama Department of Labor, Labor Market Information Division in cooperation with the U.S. Bureau of Labor Statistics. The data is based on the 2016 release of the Occupational Employment Statistics report, employment and wage estimate file. Wage data has been aged using the latest quarterly Employment Cost Index (ECI) factors, reflecting wages as of December 2017. 'NA' indicates data not available for publication.
Dallas County
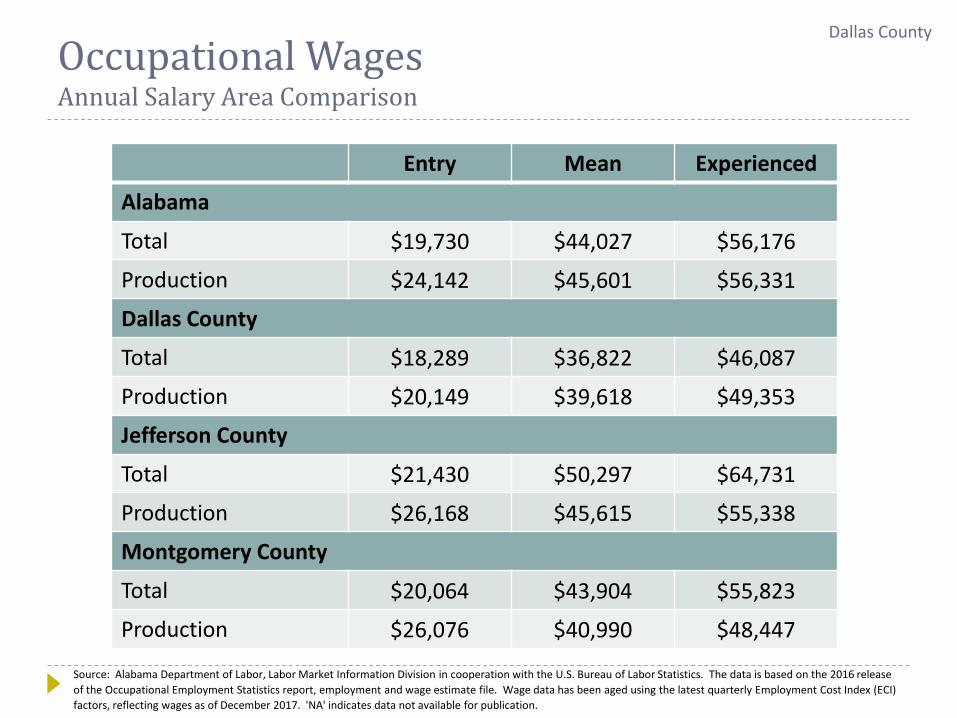
Occupational WagesAnnual Salary Area Comparison
Entry Mean Experienced
Alabama
Total $19,730 $44,027 $56,176
Production $24,142 $45,601 $56,331
Dallas County
Total $18,289 $36,822 $46,087
Production $20,149 $39,618 $49,353
Jefferson County
Total $21,430 $50,297 $64,731
Production $26,168 $45,615 $55,338
Montgomery County
Total $20,064 $43,904 $55,823
Production $26,076 $40,990 $48,447
Source: Alabama Department of Labor, Labor Market Information Division in cooperation with the U.S. Bureau of Labor Statistics. The data is based on the 2016 release of the Occupational Employment Statistics report, employment and wage estimate file. Wage data has been aged using the latest quarterly Employment Cost Index (ECI) factors, reflecting wages as of December 2017. 'NA' indicates data not available for publication.
Dallas County
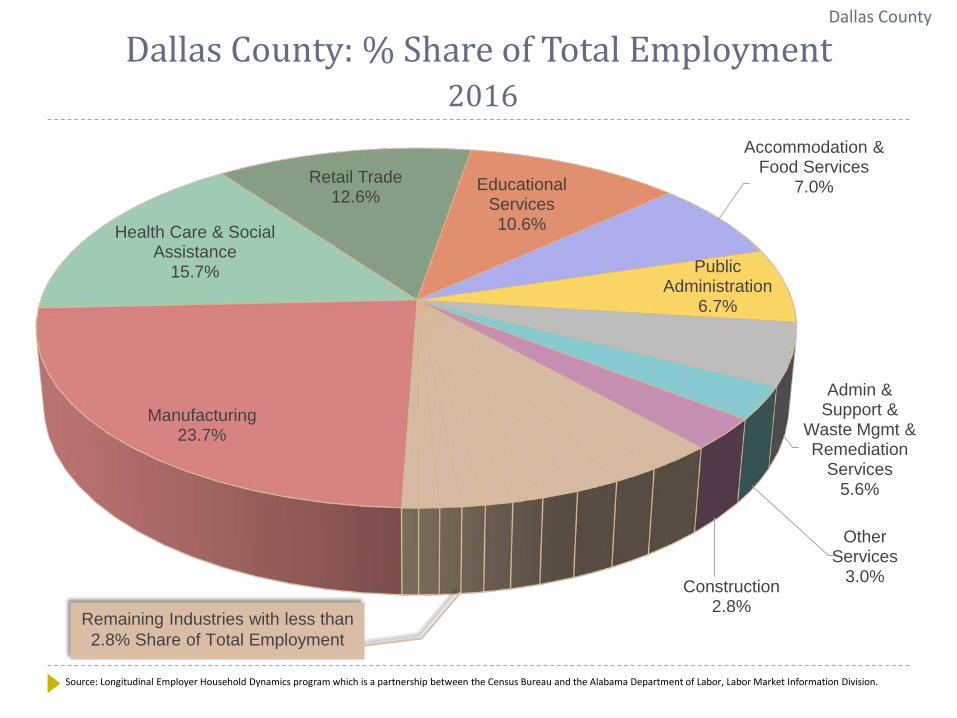
Manufacturing23.7%
Health Care & Social Assistance
15.7%
Retail Trade12.6%
Educational Services10.6%
Accommodation & Food Services
7.0%
Public Administration
6.7%
Admin & Support &
Waste Mgmt & Remediation
Services5.6%
Other Services
3.0%Construction2.8%
Remaining Industries with less than 2.8% Share of Total Employment
Dallas County: % Share of Total Employment2016
Source: Longitudinal Employer Household Dynamics program which is a partnership between the Census Bureau and the Alabama Department of Labor, Labor Market Information Division.
Dallas County
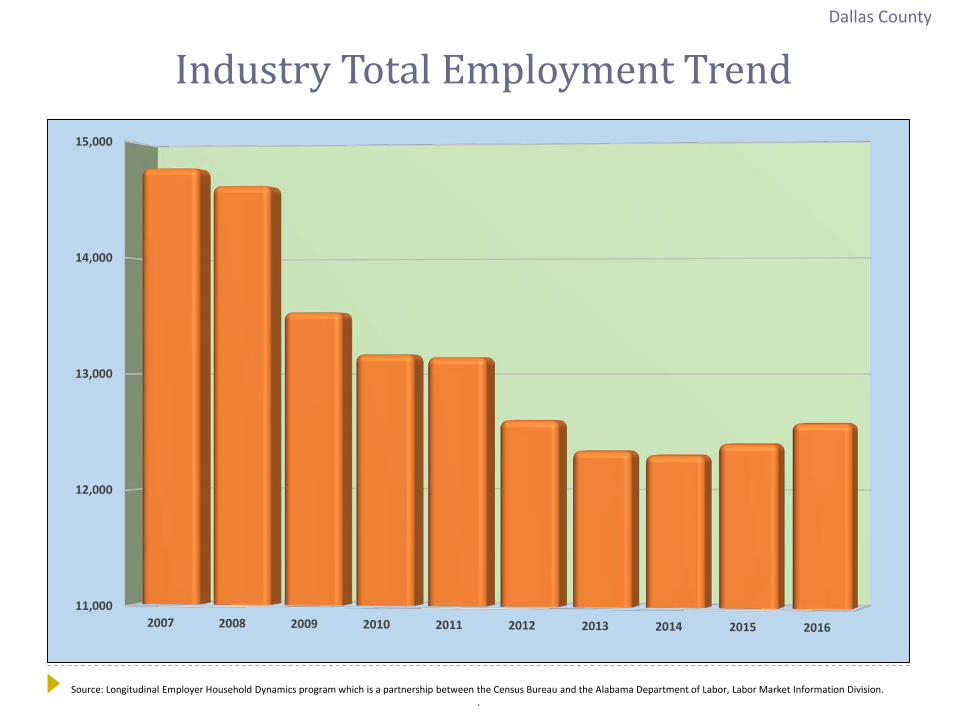
Industry Total Employment Trend
Source: Longitudinal Employer Household Dynamics program which is a partnership between the Census Bureau and the Alabama Department of Labor, Labor Market Information Division. .
11,000
12,000
13,000
14,000
15,000
2007 2008 2009 2010 2011 2012 2013 2014 2015 2016
Dallas County
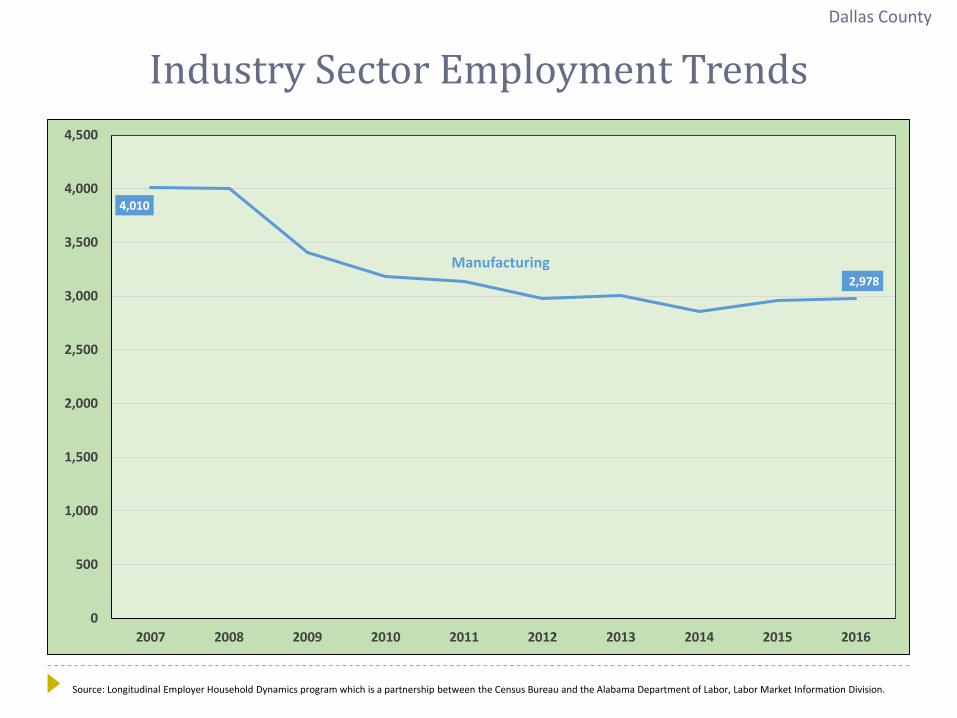
Industry Sector Employment Trends
Source: Longitudinal Employer Household Dynamics program which is a partnership between the Census Bureau and the Alabama Department of Labor, Labor Market Information Division.
4,010
Manufacturing2,978
0
500
1,000
1,500
2,000
2,500
3,000
3,500
4,000
4,500
2007 2008 2009 2010 2011 2012 2013 2014 2015 2016
Dallas County
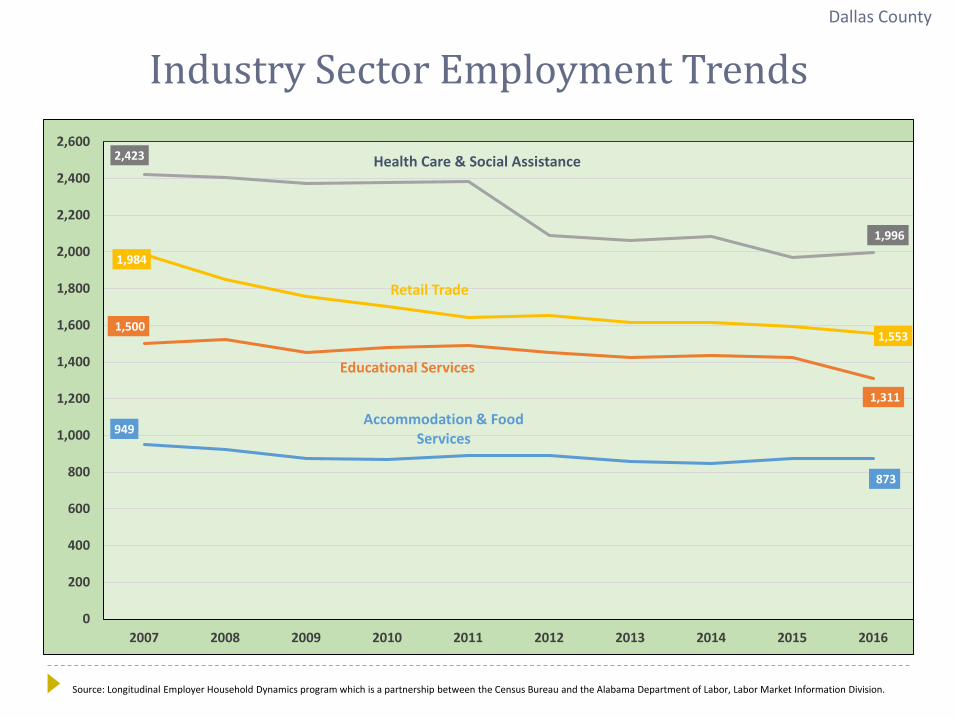
Industry Sector Employment Trends
Source: Longitudinal Employer Household Dynamics program which is a partnership between the Census Bureau and the Alabama Department of Labor, Labor Market Information Division.
949Accommodation & Food
Services
873
1,500
Educational Services
1,311
2,423 Health Care & Social Assistance
1,996
1,984
Retail Trade
1,553
0
200
400
600
800
1,000
1,200
1,400
1,600
1,800
2,000
2,200
2,400
2,600
2007 2008 2009 2010 2011 2012 2013 2014 2015 2016
Dallas County
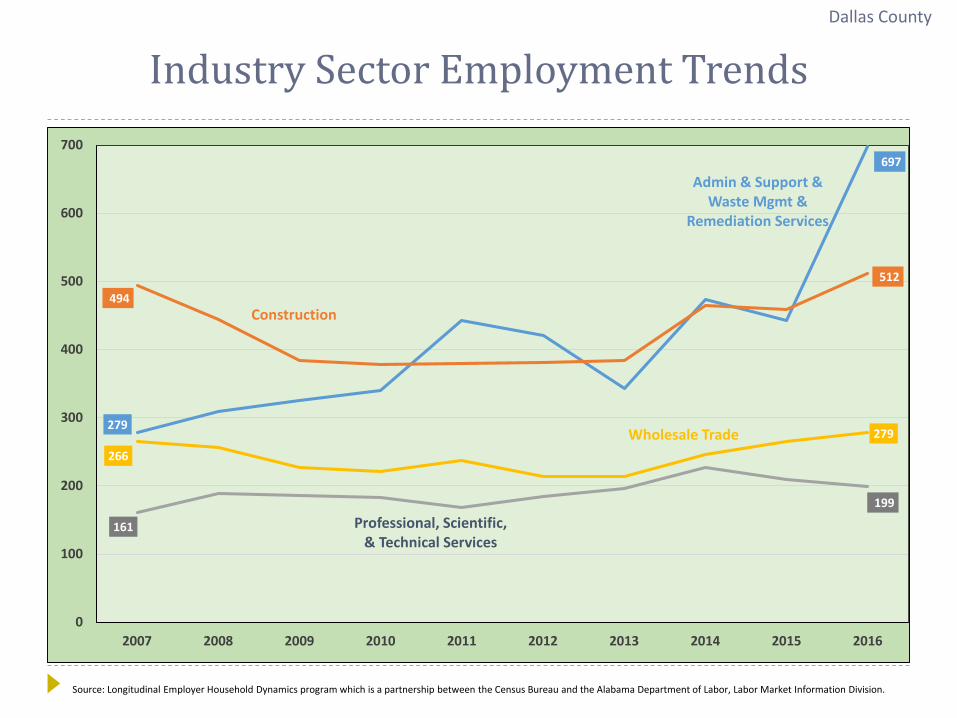
Industry Sector Employment Trends
Source: Longitudinal Employer Household Dynamics program which is a partnership between the Census Bureau and the Alabama Department of Labor, Labor Market Information Division.
279
Admin & Support & Waste Mgmt &
Remediation Services
697
494Construction
512
161 Professional, Scientific, & Technical Services
199
266Wholesale Trade 279
0
100
200
300
400
500
600
700
2007 2008 2009 2010 2011 2012 2013 2014 2015 2016
Dallas County
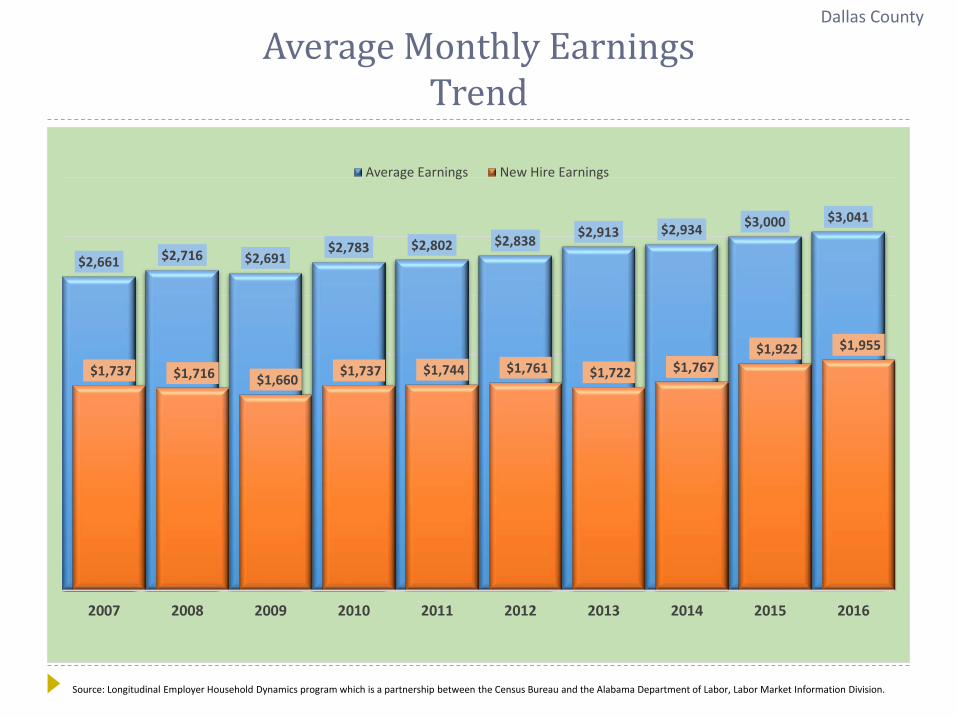
Average Monthly EarningsTrend
Source: Longitudinal Employer Household Dynamics program which is a partnership between the Census Bureau and the Alabama Department of Labor, Labor Market Information Division.
$2,661 $2,716 $2,691$2,783 $2,802 $2,838 $2,913 $2,934 $3,000 $3,041
$1,737 $1,716 $1,660 $1,737 $1,744 $1,761 $1,722 $1,767 $1,922 $1,955
2007 2008 2009 2010 2011 2012 2013 2014 2015 2016
Average Earnings New Hire Earnings
Dallas County
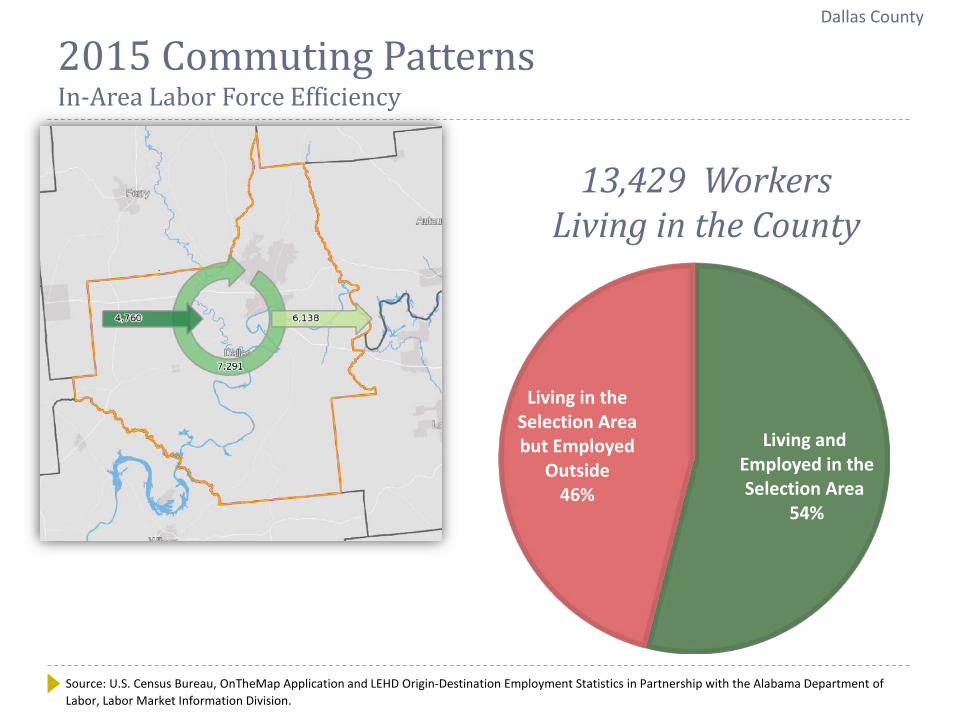
2015 Commuting PatternsIn-Area Labor Force Efficiency
Source: U.S. Census Bureau, OnTheMap Application and LEHD Origin-Destination Employment Statistics in Partnership with the Alabama Department of Labor, Labor Market Information Division.
13,429 Workers Living in the County
Dallas County
Living andEmployed in the Selection Area
54%
Living in the Selection Area but Employed
Outside 46%
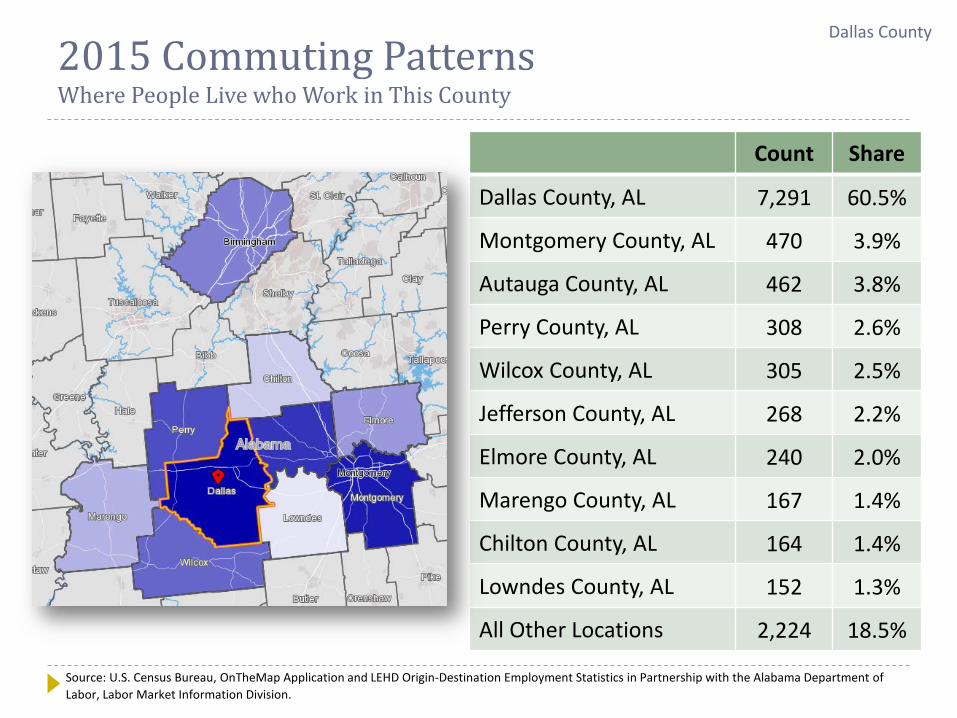
2015 Commuting PatternsWhere People Live who Work in This County
Count Share
Dallas County, AL 7,291 60.5%
Montgomery County, AL 470 3.9%
Autauga County, AL 462 3.8%
Perry County, AL 308 2.6%
Wilcox County, AL 305 2.5%
Jefferson County, AL 268 2.2%
Elmore County, AL 240 2.0%
Marengo County, AL 167 1.4%
Chilton County, AL 164 1.4%
Lowndes County, AL 152 1.3%
All Other Locations 2,224 18.5%
Source: U.S. Census Bureau, OnTheMap Application and LEHD Origin-Destination Employment Statistics in Partnership with the Alabama Department of Labor, Labor Market Information Division.
Dallas County
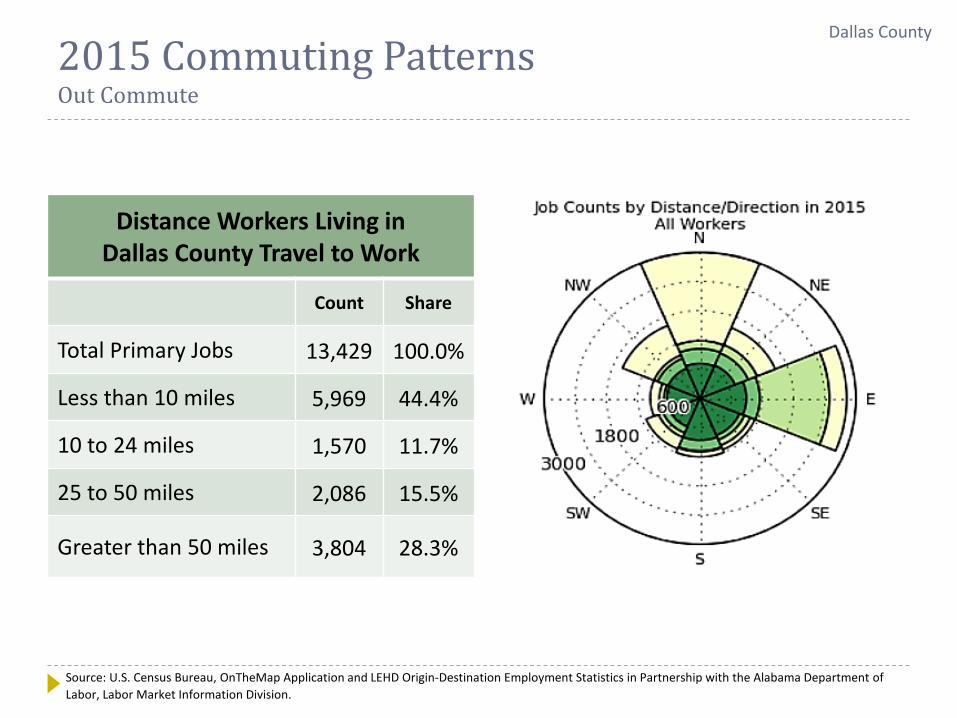
Distance Workers Living in Dallas County Travel to Work
Count Share
Total Primary Jobs 13,429 100.0%
Less than 10 miles 5,969 44.4%
10 to 24 miles 1,570 11.7%
25 to 50 miles 2,086 15.5%
Greater than 50 miles 3,804 28.3%
2015 Commuting PatternsOut Commute
Source: U.S. Census Bureau, OnTheMap Application and LEHD Origin-Destination Employment Statistics in Partnership with the Alabama Department of Labor, Labor Market Information Division.
Dallas County
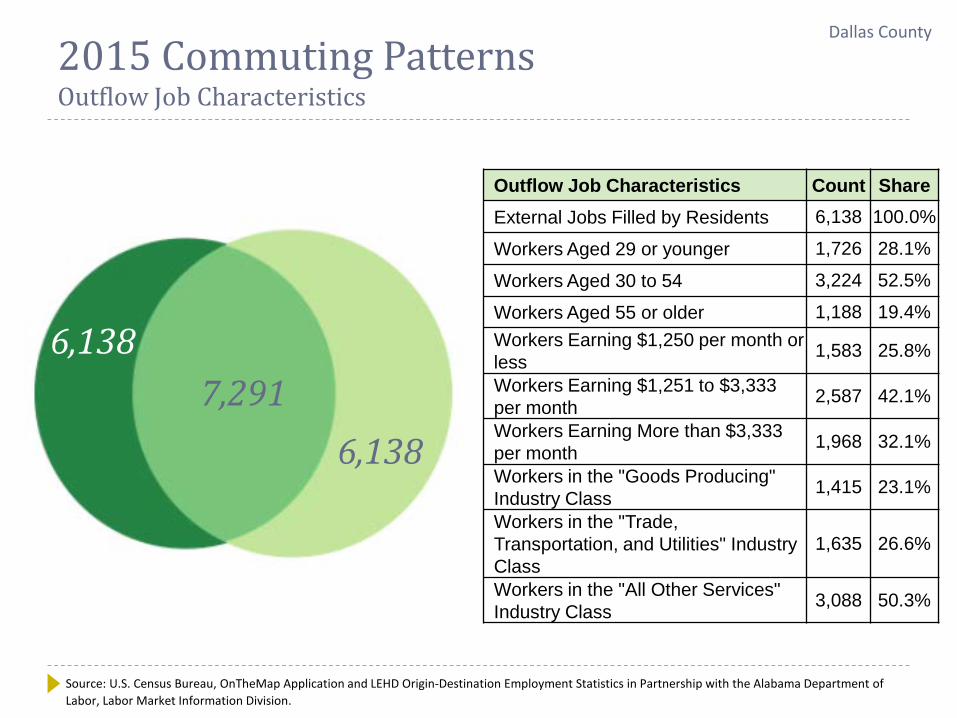
2015 Commuting PatternsOutflow Job Characteristics
Source: U.S. Census Bureau, OnTheMap Application and LEHD Origin-Destination Employment Statistics in Partnership with the Alabama Department of Labor, Labor Market Information Division.
Dallas County
Outflow Job Characteristics Count ShareExternal Jobs Filled by Residents 6,138 100.0%
Workers Aged 29 or younger 1,726 28.1%
Workers Aged 30 to 54 3,224 52.5%
Workers Aged 55 or older 1,188 19.4%Workers Earning $1,250 per month or less 1,583 25.8%
Workers Earning $1,251 to $3,333 per month 2,587 42.1%
Workers Earning More than $3,333 per month 1,968 32.1%
Workers in the "Goods Producing" Industry Class 1,415 23.1%
Workers in the "Trade, Transportation, and Utilities" Industry Class
1,635 26.6%
Workers in the "All Other Services" Industry Class 3,088 50.3%
3,994
6,1387,291
6,138
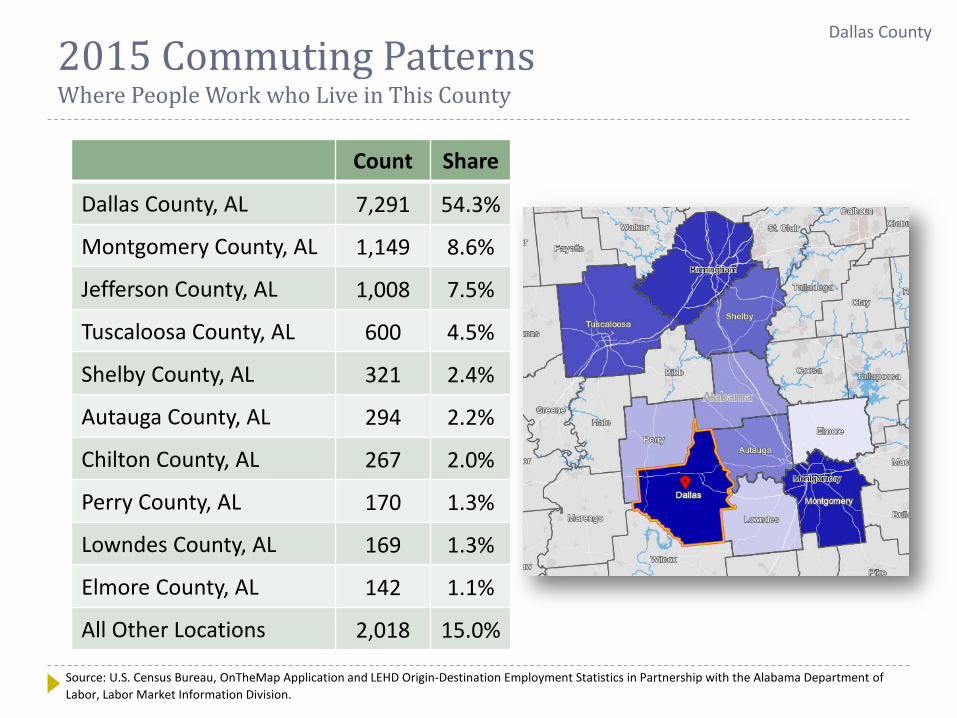
2015 Commuting PatternsWhere People Work who Live in This County
Count Share
Dallas County, AL 7,291 54.3%
Montgomery County, AL 1,149 8.6%
Jefferson County, AL 1,008 7.5%
Tuscaloosa County, AL 600 4.5%
Shelby County, AL 321 2.4%
Autauga County, AL 294 2.2%
Chilton County, AL 267 2.0%
Perry County, AL 170 1.3%
Lowndes County, AL 169 1.3%
Elmore County, AL 142 1.1%
All Other Locations 2,018 15.0%
Source: U.S. Census Bureau, OnTheMap Application and LEHD Origin-Destination Employment Statistics in Partnership with the Alabama Department of Labor, Labor Market Information Division.
Dallas County
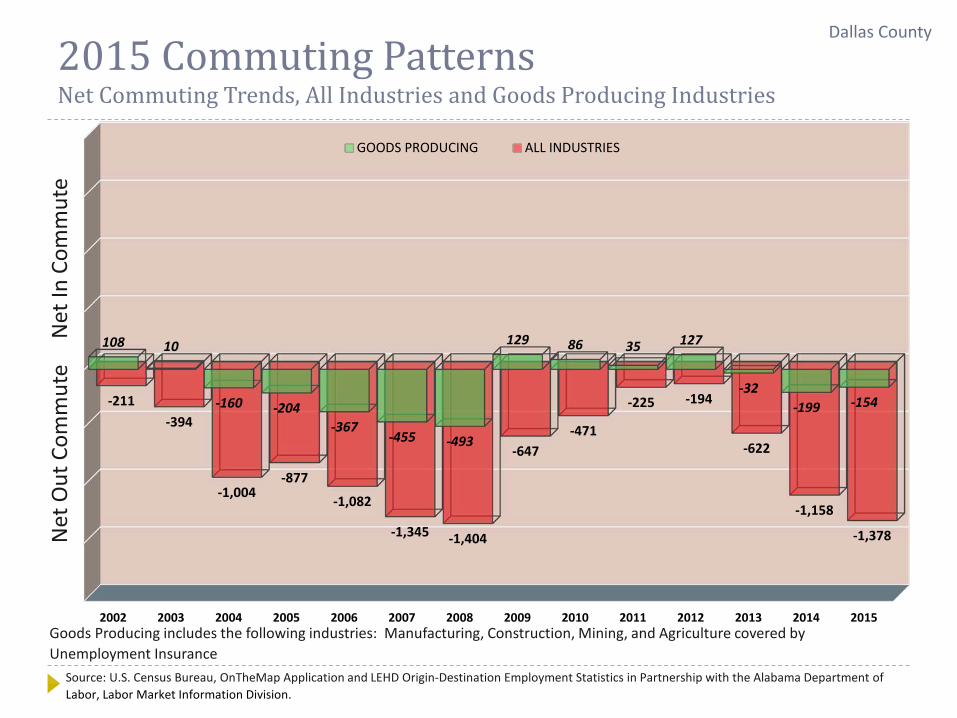
2015 Commuting PatternsNet Commuting Trends, All Industries and Goods Producing Industries
Source: U.S. Census Bureau, OnTheMap Application and LEHD Origin-Destination Employment Statistics in Partnership with the Alabama Department of Labor, Labor Market Information Division.
Goods Producing includes the following industries: Manufacturing, Construction, Mining, and Agriculture covered by Unemployment Insurance
Net
In C
omm
ute
Net
Out
Com
mut
eDallas County
2002 2003 2004 2005 2006 2007 2008 2009 2010 2011 2012 2013 2014 2015
108 10
-160 -204-367
-455 -493
129 86 35 127
-32-199 -154-211
-394
-1,004-877
-1,082
-1,345 -1,404
-647-471
-225 -194
-622
-1,158
-1,378
GOODS PRODUCING ALL INDUSTRIES
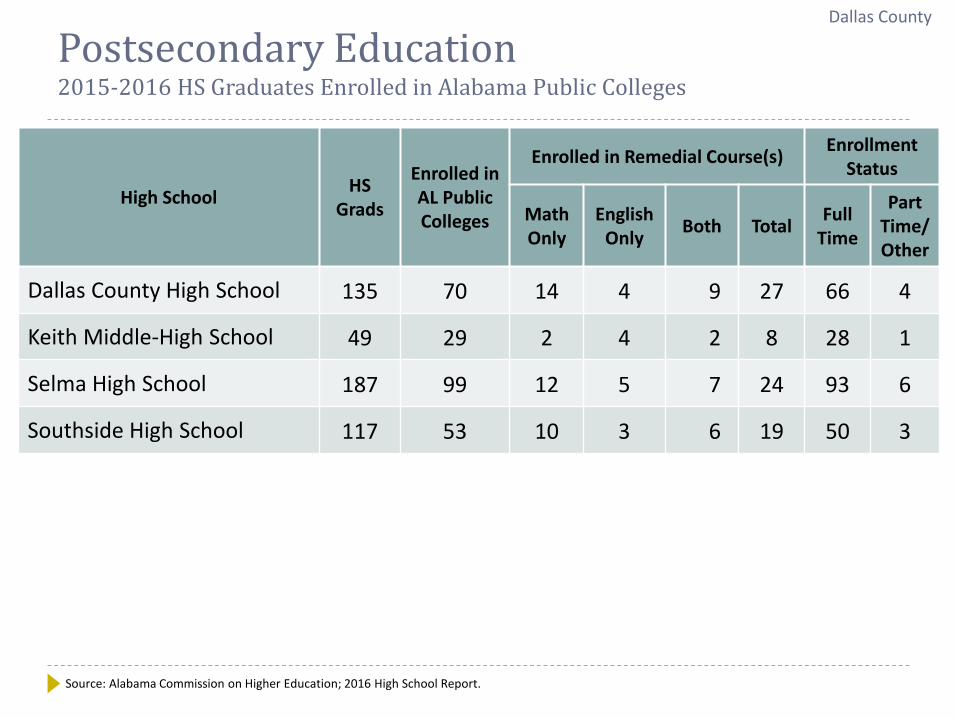
Postsecondary Education2015-2016 HS Graduates Enrolled in Alabama Public Colleges
High School HS Grads
Enrolled in AL Public Colleges
Enrolled in Remedial Course(s) Enrollment Status
Math Only
English Only Both Total Full
Time
PartTime/ Other
Dallas County High School 135 70 14 4 9 27 66 4
Keith Middle-High School 49 29 2 4 2 8 28 1
Selma High School 187 99 12 5 7 24 93 6
Southside High School 117 53 10 3 6 19 50 3
Source: Alabama Commission on Higher Education; 2016 High School Report.
Dallas County
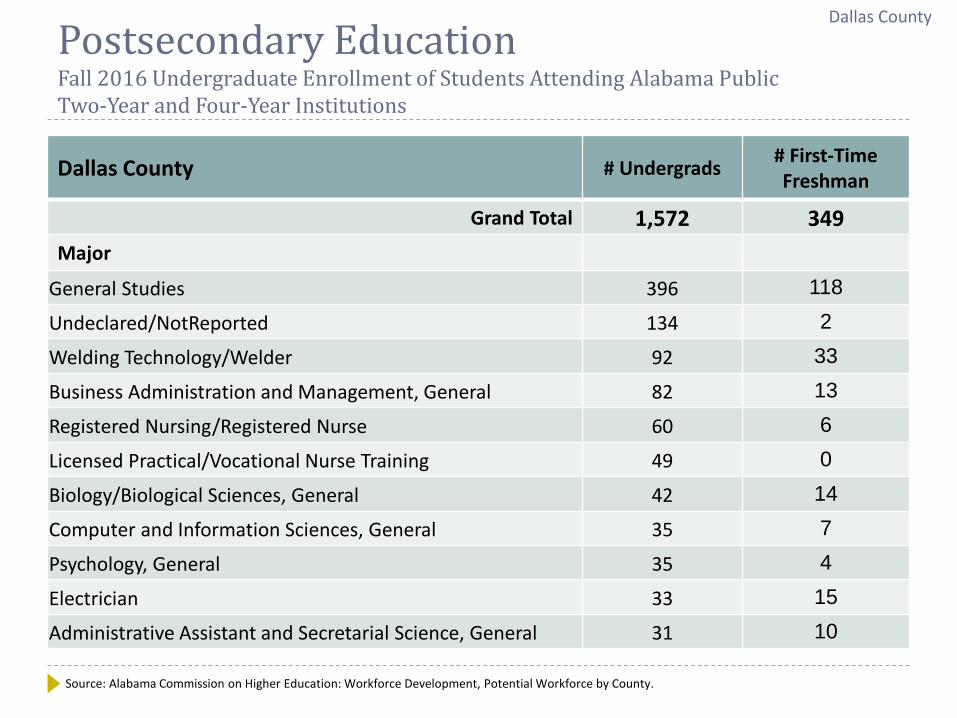
Postsecondary EducationFall 2016 Undergraduate Enrollment of Students Attending Alabama Public Two-Year and Four-Year Institutions
Dallas County # Undergrads # First-Time Freshman
Grand Total 1,572 349Major
General Studies 396 118Undeclared/NotReported 134 2Welding Technology/Welder 92 33Business Administration and Management, General 82 13Registered Nursing/Registered Nurse 60 6Licensed Practical/Vocational Nurse Training 49 0Biology/Biological Sciences, General 42 14Computer and Information Sciences, General 35 7Psychology, General 35 4Electrician 33 15Administrative Assistant and Secretarial Science, General 31 10
Source: Alabama Commission on Higher Education: Workforce Development, Potential Workforce by County.
Dallas County
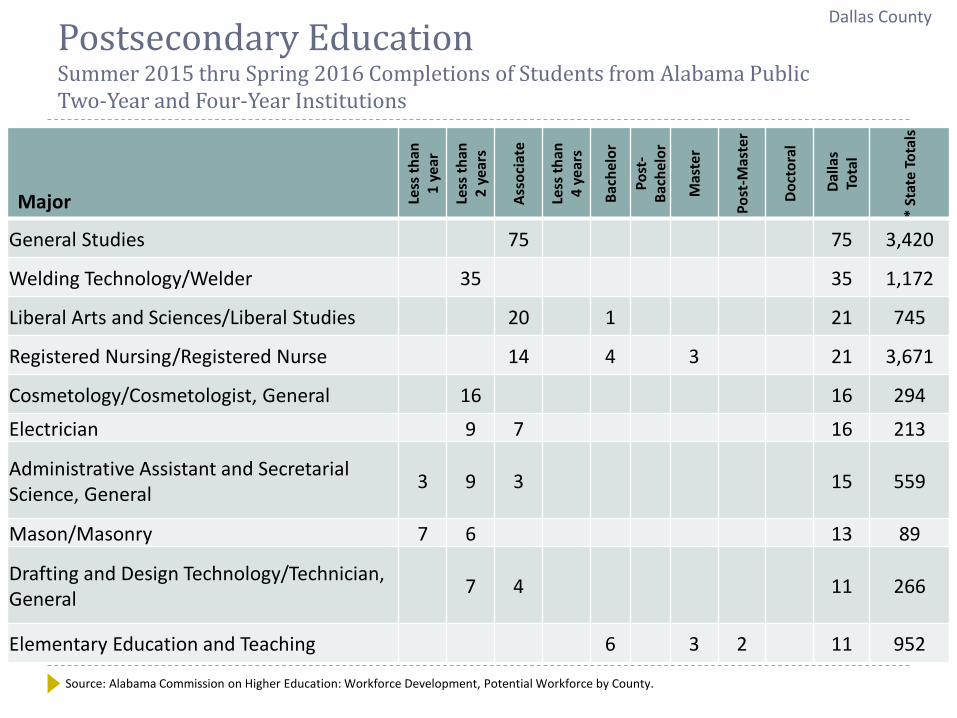
Postsecondary EducationSummer 2015 thru Spring 2016 Completions of Students from Alabama Public Two-Year and Four-Year Institutions
Major Less
than
1
year
Less
than
2
year
s
Asso
ciat
e
Less
than
4 ye
ars
Bach
elor
Post
-Ba
chel
or
Mas
ter
Post
-Mas
ter
Doct
oral
Dalla
sTo
tal
* St
ate
Tota
ls
General Studies 75 75 3,420
Welding Technology/Welder 35 35 1,172
Liberal Arts and Sciences/Liberal Studies 20 1 21 745
Registered Nursing/Registered Nurse 14 4 3 21 3,671
Cosmetology/Cosmetologist, General 16 16 294
Electrician 9 7 16 213
Administrative Assistant and Secretarial Science, General 3 9 3 15 559
Mason/Masonry 7 6 13 89
Drafting and Design Technology/Technician, General 7 4 11 266
Elementary Education and Teaching 6 3 2 11 952
Source: Alabama Commission on Higher Education: Workforce Development, Potential Workforce by County.
Dallas County
Alabama Department of LaborLabor Market Information [email protected]
Phone (334) 353-9096
These workforce products were funded by a grant awarded by the U.S. Department of Labor's Employment and Training Administration. These products were created by the recipient and do not necessarily reflect the official position of the U.S. Department of Labor. The U.S. Department of Labor makes no guarantees, warranties, or assurances of any kind, express or implied, with respect to such information, including any information on linked sites and including, but not limited to, accuracy of the information or its completeness, timeliness, usefulness, adequacy, continued availability, or ownership. These products are copyrighted by the institution that created them. Internal use by an organization and/or personal use by an individual for non-commercial purposes is permissible. All other uses require the prior authorization of the copyright owner.
Dallas County