d2.1 optimisation of district heating & cooling systems ... · optimisation of district heating...
TRANSCRIPT

OptimisationofDistrictHeating&Coolingsystems
D2.1:State-of-the-art,scenarios,requirementsandKPI
Deliverydate:2015-10-30 Deliverytype: Report
Version: V1.0
Disseminationlevel: Public
Maineditor: PauCortés
Contributors Allpartners
TheresearchleadingtotheseresultshasreceivedfundingfromtheEuropeanUnion'sHorizon2020Programmeundergrantagreementn°649796.

D2.1:State-of-the-art,scenarios,requirementsandKPIs
Page2of84
DOCUMENTINFORMATION
ProjectAcronym OPTi Grantagreementno 649796
Fulltitle OptimisationofDistrictHeating&Coolingsystems
ProjectURL www.opti2020.eu
DocumentURL
ProjectOfficer AntonioAguilo-Rullan
DeliverableID D2.1
Title State-of-the-art,scenarios,requirementsandKPI
WorkpackageID WP2
Title User-centricdesign,architectureandKPIs
DeliverydateContractual M6
Actual M8
VersionID
Maturity Final
Deliverytype Report
Disseminationlevel Public
MaineditorName PauCortés Email [email protected]
Partner Sampol Phone +34971764476
Abstract(public) ThisdeliverablesummarizestheresultsoftheworkconductedduringthestudyandanalysisphaseoftheOPTiproject.Thestartingpointfortheanalysiswasthe industrial and consumer needs, aswell as the current state of the art inrelevantareasofresearch.
Thereportprovidesarevisedstateofartinmodelling,controlandoptimisationofDHCsystems,passivestorageopportunitiesforDHCsystemsandAutomatedDemand Response and incentive mechanisms. Further, the key performanceindicators,use-casesandtherequirementsetfortheOPTisystemsolutionaregiven.
D2.1:State-of-the-art,scenarios,requirementsandKPIs
Page3of84
Keywords Stateofart,UseCases,Requirements,KPI,districtheatingandcooling,passivestorage,AutomatedDemandResponse.
Documenthistory
Issuedate Revisionno Maincontributor Revisioninformation
2015-10-06 0.1 Sampol,PauCortes Firstversion
2015-10-12 0.2 AUEB,YorgosThanos StateofArtrevision
2015-10-16 0.3 IBM,VikasChandan UseCase/Scenariosrevision
2015-10- 0.4 Optimation,PeterLingman KPIrevision
2015-10-27 0.5 TWT,YvonneRitter Requirementsrevision
2015-10-29 0.6 LTU,WolfgangBirk KPIrevision
2015-10-29 0.7 YAUEB,YorgosThanos Internalrevision
2015-10-30 0.8 LTU,WolfgangBirk Internalrevision
2015-10-31 1.0 Sampol,PauCortes Finalversion

D2.1:State-of-the-art,scenarios,requirementsandKPIs
Page4of84
EXECUTIVESUMMARY
TheOPTiprojectaimsto improvethebusinessoftheDHCindustrybyexploitingnewmethodologiesandtools basedonmodelling, analysis and control ofDHC systems. This project focusses onpassive storageopportunitiesanduserflexibility,topicsthathighlightedinthedifferentsectionsofthisdocument.
Deliverable2.1ispartoftheWorkPackage2(WP2:User-centricdesign,architectureandKPIs),wherewepresentourinitialstepsintheprojectandtheanalysisoftheindustryanduserneeds.Thisdocumentwillshowthelatestupdatesinthestateoftheartofthemaintopicsoftheproject,itwilldefinethedifferentscenarios or Use Cases that will take place during the project, a definition of themain KPIs, as well asfunctionalandnon-functionalrequirementsfortheOPTisolution.
Thisdocument isdivided in fourdifferentsectionswithdifferentobjectivespersection.Thesectionsarethefollowing:
• RevisedStateofArt:Alreadyintheproposalthestateoftheart isgiven,but ithasbeenrevisedconsidering new results and knowledge. The section studies the literature in different researchareas (RAs) such as modelling, control and optimisation of DHC systems, considering bothcommercialandopensource.Furthermore,thepassivestorageopportunitiesforDHCsystemswillbe reviewed, paying special attention in pre-cooling strategies in literature. And finally, recentadvancesofAutomatedDemandResponseandDR(DemandResponse)andDRmarketstatus,ADRstandardsand incentiveapplications. In the latter,attention todifferentcontractsand incentivesmechanismsdescribedinliteratureisgiven.
• Scenarios or Use Cases: Based on the analysis of the industrial and consumer needs, seven usecasesaredefined,fiveofthemwillbeapplied inthereal-lifetrialsandtheremainingtwowillbeconductedinthevirtualenvironment.
• Key Performance Indicators: The main KPI in the project are defined in detail including theirevaluation criteria. Those are the following: to reduce energy usage, to reduce peak loads, toincreaseuser thermal comfort flexibility, tobeable to represent real lifeevents,and to increaseeconomicbenefitfortheenduser,consumer,andtheutilitycompany.
• Requirements:TherequirementsofthesolutionproposedbytheOPTiprojectwillbesummarized.Therequirementsarepresentedinaccordancetoanon-functionalstructurewhichisrelatedtoapresumptivesystemarchitecture.
At the end of the document, there is an additional section with all the references quoted within thisdocument

D2.1:State-of-the-art,scenarios,requirementsandKPIs
Page5of84
TableofContents
1 Introduction......................................................................................................................................................7
2 Revisedstate-of-the-art....................................................................................................................................8
2.1 ResearchArea1:Modelling,controlandoptimisationofDHCsystems...........................................................8
2.1.1 Modelling......................................................................................................................................................8
2.1.2 ControlandOptimisation.............................................................................................................................9
2.1.3 Simulationanddataacquisition.................................................................................................................10
2.2 ResearchArea2:PassivestorageopportunitiesforDHCsystems..................................................................10
2.3 ResearchArea3:AutomatedDemandResponseandIncentiveMechanisms................................................12
2.3.1 AutomatedDR(ADR)..................................................................................................................................12
2.3.2 Incentivemechanisms................................................................................................................................19
2.3.3 ChallengesandhowOPTiwilladdressthem..............................................................................................25
3 OPTiCoreUseCases........................................................................................................................................27
3.1 UC-01:PeakLoadReduction(Mallorca).........................................................................................................27
3.2 UC-02:PeakLoadReduction(Lulea)...............................................................................................................30
3.3 UC-03:DecreasedsupplytemperatureintheDHnetwork(Lulea).................................................................34
3.4 UC-04:LimitationsinDHnetwork(Lulea).......................................................................................................38
3.5 UC-05:Optimizingvalves(Lulea)....................................................................................................................41
3.6 UC-06:EnergyReduction(Lulea)....................................................................................................................45
3.7 UC-07:ImprovedEfficiency(Lulea).................................................................................................................47
3.8 UC-08:OptimisingconsumerselectionandincentivesforADR(Lulea)..........................................................49
4 Requirements.................................................................................................................................................52
4.1 RQ-OF:OPTi-Framework.................................................................................................................................54
4.2 RQ-SI:OPTi-Sim...............................................................................................................................................54
4.3 RQ-OC:OptimisationandControlComponent................................................................................................55
4.4 RQ-PM:PhysicalModellingComponent.........................................................................................................58
4.5 RQ-CM:ConsumerModellingComponent......................................................................................................59
4.6 RQ-EM:EconomicModellingComponent.......................................................................................................60
4.7 RG-DS:DataManagementandStorage.........................................................................................................62
5 KeyPerformanceIndicators............................................................................................................................64
5.1 CoreKPI-1:ReducedEnergyConsumption......................................................................................................64
5.1.1 Interpretation.............................................................................................................................................64
5.1.2 Definition....................................................................................................................................................66
5.1.3 Assessment.................................................................................................................................................66
5.2 CoreKPI-2:ReducedPeakLoad.......................................................................................................................66
D2.1:State-of-the-art,scenarios,requirementsandKPIs
Page6of84
5.2.1 Interpretation.............................................................................................................................................66
5.2.2 Definitions..................................................................................................................................................67
5.2.3 Assessment.................................................................................................................................................67
5.3 CoreKPI-3:UserThermalComfortFlexibility..................................................................................................68
5.3.1 Interpretation.............................................................................................................................................68
5.3.2 Definitions..................................................................................................................................................68
5.3.3 KPIs.............................................................................................................................................................69
5.4 CoreKPI-4:Capabilityofrepresentingreallifeevents....................................................................................70
5.4.1 Interpretation.............................................................................................................................................70
5.4.2 Definitions..................................................................................................................................................71
5.4.3 Assessment.................................................................................................................................................71
5.5 CoreKPI-5:EconomicBenefit..........................................................................................................................71
5.5.1 Definitions..................................................................................................................................................72
5.5.2 KPIs.............................................................................................................................................................73
6 Conclusions.....................................................................................................................................................76
7 References......................................................................................................................................................77

D2.1:State-of-the-art,scenarios,requirementsandKPIs
Page7of84
1 INTRODUCTION
ThisdeliverablesummarizestheresultsoftheworkconductedduringthestudyandanalysisphaseoftheOPTiprojectand forms thebasis for thesubsequentwork in the technicalworkpackagesof theproject.Thereportprovidesarevisedstateofart inmodelling,controlandoptimisationofDHCsystems,passivestorage opportunities for DHC systems and Automated Demand Response and incentive mechanisms.Further, thekeyperformance indicators,use-casesandtherequirementset for theOPTisystemsolutionarepresented.

D2.1:State-of-the-art,scenarios,requirementsandKPIs
Page8of84
2 REVISEDSTATE-OF-THE-ART
The followingsectionsprovideanupdatedstate-of-the-art compared towhatwaspresented in theOPTiproposal.ThissectionisdividedintothreeResearchAreasrepresentingthemaintopicsofstudywithintheproject: modelling, control and optimisation of DHC systems; passive storage opportunities for DHCsystems; AutomatedDemand Response and incentivemechanisms. The summary of the state-of-the-artperareaispresentedsubsequentlyandwillfocusontheworkwhichisconductedindirectrelationtoDHCsystems.
Amore in-depth technical analysis of the state-of-the-art for thedifferent research areas the interestedreadercanrefertotheworkanddeliverablesofthedifferenttechnicalworkpackageswhereeachresearcharea isexplicitlyaddressed.There,relatedworknotdirectlyrelevantforDHCsystembutrelevantforthedevelopmentoftheunderlyingtechnologiesfortheOPTi-Frameworkwillbeassessedandpresented.
2.1 RESEARCHAREA1:MODELLING,CONTROLANDOPTIMISATIONOFDHCSYSTEMSDistrictHeatingorCooling(DHC)systemsaredesignedtosupplybuildingsforbothprivateandcommercialinterestswithenergyforspaceheatingandcooling,aswellastoprovideheatfortapwaterheating.Suchsystemsare first and foremostdesigned tobe robust, such that thedeliveryof heat and cold is certain.Secondly,thesesystemsneedtobeefficientandsustainable.Nowadays,thereisanincreasedfocusontheefficiencyofsuchsystemstoreducetheusageofnon-renewableprimaryenergysourcesandtheamountofenergythatisusedforspaceheatingandcooling.
Whilethelongtermbehaviouriswellunderstood,short-termfluctuationsrequireadeeperunderstandingof the imminent behaviour of such systems. Consequently, there is an evident need to understand thedynamicsof sucha system todesignefficient control andoptimisation schemes,which facilitate amoreefficientuseoftheenergysources.
Modelling isnowadays recognizedasanefficient tool tonotonlyunderstands thebehaviourof complexphysical systems,but also todesignandvalidateoperational strategies and controlmechanismsprior totheirdeploymentintheplant.
2.1.1 Modelling
Despitethefactthatdistrictheatingsystemshavebeenavailableformorethanahundredyears,dynamicmodels for such systems for simulation, control and optimisation purposes have only been proposedrelativelyrecently.Someexamplescanbefoundin(Larsen,2002),(Chow,2004),(JohanssonC.,2005),and(Nielsen,2006).Thesemodelsaremainlydealingwithsystemanalysisandsimulationofthebehaviourofsuch systems, with many of them adopting simplified models that do not consider the impact of thetemporalcomponent thatdepicts thedynamiceffectsontheDHCsystem. In (Jie,2012)onthecontrary,partial differential equations are used to model the complete dynamic system, but they employsimplificationstodrawdirectconclusionsanddonotusetheoriginalequationsdirectly.
Typically,DHC systems can be decomposed in three parts:heat or cold generation (production),heat orcold distribution,heat or cold consumption1.While thegeneration part can be understood as a processindustrialsystem,modellingofsuchasystemismatureandavailableforthedifferentcomponentsthatcanbe used. Looking at the distribution part,most energy gridmodels originate from the one dimensional
1Inthefollowing,thetermsheatandcoldwillbeusedasanentitiesthatcanbesupplied,demanded,deliveredandgeneratedinaccordancewiththeunderstandingin(Frederiksen&Werner,2013).

D2.1:State-of-the-art,scenarios,requirementsandKPIs
Page9of84
lineartransportpartialdifferentialequationcorrespondingtothepipe(fluid)temperature,see(Jie,2012),(Kicsiny,2014).Thisequationcanbetreatedinmanydifferentways,likesimplifiedintoastaticmodelthatsumsupthesystem’ssteadystatebehaviouranddropsthedynamicbehaviourofthesystem(Andersson,1993), transferred into ordinary differential equations (Gabrielaitiene, 2007) or a simplified delayeddifferential equation (Kicsiny 2014). In general, the building thermal energy models have a similarcomplexityandsimplificationapproachesthatvaryfromsimplestaticrelationsuptohighordernon-lineardifferentialequations.
Recently,theEnergyinBuildingsandCommunitiesProgrammeoftheInternationalEnergyAgency(IEA-EBCProgramme)haspresentednewcomputational tools forbuildingandcommunityenergy systems (Annex60). The results of this work yield an open-source approach to modelling which will enable thedevelopmentofsimulationandanalysistools.TheworkisbasedontheModelicamodellinglanguageandFunctionalMock-upInterface(FMI)standards(Wetter2013).These“open-source”effortshavereceivedahighlevelofattentionfromresearchersaroundtheworld,andmanyimplementationsweredevelopedincompliancewithit,likee.g.AixLib(RWTH-EBC2014)andFastBuildings(DeConinck,Magnusson,Åkesson,&Helsen, 2015). While the open-source trend is driving an accelerated development, from a commercialperspectivethereisalackofcertificationandservicelevelagreementswhenitcomestothefitnessforthepurpose.
From a commercial perspective, there are different tools available which aid the engineer in design,deployment, commissioning and operational optimisation of DHC systems, see e.g. the Termis software(Schneider-Electric,2012),TRNSYS(Klein2004),andNetsim(Vitec,2012).Unfortunately,thesetoolsbuildupon static models of the system considering only the spatial characteristics of the network, whichpreventstheinvestigationandunderstandingofshort-termfluctuations.
RepresentingthedynamiceffectsofaDHCsystemrequireslargescaledynamicmodelswhicharetediousand difficult to build and, moreover, require substantially more computational power. From a moreforwardsightperspective,theuseofvirtualizedplantsorplantshadowsisforeseenasanessentialtoolinthedesign,operationandmaintenanceofflexiblelargescalesystems.RoadmapsandstrategicagendaslikeIndustry 4.0 (Ferber 2012) and the Spire PPP Strategic Agenda 2030 (Tello &Weerdmeester 2013), dopromotetheuseofvirtualizedplantsasakeyenablerformoreresourceefficientproductionsystems.
2.1.2 ControlandOptimisation
Optimisation is one of the objectives of any control system (Singh 2010) and process control aims atoptimizingthebehaviourofthedynamicalsystemovertime.Thus,assoonasdynamicmodelsforasystemareavailable,advancedcontroltechniquescanbeemployedtomaketheoperationandcontrolofasystemmoreefficientandresilienttowardsfaultsanddisturbances.
District heating and cooling systems make use of the process control paradigm which means that thecontrol system is organized in hierarchies with local low level control loops (mostly single input/singleoutput)andsupervisoryandsetupcontrolonthehigherlevel.
The above mentioned software tools Termis and Netsim do allow for an optimisation of the networkoperation using tailoredmodules, but do not go down to the substation level and do not consider thedynamicsoftheDHCnetwork.Twodifferentlevelsneedtobedistinguishedhere,systemlevel(SL),whichis the completenetwork fromgenerationplants to the consumer substation, and thebuilding level (BL),whichisfromthesubstationdowntoradiatorandHVAClevel.
Buildingcontrol isahighlyexploredareaofresearchandinnovations,withaplethoraofpublicationsandsolutions. However, most efforts are targeting commercial buildings with a higher level of energyconsumption(Xu,2008),(Popescu,2009),(Halvgaard,2012),disregardingsmallbuildingsandhouseswherethedegreeofautomation is far lowerand theneed for low-cost solutions isessential (Gustafsson J.D.,2010),(ArrowheadProject2013).Nevertheless,companieslikeVitec(Vitec,2015),Abelko(Abelko,2015)andNoda (Noda,2015)provide services forbuildingmanagementandcontrolofbuilding climate.These
D2.1:State-of-the-art,scenarios,requirementsandKPIs
Page10of84
solutionsoffercentralizeddataaggregationandmonitoringtools,whichenablehistorictrackingoftrendsandevents.
Regarding the system level, there are several approaches for the operational optimisation of a systembasedonloadprognosisthatvarieswithconsumption,weatherandradiationconditions(Dotzauer,2002),(Grzenda, 2012), (Steer, 2011), (Henning, 2006). Such model-based predictions are the basis for modelpredictive control (MPC) schemes, which enable the usage of online optimisation and regulation at thesame time by considering constraints in the system that can result from economical, consumer andenvironmentalperspective,e.g.(Agrell,2005),(Deng,2010),and(Molyneaux,2010).TheMPCconceptcanalsobe furtherextendedbymakinguseofenergystorageaspectsandscheduling in thebuildingcontrolcontextasdiscussedby(Touretzky&Baldea,2014),whichisimportantinthecontextofResearchArea2.
Whilebuilding control iswidelyaddressed,more simplistic control schemesdominateon theproductionanddistribution side. Those schemesbenefit from theappropriate selectionof control structures. In thedistrict heating system, which is categorized as a large-scale dynamic system, the control strategy andplant-widecontrolaspectsplayavitalrule.Theplant-widecontrolorcontrolstructuredesignproblemcanbeexplainedastheproblemofdefiningthecorrectapproachtoachievetherequiredobjectivesfromtheplant(Skogestad,2000).Itincludestheselectionofcontrolledandmanipulatedvariables.Thatwillenabletheselectionofthecontrolstructureconfigurationandthecontrollertype.
Although there isaplethoraofpublicationson theappropriateselection,currently therearenooff-the-shelftoolstosupporttheengineers.Afirstapproachinthatdirectionisdescribedin(Birk,2014),whereasystematicapproachandsoftwaretoolisproposed.Further,theapproachesdiscussedby(Bendtsen,2013)provideanopportunitytoreconfigureoveractuatedsystems.InthecontextofDHCthisisnotconsideredforthetimebeing.
2.1.3 Simulationanddataacquisition
Oneofthemostimportantaspects,whenusinganyonlinesimulationtoolorcontrolscheme,istheneedtokeepthesimulatorandthemodelsuptodatewiththereal-lifesystem,inordertoensuregoodsystemperformanceandprognosis.(Nielsen,2006)providesasolutiontothisproblembyupdatingmodelsbasedonmeasurementdata fromthenetwork,whichcanbecombinedwithanefficient solution toaggregatedatafromthenetworkdowntothebuildinglevel(Gustafsson,2011).However,aremainingdifficultyisthedata acquisition at the end-consumer side,which is usually not available beyond the substation level.With the recent advances in the commercial building automation technologies it is possible to providemoreusefulmeasurementdatathatwill improvetheperformanceofsimulators,e.g.,usingtheproductsfromabovementionedcompanies(Vitec,2015),(Abelko,2015)and(Noda,2015).
2.2 RESEARCHAREA2:PASSIVESTORAGEOPPORTUNITIESFORDHCSYSTEMSOneapproachforreducingpeakloadsinDHCsystemsistoutilizethethermalstoragecapacitiesofexistingbuildingstructures, i.e.passivestorage. Inparticular,ceilingsandwallsandeventheair insideabuildingcanbeusedtoaccumulateenergyinoff-peakhours.
The potential of passive storage has been studied in the past, for example comparing different controlstrategiesofpre-coolingofbuildings.In(BraunJ.E.,2001),itwasshownthatbychangingthesetpointofcertain temperature zones,more than20%of cost savings couldbeobtained, dependingon the controlstrategy(seeTable2below).

D2.1:State-of-the-art,scenarios,requirementsandKPIs
Page11of84
Table1:Savingspotentialofdifferentcontrolstrategiesfrom(BraunJ.E.,2001)
Strategy Savings(%)
Baseline 0
Lightprecool 17.1
Moderateprecool 18.7
Extendedprecool 22.7
Asimilarstudywasperformedin(HenzeG.P.,2004),wheretheexploitationofacombinationofactiveandpassivestorageforthereductioninpeakenergydemandwasexplored.
(LeeK-H,2008)applieddemand-limitingstrategies,exploringdifferenthoursofstartingthepre-cooling.,itcanbereducedabouta30%ofpeakloadsfora5-hon-peakperiod(of1PMto6PM).
(MorganS.,2007)havestudiedtheefficiencyofdifferentpre-coolingstrategiestakingintoaccountvariousparameters includingbuilding locationandbuildingmass level,pre-coolingcontrolstrategy(none,4h,8h12hofprecooling)andtime-of-useutilityrate.Thestudyrevealedthat4-8hpre-coolingperiodsweremoreeffectivethan12hprecoolingforcostsaving.Thefollowingtableshowsthesavingsachievedbydifferentprecoolingstrategiesforbuildingswithdifferentmasslevelsindifferentlocations:
Table2:Table.Estimatedmonthlycostandsavingsbycontrol,masslevelandlocation(MorganS.,2007)
Control Buildingmasslevel(kg/m2)
Location1Boulder
Savings(%)
Location2Chicago
Savings(%)
Location3Madison
Savings(%)
Location4SanFrancisco.
Savings(%)
4hprecooling 513.7/256.9/85.6 10.8/15.5/15 14.3/20.3/18.7 13.8/18.1/18.0 10.2/13.4/13.2
8hprecooling 513.7/256.9/85.6 16.4/21.4/20.2 23.0/28.3/26.2 21.9/26.7/25.6 14.9/18.5/17.4
12hprecooling 513.7/256.9/85.6 17.2/22.8/20.1 22.9/28.8/24.9 22.0/26.9/24.2 15.1/18.2/16.5
Inthepast,thestudiesaboutpassivestoragefocussedontheanalysisofrelevantinstallationparameters(buildingmass,timeofpre-cooling…),obtainingthebeststrategysettingthezonetemperatureset-points,in order to optimize the energy consumption. These strategies to minimize peak load applied semi-analytical averaging methods, exponential set-point equation-based semi-analytical averaging methods,load weighted-averaging methods, in conclusion, static set point trajectories methods. Nowadays, thecentreofinvestigationsconcerningmethodsforbuildingcontrolisModelPredictiveControl(MPC),whichiscapableofdealingwiththehierarchyofHVACsystems(forecastingerrorsinweather,occupancy…).MPCusesmathematicalmodelstoforecastsystemparametersinordertotakeactionsincontroloptimizinginanopen-loopcontrolsequence.Forexample,(FreireR.,2007)appliedMPCtooptimizeusercomfortandenergysavingsinHVAC.
(Oldewurtel,F.,2008)usedMPCforaroom-basedHVACcontrolconsideringtheerrorinweatherforecastin a stochastic model. In (Henze G, 2010), the influence of different parameters (weather conditions,buildings size and utility price rate conditions) was studied with regard to the passive thermal storagecapacity,andguidelineswereproposedfortheapplicationofbuildingcontrolstrategies.

D2.1:State-of-the-art,scenarios,requirementsandKPIs
Page12of84
Further, (Yin R, 2010) introduced a tool called Demand Response Quick Assessment Tool (DRQAT) toanalyse optimal pre-cooling strategies. They describe the procedure used to develop and calibrate theDRQATsimulationmodels,andapplythisproceduretoelevenbuildings ina fieldtest. Inthesetests, thepeakdemandcouldbereducedby15-30%withtheuseofautomaticdemandresponse.
Morerecently, in(MesutAvcia,2013),aMPCstrategy isproposedenablingtheutilityproviderstoadoptefficientdemandmanagementpoliciesbyusingreal-timepricing.Twoexperimentaltestsaredescribedinthisarticle.First,theMPCprocessiscomparedtotheconventionaltwo-positioncontrolapproachunderafixedtemperaturesetpoint.Theresultingsavingswereintheregionofa5%withinusercomfortboundaryconditions. In addition, the Temperature Set-point Assignment (TSA) algorithm is used to control thetemperatureset-point,whichincreasesthesavingstoabout15%intotalconsumptionandtoabout40%inpeakhours.
Physicsbasedmodelling-alsoknownaswhiteboxmodelling-asundertakeninthereferencescommentedinthisdocument,hasitslimitationsonaccuracyandrequiresasignificantamountoftrainingdata,whichmightnotbeuncomplicatedtoobtain.Ontheotherhand,blackboxmodelsrequirealongtrainingperiodand large forecasting errorsmay occur if themodel is applied under deviating conditions (themodel islimitedtobuildingoperationconditionswhichitwastrainedfor).Therefore,ahybridmodellingapproach,orgreyboxapproach,isproposedin(BraunJ.E.,2002)forthermalmodellingofbuildingstructures,whichseekstoovercomethelimitationsofthewhiteboxandblackboxmodellingapproaches
In thisproject,wewillemployagreyboxapproach forbuildingmodelling to investigate thepotentialofpassivestorageforDHCnetworks.Keyfactorstobeconsideredarecomputationalcost,hardware/sensingrequirements for data collection and accuracy (as established through field testing). The use of passivestoragehasabigpotentialintheuseofpeakloadreductionwithoutasignificantreductionofusercomfortandwithasmallinitialinvestment.Thispotentialwillbestudiedwithintheproject,usingdifferentcontrolstrategies for two very different trials: buildings with small inertia (domestic houses in Lulea) and onebuildingwithbiginertia(SonLlatzerHospital,inMallorca).
2.3 RESEARCHAREA3:AUTOMATEDDEMANDRESPONSEANDINCENTIVEMECHANISMS
2.3.1 AutomatedDR(ADR)
2.3.1.1 DR,ADRfundamentalsandrelationtoDHCsystems
Demand Response (DR) programs with integrated resource planning, short term strategies and otherrelevant approaches and techniques can be effective solutions to ensure the reliability and stability ofenergygrids.However,asmartgridisenvisionedforthefuturetoemployadvancedcontrolsandtwo-waycommunication capabilities to integrate smart supply-side and smart-demand side technologies andactivitiesseamlesslyandinreal-time.Conventionalapproacheslackthedegreeofintelligentintegrationofresources that is ultimately envisioned for this future smart grid and comprises, in essence, of two-waycommunicationsandautomatedcontrolstointegratesupplyanddemandeffectivelyandrapidly.
Suchan integrated solutionofmatching supply-side strategieswithautomatedandnearly instantaneousdemand-side alternatives is essential for optimal grid performance. The components of the integratedsystemshouldsupportandinteractwithoneanothertocontributetoadynamicinfrastructure,aswellasbe capable ofworking in unison to optimize systemoperations based on customer requirements, utilityconstraints,marketincentives,andothervariables.ThissolutioncouldbeviewedasanevolutionfromthetypicalDRprogramstonewones,whichsupport integratedresourceoperationsthatmarrydemandwithsupply nearly instantaneously. This next generation of DR should bemore automated and coupledwithcontracts, by means of which customers will commission the utility company to control their demand(underwell-definedterms),whilereceivingacompensationforthisauthorization.Also,thisnewtypeofDRmaybelinkedtosomeformofenergystorage,inordertoquicklyrespondtochangesinsystemfrequency

D2.1:State-of-the-art,scenarios,requirementsandKPIs
Page13of84
or to increase demand during periods of oversupply,which improves the utilization ofmany renewableresources,aswellastraditionalthermalunits(FERC,2010).AutomatedDR(ADR)isakeypartofthisnewintegratedresourceoperationsapproach.
ADRisbasicallyusedtodescribeasystemthatautomatestheDRdispatchprocess,fromthegridoperatortotheDRaggregator(ifinvolved)totheend-usecustomer–allwithoutanymanualintervention.Despitethepopularity thatADRhasgainedhitherto, its implementation canbeprimarily found in theelectricitygrids,whileanyattemptforitsapplicationinDHCsystemsiseithernotdocumentedorinscrutable.Forthatpurpose, in thissectionweattempt tosketchthemarketofADRbypresenting thevarious typesofADRprograms,whicharecurrentlyavailableworldwide,inordertocapturethebenefitsandidentifythemarketopportunitiesfromitsexploitationinDHCsystems.
Sofar,electricityprovidershaveeitherreliedonoperatorsofdifferentcustomersitestomanuallyturnofflights,equipment,andsystemsorrundirectloadcontrol(DLC)programsthatgavethecustomerslittletono freedom of choice in how they participate. However, thesemodels are not scalable beyond certaincustomersegments (NavigantResearch,2014).Today’scustomersexpectmorehelp fromtechnologyanddemandmoreflexibilityintheiroperationsfromtheutilitycompany.ADRisthemostpromisingalternativeinboththecommercialandindustrial(C&I)andresidentialsectorsandcanprovidemorereliableandfasterrespondingDR,sinceitautomatestheDRdispatch(DRsignal/notification)process,fromthegridoperatorto the DR aggregator (if involved) to the end-use customer -all without any manual intervention- andutilizes already appliedmethodologies, such asDLC programs. There are a number of drivers that pointtowardincreasedADRadoption;(NavigantResearch,2014)forecaststhatglobalspendingonADRwillgrowfrom $13 million in 2014 to more than $185 million in 2023. For example, in typical emergency DRprograms, ADR can help penetrate smaller facilities that may not have advanced internal controls.Meanwhile,newmarkettypes, likeDHCsystems,ancillaryservices,etc.areopeninguptoDR.Thesefast-response,high-riskprogramsstronglyencourage–ifnotrequire–automationforparticipation.
ThechangingresourcemixinelectricgridsaroundtheworldisalsocreatingmorepotentialforDRtoplayapivotal role. As coal and nuclear plants retire, clean replacements are needed that can be built in shorttimeframes.Conversely, as large-scale intermittent renewable resources likewindand solarpower fill inthisgap, theyrequirebackupsolutionswhenthewind isnotblowingandthesun isnotshining.Bothofthesesituationscallforflexibleresources,andADRhasgreatpotentialtomeettheseneeds.Whenneeded,theautomationfeaturecancurtailloads,initiateback-upon-sitedistributedenergyresourcesatcustomersites,andultimatelyfeedexcesspowerfromthecustomer’sdistributedenergyresourcesbacktothegrid.Table3summarizesthebenefitsofexploitingtheADRcapabilities.
Table3:BenefitsofADR
AutomatedDemandResponseBenefits
AddingvaluetotraditionalDRefforts:ADRprogramsaredrivingdeeperintheload-shedequation,andpresentmoresuccessfulresults--theeffectsoftheprograms'repeatable,scalableandflexibleload-reductioncapabilities.
ADRprogramsremovethemanualinvolvementrequiredofcustomers,ensuringoptimal,accurateload-reductionmeasuresoccurinresponsetoutilitypricingsignals.
This flexible, open technology is paving the way for accessing hard-to-reach commercial andindustrial customers, but it is also applicable to other customers, including residential and smallcommercial.
Participantscansavemoneyorsavourbettertariffsduringpeakpricingperiods.

D2.1:State-of-the-art,scenarios,requirementsandKPIs
Page14of84
Utilitiescangaindirectinsightintoavailablecustomerloadsduringpeakperiodsandadirectlinktoshedavailableloadsinaprecise,near-immediateway.
Improving grid stability, by helping utilities reduce carbon emissions and thus avoiding bringingidlingpeakingplantsonline.
Currently, almostall of theADRactivity is takingplace in theUnitedStates. This leadershippositionwillerodeoverthenext10yearsasallinternationalregionscontinueorstartthepilotphaseofADRandthenbuild out full-scale markets or programs (NavigantResearch, 2014). Europe is a more unified story ofmoderate, methodical advancement based on a combination of opening market opportunities andrenewableresource integration.ADR inEuropewillnotexperiencetherapidexpansionthatwilloccur inAsiaPacific,butitwillhaveafastergrowthpacethaninNorthAmericaasnewmarketopportunitiesopen.
Figure1:ADRinEurope(NavigantResearch,2014)
InorderforADRtobefunctional,automationatthecustomersitebecomesafoundationalelementofthesmartgrid.Ingeneral,automatingtheenergycurtailmentsequenceofselectedfacilitiesmakesiteasierforthecustomerstoparticipateinDRprogramsandhelpsthemmaximizetheirDRearnings,whileincreasingtheir value to the grid bymaking the energy reductionmore reliable.Usingmodern control equipment,providerscansendaremotesignaltocustomers’facilitytoinitiateanautomaticcurtailmentsequence–oran ADR event - that is pre-configured for each customer (EnerNOC, n.d.). In exchange for allowing theprovidertosendtheseremotecurtailmentsignals,customersarenotonlyenrolledinanADRprogramthatpaysthemforeachmonthofparticipation,butalsotheyareeligibleforasubstantialone-timeincentivetopay for control system equipment upgrades. A critical element of adding to this DR participation andexpanding its impacts resides in theuseof theproper financialor/andbehavioural incentivesordynamicpricing alternatives that motivate customers to act. As stated in literature (PG&E, 2014), ADR providesincentives and technical assistance, as well as encourages customers to expand energy managementcapabilitiesbyparticipatinginDRprogramsusingsemi-orADRcontrolsaswellasmanagementstrategies.ADRincentiveprogramscanbecoupledwithapplicableandapprovedenergyefficiencyrebates.
LevelsofautomationinDRcanbedefinedaspresentedinFigure4(Goldman,2010).Inparticular,manualDRinvolvesalabor-intensiveapproachsuchasmanuallyturningofforchangingcomfortsetpointsateachequipmentswitchorcontroller.Semi-ADRinvolvesapre-programmedDRstrategyinitiatedbyapersonviacentralised control system. Fully-ADR does not involve human intervention, but is initiated at a home,buildingorfacilitythroughreceiptofanexternalcommunicationsignal.Thereceiptoftheexternalsignal

D2.1:State-of-the-art,scenarios,requirementsandKPIs
Page15of84
launches pre-programmedDR strategies.One important concept of ADR is that a homeowner or facilitymanager should be able to “opt-out” or “override” a DR event, if the event comes at time when thereductioninend-useservicesisnotdesirable.
Hence,customersmayselectfromtwoDRprogramoptions:ADRorsemi-ADR.Customersthatarewillingtoparticipate in theseprogramshave theopportunity for financial incentives fromtheprovider. Inmostcases,thefirst incentiveisforsigningupforaprogram,wherethecustomergetsaone-timepaymenttosignacontractbasedontheKWhreductiontargettobeachieved.AftertheKWhreductionisset,thereisatestfortheprogram.Thisgivesthecustomertheabilitytounderstandtheloadsthroughoutthefacilitiesandtorealizewherethetargetreductionscanbeaccomplished.Thesecondincentiveisvestedaccordingtocustomersmeetingtheperformancegoal.
Table4:LevelsofDemandResponseAutomation(Kiliccote,2005).
Level UsingBuildingAutomationSystem(BAS)
HowResponseOccurs
ManualDR No Peoplemanuallyturnofflightsandequipmentwhenaskedtodoso.
Semi–ADR Yes Aperson initiatesacontrolstrategy -preprogramed intotheBAS -whenaDReventiscalled.
FullyADR Yes Receipt of an external price signal, reliability or event signalautomatically triggers a BAS control sequence that switches thebuildingtolow-powermode;nohumaninterventionisrequired.
2.3.1.2 MarketsurveyonimplementedADRprograms
TheopportunitiesforDRinEuropearegrowingrapidly,especiallyinthefieldsoftechnologyandservicesvendors. Similar with the United States, where DR mostly focuses on alleviating the summertime peakloads,Europedoeshavesomeelectricheatingpeakloads.However,thecontinent’sbiggerdriversforDRneedsarethesystem-wideeffectsofthegrowingshareofintermittentwindandsolarpower.
Currently,theenergymarketinEuropeisundergoingamajortransformationwithnewregulationsacrossthe European Union (EU), as well as at an individual country or regional level. Regulatory environmentbarriers inEuropearegraduallybeingremoved,despiteahistoricalresistancetotheuseofdemand-sideresourcesandprograms, suchasDR.Governmentand regulatoryagencies inmanyareashavebegun tochangethelawsaffectingtheuseofDR.SeveralmajorcountriesandgeographicareasinEurope,includingthe United Kingdom, France, and Ireland, are planning to introduce a capacity market that will furtherincreasetheadoptionofDR.

D2.1:State-of-the-art,scenarios,requirementsandKPIs
Page16of84
Figure2:DRactivityinEurope(SEDC,2014)
The growing number of new entrants, especially aggregators, is another indicator that the market isbecoming increasingly attractive to DR providers. KiWi Powers, Flexitricity, RWE nPower, NegawattBusiness Solutions, Entelios, and Open Energi are relative newcomers as aggregators and energymanagementproviders in thisburgeoningDRmarket.NavigantResearchestimates thatEuropehas1.87millionresidentialandC&Isitesengagedinloadreductionin2013.Thisaccountsforapproximately18%ofDRsitesthatexistglobally.
Figure3:ResidentialandC&Isitesengagedinloadreduction(NavigantResearch,2014)
ArecentanalysisofthecurrentretailmarketdesignsinEuropeshowsthattheparticipationofcustomersinactive demand is also a major opportunity for transmission service operators (TSOs) in balancing theelectricitymarkettransactions(andthereforeintheenergyefficiencyoftheoverallelectricitysystem).Theflexibilitytomaintainbalancebetweenelectricpowersupplyanddemandhasbeensofarmostlyprovidedbythegenerationside,whichisstilldominatedbycentralized,large-scaleflexiblydispatchable(fossilfuelandhydrobased)powerplants.Thefuturegenerationmixwillbemoredecentralized,lesspredictableandless flexible to operate, as a consequence of the large-scale integration of renewable and distributedenergysourcesinordertomeetdecarbonisationtargetsoftheelectricitysectorsetatEUlevel[8].
European policy makers recognize the necessity and value of demand response as a novel means offlexibility.Yet,ashifttowardsmoreactivedemandresponserequiresamajorconceptualshiftofexisting

D2.1:State-of-the-art,scenarios,requirementsandKPIs
Page17of84
electricitymarkets inEurope:customersneedtoberecognizedasasourceofflexibilityfortheelectricitysystem and they need to be encouraged to become active providers of flexibility. To that end,empowermentandprotectionpoliciesmustbedesignedinorderforcustomerstoplayanewrole.
So far, the participation of European customers, which account for about 70% of final electricityconsumption,hasbeenlimitedbytheabsenceofrealtimemeteringinfrastructureandsmarterelectricitygrids. The implementation of DR programsmust be based on the knowledge of real time variations ofelectricitymarketpriceswiththehelpofbothnewmeteringdevicesanddemandcontrolcentres,inordertoaggregateindividualdemandresponsesintodemandresponsevolumesthatarebigenoughtobetradedonmarketplaces.
The overwhelming majority of DR participants come from the residential sector with an overallparticipation rate. This is primarily due to the conventional time-of-use (TOU) programs in the UnitedKingdomandFrance.Today, theUnitedKingdomhas the largestnumberofDRparticipants, followedbyFrance. The United Kingdom’s leading position is predominant due to a large number of householdsenrolled in long-establishedTOUprograms thathavebeenavailable fordecades. Figure4highlights thestatustowardstheimplementationofADRprogramsinEurope.
Figure4:ADRprogramsinEurope(NavigantResearch,2014)
Currently,onlysmall scaleADRprogramsareavailable inEurope,whilehugebarriersaredefinedon theregulatory framework towards the aggregation of residential and C&I customers to their activeparticipationonenergymarketsaspartof theportfolioof thirdpartyaggregators.While for somecases(France,Switzerland,UK,andIreland)thereisgreatpotentialforfurtherdevelopment,thereisanapparentneed to speed up the transformation on European regulatory framework to enable the participation ofcustomersasactiveinfluencerandstakeholderonenergymarkets.OPTiworkwilltrytocontributeintheadoptionofDRintheEUby,amongstothers,definingADRcontractstailoredtotheDHCenvironmentandoptimising the efficacy of DR programs.Nevertheless, the designed contractswill exploitmethodologiesthatcanbeapplicabletoSmartGridsingeneral.
ADRprograms in theUS on the other end havematured enough since 2010 and have been establishedtowards the active participation of C&I and residential premises as actors of energy markets (NavigantResearch,2014).ThemostprominentcaseofinteresttoOPTi(withregardtoincentivesandcontracts)isCalifornia’sADR.

D2.1:State-of-the-art,scenarios,requirementsandKPIs
Page18of84
California’sADRprogramprovidesfreetechnicalassistanceandgenerousincentivestocustomersofPacificGas and Electric (PG&E), Southern California Edison (SCE) and San Diego Gas and Electric (SDG&E) forinstallingautomatedDRtechnologyenablingtheautomatedresponsetoDRsignals.ParticipationisopentocustomersenrolledinaqualifyingDRortime-varyingpricingprograms(PG&E’sPeakDayPricingorSCEand SDG&E’s Critical Peak Pricing program). ADR uses communication and control technology toautomatically implement the customer’s chosen pre-programmed load reductions, providing a fast andreliableway to respond to peak events, while still leaving the customer in complete control. Incentivesrangefrom$125to$400/kWofreductioncapability,dependingonlevelofautomation.Eligibleequipmentincludes energy management systems and software, wired and wireless controls for lighting, HVAC,thermostats,motors,pumpsandotherequipmentcapableofreceivingcurtailmentsignals.SCEalsoofferstheADRExpressprogramtosmallercustomers(upto400kWpeakdemand).
Participants normally receive 60 percent of the total program incentive after successful verification ofequipment installation and testing of the committed DR strategies. The remaining 40 percent of theincentiveispaiduponverificationofparticipantperformanceinthefullDRseason,whichmaybeupto12monthsafterthefirstpayment.Incentivesmaynotexceed100percentoftotalprojectcost.
Table5:IncentivesinCalifornia’sADR(PG&E,2014)
2.3.1.3 ADRStandardisation
SuccessfulimplementationofADRrequiresstandardizationallowingwholesaleproducerstocommunicatewith utilities and, if any, aggregators, who in turn communicate with their customers, or directly withcustomers,whocanthenreducedemandduringpeakperiods.WithoutanADRstandard,ADRwouldbedifficult and costly to implement. Systemdevelopment, integration and installation costs could grow toprohibitivelevels,andtheseproprietaryandexpensiveassetscouldeventuallybecomestranded.
Open Automated Demand Response (OpenADR) is the 1st standard for electricity providers and systemoperatorstocommunicateDRsignalswitheachotherandwiththeircustomersusingacommonlanguageover any existing IP-based communications network, such as the Internet. As themost comprehensivestandard for AutomatedDemandResponse,OpenADR has achievedwidespread support throughout theindustry.
It isbuiltonaclient (virtualendnode,orVEN)/server (virtual topnode,orVTN)architecture.DRsignalsconveyedtobuildingandindustrialcontrolsystemclientstriggerpre-programmedactionsthatrespondtoparticular DR signal characteristics (possibly including an option to not respond under certaincircumstances),enablingafullyautomateddemandresponseappropriatetoeachresource. InMay2010,OpenADRbecameoneofthefirst16SmartGridStandardssupportedbytheU.S.DepartmentofEnergyoftheNationalInstituteofStandardsandTechnologySmartGridInteroperabilityStandardseffort.
TwoversionsofOpenADR2.0standardexist:the2.0aversionissimpler,while2.0baddsmoreoptionsforpricing, telemetry, two way communication, etc. Because of these additions, OpenADR 2.0b supportsdynamicpricesignalsaswellasreliabilityandemergencysignals.Itcancommunicatemarketparticipationinformation and improve load predictability due to its two-way communication structure. In addition,OpenADR 2.0 includes advanced features and provides a testing and certification process to support

D2.1:State-of-the-art,scenarios,requirementsandKPIs
Page19of84
growingglobalinterest.InterestinOpenADRspanstheUnitedStatesandtheworldasithasbeendeployedacrossUSaswellasAustralia,Canada,Korea,India,China,JapanandIreland.
2.3.2 Incentivemechanisms
2.3.2.1 CustomerengagementinDRandOPTiapplicability
Inprinciple,oneofthemostimportantchallengesinthedeploymentofDRistheuncertaintyontheactualloadcurtailmenttobeattainedbythecustomers.Essentially,inADRthereexistsana-prioricontract-basedagreementbetweentheutilitycompanyandthecustomersaboutthe loadtobecurtailedor interrupteddirectly by the utility company. A critical element of expanding the participation in these programs andadopting the proposed contract emerges with an adequate range of incentives or dynamic pricingalternatives coupled with a variety of contracts that are designed in such a way to match differentcustomer categories and preferences. There are many classifications that can be found in literatureregardingincentivesforDR.Forthepurposesofouranalysiswilladopttheclassificationpresentedin(PJM,2004).AccordingtothatthemethodsofengagingcustomersinDRmaybedividedintwogroups:
1. Price-basedprograms(dynamicpricing)exposingcustomerstothetime-varyingcostsofelectricityproduction,transportofelectricityandancillaryservices(PJM,2004)
2. Incentive programs (reliability-based actions) providing incentives to reduce demand at criticalhours.TheseprogramsarelaunchedbytheutilitiesorTSOstoassuresystemreliabilitybyrelievingdemand.
2.3.2.1.1 Price-basedprogramsanddynamicpricing
Traditionallytheoperators(domesticenergyproviders)havebeenusingfixedretailrates.However,asetofproblemsand inefficiencieshasbecomeapparent. Inparticular,on thesupplyside, thewholesalepowercosts canvary substantiallywith timeand location,whileon thedemandside theconsumptionpatternsmay vary on seasonal and daily factors. On the other hand, the customers’ demand is shapedindependently of the conditions prevailing in the wholesale market and is mostly based on customers’preferencesandrealisationofcomfort.Asaresult,thegenerationandtransmissionresourcesarenotusedproperlyratherinaninefficientandwastefulfashion.
Dynamicpriceswouldbeabletoreflectthedynamiccoststructurebehindgeneration,transport,ancillaryservices, and even taxes, thus dealing with the aforementioned inefficiencies. Because customers arechargedbasedonthesametariff,thecostsofinvestmentsareburdenbyallcustomersandnotonlythoseadding to thepeakdemand.Dynamic pricingwould increase themotivation forDR in the sameway, asmicrogenerationwouldbemotivatedtoproduceattherighttime.Theseinitiativesarebasedonsendingpricesignalstothecustomers(Taborsetal.,1989),(Barboseetal.,2005)(Goldmanetal.,2002).Thereisawiderangeofinitiativesofthistype,butthebasiccharacteristicofallofthemisthatthepriceisdifferentat different times of the day. Both prices and time periods can be fixed and pre-established, or can becompletely variable. It is important to underline that in this type of programs the user response is notobligatedbycontract;itisalwaysthecustomerwhovoluntarilyreactstopricechanges.
Themostcommonlyimplementedprice-baseddemandresponseoptionsarereal-timepricing(RTP),time-of-use tariffs (TOU) and critical peak pricing (CPP), which address different problems in themarket andrequiredifferentengagementsbycustomers.
Themost variable option is the one inwhich the hourly price paid by the user is directly linked to themarketprice. Inthiscasetheenergyserviceprovideravoidsriskcompletely,astherisk isrealisedbythefinal user. These initiatives are denominated real-time pricing (RTP). In systems with RTP, the price ofelectricitydirectlyreflectsthemarketprice,typicallyonanhourlyscale,determinedonaday-aheadoranhour-ahead basis. On an hourly market, RTP removes the welfare losses associated with other tariffsystems.However,tomakesenseRTPrequirescustomerstofollowpricedevelopmentsinthemarketand

D2.1:State-of-the-art,scenarios,requirementsandKPIs
Page20of84
carrythecostsassociatedwiththis. Inthecaseofsmallcustomers,aggregatorsshouldplayanimportantroletoovercomethesebarriers.
A time-of-use tariff (TOU) gives information on systematic variations in daily/weekly prices/costs ofproduction and defines blocks of hours with different rates reflecting average costs during each block.Typically, the 24hours per day are grouped into threeblocks: low, normal andpeakhours.Alsoweeklyvariationsmaybe included, e.g.workingdays andweekends,whereweekendsonly have lowor normalhours; and even, yearly variations. The purpose of using TOU tariffs is load shifting, decreasingconsumption at peak hours and increasing consumption in normal and low price hours. TOU rates arestatisticalaverageratesnotreflectingtheactualcostsofelectricityproduction.TOUratesareasecondbestsolutionthatcanrealiseashareofthepossiblewelfaregainwithaminimumofinformationcost.
Criticalpeakpricing(CPP)focusesonperiodswhenthemarginalproductioncostsandpricesinthemarketareveryhigh,eitherduetoverylargedemandorduetolackofproductioncapacity,andaimatreducingdemand in high-price periods by super-imposing a pre-specified high rate. The final user can consumeelectricityatafixedprice,exceptofthosedaysorperiodswhenthepriceisconsiderablyhigher.Normally,CPPratesaresuper-imposedoneitheraTOUtarifforatime-invariantrate.UtilitiesorretailerstriggerCPPratesandrequestcustomers toreactat relativelyshortnotice,often fora limitednumberofdays/hoursperyear.Often,customersaregivenapricediscountduringnon-CPPperiods.Oneofthemostimportantinitiatives of this type has been delivered by EDF in France, with the participation of around 10millioncustomers.Themayorbarrier for the implementationofdynamicpricing is thenecessityofuseof smartmetersthatallowthenewwayofbilling,asthesemetersprovideintervalmetering.
In respect toOPTi, all the aforementioned programs are eligible for increasing customer engagement inADR. However, their applicability will be investigated in relation with the research and innovationobjectivesofOPTiandtheusecasesdefinedwithintheproject.
2.3.2.1.2 Incentive-basedprograms
Inadditiontovoluntarilyreactiontopriceschemes,demandcanalsobeusedinrelationtoincentive-basedprograms.Inthese,areservationpaymentisagreeduponanddemandmustbereducedorincreasedwhenrequested.Theuserincentivesarepredefinedbymeansofcontractswiththeutilitywiththeprerequisiteof joining the DR programs and can be estimated twofold: a payment due to the agreed capacity ofreductionandapaymentduetotheeffectivelyenergyreductionwhentheuser is requestedtoshed.Asthe reductioncannotbedirectlyquantified, it isestimated inmost casesas thedifference from the realconsumptiontothebaselineconsumption.Dependingontheprogram,theuserisboundtoreducehisloador not. In those programs where the user response is optional, there is no payment associated to theagreedcapacityofreduction.
Mostincentive-baseddemandresponseprogramsfocusonsecurityofsupplyandthetimescaleminutestosecondsgivingTSOstheoptiontocut-offdemandorcall-onfirmswithemergencyback-upgeneratorstostart theseand reduce their demandduring systemcontingencies. Strictly speaking, onemayargue thatstarting-upemergencyback-upgeneratorsbycustomersisasupply-sideoption,butseenfromtheTSOtheeffectissimilartoademandreductionandisinthemarketseenassuch.
Depending on the time frame in which the user has to respond, these programs can be classified as i)Frequency response: Instantaneous, ii)Balancingmechanisms:2-5minutesand iii)Operationor standingreserve:20minutes–4hours.
Dependingonthesetimeframes,incentiveprogramscanbebasedinoneofthefollowingtechnologies:
1. Capacity. These programs are scheduled ahead of time, on amonth timescale and the systemoperatorhastheoptiontoinitiatethemwithintwoorlesshoursofnotice.Participantsarepaidup-front, from stakeholders that would otherwise need to produce demand response volume ofelectricity, in order to satisfy their reserve obligations. The payments are proportional to the

D2.1:State-of-the-art,scenarios,requirementsandKPIs
Page21of84
capacitymarketprices, those that reflect the long-term futurecontractsbetween thegeneratorsandtheLoadServiceEntities(LSEs).
2. Ancillary. Customersbidtheir loadcurtailmentsinmarketsoperatedbytheIndependentSystemOperator (ISO). If their bids are accepted, they are “on-call” to provide load reductionwith lessthananhourofnotice.
3. DemandSideBidding(DSB)(Boisvertetal.,2002),(Vuceticetal.,2001),(Strbacetal.,1996).Theseprogramsarescheduledonaday-aheadtimescaleandinitiativecustomerstopresentbidsofferingtoreducepartoftheirload.Thepricemaybeeitherpartoftheirbid,orauthority-postedbasedonthewholesaleelectricitymarketprice.Participantswhose loadreductionbidsareaccepted,musteitherreduceloadascontracted,orfaceapenalty(Anastopoulouetal.,2014).
4. Emergency. Theseprogramsarereliabilitybasedand loadreductionpaymentsare linkedtorealtime wholesale market prices, or customer’s outage cost. They can be deployed within thirtyminutes to two hours interval, before the power delivery. They provide incremental reliabilitybenefits, and are used only if the results of capacity response programs could notmaintain thereservemargins.
5. Interruptible. Provide a rate discount or bill credit, for agreeing load reduction during systemcontingencies.Economicpenaltiesmaybeassessed,iftheparticipantfailtocurtail.
6. Direct load control (DLC) (Lee&Wilkins, 1983), (NG& Sheble, 1998).Utilities, TSOs or programoperatorstodirectlydisconnectapartofthecustomers’loadusetheseprograms.Theseinitiativesrequire theexistenceofadirectcommunicationsystembetweenthe initiativepromoterandtheparticipating customers. Nevertheless, the objective customers of this kind of initiatives are bigindustrial customers. The USA is the only place, where initiatives of this type oriented tocommercial or private consumers have taken place. A typical initiative of this type is thedisconnection of groups of certain domestic appliances such as electric water heaters or airconditioning units, so that the TSO can disconnect a large number of units at one point. Theappliancesconsideredinthiscasearethose,whichhavethermalinertia,sothattheeffectsoftheinterruptionaresoftenedtotheuser.Controlconditionsareestablishedbycontractsthatspecifythenumberandthedurationoftheinterruptionsacertaingroupofappliancescanwithstand.Asacompensation for thepossibilityof disconnection, customers receive adiscount in theelectricitybill. These methods have been successfully used by USA TSOs during the last 20 years. DLCprogramsimprovethesystemreliabilityandsecurethesystembalancing,astheTSOhastheoptiontodeploythemwithinminutesbasedonthepredefinedcustomeragreement.
In Figure 5, the electricity system planning is presented. The electricity volume scheduling during eachcomponentisproportionaltothecomponent’sdurationonthesystemplanningtimescale.Whatismore,itbecomesobvious thateachdemandresponseprogram,bothpriceand incentivebased,canbedeployedoverspecificcomponentandtimescale,accordingtoitsproperties.

D2.1:State-of-the-art,scenarios,requirementsandKPIs
Page22of84
Figure5:RoleofDRinElectricSystemPlanningandOperation(QDR,2006)
AlthoughDLCprogramsappeartobeabetterfittoOPTi'senvironment,sincetheyalreadyencapsulateandinstantiatethenotionofdirectcontrollingofcustomers’load,differentincentivebasedprogramsincludingancillaryservices,emergencyprogramsetc.canbeinvestigatedinlinewiththeobjectivessetbytheprojectandtheusecasesderivedwithinitscontext.
InrespecttoOPTiandinparticularforADR,theDLCprogramsareofmostrelevance.
2.3.2.2ADRcontractsandassociatedincentives
DuringthedeploymentofanADRprogramthereexistsana-prioricontract-basedagreementbetweentheprovider and the customer about the load to be rescheduled, curtailed or interrupted directly by theprovider. However, the customer should be adequately incentivized to adopt this contract. In order tomake such a contract more attractive, it should include terms restricting the discomfort caused toconsumers, conferring fairness on them and avoiding negative phenomena such as the prevalence ofparticipation fatigue. This fatigue results in a progressive disengagement (or opt-out) from the programovertime–asthenoveltyofanewschemediminishes,customersbegintoignoretheADReventsandtheirconsumptionbehaviourrevertstotheirbaselinebehaviour,whichoftenleadstoanetincreaseinthecostsincurredbythecustomers(Holyhead,2015).Thereupon,inordertofostercustomers’activeparticipation,(He,2013)arguesthatthediversityofcontract types, togetherwith incentives,emergesasan importantfactor.
Inthisdirection,theworkof(Fahrioĝlu&Alvarado,2000)combinestheeconomicaspectsofcontractswithpower systemsensitivityanalysis inorder todesignan incentive structure thatencourages customers tosign up for the right contract and reveal their true value of power and thus the value of powerinterruptibility.(Hogan,2009)arguesforthecombinationofdynamicpricingandexplicitcontracts,wheretheproperpaymentsare transparent,asabenchmarkstandard.Amore recentworkof (He,Xian,etal.,2013)adoptsamorecustomer-centredapproachandfocusesonDRcontracts, throughwhichcustomersaremorelikelytoparticipateinDR,howthesecontractsinteractwithdifferenttypesofcustomersandhowcustomers can be empowered to manage the contract selection process. In (Chandan et al., 2014) theauthorsproposeaninclusiveDRsystemthathelpsanelectricityprovidertodesignaneffectiveDReventbyanalysing its consumers’ consumptiondata andexternal context. It develops amethodology to estimateconsumers’consumptionpreferences,agreedyalgorithmtoidentifythesetofconsumerstobetargeted,andoffers incentives for singleDRevent.Moreover, theworkof (Haring&Andersson,2014)proposesacontract framework for provisioning DR for ancillary services based on a bi-level optimisation problem.(Daniels & Lobel, 2014) delves into and distinguishes two types of curtailment contracts: automatedcontracts that prescribe the load curtailment for each customer and voluntary contracts that allowcurtailment to vary with the customer’s opportunity cost. This type of contracts have gained particular

D2.1:State-of-the-art,scenarios,requirementsandKPIs
Page23of84
attention,sincetheyhavebeenshowntoachievethesameefficiencyasrealtimepricing(Chao&Wilson,1987)andtheyareprojectedalongwithDReffortstodecreasepeakdemandbymorethan4%2.
Inrealenergymarkets,severalADRprogramsgravitatetowardstheparticipationofresidentialconsumers(Feldman&Lockhart,2014);e.g.,as itdescribedearlier, contractbasedADRprograms inCaliforniaoffergenerous incentives to customers per kWh of consumption reduction, particularly to those employing atechnologyenablingtheautomatedresponsetoDRsignals.Mostcommercialdemandresponseschemestackletheproblemofpeakreductionbyissuingreductionrequeststotheircontractedschemeparticipantsfortimesofhighdemand(Kiwi,2015).
2.3.2.3 Mechanismsforincentives’design–Theoreticalconsiderations
Despite the advantages of incentive-based DR programs, their application is still difficult for the utilitycompanies, due to customers’ versatile consumption patterns. Recent studies have shown that thewillingnessofcustomerstoparticipateinsuchprogramsandhencethesuccessoftheDRprogramscanbeassociated with customers’ preferences on a wide range of criteria that includes, but is not limited to,flexibilityofconsumption,theirperceptionofcomfort,financialcompensation,prosocialmotivation,priceand volume risk, complexity and autonomy and privacy. Therefore, customers’ different preferences onthese criteria will condition the way of their participation in DR as well as the determination of theassociatedincentives(He,Xian,etal.,2013).
A largebodyofpilotstudiesandtheoreticalwork isavailableonthe incentivemechanismsandschemesthatareused in thesmartgridparadigm. (SEDC,2014) reports thatmonetary incentives inDRprogramswillbecomeoneofthebestpossibilitiestooffsetincreasingenergycosts.(Aalamietal.,2010),(Aalami&H.A, 2010) and (Moghaddam, 2011) propose economic models for different types of programs bysimulating customers’ behavior for different incentives and penalties in case of no responding to loadreduction.(Mohsenian-Rad,A.H.,2010)and(Caron&Kesidis,2010)presentincentive-basedconsumptionscheduling problems. In particular, (Mohsenian-Rad, A. H., 2010) proposes simple pricing mechanisms,whichinturncanprovidethecustomerswiththeincentivestocooperateinordertonotonlyimprovethesystemsoverallperformance,butalsotopaylessindividually.
Reward-basedincentivesontheotherhandgivefinancialrewardstousersforcurtailingtheir loadduringpeak-demand(Negnevitsky,2010),(Nguyen,2011),(Chen,2010).Theseworksproposemechanismswhereuserssubmit theirbidsorsupply functions,andthentheoperatordecidesonamarket-clearingprice formaximizing total market benefit. A hierarchical market model for smart grid is proposed in (Gkatzikis,2013),wheretheaggregatorsactasintermediariesbetweentheoperatorandthehomeusers.Aggregatorssell DR services to the operator and provide compensation to end-users to modify their consumptionpattern.In(Maharjan,2013)theauthorsproposeaStackelberggamebetweenutilitycompaniesandend-userstomaximizetherevenueofeachutilitycompanyandeachuserpayoff.
The coupon incentive-based DR model in (Zhong, 2012) is suitable for a smart grid where the retailcustomersarepayingaflatelectricityrate.Ittargetstheretailcustomersthatcanparticipateinreal-timeDR programs. The hourly stochastic security-constrained unit commitment model of (Khodaei, 2011) isdesignedformarketclearing;itincorporatesDRprogramsinamarketwithbothfixedandresponsiveloads.InthismodeltheDRbidsaresubmittedfromtheretailcustomers/loadaggregatorstotheISO,inordertobe included in the market clearing (Khodaei, 2011). In the proposed DAM clearing mechanism of (Su,2009), consumers can submit complex bids with specific constraints on their hourly and dailyconsumptions.
However, an empirical work on customers’ selection and acceptance of tariff programs by (Dütschke &Paetz,2013)hasfoundthatcustomersappeartoprefersimplicitytodynamicprograms.Thisisinlinewith
2EIA2011report–http://www.eia.gov/todayinenergy/detail.cfm?id=650

D2.1:State-of-the-art,scenarios,requirementsandKPIs
Page24of84
the outcomes from the trials of the project WATTALYST3, where customers’ responsiveness to theautomaticcampaignstrikesquitehighincomparisonwiththeresponsivenessrateoftheothercampaignsthatwereexecuted,suggestingthatadirectcontrolofappliances,e.g.heating,AirConditioning(AC),etc.,remotelyfromtheutilitycompany’spremisesisaneffectiveapproach,andcanconstitutethenextstepinthedeploymentoftheDRprogramsintheformofADR.
2.3.2.4 Non-pecuniaryincentivesandbehaviouralinterventions
Nonetheless,historically,energyefficiencyandsustainabilityhasbeenaleadingexampleofthedifficultiesininducingpeopletochangebehavioursandadoptnewtechnologies,evenwhenitappearstobeintheirown financial interest. The actual penetration of energy efficient technologies and behaviours has beenstrikingly low, a phenomenon that has been alternately dubbed the “Energy Efficiency Gap” and the“Energy Paradox” (Jaffe& Stavins, 1994). This suggests that prices and technologymay not be the onlybarriers to increasedenergyefficiency,asmanyof thebarriersmaybeofbehaviouralnature.Therefore,themonetarybasedincentivesinADRasmentionedbeforemightnotbesufficientenoughtoaddressthesupply-demandmatchingproblematpeaktimes(Allcott&Mullainathan,2010).
This work is driven from behavioural economics research. Behavioural economics uses psychologicalexperimentationtodeveloptheoriesabouthumandecisionmakingandhasidentifiedarangeofbiasesasaresultof thewaypeople thinkand feel.BE is trying to change thewayeconomists thinkaboutpeople’sperceptions of value and expressed preferences. According to BE, people are not always self-interested,benefitsmaximizing, and costsminimizing individualswith stablepreferences—our thinking is subject toinsufficient knowledge, feedback, and processing capability, which often involves uncertainty and isaffected by the context in which wemake decisions. Most of our choices are not the result of carefuldeliberation.Weareinfluencedbyreadilyavailableinformationinmemory,automaticallygeneratedaffect,andsalientinformationintheenvironment.Wealsoliveinthemoment,inthatwetendtoresistchange,arepoorpredictors of future behaviour, subject todistortedmemory, and affectedbyphysiological andemotional states.Finally,weare socialanimalswith socialpreferences, suchas thoseexpressed in trust,reciprocityandfairness;wearesusceptibletosocialnormsandaneedforself-consistency(Samson,2014).
Research in behavioural economics and psychology has demonstrated that non-pecuniary interventionscomparefavourablytomonetaryinterventionsandassociatedincentivesinchangingconsumerbehaviour.It was also shown that judiciously applied pecuniary interventions increase the impact of monetaryinterventionsifusedincombination.Thishasincreasedinterestinresearchinbehaviouraleconomicsasaguide for policymaking in areas as diverse as energy, public health and finance. BE can informdecisionmaking in energy policy has increasingly been recognized by policymakers and researchers (Allcott andMullainathan2010;DEFRA2010;OFGEM2011).Thesebehaviouralapproaches,whichincludecommitmentdevices,informationprovisionorattentionaldevices,appealstosocialnorms,orapparently-smallchangestoprices, default options, or transactions costs, arequite inexpensiveand canbeextremelypowerful, ifsuccessfullyselected.
AlargebodyofexistingresearchonenergyconsumptioninEuropeandtheUnitedStateshasmeasuredtheeffectiveness of non-price interventions, including social approval (Yoeli, 2009), consumption feedback,goal setting, lotteries, certainty effects and commitment (Abrahamse,Wokje,& al., 2005). For example,peopleseemtobemoremotivatedbycompetitionandrewardsgiventotopperformersratherthanpiece-raterewards(Gneezy,etal.,2003).Furthermore,(Kahneman&Tversky,1979)havefoundthatpeopleareinclinedtooverestimatesmallpercentages,andthereforepreferaverysmallchanceatalargerewardtoasmallrewardforsure.Furthermore,theoutcomesofEUprojectWATTALYST,althoughsmall-scaled,attestthe validity of these findings, as theparticipation rate and the engagementof customers to theDRwasquitehighinrelationtothecasewhencinematicketswereprovidedasanincentive.
3http://cordis.europa.eu/project/rcn/100984_en.html/
D2.1:State-of-the-art,scenarios,requirementsandKPIs
Page25of84
Before1980,therewere20experimentsonconsumptionfeedbackalone(Shippee,1980).Theseandmorerecent information provision experiments reduced electricity use by between 5 and 20 percent (Stern,1992) (Fischer, 2008). While many of these interventions were small scale, short-term pilots on non-representativepopulations,theresultsshowproofofconcept.RecentworkbyacompanycalledOPOWER(OPOWER,2014)showsthisconceptcanberealizedatscale.Moreover,manystudiesareconsistentwiththis: for example, a recent consulting report by (Company, 2009) concluded that households andbusinessesintheUScouldearn$1.2trillioninpresentdollarsatanupfrontcostof$520billionbyadoptingmeasureswhosebenefitsoutweighedthecosts,reducingenergyconsumptionby23percentfrombaseline.
ThisparticularareaofresearchwillbethoroughlyinvestigatedinthecontextofWP3andtheresultswillbepresentedinD3.1Consumermodellingandincentives.Furthermore,itshouldbenotedthatthewayofhowincentivesareframedinordertoincreasethepossibilitiesofthesebeingsuccessfullyfromdifferentusersisoneof theexamplesthatshowthat issues likegender (ofprimary importance inOPTi)canbetaken intoaccountinpracticebyexploitingBEprinciples.
2.3.3 ChallengesandhowOPTiwilladdressthem
UtilitycompaniesareprogressingslowlytotheADRdeploymentinEurope.OneofthemainimpedimentsliableforthissituationasidentifiedbytheSmartEnergyDemandCoalition4,anindustrygroupdedicatedtomaking the demand side a smart and interactive part of the energy value chain, includes “Customers’resistance”.Acertainsegmentofthecustomerpopulation,bothC&Iandresidential,isreluctanttogiveupcontrolofitsenergyusage.Thisreluctanceisrelatedtosecurityconcerns,productionconcernsinthecaseofanindustrialfacility,andcomfortconcernsforcommercialbuildingsorhouseholds.Besides,mostofthecustomers have no direct way of accessing the wholesale, retail, balancing, reserves and other systemservicesmarketssinceonlyfewDRServiceprovidersexistinEurope.Therefore,onlythelargestindustrialcustomers, with their own bilateral power purchasing agreements can participate in DR and only on alimitedlevel.
To this end, there is a highneed to facilitate the creationof bilateral contract agreementswith (ornot)aggregationserviceproviderstowardstheactiveparticipationofcustomersonDRprograms.Nevertheless,inorderforcustomerstoparticipateinADRprogramswiththeirflexibilityassets(demandsideresources),theremustbeprogramstailoredtospecificcontractswithparticipationrulesthatfittheircapabilitiesandalsodeliverarealbenefittothemarkets.WithspecialfocusontheimplementationofADRprograms,thereis a high need on structuring different types of these contract based programs to further support theviabilityoftheproposedframework.Buildingonthebasissetbytheuser-centricapproach,oneofOPTi’sspecific tasks in thecontextofWP3 is todefineandcreatea suiteofautomated,user-specific, contract-based DR programs, which aim foremost to trigger users' active participation in an easy and simplifiedmanner,whileatthesametimeensuringthestabilityandsustainabilityofthewholesystem.
Fromanoperationalperspective,ADRdrivesitsownsetofcosts.Dependingonthelevelofexistingenergymanagementsystemsinafacility,thesecostscouldberelativelysmallandinvolvelittletonoinfrastructureinstallation, or require extensive control installations and lots of integration with existing systems.However, the potential offered by the existing infrastructures for ADR without requiring energymanagementsystems(EMSs)orDLC-enableddevicesortheinstallationofnewandexpensiveequipmenthavenotbeenfullyexploredandallowsforfurtherexploration.Leveragingthisgap,OPTi’sholisticsolutionintendstoutiliseonlytheexistingDHCinfrastructureforthedeploymentofADRprogramsinordertobemoreefficientintermsofcosts.
To someextent,ADRadoptionwilldependmoreonmarket forces than technicaladvances.Theexistingmarket models and standards may not allow for exploiting the full potential of ADR. New market
4http://www.smartenergydemand.eu/

D2.1:State-of-the-art,scenarios,requirementsandKPIs
Page26of84
opportunitieshavetobedevelopedtoextractthefullvalueofADR,aswellasstandardsneedtobeagreeduponsothatvarioussystemscancommunicatewitheachother.ThisisoneofthekeyobjectivesofWP3,that amongst others aims to investigate the operation of alternative current and emerging marketstructuressuchasrealtimemarkets(spot),dayaheadmarkets(forward),Negawatttradingetc.
Sofar,theEuropeanenergymarketsaredesignedtotradeforenergyunits(kWh)notcapacityorflexibility(kW),andthefullvalueofflexibleresourcesisnotreflectedinmarketprices.Thissuppressesbothflexiblegenerationanddemandtotheactiveparticipationonenergymarkets.Therefore,thereisanevidentneedtoensureconcreteandfairmechanismstorewardcustomersfortheiractiveparticipationinDRprograms.AlthoughtheaforementionedliteratureclearlyrecognizesthesignificanceofincentivesandrewardsforDRadoption,howmuchcustomersmustbepaid,inordertoenticethemtoparticipateintheprograms,isnotapparentas itdependsontheoperationalcostsandstrategicobjectivesoftheutilitycompany.Althoughsome simple forms of incentives are already provided, the pertinent economic mechanisms that canfacilitate this aspect have yet to be designed. Nonetheless, prices and technologymay not be the onlybarrierstoincreasedenergyefficiencyandsustainability,asmanyoftheobstaclesmaybeofbehaviouralnature. In this context,behaviouralbased interventionsand incentives canbeutilised to complementorsubstituteeconomic incentives, thusmaximising their impactandefficiencyata substantially lowercost.Towards this direction and in the context of theWP3, OPTi will design and propose efficient incentivemechanisms that are tailored to theDHC setting and aim to exploit both the economic andbehaviouralaspects in order to stimulate the engagement of customers and increase the economic efficiency andoverallsustainabilityofthesystem.
Finally, one could argue that the deployment of ADR together with associated incentives in the DHCenvironmentandmost importantlythroughtheexploitationofpassivestoragefromtheDHCsystemsforpeaksheddingcanleadtosignificantsavings;yettherearenoreportedresults.OPTi’sprominentgoalistoprovideaholisticcosteffectivesolutioninordertoachieve30%reductionintheenergyusedforwaterandheatingaswellas30-40%reductioninthepeakconsumptiononhousesor/andagroupofhousesbutalsothemeans(intermsofKeyPerformanceIndicators)andassociatedmethodologiesinordertoevaluateitstargets.

D2.1:State-of-the-art,scenarios,requirementsandKPIs
Page27of84
3 OPTICOREUSECASES
In this section the different use cases (UC) designed to be applied to the trial sites or in simulation arepresented.We have defined eight basic/core use cases, five of which are related to the trials and theremainingtosimulationonly,whichwillbeevaluatedusingOPTi-Sim.
It should be highlighted here that these caseswere selected as themost representative ones aiming toaddresstheobjectivesoftheprojectandtojustifytheKPItargetsasdetailedintheDescriptionofWork.Furthermore,basedonthesecasestheOPTi-FrameworkusercancreatesupplementaryUCs toevaluatedifferent scenarios, settings and configurations of the DHC environment at hand, within the OPTi-Framework.
Finally,duringthecourseoftheprojectadditionalsimulation-basedUCsmightbedefinedbytherespectivetechnicalWPstoinvestigatemorefine-grainresearchaspectswithinOPTi’sresearchareas.
3.1 UC-01:PEAKLOADREDUCTION(MALLORCA)
OPTiUseCaseDescription
ID 01
Title PeakLoadReduction
RelevantOPTipilot Mallorca
Description(narrative)andbusinessneed
Thisusecaseaimstoreducetheenergydemandduringpeakhours.Itwould,therefore, involve reducing theenergydemand forheatingorcoolingduringcertain periods of time during a day (peak demand periods) or shifting thedemandfrompeakhourstooff-peakhours.
Peakloadreductionwillbesplitintotwoactions:peakloadreductioninwardsandpeak loadreduction inspecificareasofthebuilding(staffofficeareaforexample).
SampolsupplieshotandcoldwatertoSonLlatzerHospitalviatheairhandlingunits(AHUs).TheseAHUstreattheoutsideair,which isthensuppliedtothewards (patient’s room) thorough inductors. The inductors can regulate thetemperatureofthetreatedairwithin+/-3ºC,basedoninputfromdialthatthepatientcontrols.
Peak load reduction in this use case shall be achieved through demandresponse (DR)events,whichwillbedefinedby theenergy supplier. In theseevents, theenergymanagerwill reduce thedemand in theAHUs,whichcanpotentially result in higher demand corresponding to the inductors. Thisincreaseininductordemandcanbetheresultofpatientsturningthedialstopreservetheircomfort.
Whilethewardshave inductors,therestofthebuilding(staffofficeareaforexample) is air-conditioned by the treated air from the AHUs without anyinductors. Hence, the DR actions taken by the energy manager would besufficienttomodifytheenergyconsumptionfromtheseareas.
To reduce peak loads, strategies such as pre-cooling or pre-heating shall be
D2.1:State-of-the-art,scenarios,requirementsandKPIs
Page28of84
used.Hence,theinertiaofthebuildingwillplayanimportantrole.
On the supply side, energy is supplied to Son LlatzerHospital froma powerplant, where the sources of hot/cold water are a CHP engine, absorptionchiller, electrical chillers andgasboilers. It is desirable to reduceproductionvianon-environmental friendlyresources(electricalchillerandgasboilers) inordertoreduceCO2emissionsandproductioncosts.
In order to design DR events effectively, it is important to use forecastingmodelstopredicthowthesystemanduserswillrespondtoDREventsandlinkdemandreductiontomostdesirableproductionconditions.
Trigger • Theusecaseshallbeinitializedduringpeakloadperiods
Pre-conditionsandinfrastructurerequirements(ifapplicable)
• Availability of Information about the production plant and of thehospital
• Availabilityofdatacollectedfromthesensors inthehospitalandtheproduction plant (Son Llatzer Hospital have already signedconfidentialitycontract)
• The contract terms regarding the incentives (if used), themaximumreduction in temperature or consumption, the frequency of the DReventsetc.arespecifiedandpresentedtotheusersbeforehand
• Ifaconsumerexperiencesdiscomfort,andhencetheoperatorgathernegativefeedback,thetemperatureofthepremisescouldberestoredbacktowithintheconsumer’scomfortzone
Actors(stakeholders) • Endconsumers(patientsandtheircompanions,hospitalpersonnel)• Utilitycompany(Sampol)• EnergyManager(EnergyDepartmentatSonLlatzer)• SonLlatzerCEO
OPTiModelling
Componentsinvolved
• Dynamicandphysicalmodelofthenetwork• Physicalmodelofthedifferentbuildings• Forecastingmodel(Weatherforecasting)• Economicmodel• Consumermodel• Demandmodel
BasicPath Step1. Theuse casebeginswhen the trial data starts tobe stored inthecentraldatabase.Step2. Run DR events affecting theward AHUs and analyse the userbehaviour (reflected by the consumption at the ward inductor level)dependingonAHUenergyreductionandoutsideconditions.Step3. Run DR events affecting the AHUs in other areas and analysethepotentialofDR in theseareasbasedonbuilding inertiaand taking intoaccountoutsideconditions.Step4. DesignDR testsbasedon theaboveDR runsandphysical andeconomicalsimulations.Thesetestswill takeplace in realisticsituations (asmuch as possible) forDR events, taking to account all factors (economical,internalandexternal)Step5. Run DR tests designed above. In particular, investigate thebusinessopportunityStep6. AnalyseresultsfromtheDRtestsanddrawconclusionsStep7. Theusecaseterminates

D2.1:State-of-the-art,scenarios,requirementsandKPIs
Page29of84
Post-conditions OutcomeswillbefundamentalfortheeconomicalassessmentofthebusinessmodelinWP7
Currentinventoryoftoolsandcomponents(incl.maturityanddevelopmentneeds)
Currentinventory:
• Temperatures,flows,powerrelatedtothepowerplant.
• Historicaldataontheproductionside.
• Insidetemperatureinallhospitalrooms.
• Powerplantsimulationtool
Developmentneeds:
• Historicaldataontheconsumptionside.
• Pilotdataexportintothecentraldatabase.
ModellingRequirements
ConsumerandEconomicmodels(WP3)
• Economicmodelstoanalysesavings(incostandemissions)asaresultofchangeinconsumptionprofile(i.e.re-shapingofprofile)
• Usercomfortmodel:Mappingusercomforttoset-pointtemperature• Baseline loadmodel:Model to forecast load profile as a function of
set-point temperature and other externals (e.g. ambienttemperature).
System&Physicalmodellingincl.dynamicmodels(WP4)
• [Loadmodelling]Physicalmodels,relatingtheset-pointtemperaturesin the various zones to the zone level and building level energyconsumption need to be built. These models will be needed as thefoundationtodevelopDRstrategiesinWP5
• [Source modelling] Models to relate the energy consumption andcorresponding emissions. Thesemodelswill be needed to set up anoptimization framework/objective function aimed at reducing peakload, costs and emissions (inWP5) as per the objectives of this usecase.
Control&Optimisation(WP5)
• MechanismforDRdesigntoreduceconsumption• Simplifiedcontrolmodelsforthesystemneedtobederivedfromthe
physicalmodels.• FortheDRfunctionality,acostfunctionfortheusecaseneedstobe
defined.• Fortheusecase,anenvelopeoftheoperatingconditionsneedtobe
characterizedintermsofavailablesignals(datapoints).Alternatively,arepresentativesetofoperatingconditionsneedstobecharacterizedintermsofavailablesignals(datapoints).
• Closed loop control principles need to be translated to (A)DRprinciples and vice-versa. Especially the time-behaviour andrequirementneedtobedefined.
Datarequirements EconomicModelling:
• Amountofproductionforatypicalday• Costofproduction.• Costofproductiondifferentenergygenerators(CHP,electricalchillers,
absortionchillerandgasboilers)

D2.1:State-of-the-art,scenarios,requirementsandKPIs
Page30of84
• DemandflexibilityoftheHospital• Marketpricesforbuyingandsellingelectricity
ConsumerModelling:
• Baselineconsumption• Details regarding the adjustment of incoming flow to achieve the
temperaturesetpoint(e.g.equationandlookuptableetc)• Preferredindoortemperature(viawarddials)• Outsidetemperature• Inconvenience(complains)• Levelofenergyawareness• Preferencesofusesintermsoftimeofheating(viaaquestionnaire)
Realization
Mainresponsiblepartners(Author)
SAMPOL
Contributingpartners AllpartnersinWP6
Priority HIGH
3.2 UC-02:PEAKLOADREDUCTION(LULEA)
OPTiUseCaseDescription
ID 02
Title PeakLoadReduction
RelevantOPTipilot Luleå
Description(narrative)andbusinessneed
Theoverallobjectiveofthisusecaseistoenabletheutilitycompanytoreduceorshiftthedemandofenergyduringthepeakhourstooff-peakhours.Inthisway,thedistributionofenergyforheatingcouldbeevenedoutwithinadayandthesystemcouldbecomelesssensitivetodisturbances.Thisimpliesthatinthecasesofhighenergydemand,userswouldutiliseonlyaportionoftheavailable energy coming into the system for heating, ensuring thus theexistence of sufficient supply to cover the energy needs for the remainingapplicationsoftheDHCsystem.
This will reduce expensive support fuel used by the utility company. LessutilisationofsupportfuelcanleadtolowerCO2emissions.Itisexpectedthatthedecreaseinthepeakloadeitherwilleithernotaffectusercomfortorifitdoes,thentheuserwillbecompensatedaccordingly.
Moreover, by exploiting the inertia of the building,which is a slow reactingsystem,theenergytotheradiatorsandfloorheatingsystemscanbereduced,thereby reducing the peak demand of the building during short amount oftimewithout affecting the indoor comfort. To identify the energy for space
D2.1:State-of-the-art,scenarios,requirementsandKPIs
Page31of84
heatingrequirements, theenergyrequiredforhotwaterenergyneedstobeseparated.Thiswillbedonewithseparateflowmetersforeachoftheseusagetypes and/or empirical calculations in cases where there are no separatemeters.
The use case can be enabled by smart systems such as forecastingmodels.This can be done through ADR system which can be linked to the DHproductiontofullyusethesystemsadvantages.Whentheproductionsystemisabouttoberunonexpensivefuelorwhenadisturbancehasoccurred,theADRsystemcanlowertheheatdemandinthebuildingstoavoidthestart-upofpeak loadplants.Anothersolutionwouldbetopre-heat thebuilding,e.g.beforethemorningpeakoriftheweatherforecastpredictsasuddendropintemperaturelaterduringtheday.However,thisshouldnotbedoneformorethanacoupleofhoursperday.
Trigger • The use case is initialised when the forecast for the total demandexceedstheproductionupperthreshold
Pre-conditionsandinfrastructurerequirements(ifapplicable)
• Availability of Information about the production system and theassociatedcostsoftheDHsubstations
• Availability of special equipment that allows for monitoring andmetering of the consumption (and possibly the storage) in users’premises
• Users have already signed contracts that enable ADR programsgranting the utility company the right to control the appliance(s) inconsumer’s premises and impose an adjusted indoor temperaturewhenever they are targeted for DR, by modifying the energyconsumptionThe contract terms regarding the incentives (if used), themaximumreduction in temperature or consumption, the frequency of the DReventsetc.arespecifiedandpresentedtotheusersbeforehandAvirtualknobisinstalledinusers’premisesandisusedtokeeptrackoftheusers’comfort
• If the user experiences discomfort, he/she responds negativelythroughthevirtualknob.Insuchasituation,theresponseisregisteredandasignalissentforthetesttoend.
Actors(stakeholders) • Endconsumer(and/orHousingcompanies/Buildingowners)• Utilitycompany• Companiesprovidingthecontrolsystem
OPTiModelling
Componentsinvolved
• DynamicandphysicalmodeloftheDHnetwork• Physicalmodelofthedifferentbuildings• Forecastingmodel(Weatherforecasting)• Economicmodel• Consumermodel• Demandmodel
BasicPath Step1. Theusecasebeginswhentotaldemandisforecastedtoexceedtheproductionupperthreshold.
Step2. TheutilitycompanyactivatestheADRprograminordertoreducetheenergyusedforheating.ThetapwatertemperatureisnotaffectedStep3. Userscanprovidefeedbacktotheutilitycompanythroughthevirtualknob.Inparticular,userstendtoprovideapositiveresponsewhen

D2.1:State-of-the-art,scenarios,requirementsandKPIs
Page32of84
thechangesinthetemperatureleadstominorornodiscomfort.Alternativelyinthecaseofhighdiscomfortindicatedbyanegativeresponse,asignalissendthattheusersaredispleasedandthetemperatureshouldbeincreased.Step4. Ifthecontractincludestheprovisionofincentives,acomparativeevaluationoftheresultsstemmingfromtheexecutionoftheDReventandtheuserbehaviour(positiveornegativefeedback)isconductedinordertodecidewhethertogranttheincentivesornotforthebuildingowner.Step5. Theusecaseterminates
Post-conditions The pilot will be the foundation for the research work on incentivemechanismsinWP3andbusinessmodellinginWP7.
Currentinventoryoftoolsandcomponents(incl.maturityanddevelopmentneeds)
Currentinventory:
• Temperature,flow,andpowermeasurementsontheprimarycircuit
• Measuringinsidetemperatureinmostapartmentsandalloffices
• Historicaldataontheproductionside(hourly).
Developmentneeds:
• Measuretemperatureinmoreapartments
• Full insight and access to the control system owned by the housingcompany.
• Installationofmetersonthesecondarycircuitaswell
ModellingRequirements
ConsumerandEconomicmodels(WP3)
• Aconsumermodelexpressedasafunctionofthedifferencebetweentherealexternaltemperatureandtheenforcedexternaltemperature,which takes into consideration the discomfort resulting from thechanges in the indoor temperature of the household/building andinterpreted via the responses on the virtual knob as well as theincentivesofferedbythecontract. Inthiscontext,different incentivetypes can be used, i.e. monetary, environmental incentives,behaviouralincentives,etc.
• Aneconomicmodeltoassess,underdifferentscenarios,thecostsandthebenefitsofimplementingADRprogramsbothfromtheconsumer’sandtheutilitycompany’sside.
System&Physicalmodellingincl.dynamicmodels(WP4)
Physicalmodelofbuildingwhichincludes:
• Characteristicsofthebuilding(size,activity,occupancy)• Theinertiaofthebuilding• Consumption(consumptionpattern,set-pointpreferences)• Controllers• DHCsubstation(radiators,floorheatetc.)
Dynamic and physicalmodel of theDH system, fromproduction unit to theconsumers,whichmodels:
D2.1:State-of-the-art,scenarios,requirementsandKPIs
Page33of84
• TheDHCnetwork(pumps,pipes)• TheDHCproduction(power,pressure,temperature,)• TheDHCsubstation(controlactions,consumption)
Inaddition,weatherforecastingmodelswouldberequiredtoanalysewhentopreheatorcoolthebuilding.
Control&Optimisation(WP5)
Optimisationandcontrolframeworkstooptimisetheenergyprovidedtothebuildingduringpeakloadstomaximisethesavingswithoutalteringtheindoorcomfort,soastoencourageconsumerstoparticipate.
Datarequirements EconomicModelling:
• Energyproductionforatypicalday• Costofproduction• CostofoperatingCHPandotherpeakplants• Detailsregardingtheproductionofthemostpreferredgenerationunit• Number of users that are served by the utility company (number of
households)• Marketpricesforbuyingdistrictheat• Typesofincentivesavailable
ConsumerModelling:
• Demographicdata(sizeandtypeofhouseandfamilyetc.)• Historicalconsumption• Details regarding the adjustment of incoming flow to achieve the
temperaturesetpoint(e.g.equationand/orlookuptableetc.)• Preferredindoortemperature• Outsidetemperature• Inconvenience(via.thevirtualknob)• Typeofcontractwiththeprovider• Levelofenergyawarenessofconsumers• Preferences of uses in terms of time of heating (e.g. via. a
questionnaire)
System,Physicalanddynamicmodelling
Productionside:
• Pumpso Properties:Location,power,volumeflowo Measurement:Pressure
• Pipeso Properties:Location,diameter,volumeflow,insulation,lengtho Measurement:Pressuredifferential,supply/return
temperature,volumeflow• Productionsunits
o Properties:Location,powero Measurement: Supply/return temperature, supply/return
pressure.• Auxiliaryboiler
o Properties:Timeseriesofusage,capacity,typeoffuelo Measurement:Energyconsumption,run-time

D2.1:State-of-the-art,scenarios,requirementsandKPIs
Page34of84
Consumptionside:
• Buildingo Properties: Location, inertia, heat capacity, number of
occupants, type and usage of building, heated floor area,ventilation,desiredindoortemperature.
o Measurement: indoor temperature, outdoor temperature,supply/returntemperature,heatingenergyconsumption
o Controlvariables:supplytemperature• DHsubstation
o Properties: Heat exchanger (dimensions, efficiency), controlsystem,pumps,controlvalves(responsetime),
o Measurement: Supply/return temperature, flow rate, heattransfercoefficient
• Behavioro Properties: Time series of water consumption, energy
consumption,o Measurement: Water energy consumption, heating energy
consumption, warm water temperature, flow rate of warmwater
Realization
Mainresponsiblepartners(Author)
LEN
Contributingpartners AllpartnersinWP6
Priority HIGH
3.3 UC-03:DECREASEDSUPPLYTEMPERATUREINTHEDHNETWORK(LULEA)
OPTiUseCaseDescription
ID 03
Title DecreasedsupplytemperatureintheDHnetwork
RelevantOPTipilot Luleå
Description(narrative)andbusinessneed
The overall objective of this use case is to enable the utility company todevelopanewsupplytemperaturecurvefortheDHnetworkduringcolddays(when theexternal temperature is less than -5degreesCelsius). In this casethetemperaturecurveshouldbechangedtohavea lowertemperaturethantheonebeingusednow.
To still deliver the same amount of energywhen lowering the temperature,the volume flow rate in thenetworkhas tobe increased,whichmeans thatmore pumping energy is needed. The limitation in such a setting is thecapacity of the installed pumps in the network. If the capacity would be

D2.1:State-of-the-art,scenarios,requirementsandKPIs
Page35of84
insufficient, installation of new larger pumps ismost likely needed to avoidstagnationinflowduetolowdifferentialpressureinthegrid.
While theenergyused for thepumpingprocess is expected to increase, theeconomic benefits of the decreased heat production are estimated to begreater, but still not enough to pay off the capital cost of installing newpumps.
Loweringthesupplytemperaturehasthebenefitofdecreasingtheheatlosseswithin the network and hence results in reduced energy production and amoreefficientutilizationoftheDHnetwork.
Thesavingswillespeciallybenotableinthecaseswheresupportfuel(mostlyoil) and top-load facilities are used; it is not only economically beneficial tolowertheproductionbutenvironmentallyaswell.
Theunderlyinggoalistobalancethesupplycurvesothattheinstalledpumpcapacitywill beenougheven if theoutside temperature falls to -30degreesCelsius.Theoutsidetemperatureisthecontrolsignalforthesupplycurve.
Although this use case can be a viewed as standalone, its combinationwiththeusecasesconcerningtheoptimizationoftheDHsystemis inevitable.Forexample,ifthereisanarrowsectioninaspecificareawithintheDHnetwork,it can be addressed by installing new larger pipes and hence increase thedifferentialpressureinthesystem.Additionally,mostoftheproblemsduetoreduction insupply temperatureoccurduringthepeak load,hencethepeakloadreductionusecaseisalsorelatedtothisusecase.
EmpiricaltestsinthegridaswellassimulatedmodelsinNetSimwithloweredsupply temperaturewillbeconductedduring theproject.These testswillbevaluablewhenevaluatingtheOpti-Simmodellaterintheproject.
Trigger Theuse case canbe initialisedandexecuted continuouslyor in combinationwith other use case. An appropriate trigger could be when the outsidetemperaturegoesbelow-5degreeCelsius.
Pre-conditionsandinfrastructurerequirements(ifapplicable)
• The necessarymeasuring equipment is already integrated in the DHnetworktoretrievedataregardingthepressure,temperatureandtheincomingandoutgoingflowrates,etc.
• Specialequipmentthatallowsformonitoringandmeteringoftheinlettemperatureandthevolumeoftheincomingflowinusers’premisesisinstalled
• Information concerning the current and forecasted outdoortemperatureisavailable
• Usershavealreadysignedcontractsthatenabletheirparticipation inthe DR events. According to the contract terms, the indoortemperatureinusers’premisesshallnotbeaffected.
• The frequency of the DR events and the changes in the supplytemperatureshouldbedefinedandpresentedtotheusersaprioriaspercontractterms
• AlivefeedoftheDHnetworkandalltheproductionunits is inplaceandusedtodetectanyfaultthatcanoccurwithintheDHnetwork
Actors(stakeholders) • Buildingowners• Utilitycompany

D2.1:State-of-the-art,scenarios,requirementsandKPIs
Page36of84
OPTiModelling
Componentsinvolved
• DynamicandphysicalmodeloftheDHnetwork• Economicmodel
BasicPath Step1. Theutilitycompanyactivatestheusecase.Step2. The utility company defines a new supply temperature curve,whichisappliedtoalldifferentproductionfacilitiesStep3. Ifthedifferentialpressuresstarttodroptocriticalvaluesoranyother faults occur (e.g. flow limitations), the system must respond anddeviatefromthenewsupplycurve.Step4. Tests will be performed where the supply temperature islowered foraperiodofamonthor so. Since thecurveonlywillbealteredduringcoldperiods,thetestsmustbeperformedduringthewinter.Thetestswillbemonitoredandanalysedasitproceeds.Step5. Evaluation and analysis (including economic evaluation) of thetrial data will be performed after the tests along with an economicevaluation.Step6. Theusecaseterminates
Post-conditions Thetestwillbefundamentaltoverifytheeffectivenessoftheeconomicmodelaswellasthephysicalmodelofthenetwork.
Currentinventoryoftoolsandcomponents(incl.maturityanddevelopmentneeds)
Currentinventory:
• Flowmeters
• Temperatureindicatorsonsupplyandreturntemperatures
• Pressure(differentialpressure)meters
• Power(productionunits)
• RPMofpumps
• NETSIM–simulatingstaticbehaviourintheDHnetwork.
Developmentneeds:
• Sensorstomeasurefloworpressureincreaseofpumps(Tobeabletocalculate theenergyconsumption fromthepumpssoas tocomparethemodelwithgroundtruth)
ModellingRequirements
ConsumerandEconomicmodels(WP3)
An economic model to assess, under different scenarios, the costs and thebenefits of applying a decreased supply temperature both from theconsumer’s and theutility company’s side taking also into consideration theinstallationor/andoperationofpumpingstations.
System&Physicalmodellingincl.dynamicmodels(WP4)
PhysicalanddynamicmodeloftheDHnetwork.Inthephysicalmodel,theDHgridwillbebuilt inavirtualenvironmentwhere thepipes,productionunits,valves etc. shall be modelled. The model should be dynamic to capturedynamicphenomena,e.g.theeffectofaccumulatedheatinpipes.

D2.1:State-of-the-art,scenarios,requirementsandKPIs
Page37of84
Control&Optimisation(WP5)
Thegoal istooptimisethesupplycurve. Initially it is importanttodeterminewhattypeofparametersthecurvewillconsider.Thecurvethatweareusingtodayisafunctionoftheoutsidetemperatureinthemaincity.Thenewcurvemight also consider the outside temperature in the area of Sunderbyn. Thetemperature difference between these areas can be significant. Theoptimisationshallalsoconsidertrade-offs(e.g.betweenlowerDHproductionandincreasedpumping).
Datarequirements EconomicModelling:
• Energyproductionbothbasedontheoldandnewcurve(estimatedinthiscase)
• Costofproductionbothbasedontheoldandnewcurve(estimatedinthiscase)
• Costofpumping• Costofinstallingnewpumps
Productionside:
• Pumpso Properties:Location,power,volumeflowo Measurement:Pressure
• Pipeso Properties: Location, diameter, volume flow capacity,
insulation,lengtho Measurement: differential pressure, supply/return
temperature,volumeflowrates• Productionsunits
o Properties:Location,powero Measurement: Supply/return temperature, supply/return
pressure.• Auxiliaryboiler
o Properties:Timeseriesofusage,capacity,typeoffuelo Measurement:Energconsumption,runtime
Consumptionside:
• Buildingo Properties: Location, inertia, heat capacity, number of
occupants, type and usage of building, heated floor area,ventilation,desiredindoortemperature.
o Measurement: indoor temperature, outdoor temperature,supply/returntemperature,heatingenergyconsumption
o Controlvariables:supplytemperature• DHsubstation
o Properties: Heat exchanger (dimension, efficiency), controlsystem,pumps,controlvalves(responsetime),
o Measurement: Supply/return temperature, flow rate, heattransfercoefficient
• Behavioro Properties: Time series of water consumption, energy
consumption,

D2.1:State-of-the-art,scenarios,requirementsandKPIs
Page38of84
o Measurement: Water energy consumption, heating energyconsumption, warm water temperature, flow rate of warmwater
ConsumerModelling:
• Demographicdata(sizeandtypeofhouseandfamilyetc.)• Historicalconsumption• Preferredindoortemperature• Outsidetemperature
Realization
Mainresponsiblepartners(Author)
LEN
Contributingpartners AllpartnersinWP6
Priority HIGH
3.4 UC-04:LIMITATIONSINDHNETWORK(LULEA)
OPTiUseCaseDescription
ID 04
Title LimitationsinDHnetwork
RelevantOPTipilot Luleå
Description(narrative)andbusinessneed
Thegoalof thisusecase is toallowtheutilitycompany tocreateadynamicmodeloftheDHnetwork,wherethepressuredecreasecanbeoptimizedbytheinstallationoflargerpipesorviaothersolutionstoaddressthelimitationsinthenetwork.
In general every DH network has limitations, for example a DH central in abuildingmightbeworkingpoorlyortheremightbenarrowDHpipesresultinginahighpressuredecrease.
In Luleå, a known limitation is the DH pipes in the area of Bergnäset.BergnäsetisanareasouthofthecityandontheothersideoftheLuleariver.TheareaisconnectedtothecitybyabridgewheretheDHpipesareplaced.The volume of demand served by the existing pipes on the bridge is smallcomparedtothedemandonBergnäset.ThehighpressuredecreaseintheDHnetwork affects the distribution of energy from the production unit. It maymandate more pumping stations or in the worst-case scenario in anotherproductionunitrunningonfossil fuels,e.g.oil. Inparticular,withmediumorhigh demand the pressure decrease to the area is too large, forcing theactivationofthehotwatercentral(HVC)inBergnäset.
Pumpingstationsarelocatedattheendofthebridge,tocompensateforthesignificantdecreaseinpressure,soastomaintainagooddifferentialpressure

D2.1:State-of-the-art,scenarios,requirementsandKPIs
Page39of84
attheendpointsofthenetwork.
Someinterestingsolutionsforsolvingtheabovelimitationarestatedbelow.
1. IncreasepipediameterovertheBergnäsetbridge:Thiswilldecreasethepressurelosses.However,thismightbeinfeasiblesincethebridgemightnotbeabletosupporttheweightofheavierpipes.
2. Increasepipediameterwithanunderwaterpipesolution:Thiswilldecreasethepressurelosses.
3. AgaspipelinefromtheCHPplanttotheHVCinBergnäset.TheHVCplant,thatsupportsBergnäsetwithextraenergy,startswhenthedemandofheatfromBergnäsetreachestheupperlimit.Thisoccurswhentheoutsidetemperaturebecomeslowerthan-7degreesCelsius.TheHVCusespelletsandwhenneededalsooilasfuel.UsingsurplusgasesfromSSAB,theCO2emissionstotheenvironmentwilldecreasecomparedtothecasetoday.
Thisisausecasethatcanbeperceivedasanextensionoftheotherusecases.Noseparatephysicalsimulationmodelshouldbenecessary.Itonlyrequiresaneconomicmodeltocalculatethesavings.
Toincreasethepipediameterisaquestionofcostbenefitanalysisandtrade-offs.Whileonetrade-offisthecost,otherfactorscanalsoplayarolesuchaslegislations (what is the pipe diameter limit), environmental considerationsandotherrestrictions(ifany).
Trigger • The use case can be initialised and executed continuously or incombinationwith other use cases. The use case can start when thephysicalsimulationmodelofthenetworkisavailable.
Pre-conditionsandinfrastructurerequirements(ifapplicable)
• Thenecessarymeasuringequipment is integrated in theDHnetworkto retrieve data regarding the pressure, temperature, incoming andoutgoingvolumeflowrates,etc.
• Information regarding the production units, the power costs, etc. isavailable.
• Information concerning the current or forecasted outdoortemperatureisavailable.
• AvirtualmapoftheDHgridalongwithareportthatsummarisestheimportant parameters, e.g. the pressure decrease in the pipes isavailable.
• AlivefeedoftheDHnetworkandalltheproductionunits is inplaceand can used to detect any fault that can occur within the DHnetwork.
• ThevirtualsimulationmodelwhichhastheabilitytosimulatevariousscenariosintheDHnetworkisavailable.Thedifferentscenariosmustconsider physical factors such as outside temperature, power fromproductionunitsetc.
• Ifafatalerroroccursduringthesimulation,thesimulationshouldstopandgiveanunderstandableexplanationastowhythesimulationhasstopped.
Actors(stakeholders) • Utilitycompany

D2.1:State-of-the-art,scenarios,requirementsandKPIs
Page40of84
OPTiModelling
Componentsinvolved
• DynamicmodeloftheDHnetwork• Economicmodel
BasicPath Step1. Theutilitycompanyactivatestheusecase.Step2. Given an outdoor temperature and DH production, the utilitycompany defines a set point for the pressure decrease that should beobservedwithinthepipesStep3. IfthepressuredecreaseisveryhighorafatalerroroccurstheusecaseisterminatedStep4. Theusecaseisterminated
Comments:Simulationwillbeperformedtofindthepressuredecreaseinthepipes at different outside temperatures and different DH consumptionspatterns.Inaddition,differentscenarioswillbeexaminedwithregardtothetrade-offsbetweenthecostofchangingthepipesandtherelativeadvantageofutilisingthepelletboilerinBergnäsetmoreeffectivelyversustheefficientutilisationofthesurplusgasintheDHnetwork.
Currentinventoryoftoolsandcomponents(incl.maturityanddevelopmentneeds)
NETSIMmodels
ModellingRequirements
ConsumerandEconomicmodels(WP3)
Aneconomicmodel toassess thebenefits and the trade-offsofutilizing thesurplusgastoahigherextentorexploitingthepelletboilerinBergnäsetmoreefficientlyversustheinstallationofnewlargerpipes.
System&Physicalmodellingincl.dynamicmodels(WP4)
PhysicalanddynamicmodeloftheDHnetwork.Inthephysicalmodel,theDHgridwillbebuilt inavirtualenvironmentwhere thepipes,productionunits,valvesetc.shallbemodelled.
Control&Optimisation(WP5)
What would be the best way to use different fuels and production units intermsofeconomyandemissionsindifferentscenarios?
Datarequirements EconomicModelling:
• Energyproduction• Costofproduction• Costofoperationofplantsandpumping• Costofinstallingnewpipes
Productionside:
• Pumpso Properties:Location,power,volumeflowo Measurement:Pressure
• Pipeso Properties: Location, diameter, volume flow capacity,
insulation,length
D2.1:State-of-the-art,scenarios,requirementsandKPIs
Page41of84
o Measurement: differential pressure, supply/returntemperature,volumeflowrates
• Productionsunitso Properties:Location,powero Measurement: Supply/return temperature, supply/return
pressure.• Auxiliaryboiler
o Properties:Timeseriesofusage,capacity,typeoffuelo Measurement:Energconsumption,runtime
ConsumerModelling:
• Demographicdata(sizeandtypeofhouseandfamilyetc.)• Historicalconsumption• Details regarding the adjustment of incoming flow to achieve the
temperaturesetpoint(e.g.equationand/orlookuptableetc.)• Preferredindoortemperature• Outsidetemperature
Realization
Mainresponsiblepartners(Author)
LEN
Contributingpartners AllpartnersinWP6
Priority HIGH
3.5 UC-05:OPTIMIZINGVALVES(LULEA)
OPTiUseCaseDescription
ID 05
Title Optimizingvalves
RelevantOPTipilot Luleå
Description(narrative)andbusinessneed
Theobjectiveof thisuse case is to reduce thepeak loadenergydemandbyinstalling the smallest possible control valves (optimally sized) at userpremisesthatcontrolthehotwatersupplytothebuildings.Fromaconsumerperspective,itisimportantthatthevalvesarenottoosmallsoastoguaranteetheprovisionofhotwater.Thepositiveeffectofthisusecasewouldbebetter(lower) return temperature and decreased energy consumption both in theDH substation and in the entire DHC network. Optimised hot water valveswould prevent surplus water to pass through the valves, leading to amoreeven temperature of the hotwater for the consumer. This is because smalland optimised valves need shorter time to determine the correct level ofopening. Bigger valves might oscillate between the open and closed stateswithoutfindingthecorrectlevelofopening,resultinginhigherthannecessary

D2.1:State-of-the-art,scenarios,requirementsandKPIs
Page42of84
hotwatertemperature.
Optimizingvalvesisfavourableforbothconsumersandutilitycompanysincethere are hundreds of oversized control valves in the DH network whichtogether have a great negative impact. By using smaller valves in the DHsubstations, the entire DHC network will have shorter response time afterdisturbances. Since optimised control valves have potentially smallerdimensions,theflowrateinthefullyopenstateislessthanthecorrespondingflow rate with valves of larger dimensions. The result is that several morebuildingscansharetheflowthatotherwisemighthavebeenconsumedbyonebuilding alone. Also, if toomany control valves close to theDH productionopen up fully it will lead to shortage in areas farther from the production,whichwouldleadtomorepumping.InsomecasesLENwouldneedtoturnonfossil fuel plants to cover the shortage, albeit for a short time after thedisturbance.
To analyse the overall effect of the use case, it is important to make adynamic model that shows how decreasing all over dimensioned controlvalvesintheDHCnetworkwillaffecttheoverallproductionandresponsetimewithin the DHC network. Another important aspect to evaluate from theperspectiveofLEN is toanalyse if it isprofitabletohelpthehouseownertofinancethecostofchangingvalves.
Theanalysisof theeffectofoptimizingcontrolvalves should revealhowtheoptimizationisbeneficialforthebuildingowneraswellastheutilitycompany.Sincethecontrolvalvesareownedbythebuildingownersandnottheutilitycompany,itisimportantthatthesavingsareclearlyanalysedonboththeDHnetworkaswellasfortheDHsubstations.Eventually,projectedsavingsatthelevelofDHsubstationswill incentivizebuildingownerstofinancethechangeofoversizedvalves.
Trigger • The use case can be initialised and executed continuously or incombinationwithotherusecases.
Pre-conditionsandinfrastructurerequirements(ifapplicable)
• Knowledge of all the DH substations with over 100 KW subscribedpowerandknowledgeofcorrespondingcontrolvalves.
• Thenecessarymeasuringequipment is integrated in theDHnetworkandDHsubstationstoretrievedata
Actors(stakeholders) • EndUser• Buildingowners• Utilitycompany
OPTiModelling
Componentsinvolved
• Economicmodel• DynamicandPhysicalmodelofDHnetworkandDHsubstations• Optimisationmodel
BasicPath Step1. Theusecaseisinitiated.Step2. AmodeloftheDHnetworkwithsubstationscontainingcontrolvalvesisbuilt.Step3. Themodelisanalysedtodeterminewhichcontrolvalvesshouldbefirstchangedtomaximizethepositiveeffects.Step4. Simulation is done to understand the effect of changing thecontrolvalvesonboththeDHCnetworkandtheDHCsubstation.
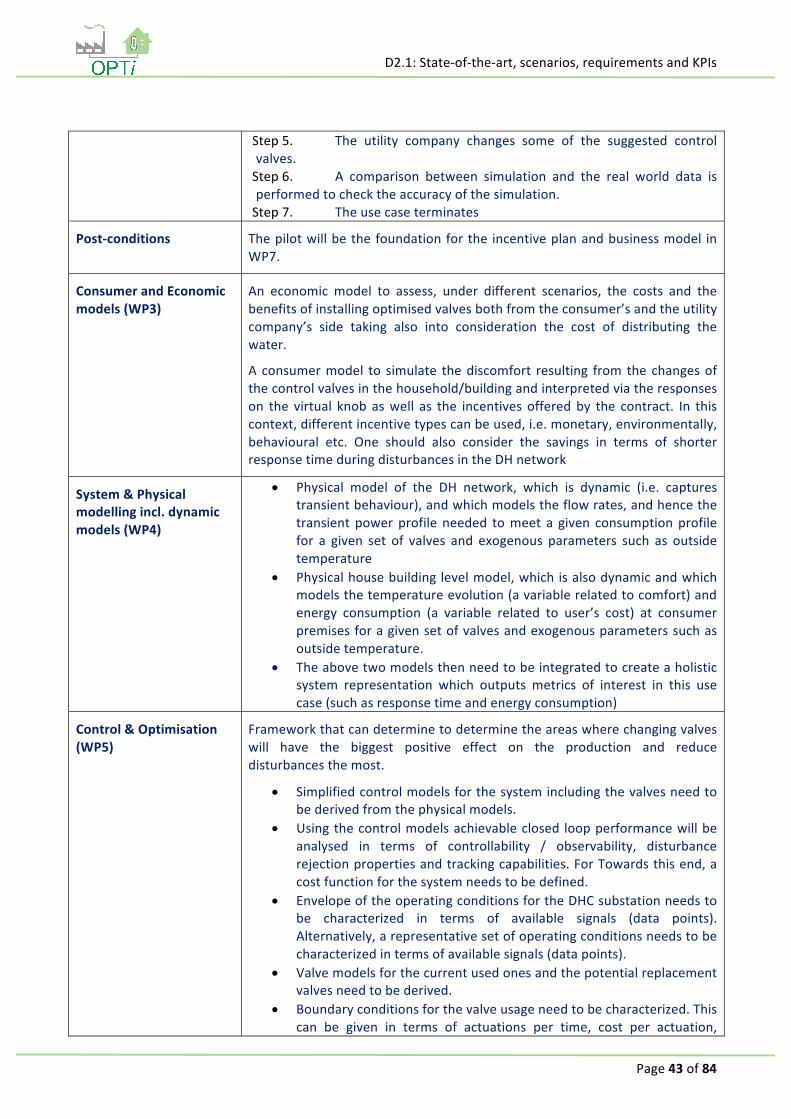
D2.1:State-of-the-art,scenarios,requirementsandKPIs
Page43of84
Step5. The utility company changes some of the suggested controlvalves.Step6. A comparison between simulation and the real world data isperformedtochecktheaccuracyofthesimulation.Step7. Theusecaseterminates
Post-conditions Thepilotwillbethefoundationforthe incentiveplanandbusinessmodel inWP7.
ConsumerandEconomicmodels(WP3)
An economic model to assess, under different scenarios, the costs and thebenefitsofinstallingoptimisedvalvesbothfromtheconsumer’sandtheutilitycompany’s side taking also into consideration the cost of distributing thewater.
A consumermodel to simulate thediscomfort resulting from the changesofthecontrolvalvesinthehousehold/buildingandinterpretedviatheresponseson the virtual knob aswell as the incentives offeredby the contract. In thiscontext,differentincentivetypescanbeused,i.e.monetary,environmentally,behavioural etc. One should also consider the savings in terms of shorterresponsetimeduringdisturbancesintheDHnetwork
System&Physicalmodellingincl.dynamicmodels(WP4)
• Physical model of the DH network, which is dynamic (i.e. capturestransientbehaviour),andwhichmodelstheflowrates,andhencethetransient powerprofile needed tomeet a given consumptionprofilefor a given set of valves and exogenous parameters such as outsidetemperature
• Physicalhousebuildinglevelmodel,whichisalsodynamicandwhichmodelsthetemperatureevolution(avariablerelatedtocomfort)andenergy consumption (a variable related to user’s cost) at consumerpremisesforagivensetofvalvesandexogenousparameterssuchasoutsidetemperature.
• Theabovetwomodelsthenneedtobeintegratedtocreateaholisticsystem representation which outputs metrics of interest in this usecase(suchasresponsetimeandenergyconsumption)
Control&Optimisation(WP5)
Frameworkthatcandeterminetodeterminetheareaswherechangingvalveswill have the biggest positive effect on the production and reducedisturbancesthemost.
• Simplifiedcontrolmodelsforthesystemincludingthevalvesneedtobederivedfromthephysicalmodels.
• Usingthecontrolmodelsachievableclosed loopperformancewillbeanalysed in terms of controllability / observability, disturbancerejectionpropertiesandtrackingcapabilities.ForTowardsthisend,acostfunctionforthesystemneedstobedefined.
• EnvelopeoftheoperatingconditionsfortheDHCsubstationneedstobe characterized in terms of available signals (data points).Alternatively,arepresentativesetofoperatingconditionsneedstobecharacterizedintermsofavailablesignals(datapoints).
• Valvemodelsforthecurrentusedonesandthepotentialreplacementvalvesneedtobederived.
• Boundaryconditionsforthevalveusageneedtobecharacterized.Thiscan be given in terms of actuations per time, cost per actuation,
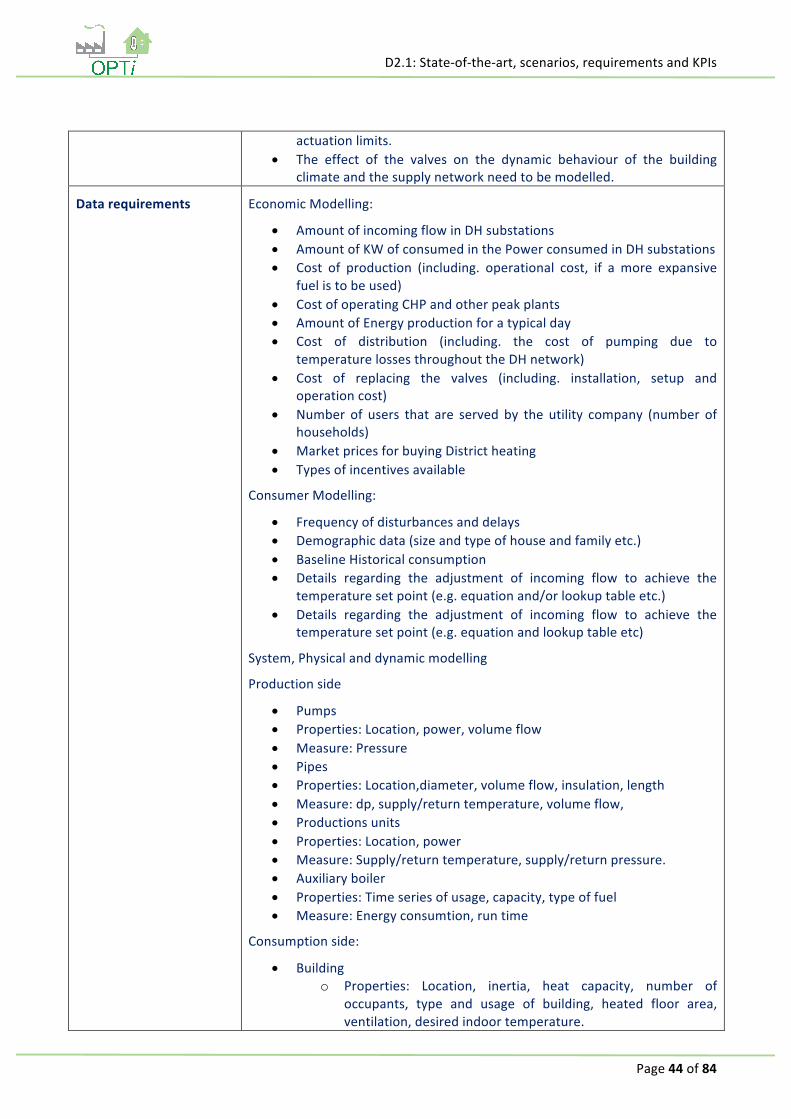
D2.1:State-of-the-art,scenarios,requirementsandKPIs
Page44of84
actuationlimits.• The effect of the valves on the dynamic behaviour of the building
climateandthesupplynetworkneedtobemodelled.
Datarequirements EconomicModelling:
• AmountofincomingflowinDHsubstations• AmountofKWofconsumedinthePowerconsumedinDHsubstations• Cost of production (including. operational cost, if a more expansive
fuelistobeused)• CostofoperatingCHPandotherpeakplants• AmountofEnergyproductionforatypicalday• Cost of distribution (including. the cost of pumping due to
temperaturelossesthroughouttheDHnetwork)• Cost of replacing the valves (including. installation, setup and
operationcost)• Number of users that are served by the utility company (number of
households)• MarketpricesforbuyingDistrictheating• Typesofincentivesavailable
ConsumerModelling:
• Frequencyofdisturbancesanddelays• Demographicdata(sizeandtypeofhouseandfamilyetc.)• BaselineHistoricalconsumption• Details regarding the adjustment of incoming flow to achieve the
temperaturesetpoint(e.g.equationand/orlookuptableetc.)• Details regarding the adjustment of incoming flow to achieve the
temperaturesetpoint(e.g.equationandlookuptableetc)
System,Physicalanddynamicmodelling
Productionside
• Pumps• Properties:Location,power,volumeflow• Measure:Pressure• Pipes• Properties:Location,diameter,volumeflow,insulation,length• Measure:dp,supply/returntemperature,volumeflow,• Productionsunits• Properties:Location,power• Measure:Supply/returntemperature,supply/returnpressure.• Auxiliaryboiler• Properties:Timeseriesofusage,capacity,typeoffuel• Measure:Energyconsumtion,runtime
Consumptionside:
• Buildingo Properties: Location, inertia, heat capacity, number of
occupants, type and usage of building, heated floor area,ventilation,desiredindoortemperature.

D2.1:State-of-the-art,scenarios,requirementsandKPIs
Page45of84
o Measurement: indoor temperature, outdoor temperature,supply/returntemperature,heatingenergyconsumption
o Controlvariables:supplytemperature
• DHsubstation
o Properties: Heat exchanger (dimensiosn, efficiency), controsystem,pumps,controlvalves(responsetime),
o Measurement: Supply/return temperature, flow rate, heattransfercoefficient
• Behavioro Properties: Time series of water consumption, energy
consumption,
o Measurement: Water energy consumption, heating energyconsumption, warm water temperature, flow rate of warmwater
Realization
Mainresponsiblepartners(Author)
LEN
Contributingpartners AllpartnersfromWP6
Priority HIGH
3.6 UC-06:ENERGYREDUCTION(LULEA)
OPTiUseCaseDescription
ID 06
Title EnergyReduction
RelevantOPTipilot Simulated–LuleåpilotrepresentationinOPTi-Sim
Description(narrative)andbusinessneed
Theoverall objectiveof this use case is to determine a scheme to re-design(refurbish) an existing DHC system such that the resulting systemwill needless primary energy (KPI value: 30%),whileminimizing the economic impactontheutilitycompanyandnotaffectingthecomfortofthecustomer.
Trigger Re-designoftheDHCsystem
Pre-conditionsandinfrastructurerequirements(ifapplicable)
• OPTi-Sim framework with information on the physical system, theconsumermodelsandeconomicmodels
• OPTi-Simframeworkisreadyforsimulation
Actors(stakeholders) • Engineersattheutilitycompany

D2.1:State-of-the-art,scenarios,requirementsandKPIs
Page46of84
OPTiModelling
Componentsinvolved
• DynamicandphysicalmodeloftheDHnetwork• Physicalmodelofthedifferentbuildings• Forecastingmodel(e.g.weatherforecasting)• Economicmodel• Consumermodel• Loadmodel(differentscenarios)
BasicPath Step1. Theusecasebeginswiththetargettoreducetheenergyusageforspaceheatingandcooling.
Step2. The utility company in order to reduce the energy used forheating initiates an investigation if there are opportunities to modify thecurrent DHC system which render less energy usage without altering thecomfortoftheendconsumer.Step3. The engineers compose the OPTi-Simmodel for the differentscenarioswhichneedtobetestedStep4. The OPTi-Framework will then perform an analysis of thecurrent control and operation strategies and determine alternatives forredesignoftheDHCsystembychanginghardwareandcontrolsoftware.Step5. The alternative design is implemented in the OPTi-Sim andevaluated.Step6. The new design is implemented in the DHC system andguidelinesforoperationareupdated.Step7. Theusecaseterminates
Post-conditions The simulation use case will provide the schematics for planning therefurbishmentofanexistingDHCsystem.
Currentinventoryoftoolsandcomponents(incl.maturityanddevelopmentneeds)
N/A
ModellingRequirements
ConsumerandEconomicmodels(WP3)
Consumer model that expresses the behaviour of the consumer and aneconomic model that expresses the cost of refurbishment and energyreductionontheutilitycompany.
System&Physicalmodellingincl.dynamicmodels(WP4)
Physicalmodelofbuildingwhichincludes:
• Characteristicsofthebuilding(size,activity,occupancy)• Theinertiaofthebuilding• Consumption(consumptionpattern,set-pointpreferences)• Controllers• DHsubstation(radiators,floorheatetc.)
Dynamic and physicalmodel of theDH system, fromproduction unit to theconsumers,whichmodels:
• TheDHnetwork(pumps,pipes)• TheDHproduction(power,pressure,temperature,)• TheDHsubstation(controlactions,consumption)
Inaddition,weatherforecastingmodelswouldberequiredtoanalysewhento

D2.1:State-of-the-art,scenarios,requirementsandKPIs
Page47of84
preheatorcoolthebuilding.
Inventory of replaceable physical components including their economiceffects.
Control&Optimisation(WP5)
Optimization scheme that considers different replacement plans andevaluatestheirenergyusageandeconomiceffectontheutilitycompany.
Datarequirements N/A
Realization
Mainresponsiblepartners(Author)
LTU
Contributingpartners AllpartnersinWP6
Priority HIGH
3.7 UC-07:IMPROVEDEFFICIENCY(LULEA)
OPTiUseCaseDescription
ID 07
Title ImprovedEfficiency
RelevantOPTipilot Simulated–LuleåpilotrepresentationinOPTi-Sim
Description(narrative)andbusinessneed
Theoverallobjectiveofthisusecaseistoshowinwhatwaytheefficiencyofthe current DHC system can be improved by changing and adapting thecurrentcontrolstrategiesandcurrentoperationstrategiesoftheDHCsystem.These changes will only be made in the control system software and inguidelines on how to operate the system. The targeted outcome of the usecasewillbelessenergyusedwhileminimallyeffectingtheend-consumer.
Trigger Re-designoftheDHCsystem
Pre-conditionsandinfrastructurerequirements(ifapplicable)
• OPTi-Sim framework with information on the physical system, theconsumermodelsandeconomicmodels
• OPTi-Simframeworkisreadyforsimulation
Actors(stakeholders) • Engineersattheutilitycompany
OPTiModelling
Componentsinvolved
• DynamicandphysicalmodeloftheDHnetwork• Physicalmodelofthedifferentbuildings• Forecastingmodel(e.g.weatherforecasting)• Economicmodel• Consumermodel

D2.1:State-of-the-art,scenarios,requirementsandKPIs
Page48of84
• Loadmodel(differentscenarios)
BasicPath Step1. Theusecasebeginswhenoneofthefollowingtwoconditionsisfulfilled: (i) The DHC system is recurrently not able to satisfactorilyprovide heating or cooling to end-customers, (ii) The cost for supplyingheatingorcoolingneedtobereduced.
Step2. The utility company in order to reduce the energy used forheating initiates an investigation if there are opportunities to control andoperatethecurrentDHCsysteminadifferentwaytofulfilltheperformancerequirements.Step3. The engineers compose the OPTi-Simmodel for the differentscenarioswhichneedtobeimproved.Step4. The OPTi-Framework will then perform an analysis of thecurrent control and operation strategies and determine alternatives tocontrolandoperatetheDHCsystem.Step5. Thealternativecontrolandoperationscheme is implementedintheOPTi-Simandevaluated.Step6. ThenewcontrolschemeisimplementedintheDHCsystemandguidelinesforoperationareupdated.Step7. Theusecaseterminates
Post-conditions The simulation use case will provide the schematics for planning therefurbishmentofanexistingDHCsystem.
Currentinventoryoftoolsandcomponents(incl.maturityanddevelopmentneeds)
N/A
ModellingRequirements
ConsumerandEconomicmodels(WP3)
Consumer model that expresses the behaviour of the consumer and aneconomic model that expresses the cost of refurbishment and energyreductionontheutilitycompany.
System&Physicalmodellingincl.dynamicmodels(WP4)
Physicalmodelofbuildingwhichincludes:
• Characteristicsofthebuilding(size,activity,occupancy)• Theinertiaofthebuilding• Consumption(consumptionpattern,set-pointpreferences)• Controllers• DHsubstation(radiators,floorheatetc.)
Dynamic and physicalmodel of theDH system, fromproduction unit to theconsumers,whichmodels:
• TheDHnetwork(pumps,pipes)• TheDHproduction(power,pressure,temperature,)• TheDHsubstation(controlactions,consumption)
Inaddition,weatherforecastingmodelswouldberequiredtoanalysewhentopreheatorcoolthebuilding.

D2.1:State-of-the-art,scenarios,requirementsandKPIs
Page49of84
Inventory of replaceable physical components including their economiceffects.
Control&Optimisation(WP5)
Optimization scheme that considers different replacement plans andevaluatestheirenergyusageandeconomiceffectontheutilitycompany.
Datarequirements N/A
Realization
Mainresponsiblepartners(Author)
LTU
Contributingpartners AllpartnersinWP6
Priority MEDIUM
3.8 UC-08:OPTIMISINGCONSUMERSELECTIONANDINCENTIVESFORADR(LULEA)
OPTiUseCaseDescription
Title Optimising consumer selection and incentives for ADR (and contributingtowardsaccomplishingtheKPI5target).
RelevantOPTipilot Simulated–LuleåresidentialpilotrepresentationinOPTi-Sim
Description(narrative)andbusinessneed
To evaluate the performance of incentive-based Automated DemandResponse (ADR) program and quantify its effects on user demand and usercomfort,aswellastherelevantbenefitsineconomicterms.
Trigger Peakdemandproblem(duringmorningandafternoonpeaks)
Pre-conditionsandinfrastructurerequirements(ifapplicable)
• ContractswithusersthatenabletheirparticipationinADR• Appliancelevelmeteringinfrastructure(notmonitoring)• Automatically controlled appliances or special infrastructure for
controllingshiftableappliances• Monitoring infrastructure - including devices displaying consumption
(inhouses)• User interfaces for interacting with them (e.g. virtual knob for
providingfeedback)• Infrastructureforfeedbackprovisioning(e.g.virtualknob)
Actors(stakeholders) • Utilitycompany• Consumers(householdresidents)• Housecompanies
OPTiModelling
Componentsinvolved
• Economicmodel• Consumermodel(includingapplianceoperationmodelling)• Baseline (including weather forecast and definition of consumption
pattern)

D2.1:State-of-the-art,scenarios,requirementsandKPIs
Page50of84
BasicPath Step8. TheutilitycompanyestimatestherequiredenergyreductiontobeattainedtoavoidaspecificpeakStep9. The utility company selects a set of consumers that will betargetedforADRanddefinestherespectiveconsumptionschedulesforeachofthemtobeimposedduringtheADReventStep10. The utility company estimates the amount of incentives thatshouldbeofferedtoeachofthetargetedusersStep11. TheutilitycompanyexecutestheADReventStep12. Consumers caneitheraccept theexecutionofADRor reject it(byoptingoutfromtheprogramandoperatingtheirappliancesastheyfit)Step13. Consumers (voluntarily) send their feedback e.g. through thevirtualknobStep14. The utility company evaluates the performance andeffectivenessoftheADRprogramintermsof
a. Consumerresponsivenessb. LoadImpactc. DiscomfortImpactd. ConsumerEngagemente. Etc.
Step15. If the reduction target (that corresponds toeachconsumer) ismet,theutilitycompanygrantstheincentivestoeachofthemStep16. If the user opt-outs from the ADR event, the utility companyimposes an opt-out penalty (various mechanisms to be defined andevaluated)Step17. Theusecaseterminates
Post-conditions The simulation use case will provide a quantitative analysis of theeffectivenessofADRaccompaniedwith incentives for tacklingwith thepeakdemandproblem.
ExceptionPaths N/A
Diagram(optional) N/A
Currentinventoryoftoolsandcomponents(incl.maturityanddevelopmentneeds)
N/A
ModellingRequirements
ConsumerandEconomicmodels(WP3)
Consumer model that quantifies the benefit obtained by the operation ofspecific appliances and the discomfort caused by any alternation from thebaselineschedule.
System&Physicalmodellingincl.dynamicmodels(WP4)
-
Control&Optimisation(WP5)
OptimisationschemesoftheselectionofusersandtheincentivesforADR(tobeinvestigatedifitwillbeused)

D2.1:State-of-the-art,scenarios,requirementsandKPIs
Page51of84
Datarequirements N/A
Realization
Mainresponsiblepartners(Author)
AUEB
Contributingpartners AllpartnersinWP6
Priority MEDIUM

D2.1:State-of-the-art,scenarios,requirementsandKPIs
Page52of84
4 REQUIREMENTS
The requirements for the OPTi framework are listed in the following tables. We have categorized therequirementsaccordingtothedifferentcomponentsoftheOPTiframeworkas illustratedinFigure5andpresentedinmoredetailinDeliverableD2.3SystemArchitecture.Eachrequirementcategoryhasitsspecifictag,which ispartof the requirement ID.The requirementsare formulatedaccording to theEARS syntax(Mavin, 2009). Depending on the source of a requirement, it is either functional or non-functional.RequirementsthatarederivedfromausecaseoraKPIarefunctionalandrequirementsthatarederivedfromthearchitecturearenon-functionalrequirements.Thischaracteroftherequirements iscapturedbyaddingashorttagtothenameentries.
Figure6:RequirementcategoriesandtagsfortheOPTiframework.
For documenting and development of the requirements, we have used a template with the followingentries:
• ID:Identificationnumberoftherequirementcontainingameaningtag
• Vers.:Versionoftherequirementtotrackchanges
• Name:Shortnamefortherequirementcontainingatagforfunctional(F)andnon-functional(NF)requirements
• Author:Initialsandinstitutionofauthor(s)

D2.1:State-of-the-art,scenarios,requirementsandKPIs
Page53of84
• Source:Eitherthesystemarchitecture,one/severalusecase(s)orKPI(s)
• RelatedRQ:ID(s)ofrelatedrequirements
• Partnerincharge:Partnerorganizationthatisresponsibleforarequirement
• Priority:eitherhighorlow
• Status:draft,approved(appr.)ordone
• Requirement:FormalrequirementinEARSsyntax
ThistemplatewasimplementedintheWikimoduleofthecollaborativeonlineworkenvironmentRedmine,(seewww.redmine.org)andusedduring thedevelopment,discussionand reviewingof the requirementswork. The extreme simplicity and easy way to get started together with the versioning and cross-referencingof requirementsenableda transparentand traceableworkprocess.Although theWiki isnotintended to be used as formal requirement development tool in a commercial context, within acollaborativeresearchprojectwithaheterogeneousanddistributedworkgrouptheappliedworkprocesswas very efficient. In Figure 7, the development environment is shown including the discussion and thereview results. Thediscussionoccurredwithin the core-team thatdeveloped the requirement,while thereviewwasdonebyareviewteamwhichhasmoreglobalperspectiveontherequirementsasawhole.
Figure7:ExampleforarequirementasitwasderivedanddocumentedintheRedmineWiki(snapshot).
Thecurrentlydevelopedrequirementswillbeusedthrough-outtheprojectandpotentiallycomplementedwithmoreinformationandadditionalrequirementsincasethatwouldbeneededtosuccessfullycompletetheOPTiproject.
In order to strengthen innovativeness of the project and create competitive advantage, OPTi aims tomainstreamagenderperspective in selected, relevantprojectactivities. In thecourseof theseactivities,wehavereviewedtherequirementsfromagenderperspectiveandconsideredtheneedforgenderspecificrequirements,especiallyinthecategoriesforconsumerandeconomicmodelling.

D2.1:State-of-the-art,scenarios,requirementsandKPIs
Page54of84
4.1 RQ-OF:OPTI-FRAMEWORK
ID Vers. Name Author Source RelatedRQ Partnerincharge Priority Status
RQ-OF-001 1.0 (NF)OPTi-SimComponent VC(IBM),WB(LTU) architecture RQ-SI TWT high appr.
Requirement TheOPTiFrameworkshallincludeaSimulationComponent,calledOPTi-Sim.
RQ-OF-002 1.0 (NF)Consumermodellingcomponent
VC(IBM),WB(LTU) architecture RQ-CM IBM high appr.
Requirement TheOPTiframeworkshallincludeaconsumermodellingcomponent.
RQ-OF-003 1.0 (NF)Economicmodellingcomponent
GT(AUEB),WB(LTU) architecture RQ-EM AUEB high appr.
Requirement TheOPTiframeworkshallincludeanEconomicModellingComponent.
RQ-OF-004 1.0 (NF)PhysicalModellingComponent
YR(TWT),WB(LTU) architecture RQ-PM OPN high appr.
Requirement TheOPTi-FrameworkshallincludeaPhysicalModellingComponent.
RQ-OF-005 1.0 (NF)OptimisationandControlComponent
YR(TWT),WB(LTU) architecture RQ-OC LTU high appr.
Requirement TheOPTi-FrameworkshallincludeanOptimisationandControlComponent.
RQ-OF-006 1.0 (NF)DataManagementandStorage YR(TWT) architecture RQ-DS RTHA high appr.
Requirement TheOPTi-FrameworkshallincludeaDataManagementandStorageComponent.
4.2 RQ-SI:OPTI-SIM
ID Vers. Name Author Source RelatedRQ Partnerincharge Priority Status
RQ-SI-001 1.0 (NF)Connectsimulationmodels
YR,UO,NL(TWT) architecture N/A TWT high appr.
Requirement TheOPTi-SimComponentshallconnectdifferentsimulationmodels.
RQ-SI-002 1.0 (NF)Co-simulatesimulationmodels
YR,UO,NL(TWT) architecture N/A TWT high appr.
Requirement TheOPTi-SimComponentshallco-simulatedifferentsimulationmodels.
RQ-SI-003 1.0 (NF)AccesstoDataManagementandStorage
YR,UO,NL(TWT) architecture RQ-DS TWT high appr.
Requirement TheOPTi-SimComponentshallhaveread/writeaccesstotheDataManagementandStorageComponent.
RQ-SI-004 1.0 (NF)AccesstoOptimisationandControlRepository
YR,UO,NL(TWT) architecture RQ-OC-101,RQ-OC-102 TWT high appr.
Requirement TheOPTi-SimComponentshallhavereadaccesstotheOptimisationandControlRepository.
RQ-SI-005 1.0 (NF)Graphicaluserinterface YR(TWT) architecture N/A TWT high appr.
Requirement TheOPTi-SimComponentshallhaveagraphicaluserinterfaceincludingagraphicalrepresentationoftheDHCsystem.
RQ-SI-006 1.0 (F)Calculatedeffectsofpeakloadreduction HS(LEN) UC-01 RQ-SI LTU low appr.

D2.1:State-of-the-art,scenarios,requirementsandKPIs
Page55of84
Requirement TheOPTi-SimComponentshallcalculatetheeffectsofpeakloadreductionontheDHnetworkandproduction.
RQ-SI-007 1.0 (F)Magnitudeofheatstoragecapacity HS(LEN) UC-01 RQ-SI LTU high appr.
Requirement TheOPTi-SimComponentshallestimatethemagnitudeoftheheatstoragecapacityisintheDHnetworkandbuildings.
RQ-SI-008 1.0 (F)Productionsimulationfromforecasts HS(LEN) UC-01 RQ-SI LTU low appr.
Requirement TheOPTi-SimComponentshallenablesimulationofproductionfromaforecast.
4.3 RQ-OC:OPTIMISATIONANDCONTROLCOMPONENT
ID Vers. Name Author Source RelatedRQ Partnerincharge Priority Status
RQ-OC-001 1.0 (NF)Datamanagementandinterfaces WB(LTU) architecture RQ-DS LTU high appr.
Requirement Theoptimisationandcontrolcomponentshallhavefunctionalitytointeractwiththedatamanagementsystem.
RQ-OC-002 1.0 (NF)Operationstrategies WB(LTU) architecture RQ-OC-2XX LTU high appr.
Requirement TheoptimisationandcontrolcomponentshallcontainfunctionalitytocalculateefficientoperationstrategiesforagivenDHCsystem.
RQ-OC-003 1.0 (NF)PerformanceMonitoringandEvaluation WB(LTU) architecture RQ-OC-3XX OPN high appr.
Requirement TheoptimisationandcontrolcomponentshallprovidefunctionalitytoassesstheperformanceoftheDHCsystem.
RQ-OC-004 1.0 (NF)Controlstructureandcontrollerdesign WB(LTU) architecture RQ-OC-4XX LTU high appr.
Requirement TheoptimisationandcontrolcomponentshallprovidefunctionalitytodesignacontrolsystemforagivenDHCsystem.
RQ-OC-101 1.0 (NF)Controlorientedmodelrepository UO(TWT) architecture RQ-DS-008 LTU low appr.
Requirement TheOptimisationandControlComponentshallstorecontrolorientedmodelsinarepositoryintheDataManagementandStorageComponent.
RQ-OC-102 1.0 (NF)Controlorientedmodelstorage UO(TWT) architecture RQ-DS LTU high appr.
Requirement Theoptimisationandcontrolcomponentshallexclusivelystorecontrolmodelsinthecontrolmodelrepository.
RQ-OC-103 1.0 (NF)Controlmodelrepositoryaccess UO(TWT) architecture RQ-DS-008 LTU high appr.
Requirement TheOptimisationandControlComponentshallhaveexclusiveread/writeaccesstothecontrolorientedmodelrepository.
RQ-OC-104 1.0 (NF)Controlsystemrepresentationrepository WB(LTU) architecture RQ-OP-001,RQ-DS-011 RTHA high appr.
Requirement TheOptimisationandControlComponentshallstorecontrolsystemrepresentationsinarepositoryintheDataManagementandStorageComponent.
RQ-OC-105 1.0 (NF)Controlsystemrepresentationstorage WB(LTU) architecture RQ-OC-104 LTU high appr.
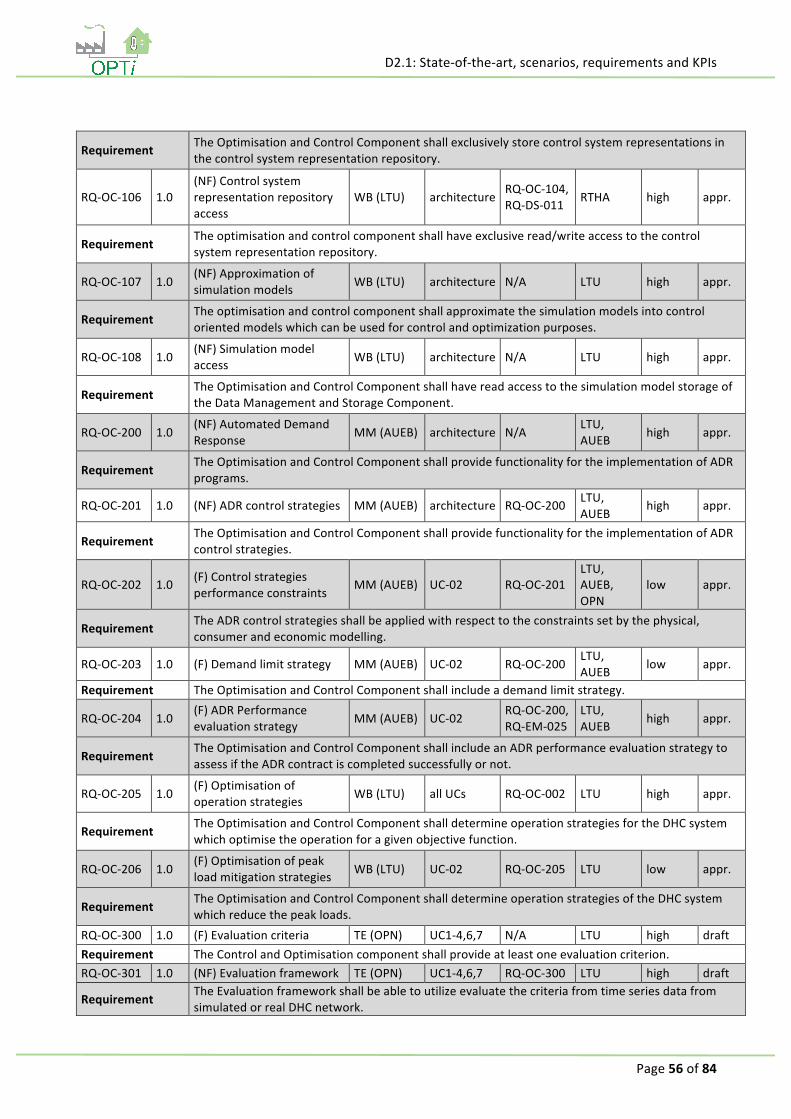
D2.1:State-of-the-art,scenarios,requirementsandKPIs
Page56of84
Requirement TheOptimisationandControlComponentshallexclusivelystorecontrolsystemrepresentationsinthecontrolsystemrepresentationrepository.
RQ-OC-106 1.0(NF)Controlsystemrepresentationrepositoryaccess
WB(LTU) architecture RQ-OC-104,RQ-DS-011 RTHA high appr.
Requirement Theoptimisationandcontrolcomponentshallhaveexclusiveread/writeaccesstothecontrolsystemrepresentationrepository.
RQ-OC-107 1.0 (NF)Approximationofsimulationmodels WB(LTU) architecture N/A LTU high appr.
Requirement Theoptimisationandcontrolcomponentshallapproximatethesimulationmodelsintocontrolorientedmodelswhichcanbeusedforcontrolandoptimizationpurposes.
RQ-OC-108 1.0 (NF)Simulationmodelaccess WB(LTU) architecture N/A LTU high appr.
Requirement TheOptimisationandControlComponentshallhavereadaccesstothesimulationmodelstorageoftheDataManagementandStorageComponent.
RQ-OC-200 1.0 (NF)AutomatedDemandResponse MM(AUEB) architecture N/A LTU,
AUEB high appr.
Requirement TheOptimisationandControlComponentshallprovidefunctionalityfortheimplementationofADRprograms.
RQ-OC-201 1.0 (NF)ADRcontrolstrategies MM(AUEB) architecture RQ-OC-200 LTU,AUEB high appr.
Requirement TheOptimisationandControlComponentshallprovidefunctionalityfortheimplementationofADRcontrolstrategies.
RQ-OC-202 1.0 (F)Controlstrategiesperformanceconstraints MM(AUEB) UC-02 RQ-OC-201
LTU,AUEB,OPN
low appr.
Requirement TheADRcontrolstrategiesshallbeappliedwithrespecttotheconstraintssetbythephysical,consumerandeconomicmodelling.
RQ-OC-203 1.0 (F)Demandlimitstrategy MM(AUEB) UC-02 RQ-OC-200 LTU,AUEB low appr.
Requirement TheOptimisationandControlComponentshallincludeademandlimitstrategy.
RQ-OC-204 1.0 (F)ADRPerformanceevaluationstrategy MM(AUEB) UC-02 RQ-OC-200,
RQ-EM-025LTU,AUEB high appr.
Requirement TheOptimisationandControlComponentshallincludeanADRperformanceevaluationstrategytoassessiftheADRcontractiscompletedsuccessfullyornot.
RQ-OC-205 1.0 (F)Optimisationofoperationstrategies WB(LTU) allUCs RQ-OC-002 LTU high appr.
Requirement TheOptimisationandControlComponentshalldetermineoperationstrategiesfortheDHCsystemwhichoptimisetheoperationforagivenobjectivefunction.
RQ-OC-206 1.0 (F)Optimisationofpeakloadmitigationstrategies WB(LTU) UC-02 RQ-OC-205 LTU low appr.
Requirement TheOptimisationandControlComponentshalldetermineoperationstrategiesoftheDHCsystemwhichreducethepeakloads.
RQ-OC-300 1.0 (F)Evaluationcriteria TE(OPN) UC1-4,6,7 N/A LTU high draftRequirement TheControlandOptimisationcomponentshallprovideatleastoneevaluationcriterion.RQ-OC-301 1.0 (NF)Evaluationframework TE(OPN) UC1-4,6,7 RQ-OC-300 LTU high draft
Requirement TheEvaluationframeworkshallbeabletoutilizeevaluatethecriteriafromtimeseriesdatafromsimulatedorrealDHCnetwork.

D2.1:State-of-the-art,scenarios,requirementsandKPIs
Page57of84
RQ-OC-302 1.0 (NF)RealDHC-netdataaccess TE(OPN) RQ-OC-301,
UC1-4 RQ-DS-002 LTU high draft
Requirement TheEvaluationframeworkshallbeabletoaccessSensordatathepilotDHC-networks,LuleåandMallorca.
RQ-OC-303 1.0 (NF)SimulatedDHC-netdataaccess TE(OPN) RQ-OC-301
UC5-6 RQ-DS-002 LTU high draft
Requirement TheEvaluationframeworkshallbeabletoaccessSensordatafrompilotDHC-networks.
RQ-OC-304 1.0 (NF)Administrationofevaluationdata TE(OPN) architecture RQ-DS001 LTU low draft
Requirement TheEvaluationframeworkshallhaveastructuredwayofrepresentingandstoringevaluationresultsthatmakesitpossibletotracktheconditionsfortheevaluation.
RQ-OC-400 1.0 (F)Generationofacontrolsystemsrepresentation WB(LTU) allUCs RQ-OC-004 LTU high appr.
Requirement TheOptimisationandControlComponentshallgenerateacontrolsystemrepresentationforcontrollersintheDCSsystem.
RQ-OC-401 1.0 (F)Controlstructuredecision WB(LTU) UC-06 RQ-OP-004 LTU high appr.
Requirement TheoptimisationandcontrolcomponentshalldecideonanfeasiblecontrolstructureforthecontroloftheDHCsystem.
RQ-OC-402 1.0 (NF)Controllerdesignstrategies WB(LTU) architecture RQ-OC-004 LTU high appr.
Requirement Theoptimisationandcontrolcomponentshallhaveasetofcontrollerdesignstrategiesavailableforthecomputationofcontrollermodels.
RQ-OC-403 1.0 (F)Visualizationofthecontrolstructures WB(LTU) UC-06 RQ-OC-004 LTU high appr.
Requirement TheoptimizationandcontrolcomponentshallvisualizethecurrentcontrolstructurealongwiththeDHCsystem.
RQ-OC-404 1.0 (F)Computationofcontrollermodels WB(LTU) UC-07 RQ-OC-004 LTU high appr.
Requirement Whenagivencontrolstructureandselectioncontrollerdesignstrategyareprovided,thecontrolmoduleshalldesignacontroller.
RQ-OC-405 1.0 (F)Computationofcontrolstructures WB(LTU) UC-06,UC-
07 RQ-OC-401 LTU low appr.
Requirement Whenacontrolorientedmodelwithoperatingconditionsandconstraintsisprovided,theoptimisationandcontrolcomponentshallcomputeaasetoffeasiblecontrolstructures.
RQ-OC-406 1.0 (F)Closedloopperformanceprediction WB(LTU) UC-06,UC-
07 RQ-OC-300 LTU high appr.
Requirement TheOptimisationandControlComponentshallpredictorestimatetheperformanceofagivenclosed-loopcontrolmodeloftheDHCsystemforagivencontrolsystemrepresentationandscenario.
RQ-OC-901 1.0 (F)Valvestobechanged GT(AUEB) UC-01 RQ-OC LTU high appr.
Requirement TheOptimisationandControlComponentshallprovideadecisiononwhichvalvesneedtobechanged.
RQ-OC-902 1.0 (F)Effectsofchangedvalves HS(LEN) UC-01 RQ-OC LTU high appr.
Requirement TheOptimisationandControlComponentshalldeterminetheeffectofchangedcontrolvalvesontheDHCsystem.
RQ-OC-903 1.0 (F)Signaltostartpeakloadreduction HS(LEN) UC-01 RQ-OC LTU high appr.
Requirement Theoptimisationandcontrolcomponentshallprovideasignaltostartpeakloadreduction.

D2.1:State-of-the-art,scenarios,requirementsandKPIs
Page58of84
RQ-OC-904 1.0 (F)Optimisationfordifferentprodutioncases HS(LEN) UC-01 RQ-OC LTU high appr.
Requirement TheOptimisationandControlComponentshallderiveoptimisationofdifferentproductioncases.
RQ-OC-905 1.0 (F)Identifyingbuildingsforoptimisation HS(LEN) UC-01 RQ-OC LTU high appr.
Requirement TheOptimisationandControlComponentshallincludefuntionalitytoidentifybuildingsintheDHCnetwork,whichhaveahighpotentialforpeakloadreduction.
4.4 RQ-PM:PHYSICALMODELLINGCOMPONENT
ID Vers. Name Author Source RelatedRQ Partnerincharge Priority Status
RQ-PM-001 1.0 (F)DHCnetworkmodel PL(OPN),JG(LTU) UC-03 RQ-PM-
002,003 OPN high appr.
Requirement ThephysicalmodelcomponentshallcontainaDHCnetworkmodel.
RQ-PM-002 1.0 (F)DHCnetworkmodelboundary
PL(OPN),JG(LTU) UC-03 RQ-PM-
001,003 OPN low appr.
Requirement TheDHCnetworkmodelshallbeaclosedsystem.
RQ-PM-003 1.0 (F)DHCnetworkmodelmedium
PL(OPN),JG(LTU) UC-03 RQ-PM-
001,002 OPN high appr.
Requirement ThethermaldistributionmediumintheDHCnetworkmodelshallbewater.
RQ-PM-004 1.0 (F)DHCcomponentdefinition
PL(OPN),JG(LTU) UC-03 RQ-PM-
(001-013) OPN high appr.
Requirement TheDHCnetworkconsistsofcomponentsincludingpipes,pumps,valves,heatexchangers,productionunits,heatsinks(consumers).
RQ-PM-005 1.0 (F)DHCcomponentlocation
PL(OPN),JG(LTU) UC-03 RQ-PM-
(001-013) OPN high appr.
Requirement ThecomponentsoftheDHCnetworkshallhavealocation.
RQ-PM-006 1.0 (F)DHCcomponentpressure
PL(OPN),JG(LTU) UC-03 RQ-PM-
(001-013) OPN high appr.
Requirement ThecomponentsoftheDHCnetworkshallaffectthepressureofthedistributionmedium(inthenetwork).
RQ-PM-007 1.0 (F)DHCcomponentflowrate
PL(OPN),JG(LTU) UC-03 RQ-PM-
(001-013) OPN high appr.
Requirement ThecomponentsoftheDHCnetworkshallaffecttheflowrateofthedistributionmediumintheDHCnetwork.
RQ-PM-008 1.0 (F)DHCpipematerialthermalstorage VC(IBM) UC-02 RQ-PM-
(001-013) OPN low appr.
Requirement Thepipemodelshallrepresentthepipingmaterialthermalstoragecapacity.
RQ-PM-009 1.0 (F)DHCproductionunitsupply
PL(OPN),JG(LTU)
UC-02,UC-03
RQ-PM-(001-013) OPN high appr.
Requirement Aproductionunitmodelshallsupplyapressureincreaseandatemperatureincreasetothethermaldistributionmedium.
RQ-PM-010 1.0 (F)DHCproductionunitfuel
PL(OPN),VC(IBM),NL(TWT)
UC-002 RQ-PM-(001-013) OPN high appr.

D2.1:State-of-the-art,scenarios,requirementsandKPIs
Page59of84
Requirement Aproductionunitmodelshallconsumefuel.
RQ-PM-011 1.0 (F)DHCthermalefficiencyPL(OPN),VC(IBM),NL(TWT)
UC-03 RQ-PM-(001-013) OPN high appr.
Requirement Pipesandheatexchangersshallincludeathermalefficiency.
RQ-PM-012 1.0 (F)DHCcontrollablecomponents
PL(OPN),JG(LTU) UC-05 RQ-PM-
(001-013) OPN high appr.
Requirement Pumpsandvalvesmodelsshallbeactuatedbyacontrolsignal.
RQ-PM-013 1.0 (F)DHCdynamics PL(OPN),JG(LTU) UC-03 RQ-PM-
(001-013) OPN high appr.
Requirement ThephysicalmodeloftheDHCnetworkshallbedynamic.
RQ-PM-014 1.0 (F)BuildingmodelPL(OPN),VC(IBM),NL(TWT)
UC-02 RQ-PM-(014-018) IBM high appr.
Requirement Thephysicalmodelcomponentshallcontainabuildingmodel,whichisaheatsink(consumer)totheDHCnetworkmodel.
RQ-PM-015 1.0 (F)Buildingmodelthermaltimeconstant
PL(OPN),VC(IBM),NL(TWT)
UC-02 RQ-PM-(014-018) IBM high appr.
Requirement Abuildingmodelshallhaveathermalstoragecapacity.
RQ-PM-016 1.0 (F)Buildingthermalconnection
PL(OPN),VC(IBM),NL(TWT)
UC-02 RQ-PM-(014-018) IBM high appr.
Requirement ThebuildingmodelshallaccountforheatexchangebetweenbuildingandtheDHCsystem,andbetweenbuildingandtheenvironment.
RQ-PM-017 1.0 (F)Buildingindoortemperature
PL(OPN),VC(IBM),NL(TWT)
UC-02 RQ-PM-(014-018) IBM high appr.
Requirement Thebuildingmodelshallincludeindoortemperature.
RQ-PM-018 1.0 (F)Buildingmodelconsumerinteraction
PL(OPN),VC(IBM),NL(TWT)
UC-01 RQ-PM-(014-018) IBM high appr.
Requirement ThebuildingmodelshallreceiveinputfromConsumerModellingComponent.
4.5 RQ-CM:CONSUMERMODELLINGCOMPONENT
ID Vers. Name Author Source RelatedRQ Partnerincharge Priority Status
RQ-CM-001 1.0 (F)BaselineModule VC(IBM) UC-02 N/A IBM high appr.Requirement TheConsumerModellingcomponentshallincludeaBaselineModule.
RQ-CM-002 1.0 (F)ThermalComfortModule VC(IBM) UC-02 N/A IBM high appr.
Requirement TheConsumerModellingcomponentshallincludeaThermalComfortModule.RQ-CM-100 1.0 (F)Contextinformation MM(AUEB) UC-05 RQ-CM-1xx IBM high appr.

D2.1:State-of-the-art,scenarios,requirementsandKPIs
Page60of84
RequirementTheBaselineModellingcomponentshallincludeinformationaboutthefollowingcontextualvariables:weatherconditions,marketprices,timeofday,dayofweek,holiday/non-holiday,externaltemperature.
RQ-CM-101 1.0 (F)Temperatureinformation MM(AUEB) UC-02 RQ-CM-1xx IBM high appr.
Requirement TheConsumerModellingcomponentshallincludetheexternaltemperatureforcalculatingtheconsumerbaselines.
RQ-CM-102 1.0 (F)Externaltemperature MM(AUEB) UC-02 RQ-CM-1xx IBM high appr.
Requirement TheConsumerModellingcomponentshallincludeinformationabouttheimposedexternaltemperaturestemmingfromalook-uptablethatisavailablefromtheutilitycompany.
RQ-CM-103 1.0 (F)Baselineconsumption VC(IBM) UC-02 RQ-CM-1xx IBM high appr.Requirement TheBaselineModuleshalloutputbaselineconsumptionforthecorrespondingconsumer.
RQ-CM-104 1.0 (NF)Baselineconsumptiongender
PW(LTU),YR(TWT) architecture RQ-CM-1xx IBM high appr.
Requirement TheBaselineModuleshalloutputseparatebaselineconsumptionformaleandfemaleconsumerswhereverpossible.
RQ-CM-200 1.0 (F)Discomfortconsideration MM(AUEB) UC-02 RQ-CM-2xx AUEB high appr.
Requirement ThisThermalComfortModuleshallincorporatemethodologiesforcalculatingthediscomfortoftheconsumers.
RQ-CM-201 1.0 (F)Virtualknobinputindiscomfortcalculations MM(AUEB) UC-02 RQ-CM-2xx AUEB high appr.
Requirement Thediscomfortmodelshalltakeinformationfromthevirtualknobintoconsideration.
RQ-CM-202 1.0(F)Changesintemperatureinputindiscomfortcalculations
MM(AUEB) UC-02 RQ-CM-2xx AUEB high appr.
Requirement Thediscomfortmodelshallconsiderthechangesintheindoortemperatureofthehousehold/building,whereindoortemperatureinformationisavailable.
RQ-CM-203 1.0 (F)Comforttemperaturerange VC(IBM) UC-02 RQ-CM-2xx IBM high appr.
Requirement Thethermalcomfortmoduleshalloutputacomforttemperaturerangeforanindividualconsumer.RQ-CM-204 1.0 (F)Userinconvenience VC(IBM) UC-02 RQ-CM-2xx IBM high appr.Requirement Thethermalcomfortmoduleshalloutputuserinconvenienceforanindoortemperature.RQ-CM-205 1.0 (F)Changeinvalves MM(AUEB) UC-05 RQ-CM-2xx IBM low appr.
Requirement WhenachangeinanyoftheDHCnetworkcomponentsoccursthediscomfortmodelshallbere-computed.
4.6 RQ-EM:ECONOMICMODELLINGCOMPONENT
ID Vers. Name Author Source RelatedRQ Partnerincharge Priority Status
RQ-EM-001 1.0 (NF)Economicmodellingcomponentinterfaces GT(AUEB) architecture RQ-EM RWTH,
AUEB high appr.
Requirement TheEMCshallhaveaccess(read/write)totheOPTidatamanagementandstoragecomponent.
RQ-EM-002 1.0 (F)ConsumercontractinformationforOPTI-Sim GT(AUEB) UC-08,
KPI-5RQ-EM-003,010,011,
AUEB,LEN high appr.

D2.1:State-of-the-art,scenarios,requirementsandKPIs
Page61of84
012
Requirement TheEMCshalltakeasinputparametersrelatedtotheusercontracts.
RQ-EM-003 1.0 (F)Contractterms GT(AUEB) WP3 RQ-EM-002,015,016 AUEB low appr.
Requirement TheEMCshallincludedataforatleastthefollowing:differentconsumertariffs(pricingschemes),contractopt-in/outoptionsandpenalties.
RQ-EM-004 1.0 (F)Marketsimulationmodule GT(AUEB) UC-01,UC-
08,KPI-5 RQ-EM-019 AUEB low appr.
RequirementTheEMCalgorithmsforeconomicoptimisationshallutilisesyntheticinputconcerningmarketpricesandavailabilityofresourcesofatleasttwodifferentmarketstructuressuchasday-ahead/spotandnegawattones.
RQ-EM-005 1.0 (F)Socio-economicsustainabilityanalysis GT(AUEB) KPI-5 RQ-EM-009 AUEB low appr.
Requirement Theresults(outputdata)fromtheEMCalgorithmsshallbeusedforanofflinesocio-economicsustainabilityanalysis(e.g.forcostbenefitanalysisafterapplyingADR).
RQ-EM-006 1.0 (F)Productiontechnologies GT(AUEB) KPI-5 RQ-EM-007,009,010
AUEB,LEN,SMPL
high appr.
Requirement TheEMCshalltakeintoconsiderationatleasttwodifferentproductiontechnologiesduringthecostestimationfromtheprovider'sside.
RQ-EM-007 1.0 (F)Energycompanyproductionthresholds GT(AUEB) UC-01,UC-
02,KPI-5
RQ-EM-006,008,010,014
AUEB,LEN,SMPL
high appr.
Requirement ForplanningDReventstheEMCshallknowtheprovider'supperthresholdforsupplyviathebase/mainplantcorrespondingtotheexactperiodoftheDRevents.
RQ-EM-008
1.0 (F)ADRprogramactivation GT(AUEB) UC-08,
KPI-5
RQ-EM-007,010,RQ-OC-200,201
AUEB high appr.
Requirement Whenthetotaldemandfromcustomersisforecastedtoexceedtheproductionupperthresholdofthemainplant,thentheADRprogramshallbeactivated.
RQ-EM-009 1.0 (F)Socialwelfaremodelling GT(AUEB) KPI-5
RQ-EM-013,RQ-EM-014,RQ-CM-10xseries
AUEB low appr.
Requirement TheEMCshallincorporatealgorithmsforsocialwelfaremodellingandmaximisation.
RQ-EM-010 1.0(F)MethodologiesforDRandADRconsumer'stargeting
GT(AUEB) UC-08,KPI-5
RQ-EM-011,012,RQ-OC-20x,RQ-CM-10x
AUEB high appr.
Requirement TheEMCshallsupportmethodologiesforselectinguserstotargetforDRorADR.
RQ-EM-011 1.0 (F)Numberoftargetingpolicies GT(AUEB) UC-08,
KPI-5
RQ-EM-010,012,RQ-OC-20x
AUEB high appr.
Requirement ThealgorithmsforselectinguserstobetargetedforDRorADRshallincludeatleasttwodifferentpoliciesforcalculatingtherequestedreductionofconsumptionbyconsumers.

D2.1:State-of-the-art,scenarios,requirementsandKPIs
Page62of84
RQ-EM-012 1.0 (F)ConsumerselectionforADR GT(AUEB) UC-08,
KPI-5
RQ-EM-010,011,RQ-OC-20x,RQ-CM-10x,20x
AUEB high appr.
Requirement WhenanADRprogramisactivated,theeconomicmodellingcomponentshallselectuserstotargetforADR.
RQ-EM-013 1.0 (F)Consumers'savings GT(AUEB) KPI-5 RQ-EM-003,009,016 AUEB high appr.
Requirement EMCalgorithmsforeconomicoptimisationshallbeabletoestimatethecustomersavingsintermsofmoneysavedfromreducingtheconsumption.
RQ-EM-014 1.0 (F)Providers'savings GT(AUEB) KPI-5RQ-EM-003,RQ-EM-009,RQ-EM-016
AUEB,LEN high appr.
Requirement EMCalgorithmsforeconomicoptimisationshallbeabletoestimatethesavingsfromreducingtheproduction/supplyfromtheprovider'sside.
RQ-EM-015 1.0 (F)Incentivesconsideration GT(AUEB) UC-08,KPI-5
RQ-EM-003,010,016,017
AUEB high appr.
RequirementTheeconomicoptimisationofDHCsystemsthroughtheEMCalgorithmsshalltakeintoconsiderationtheuseofdifferenttypesofincentivesofferedbytheutilitycompanyformotivatingandengaginguserstochangetheirconsumptionbehaviourand/orparticipatinginADRprograms.
RQ-EM-016 1.0 (F)Monetaryincentives GT(AUEB) UC-08,KPI-05
RQ-EM-003,010,018,RQ-CM-10x,20x
AUEB,LEN low appr.
Requirement TheEMCshallincludemonetaryincentivesinthedefinitionofcontracts.
RQ-EM-017 1.0(F)Behaviouralenhancementsforincentivesandcontracts
GT(AUEB) KPI-05 RQ-EM-015,RQ-CM-20x AUEB low appr.
Requirement TheEMCeconomicoptimisationalgorithmsshallincorporateinputdepictinguser'sbehaviouralcharacteristics.
RQ-EM-018 1.0 (F)Decisiononawardingtheincentives GT(AUEB) KPI-5
RQ-EM-015,016,017,RQ-CM-10x
AUEB,RWTH high appr.
Requirement Forgranting/awardingtheincentivesasdefinedbythecontract,theEMCshalldecidewhetherthetermsweremet.
4.7 RG-DS:DATAMANAGEMENTANDSTORAGE
ID Vers. Name Author Source RelatedRQ Partnerincharge Priority Status
RQ-DS-001 1.0 (NF)DataStore RE(RWTH) architecure N/A RWTH high appr.Requirement TheDataStorageComponentshallstorethedataneededbyComponentsofOPTi-FrameworkRQ-DS-002 1.0 (F)Sensordata RE(RWTH) allUCs N/A RWTH high appr.Requirement TheDataStorageComponentshallstoretimeseriesdatadenotedSensordata.
RQ-DS-003 1.0 (F)Modellingdata RE(RWTH) allUCs N/A RWTH high appr.

D2.1:State-of-the-art,scenarios,requirementsandKPIs
Page63of84
Requirement TheDataStorageComponentshallstorestaticdataofphysicalinfrastructureinformofmodelsdenotedModellingdata.
RQ-DS-004 1.0 (F)ContinousSensordata RE(RWTH) allUCs N/A RWTH high appr.
Requirement TheDataStorageComponentshallstoreSensordatabewithoutgapsintime
RQ-DS-005 1.0 (F)SensorNaming RE(RWTH) allUCs RQ-DS-002 RWTH high appr.
Requirement EachseriesofSensordataisasensorassignedwithaunique(overtime)name
RQ-DS-006 1.0 (F)SensorMissingValues RE(RWTH) allUCs N/A RWTH high appr.
Requirement Thedatamanagementcomponentshallfillgapsinsensordatawithcomputedvalues
RQ-DS-007 1.0 (NF)ControlOrientedModelStorage RE(RWTH) architectur
e RQ-OC RWTH high appr.
Requirement DataManagementComponentshallstorecontrolorientedmodels.
RQ-DS-008 1.0 (NF)ControlOrientedModelsRepository RE(RWTH) architectur
e RQ-OC-102 RWTH high appr.
Requirement TheControlOrientedModelStorageshallactasarepository.
RQ-DS-009 1.0 (F)SensorMissingValues RE(RWTH) allUCs N/A RWTH high appr.
Requirement TheDataManagementComponentshallimportSensorDatafromfilesfetchedfromaftp-server.
RQ-DS-0010 1.0 (NF)Controlsystem
representationStorage RE(RWTH) architecture RQ-OF LTU high appr.
Requirement DataManagementComponentshallstorecontrolsystemrepresentations.
RQ-DS-011 1.0 (NF)ControlsystemrepresentationRepository RE(RWTH) architectur
e RQ-OF LTU high appr.
Requirement TheControlsystemrepresentationStorageshallactasarepository.

D2.1:State-of-the-art,scenarios,requirementsandKPIs
Page64of84
5 KEYPERFORMANCEINDICATORS
KeyPerformanceindicators(KPIs)providequantifiablemeasuresthatfacilitatetheevaluationofacertainprocess, providing an insight into the performance of the system and the potentially neededimprovements.Inasmallprocess,it ispossibletofindacertainKPIthatcapturestheperformanceoftheprocess,whileinalargeprocess,itbecomesmoredifficulttodefineasingleKPIthatprovidestherequiredinsight.TheprincipalKPIsof theOPTiprojectaredescribed in thissection.TheseKPIs focusonthemainobjectivesoftheprojectandwillaid inevaluatingtheirsuccess.MoredetailedKPIs (i.e.ata lower level)willbedefinedbytherespectivetechnicalworkpackagesoftheproject.
The defined core KPIs are the following: reduced energy consumption, reduced peak load, user thermalcomfort flexibility, user thermal comfort flexibility, capability of representing real life events, economicbenefit.
It is important to note that these KPIs are not independent. For example, decreasing the overall energyconsumption(KPI-1)willbeinfluencedbytheworkonthepeakloadreduction(KPI-2)whereasatthesametimetheexpansionoftheuserthermalcomfortzone(KPI-3)willhelpinachievingpeakloadreduction.Thereduction inenergy consumptionwill dependon the control strategiesor action taken in the simulationrunsinthevirtualDHCsystem.Therefore,thevirtualsystemaccuracy(KPI-4)isfundamentalforachievingthefirsttwoKPIs.Finally,economicbenefitswillbe influencedbyalltheKPIsdefinedbefore,becauseallthe actions takenwithin theproject aim the increase thebenefits either for the consumeror theutilitycompany.
5.1 COREKPI-1:REDUCEDENERGYCONSUMPTIONTarget:Theoverallenergyconsumptionisreducedbyatleast30%.
5.1.1 Interpretation
ReductionoftheenergyconsumptionmeansthataDHCsystemwillconsume lessheatorcoldforspaceheating/coolingandtapwaterheating,whilemaintainingcustomersatisfactionintermsofcomfort.Fortheutilitycompaniesthismeansthatlessenergywillbeappliedforthesameoutcome.Theappliedenergycanbe understood in two different ways, (i) the energy that is supplied to the distribution network (ii) theenergy that is used in the heat and cold generation which is subsequently supplied to the distributionnetworkandinturntothecustomer.
Inthefirstcase,thelesssuppliedenergywillmaketheutilitycompaniesselllessenergytothecustomersand in turn will have less revenue from the customers for the same comfort that is provided. Whenmaintaining the customer comfort, the DHC system including the building and its substations have tobecomemoreefficient in extractingheator needing less heat due tobetter insulation.Additionally, thedistributionnetworkcanbecomemoreefficientbyreducinglosses.ThelatterisalreadywelloptimizedinSweden, as the average distribution losses in the Swedish DHC systems amount to not more than 7%(Gustafsson2011).
In the second case, the utility company may still make use of the same amount of primary energy togenerate heat and cold for the supply, butmay use the residual energy to generate electricity or otherformsofenergy for themarket.Essentially, thismeans that theutilitycompanywillmakemoreefficientuse of the primary energy. Nevertheless, the abovementioned improvementsmay also be used in thesecondcase.
The principal idea is to use cost-efficient primary energy sources and at the same time to reduce theusage of auxiliary plants. The reasoning behind this is: (i) Auxiliary plants have low overall relative

D2.1:State-of-the-art,scenarios,requirementsandKPIs
Page65of84
efficiency when start-up, shutdown and fuel transport is considered; (ii) Primary plants operate atdesigned optimal operational point andmake use of energy sources likewaste gases. Furthermore, abetter performance of the DHC network and the customers' building can be achieved by re-design(refurbish)theexistingDHCsystemandthebuildings'insulation.Thiscanbecomplementedbyapplyingloadbalancingprinciplesandtheuseofpassiveheatstorages,i.e.newcontrolstrategies.
Withintheprojecttime-frameandduetothereasonthattheenergyreductionKPIwouldrequirephysicalchanges tobe implementedona largescale,wewillnotbeable tomakea real casevalidation thatwillfulfilKPI1.TheplanistofinduseofthedynamicSimulationmodeloftheLuleåUsecasesandoptimizationstrategiesinacombinationinanattempttoverifythefulfilmentoftheKPI.Furtherwemustdefinewhatourinterpretationof“atleast30%lessenergyconsumed”is.
We interpret thewords“energyconsumed”as theamountprimaryenergy sourcesadded to thedistrictheatingsystemwiththeonlypurposetoproduceheattothesystem.Thisexcludesthewastegasthat isusedtofueltheCHP-plantinordertosupplytheenergyinresponsetothebaseloadofthedistrictheatingsystem.Knowingthatinpractice,thereductionofthisgasconsumptionmeansthatthegaswillbe"burnt"anyway,buttonouse(openflameintheair).However,allauxiliaryplantsshouldbeavoidedtostartfromseveralpointsofview,oneofthembeingtoreducetheamountofaddedfuel(primaryenergyresources)tothesystem.Byutilizingloadbalancingprinciplesandpassivestorage,anddeterminingaschemetore-design(refurbish)theexistingDHCsystemandthebuildingsinsulationourexpectationisthattheamountof energy supplied by theauxiliaryplants can be reduced by 30%. Note that in this KPI load balancingprinciples and passive storage is adopted in order to avoid the operation of the auxiliary units, and tooperate the primary units in its optimal operational conditions and not because of demand/generationlimitationsorconsumerobjectiveswhichmayleadtotheusageofthesametechniques.
Toverifythis,wewillusethedetailedsimulationmodelsoftheLuleåPilotusecasebuildingstoevaluatethelimitationsofthepassivestorageintheparticularbuildings.Realworldtestsintheusecasebuildingswillfollowtoverifythesesimulations.Todrawsomeconclusionsonwhatenergysavingpossibilitieswouldbeiftheapproachwouldbeappliedinfullscale,thedynamicdistrictheatingnetworkmodelwillbeusedtomake simplified full system simulations, to evaluate if we can achieve the targeted 30% reduction ofprimaryenergysources."
While maintaining the customer needs, the reduced energy consumption KPI will be adopted in thefollowingway.Twoapproaches(cases)areforeseen,withuncontrolledcustomerenergydemand(primarycase)andwithcontrolledconsumerdemand(secondarycase).
TheprimarycaseKPIisbasedontheconstraintthattheenduserchoosestherequestedamountofenergy,andtheDHCsystemshouldcomplywiththatdemand.Accordingly,itispossibletoreducetheamountofproduced energy by forecasting the demands according to the given environmental conditions and thepredictedcustomerbehavior.Thereby,anappropriatecontrolscenariowillbeadoptedthatwillsatisfytheuser demand and at the same time, reduce the losses in the system through the right selection of theenergysourcesandtheoptimumtransferoftheheattotheenduser.Thisisessentiallyaproductionsideenergy reductioncase.Abaselineassessmentof theenergyconsumption in thecurrent situationwillbecomparedwithanassessmentofthefuturesituationusingtheOPTiFramework.
The secondary case KPI is more flexible, in which the objective is to meet the customer satisfaction(comfort) levels. In this case, the objective of the control scenario is to minimize the amount of theproducedenergyandoptimizetheheattransferthroughthedistributionnetworkinordertominimizethegeneratedenergywithoutviolatingcustomersatisfactionboundaries.
ThefollowingtaskswillbeutilizedintheprocessoftheevaluationoftheKPI:
1. T4.3Physicalsystemsmodeling:ThistaskwillprovidealargescaleanddynamicalmodelsofDHCnetwork includingbuildings/houses,producers,distributionnetwork,pumpcentrals,sensors,and

D2.1:State-of-the-art,scenarios,requirementsandKPIs
Page66of84
additional heat storage buffers. These models will help to understand the key features of thesystemandtofindthemajorareasofimprovements.
2. T5.2Optimisationandcontrolalgorithms:Inthistask,differentflexiblecontrolandoptimizationmethods will be developed and tested to improve the designated level. These methods will bedeveloped frommicro (improve the low level small parts in the plants, like pumps) and in themacrolevel(improvethelargescalesystemperformance).
3. T6.3 Validation: In this task, the developed methods, those were developed and tested insimulations,willbetestedonthepilots.
5.1.2 Definition
Inthissection,somedefinitionsareprovidedtobeusedinsection5.1.3
Energydensity:Wedefinetheenergydensityastheamountofenergystoredinagivensystem,material,orregionofspaceperunitvolume(Shaw2011).Ifitisrelatedtotheamountofenergyperunitmass,thenitiscalledSpecificEnergy.
EnergyEfficiency:Ingeneral,energyefficiencyreferstousinglessenergytoproducethesameamountofservicesorusefuloutput.Energyefficiencyisoftenbroadlydefinedbythesimpleratio(Patterson1996):
𝐄𝐧𝐞𝐫𝐠𝐲𝐄𝐟𝐟𝐢𝐜𝐢𝐞𝐧𝐜𝐲 =UsefuloutputofaprocessEnergyinputintoaprocess
5.1.3 Assessment
Thereductionoftheenergyconsumedby(orprovidedto)thedistrictheatingandcoolingsystemcanbeassessedbysummingtheenergyusedbytheplantbyfindingtheamountofconsumedfuelandmultiplyingitbytheEnergydensityand/orSpecificEnergy.Accordingly,ifwehavemultipleplants(n)thatwillprovidetherequiredenergyfortheDHC,thetotalenergythatisconsumedby(orprovidedto)theDHCsystemcanbecalculatedas
TotalinputEnergy = consumedfuelofplanti×A
BCD
fuelEnergydensityorspecificEnergy
KnowingthatusefuloutputoftheDHC,whichisthedeliveredenergyintheprimaryKPIandthecustomercomfortinthesecondarycase,shouldbekeptconstantduringtheassessment.ThiscanbeinterpretedastheimprovementintheEnergyEfficiency,aswell.
5.2 COREKPI-2:REDUCEDPEAKLOADTarget:Theenergyconsumptionduringperiodsofpeakloadisreducedbyatleast40%.
5.2.1 Interpretation
Tofullycoverthedemandoftheusers,differenttechnologiesareusedinthepowerplantswithdifferentCO2emissionsperkWhandcostsperkWh.Sowhenthereisapeakload,lessprofitableandenvironmentalfriendlytechnologiesareused,forthatreasonsuppliercompanieswanttoavoidpeakloads.Reducingpeakloadsmeansmovingtheenergydemandfromoneperiodtoanotherperiodinothertoreducetheuselessdeliverables technologies. Another topic would be to reduce the overall consumption, which will becoveredintheKPI1.
Within this project, different strategieswill beused to reducepeak consumptionaspassive storageanduserroomtemperatureflexibility,movingtheenergyfrompeakloadperiodtooff-peakloadperiod.
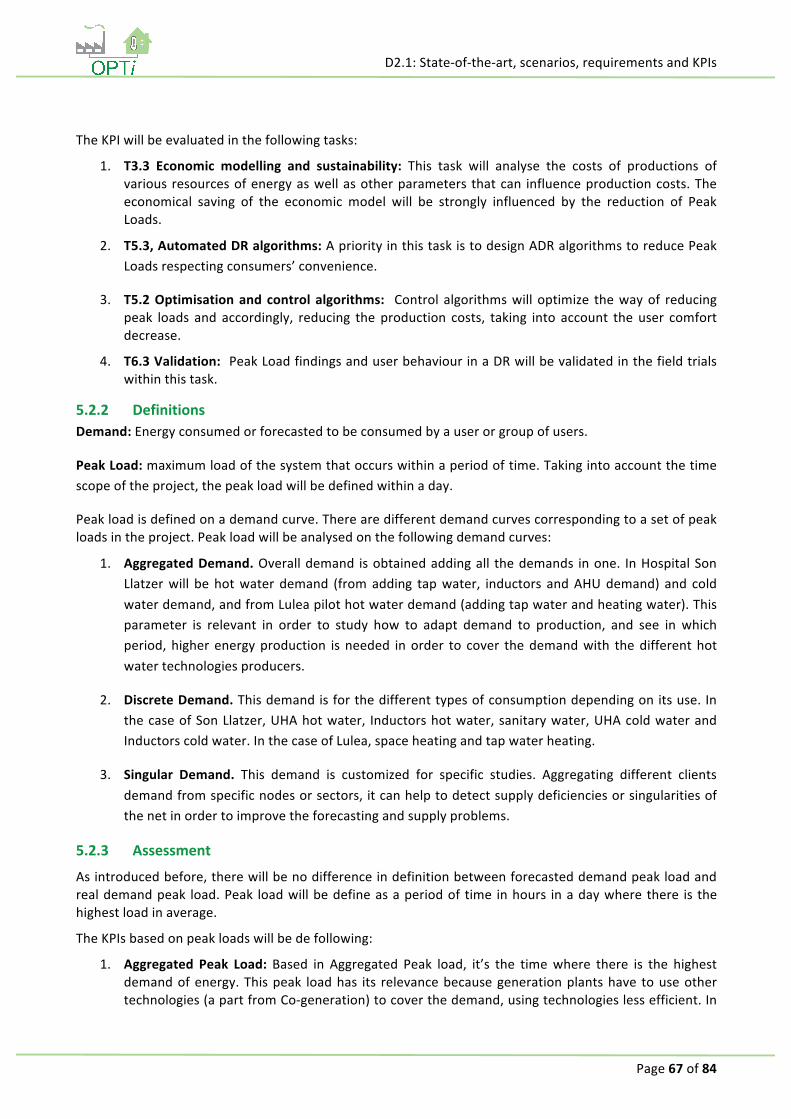
D2.1:State-of-the-art,scenarios,requirementsandKPIs
Page67of84
TheKPIwillbeevaluatedinthefollowingtasks:
1. T3.3 Economic modelling and sustainability: This task will analyse the costs of productions ofvariousresourcesofenergyaswellasotherparameters thatcan influenceproductioncosts.Theeconomical saving of the economic model will be strongly influenced by the reduction of PeakLoads.
2. T5.3,AutomatedDRalgorithms:ApriorityinthistaskistodesignADRalgorithmstoreducePeakLoadsrespectingconsumers’convenience.
3. T5.2Optimisationandcontrolalgorithms: Control algorithmswill optimize thewayof reducingpeak loads and accordingly, reducing the production costs, taking into account the user comfortdecrease.
4. T6.3Validation: PeakLoadfindingsanduserbehaviourinaDRwillbevalidatedinthefieldtrialswithinthistask.
5.2.2 DefinitionsDemand:Energyconsumedorforecastedtobeconsumedbyauserorgroupofusers.
PeakLoad:maximumloadofthesystemthatoccurswithinaperiodoftime.Takingintoaccountthetimescopeoftheproject,thepeakloadwillbedefinedwithinaday.
Peakloadisdefinedonademandcurve.Therearedifferentdemandcurvescorrespondingtoasetofpeakloadsintheproject.Peakloadwillbeanalysedonthefollowingdemandcurves:
1. AggregatedDemand.Overalldemand isobtainedaddingall thedemands inone. InHospitalSonLlatzerwill behotwater demand (fromadding tapwater, inductors andAHUdemand) and coldwaterdemand,andfromLuleapilothotwaterdemand(addingtapwaterandheatingwater).Thisparameter is relevant in order to study how to adapt demand to production, and see in whichperiod,higherenergyproduction is needed inorder to cover thedemandwith thedifferenthotwatertechnologiesproducers.
2. DiscreteDemand.Thisdemandisforthedifferenttypesofconsumptiondependingonitsuse.InthecaseofSonLlatzer,UHAhotwater, Inductorshotwater,sanitarywater,UHAcoldwaterandInductorscoldwater.InthecaseofLulea,spaceheatingandtapwaterheating.
3. Singular Demand. This demand is customized for specific studies. Aggregating different clientsdemandfromspecificnodesorsectors,itcanhelptodetectsupplydeficienciesorsingularitiesofthenetinordertoimprovetheforecastingandsupplyproblems.
5.2.3 Assessment
Asintroducedbefore,therewillbenodifferenceindefinitionbetweenforecasteddemandpeakloadandrealdemandpeak load.Peak loadwillbedefineasaperiodof time inhours inadaywherethere is thehighestloadinaverage.
TheKPIsbasedonpeakloadswillbedefollowing:
1. Aggregated Peak Load:Based in Aggregated Peak load, it’s the timewhere there is the highestdemandofenergy.Thispeak loadhas its relevancebecausegenerationplantshave touseothertechnologies(apartfromCo-generation)tocoverthedemand,usingtechnologieslessefficient.In

D2.1:State-of-the-art,scenarios,requirementsandKPIs
Page68of84
this case,when the demandmake another technology to start generating, itwill be calledpeakloadcriticalpoint.
2. DiscretePeakLoad.Basedonaparticulardemandintermofuse,thispeakloadshowstheenergygenerator the origin on peak loads, and he can plan actionsmore specific, since every discretedemandhasdifferentbehaviour.Forexample,tapwaterhasadifferentcurvedemandtotherestofthedemandsanditisdifficulttoinfluenceitiftheuserdoesn’tchangehisshowerslottime.
3. SingularPeakLoad.Whentestsarenotappliedtothewholesystemandit’sappliedtoaspecificdemands,asaparticularzonesdemandoraspecificbunchofusersdemand.
TheKPI defined in this sectionwill be applied to either trials, Lulea andMallorca, however, theywill beconditionedbythecostsofeachproductioncosts.
5.3 COREKPI-3:USERTHERMALCOMFORTFLEXIBILITYTarget:The average user-accepted temperature comfort zone is widened by approx. 2 degrees Celsius or more. In terms of the KPIs defined later in this section, this can be interpreted asΔ𝐶𝑅G ≥ 2J𝐶, to bevalidatedinT6.3.
5.3.1 Interpretation
QuantifyingthethermalcomfortflexibilityofusersofaDHCsystemisimportantinthecontextoftheOPTiprojectinthefollowingways:
4. T3.1,Consumerpreferencemodelling:Oneof theobjectives inT3.1 is todefineconsumerutilityfunctions thatdependon theconsumers’ consumptionprofilesandcontext, theircomfort zones,the baseline consumption, etc. Hence, defining the comfort zone for the consumer is central tomodellingconsumerpreferences.
5. T5.3, Automated DR algorithms: In the first stage in T5.3, optimization frameworks would beinvestigatedtodeterminethemostoptimalcomfortsettingsoveragiventimewindowinordertoachieve the target peak demand reduction. This approach would require knowledge of theconsumers’ preference settings (for example, lower and upper temperature bounds) in order tomake use of the underlying flexibility in these settings. In Section 4.3.2 we have quantified thepreferencesettingsandflexibilityinthesesettingsbydefining“comfortzone”and“comfortrange”respectively.
6. T6.3,Validation: In this task, the key findings from theprojectwouldbe validated in field trials.Oneoftheaspectsthatwouldbevalidatedisthechangeintheuser’sthermalcomfortflexibilityasaresultofinterventionssuchasDR.
In an attempt to quantify the thermal comfort flexibilityas required by the above tasks,we present aninitialproposalbelow.Theproposalisexpectedtobemodifiedandenhancedfurtherasweproceedwiththeabove-mentionedtasks.
5.3.2 Definitions
WeintroduceafewdefinitionsbelowasapreludefortheKPIsproposedinSection5.3.2.
User:Wedefineauserasanentitywhichderivesbenefit in the formof thermal comfort from theDHCsystem.Inthecaseofresidentialbuildings,theuserscorrespondtoresidentswholiveinthesebuildings.In

D2.1:State-of-the-art,scenarios,requirementsandKPIs
Page69of84
commercial buildings, the users are the occupants e.g. employees in office buildings or patients in ahospital.
ComfortZone:Wedefinethecomfortzone,𝐶𝑍G fortheuser𝑖asatripletgivenbyequation(1).Here,𝑇NO,G isthelowesttemperatureatwhichuser𝑖iscomfortable.Correspondingly,𝑇QO,G isthehighesttemperatureatwhichtheuseriscomfortable.𝑇RSTU,G istheaveragecomforttemperatureforuser𝑖.
𝐶𝑍G = 𝑇NO,G, 𝑇QO,G, 𝑇RSTU,G (1)
ComfortRange:Wedefinethecomfortrange𝐶𝑅G,correspondingtoagivencomfortzone𝐶𝑍G inequation(2).
𝐶𝑅G = 𝑇QO,G − 𝑇NO,G (2)
5.3.3 KPIs
IntheKPIsproposedbelow,wemakeuseoftwosuperscripts,“baseline”and“new”,forvariousquantities.The superscript “baseline” indicates the default value of the quantity, i.e. the value without anyinterventionevents(suchasDR).Thesuperscript“new”indicatesthenewvalueofthequantity,asaresultofanappropriateintervention(e.g.DR). Itshouldbenotedthattheexactconnotationof“new”dependsonthetypeofintervention.However,suchdetailsneedtobeconsideredonlywhenusingtheKPIsduringvarious tasks in theproject (T3.1,T5.3andT6.3). In this chapter,weonlypresentagenericdefinitionoftheseKPIswithoutspecificattributiontoaparticularusecase.TheproposedKPIsareasfollows:
4. Δ𝐶𝑅GW ≔ 𝑇QO,GUSY − 𝑇QO,GZT[S\GUS.
This KPI denotes the change in thehighest temperature atwhich theuser 𝑖 is comfortable, as aresultofan interventionevent. Itcanassumebothpositiveandnegativevalues.Apositivevalueindicatesanincreaseinthecomfortflexibilitywithrespecttothehighesttemperaturethattheuseriswillingtotolerate.
5. Δ𝐶𝑅G] ≔ 𝑇NO,GZT[S\GUS − 𝑇NO,GUSY.
This KPI denotes the change in the lowest temperature atwhich the user 𝑖 is comfortable, as aresultofan interventionevent. Itcanassumebothpositiveandnegativevalues.Apositivevalueindicatesanincreaseinthecomfortflexibilitywithrespecttothelowesttemperaturethattheuseriswillingtotolerate.
6. Δ𝐶𝑅G ≔ Δ𝐶𝑅GW +Δ𝐶𝑅G].
This KPI denotes the change in the comfort temperature range within which the user 𝑖 iscomfortable,asaresultofaninterventionevent.Itcanassumebothpositiveandnegativevalues.Apositivevalueindicatesanincreaseintheoverallcomfortflexibility,whichcanbearesultofanincrease in the lowest temperature or highest temperature or both lowest and highesttemperaturethattheuseriswillingtotolerate.
7. Δ𝑇RSTU,G ≔ 𝑇RSTU,GUSY − 𝑇RSTU,GZT[S\GUS.

D2.1:State-of-the-art,scenarios,requirementsandKPIs
Page70of84
ThisKPIdenotesthechangeinthemeancomforttemperaturepreferenceofauser𝑖,asaresultofaninterventionevent.Itcanassumebothpositiveandnegativevalues.
ItshouldbenotedthattheseKPIscanbeappliedtoboththetrialsites inOPTi– i.e.LuleåandMallorca.However, themethodologiesusedfordeterminationofboth“baseline”and“new”valuesofthecomfortzone𝐶𝑍G areexpectedtodifferbetweenthesetrialsitesbecauseofthedifferenttypesofusers(residentialvs. commercial) and different DHC system types. In particular, for the Luleå trial site, we plan to use a“virtualknob”–i.e.aninteractiveuserthermalfeedbackcollectionmechanismthatwouldbedesignedinthe project. Statistical analysis can then be used to establish comfort zone for each user based on thefeedbackprovidedbyher. In contrast, in theMallorca trial site, relevantcommercialbuildingcodes (e.g.ASHRAE)canbeusedtoestablishthebaselinecomfortzones.Detailedmethodologiesondeterminationofcomfortzonesbasedonfeedbackfromthe“virtualknob”arebeyondthescopeofthisdocumentandwillbethesubjectmatterofD3.1andD5.3.Oneoftheunderlyingeffortsinthesemethodologieswouldbetotranslatecomfortzonesfromtheuserleveltoaroom/house/buildinglevel;thatistoaggregatefeedbackfrommultipleusers.Thedesignofthe“virtualknob”willbecoveredinD2.2andD2.3.Oneofthecentralgoals of the project is to increase the comfort flexibility of users by 2 degree C ormore. One possibleinterpretation of this goal is thatΔ𝐶𝑅G ≥ 2J𝐶, to be validated in T6.3. It should also be noted that Ingeneral,thesevariablesappearingintheaboveKPIscanbetime-varying,butforsimplicityofpresentationwehaveignoredthis.Anappropriateextensiontothetimevaryingcasecanbeincluded,whenneeded.Foradditionalreadingonthermalcomforttemperaturebounds,wedirectthereadertoreferences(ASHRAE,2010)and(Tyleret.al.,2013).
5.4 COREKPI-4:CAPABILITYOFREPRESENTINGREALLIFEEVENTSTarget:ThevirtualDHCsystemshallrepresentreallifeeventswith95%accuracy.
5.4.1 Interpretation
TheOPTiprojectdevelopsavirtualDHCsystem(OPTi-Sim)fortesting,demonstratingandverifyingtherealworld effectiveness of alternative energy sources, additional thermal storages and componentmodernizationintermsofcostandenergyeffectiveness,priortoreallifedeployment.
OPTi-Sim will create sufficient added value for the utility company if and only if real-life events arereplicated correctly and if theusersofOPTi-Sim (operators andengineers) trust the results indicatedbyOPTi-Sim. Therefore, the capability of OPTi-Sim to be able to represent real-life events need to bequantified.
Fromauserperspective, real-lifeevents canbecategorizedas changedoperatingconditionsof theDHCsystem, engineered modifications of the DHC system, failures and degradation of system hardware.Examplesforeventswithinthedifferentcategoriesarethefollowing:
• Peakloadevent(changedoperatingcondition)
• Adverseweatherconditions(changedoperatingcondition)
• Optimisationand/orchangeofvalves(engineeredmodification)
• Additionalthermalstorages(engineeredmodification)
• Stictioninvalves(failureanddegradation)
Anyoftheeventswillleadtoreactionsorchangesinthedynamicbehaviourofmeasurablevariables,whichshouldoccurboth inOPTi-Simand the real-lifeDHC system. If auser (independentof gender) is able toperceivebotheventsasthesameevent,thenOPTi-Simiscorrectlyreplicatingtheeventandbuildingtrustoftheusertothereportedresult.

D2.1:State-of-the-art,scenarios,requirementsandKPIs
Page71of84
OPTi-Simiscomposedofalargenumberofcomponentswhichrepresentsoftwareandhardwareavailablein the real-life DHC system. While models of small scale components may be validated in an isolatedfashion, see for example (Schoukens&Pintelon, 2014) or (Ljung, 1998) as a reference,models for largescale interconnected system,which operate in a vastly changing environment, are extremely difficult tovalidatebasedontimeseriesanalysisofmeasurementdataorexperimentaldata,seeforexample(Horner,2012).Therefore,anapproachtoassessthereplicationofeventswithindefinedreal-lifeuse-caseswillbeusedtoquantifythecapabilitiesofOPTi-Sim.
ThefollowingtaskswillbeutilizedintheprocessoftheevaluationoftheKPIs:
1. T4.3Physicalsystemsmodelling:ThistaskdevelopsandimplementslargescaledynamicalmodelsofaDHCnetworkincludingbuildings/houses,producers,distributionnetwork,pumpcentrals,andsensors.
2. T3.1 Consumer modelling: This task develops consumer models accounting for the thermalcomfortofinvolvedconsumers.
3. T3.3Economicmodelling:Thistasksetsuptheeconomicmodels.
4. T6.3Validation: This task includesall testsperformed in theproject, for thesimulatoraswellasfieldtrialsforthepilots.TheevaluationofKPI-4ismainlypartofthistask.
5.4.2 Definitions
Inordertodetermineifaneventissufficientlywellreplicatedanumberofindicatorscanbeused.Thoseindicatorsshouldreflectthedynamiceffectsofanevent.Theyaredefinedasfollows:
1. Correcttiming.Theevent isrepresentedsufficientlyaccurate intime,whichmeansthecauseandeffectrelationshipiscorrect.Foranumberofmeasuredvariableofause-case,thereactiontime𝑡a,aST\fromtheeventonsetisrecorded.Similarly,thereactiontime𝑡a,[GRisrecorded.Theuserswillthendefineathreshold𝜏a whichimpliescorrecttimingif 𝑡a,aST\ − 𝑡a,[GR < 𝜏a
2. Correct direction. The event will lead to a relative motion 𝑥G = 𝑑𝑥G/𝑑𝑡 of the measuredvariables𝑥G.Thedirectionofthereal𝑥G,aST\ andthesimulated𝑥G,[GRneedtobethesameforvariablesselectedintheuse-cases,whichmeans𝑠𝑖𝑔𝑛(𝑥G,aST\)=𝑠𝑖𝑔𝑛(𝑥G,[GR).
3. Correctmagnitude.Themotionofthemeasuredvariableswill leadtoa𝑑𝑥G duringtheeventonsetandause-casedependent time thereafter.Byevaluating thegain𝑘G = 𝑑𝑥G,aST\/𝑑𝑥G,[GRthemagnitudevaluecanbequantified.Theuserswillthendefineathreshold𝜏Rwhichimpliescorrectmagnitudeif 1 − 𝑘G < 𝜏R.
5.4.3 Assessment
For the use-cases which are conducted during the pilot tests, each event is described and measuredvariables𝑥G
(Qn) are selected.Moreover, the thresholds 𝜏a(Qn) and 𝜏R
(Qn) are defined based on interviewswithengineersandoperators.
AsetofpilottestswillbedefinedandtheeventswillbeevaluatediftheyarecorrectlyreplicatedbyOPTi-Sim,basedontheassessmentoftheindicatorsforthecorrectnessofreplication.OPTi-Simshallbecapableofreplicating95%ofthereal-lifeevents.
5.5 COREKPI-5:ECONOMICBENEFITTarget:CoreImpactKPI-5:Increasedeconomicbenefitforconsumerandutilitycompanybyatleast15%
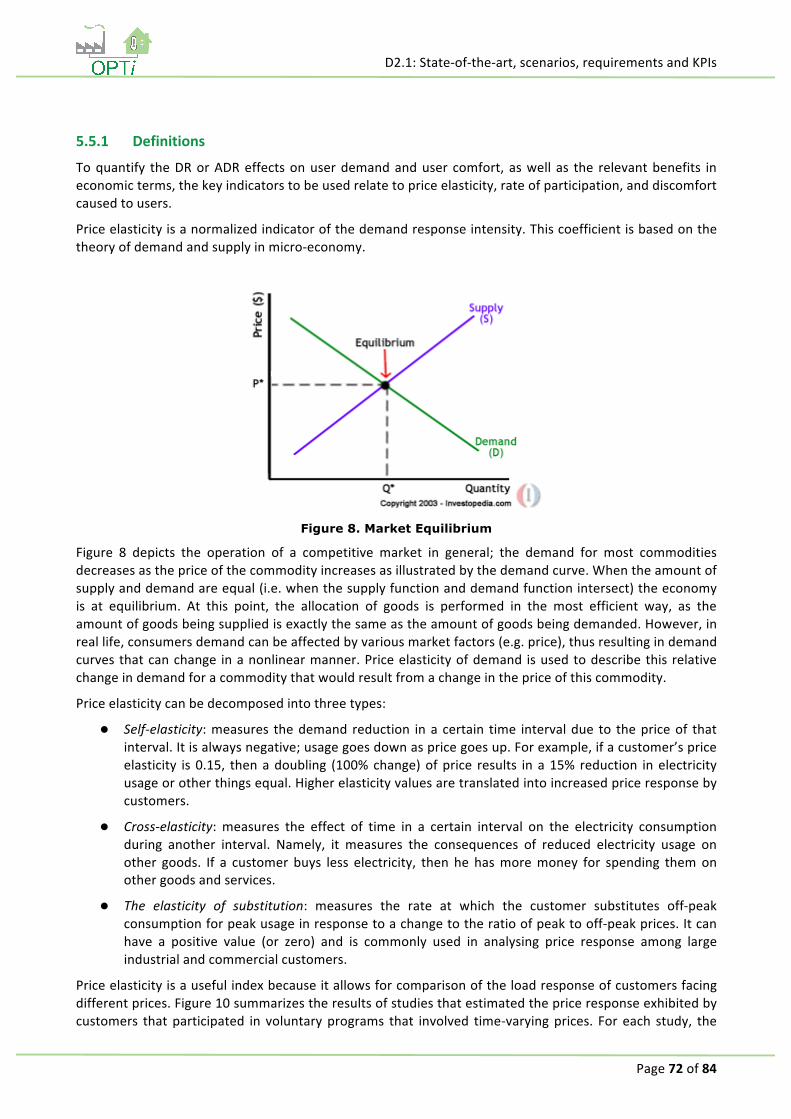
D2.1:State-of-the-art,scenarios,requirementsandKPIs
Page72of84
5.5.1 Definitions
Toquantify theDRorADReffectsonuserdemandanduser comfort, aswell as the relevantbenefits ineconomicterms,thekeyindicatorstobeusedrelatetopriceelasticity,rateofparticipation,anddiscomfortcausedtousers.
Priceelasticityisanormalizedindicatorofthedemandresponseintensity.Thiscoefficientisbasedonthetheoryofdemandandsupplyinmicro-economy.
Figure 8. Market Equilibrium
Figure 8 depicts the operation of a competitive market in general; the demand for most commoditiesdecreasesasthepriceofthecommodityincreasesasillustratedbythedemandcurve.Whentheamountofsupplyanddemandareequal(i.e.whenthesupplyfunctionanddemandfunctionintersect)theeconomyis at equilibrium. At this point, the allocation of goods is performed in the most efficient way, as theamountofgoodsbeingsuppliedisexactlythesameastheamountofgoodsbeingdemanded.However,inreallife,consumersdemandcanbeaffectedbyvariousmarketfactors(e.g.price),thusresultingindemandcurvesthatcanchange inanonlinearmanner.Priceelasticityofdemand isusedtodescribethis relativechangeindemandforacommoditythatwouldresultfromachangeinthepriceofthiscommodity.
Priceelasticitycanbedecomposedintothreetypes:
l Self-elasticity:measures thedemand reduction ina certain time intervaldue to thepriceof thatinterval.Itisalwaysnegative;usagegoesdownaspricegoesup.Forexample,ifacustomer’spriceelasticity is0.15, thenadoubling (100%change)ofprice results ina15% reduction inelectricityusageorotherthingsequal.Higherelasticityvaluesaretranslatedintoincreasedpriceresponsebycustomers.
l Cross-elasticity: measures the effect of time in a certain interval on the electricity consumptionduring another interval. Namely, it measures the consequences of reduced electricity usage onother goods. If a customer buys less electricity, then he hasmoremoney for spending themonothergoodsandservices.
l The elasticity of substitution: measures the rate at which the customer substitutes off-peakconsumptionforpeakusageinresponsetoachangetotheratioofpeaktooff-peakprices.Itcanhave a positive value (or zero) and is commonly used in analysing price response among largeindustrialandcommercialcustomers.
Priceelasticityisausefulindexbecauseitallowsforcomparisonoftheloadresponseofcustomersfacingdifferentprices.Figure10summarizestheresultsofstudiesthatestimatedthepriceresponseexhibitedbycustomers thatparticipated in voluntaryprograms that involved time-varyingprices. For each study, the

D2.1:State-of-the-art,scenarios,requirementsandKPIs
Page73of84
low,average(ortypical),andhighestimatesofpriceresponseareillustrated,althoughtheinterpretationofthe low to high range values varies somewhat across studies. The results suggest that average priceelasticityvaluesarefairlysimilarandservetoobservethebehaviouralchangesofresidential,industrialandcommercialcustomers.Onthecontrary,onecouldargue that the lowandhighelasticityvaluesboth forC&Iandresidentialcustomersexhibitlargevariations,whichcanbeinterpretedbythedifferencesintermsofpriceresponsivenessacrossbusinesscategoriesandvariousmarketsegments.
Variousfactorsmayinfluencecustomers’priceelasticity,includingthenominallevelofprices.Forexample,somecustomersmayberelativelyirresponsiblewhenpricesarelowbutfinditworthwhiletoreduceloadat very high prices. This characteristic of price elasticity has important implications for the design andevaluation of time-varying pricing and DR programs. As for the residential customer response to time-varyingpricesevaluationstudiesoftenreportthatpriceelasticityisdriveninpartbythenumberofspecificappliances that are present in the home. Climate plays also a significant role, as well as the residents’characteristics and the events that they affect,when they are at home and likely to shut off devices orreduceusage.
Figure 9: Customer Response to Time-Varying Prices: Price elasticity Estimates (QDR, 2006)
Finally,greatrole intheevaluationofDRprogramshavethecustomeracceptanceandtheirengagementandrateofparticipationindynamicpricingandDRprograms.Importantfactorsintheconsumer’sdecisionto participate and enrol include the level and type of incentives offered, the type of contracts and theassociatedprograms,thecontractterms(e.g.durationandfrequencyofcurtailments),assessmentofrisksandvalue(e.g., financialconsequencesfor failures),effectivenessofprogramdesignand implementation(e.g.,marketing,technicalassistant)(Hart,1989)Fel!Detgårinrteatthittanågonreferenskälla..Besidesinsome DR programs (e.g., where customers do not directly respond to prices) their response is typicallymeasuredbytheamountofloadreduced.
5.5.2 KPIs
In this section, a number of key performance indicators are identified and described as candidates forevaluatingDRorADRfromaneconomicperspectiveasawhole(Minou,2014).
• 𝐾𝑃𝐼r,D:Differenceof the real consumption from thebaseline. This is themost common indicatorandisusedtoevaluatetheaccuracyofthemethodologyusedforthebaselineestimation.Itcanbemeasuredasthedifference(inpercentageorabsolutenumber)intermsofloads(KWhs)oftherealconsumptionfromthebaselineconsumptionbefore,duringandaftertheDRevent.
• 𝐾𝑃𝐼r,t:DemandPriceElasticity(SelfElasticity).Itmeasuresthesensitivityofcustomer’sdemandtopricechanges.Itcanbecalculatedusingthefollowingformula:

D2.1:State-of-the-art,scenarios,requirementsandKPIs
Page74of84
wheredeischangeinenergydemandanddpischangeinprice.
• 𝐾𝑃𝐼r,u:Customer Responsiveness. It is an indicator that measures how many customers haveresponded to aDRprogram following aDR signal sent to them, like a change inprice. It canbemeasuredas thetotalnumberofsignalssentbackbythecustomersasanabsolutenumberorapercentage.Theterm“signal”asafeedbackisdefinedineachcasebasedontheparticularcontextoftheDRprogram(forexampletheGUIutilized).Furthermore,atthetimeofthereactionoftheuser, the related context-specific aspects can be observed and necessary metadata stored forfurtheruse(e.g.thecustomerresponsivenessonweekends).
• 𝐾𝑃𝐼r,v:AbsoluteorRelativeLoadImpact.Furthertotheabovemetricthisoneisusedinordertospecify the intensity of customer’s response and canbemeasured as thenumberof kWof loadcurtailedorthepercentage(%)ofcustomer’stotal loadthat iscurtailedduringthepeakandoff-peakhours.
• 𝐾𝑃𝐼r,r: AbsoluteDiscomfort Impact. It is used to express howmuch the customer’s comfort haschanged. It is a simple but important indicator and there are various options of measuring it,depending also on the definition of “customer’s comfort” in the specific case. An example ofdiscomfort is the temporary change of temperature to save energy (momentarily stopping airconditioninginsummerorheatinginwinter)asperceivedbytheconsumer.
• 𝐾𝑃𝐼r,w:Discomfortlevelagainsttotalenergyreductionconstraint.Consideringthecasethatthereisanobjectivesetbytheenvironmental/energymanageroradministratorofachievingaspecified% reduction of total consumption (expressed as a “hard” constraint) in a specific household oroffice premises, etc., this metric measures the level of discomfort caused by the specifiedreduction.Thismayvarybasedonthedifferentreductionstrategiesutilizedinordertoachievethetargetreduction.i.e.,DiscomfortlevelXachievedforreduction
(NewTotalConsumption-Orig.TotalConsumption)[%]
• 𝐾𝑃𝐼r,x: Total energy reduction against discomfort level constraint. Compared to theaforementionedmetricthisoneinvestigatestheinversecasei.e.,thechallengeherefortheenergyadministratorofthebuildingistoachievethemaximumreductionofenergyconsumptionwithoutexceedingaspecificdiscomfortlevel/threshold.i.e.,GivenaDiscomfortlevelX,
(NewTotalConsumption-Orig.TotalConsumption)[%]isachieved.
• 𝐾𝑃𝐼r,y:Customer Engagement Index. It is an indicator thatmeasures thenumberof times that aconsumerhas compliedwith the contracts terms, i.e. granting thepermission to theprovider tocontrol the appliances in her premises, without opting out of the program. It can bemeasuredeitherasapercentageoranabsolutenumber.
Furthermore,inordertoquantifythepotentialneteconomicbenefitsofDRprogramsthefollowingKPIcanbeutilized:
• 𝐾𝑃𝐼r,z:NetEconomicbenefit foraplayer.Thismetricconstitutes thedifferenceofprofitsbeforeandaftertheDRprogram.
For an overall measure of the economic impact of a DR program on the entire society (including bothplayersandusers),canbegivenby:
• 𝐾𝑃𝐼r,DJ:DifferenceinSocialWelfare.Thisisthesumoftheneteconomicbenefitsofallplayersinthevaluechain,plusthesumofnetbenefitsofallusers. Itcanbeeasilyseen,however,thatthis

D2.1:State-of-the-art,scenarios,requirementsandKPIs
Page75of84
amountstothedifferenceofthesumofuserutilitiesafterandbeforeDRplusthedifferenceofthetotalcostforenergyproductionanddistributions
Consequently,specialmethodsshouldbedevelopedtomeasuretheeconomicandfinancialbenefitsofthevarious energy value chain players arising from the load/demand reduction due to the adoption andapplication of different DR programs under different types of markets. There are many factors andexternalitiesamongplayerstoconsiderwhendeterminingtheeconomicbenefits,whichcanbeshort-term(e.g., peak reduction leading to less frequent usage of costly backup generators) and long-term (e.g.,stability of the distribution and transmission networks resulting in lower maintenance costs and betternetworkplanning).However,attheendoftheday,itallcomesdowntoestimatingandcomparingthetotalassociated costs for each value chain player including the users, as well as the resulting difference inrevenuesbeforeandafterthedeploymentoftheDRsystemsandprograms,inordertoobtainboththeneteconomicbenefitforeachplayerandthedifferenceinsocialwelfareforthesystemasawhole.
D2.1:State-of-the-art,scenarios,requirementsandKPIs
Page76of84
6 CONCLUSIONS
InthisdeliverablewepresentedthefirsttechnicalstagesoftheOPTi-project,creatingasolidbaseforthesubsequent work within the work packages of the project. The state of art written in this document,representsarevisionoftheonefromtheproposal,updatingandextending it,showingagoodpictureofthemainResearchAreascoveredinOPTifromatop-levelperspective.However,thistaskisnotcompleted,andeveryworkpackagewillcontinuouslytrackandupdatethestateofartintherespectiveareas.
Themain technical objectives of the project are quantified in the Key Performance Indicators (KPIs), inorder to focus the work develop during the project. These KPIs are not interpreted, defined and anassessmentprocedureislaidout.Inthisway,UseCasesaredefinedinordertocovertheKPIrequirements.
Furthermore, a preliminary System Architecture is composed and used to organize the requirement inrelationtodifferentcomponentsandtheirinteraction.Therequirementsofthedifferentcomponentsarecapturedandpresented.
D2.1:State-of-the-art,scenarios,requirementsandKPIs
Page77of84
7 REFERENCES
Aalami, H. A., Moghaddam, M. P., & Yousefi, G. R. (2010). Demand response modeling consideringinterruptible/curtailableloadsandcapacitymarketprograms.AppliedEnergy,87(1),243-250.
Aalami, H. A., Moghaddam,M. P., & Yousefi, G. R. (2010). Modeling and prioritizing demand responseprogramsinpowermarkets.ElectricPowerSystemsResearch,80(4),426-435.
Abelko Innovation. (2015). Abelko Innovation: Snabbare, smartare och bättre. Retrieved fromwww.abelko.seAbrahamse,W.,&et al. (2005).AReviewof Intervention StudiesAimedatHouseholdEnergyConservation.JournalofEnvironmentalPsychology,Vol.25,No.3,pages273-291.
Agrell,P.J.,&Bogetoft,P.(2005).Economicandenvironmentalefficiencyofdistrictheatingplants.EnergyPolicy,33(10),1351-1362.
Albadi,M.H.,&El-Saadany, E. F. (2008).A summaryof demand response in electricitymarkets. Electricpowersystemsresearch,78(11),1989-1996.
Allcott,H.,&Mullainathan,S.(2010).BehavioralScienceandEnergyPolicy.Science,Vol.327, Issue5970,Pages1204-1205.
Anastopoulou, A., Koutsopoulos, I., & Stamoulis, G. D. (2014, November). Efficient incentive-drivenconsumption curtailment mechanisms in Nega-Watt markets. In Smart Grid Communications(SmartGridComm),2014IEEEInternationalConferenceon(pp.734-739).IEEE.
Andersson, S., 1993. Influenceof thenet structureandoperating strategyon theheat loadof adistrict-heating network. Applied Energy, 46(2), pp.171–179. Available at:http://www.sciencedirect.com/science/article/pii/030626199390066X[AccessedAugust19,2015].
ArrowheadProject.(2013).Aheadofthefuture.Retrievedfromhttp://www.arrowhead.eu/
Barbose,G.,Goldman,C.,Bharvirkar,R.,Hopper,N.,Ting,M.,&Neenan,B.(2005).Realtimepricingasadefault oroptional service forC&I customers:A comparative analysisof eight case studies. LawrenceBerkeleyNationalLaboratory.
Bendtsen, J., Trangbaek, K., & Stoustrup, J. (2013). Plug-and-Play Control—Modifying Control SystemsOnline.ControlSystemsTechnology,IEEETransactionson,21(1),79-93.
Birk, W., Castaño, M., & Johansson, A. (2014). An application software for visualization and controlconfigurationselectionofinterconnectedprocesses.ControlEngineeringPractice,26,188-200.
Boisvert, R.N., Cappers, P. A.,&Neenan, B. (2002). Thebenefits of customerparticipation inwholesaleelectricitymarkets.TheElectricityJournal,15(3),41-51.
Braun,J.E.,Montgomery,K.W.,andChaturvedi,N.(2001).EvaluatingthePerformanceofBuildingThermalMassControlStrategiesInternationalJournalofHeating,Ventilating,Air-ConditioningandRefrigerationResearch,7-4,pp.403–428
Braun, J. E., & Chaturvedi, N. (2002). An inverse gray-box model for transient building load prediction.HVAC&RResearch,1(8),pp.73-99.
Braun,J.E.(2003).Loadcontrolusingbuildingthermalmass.Journalofsolarenergyengineering125(3),pp.292-301.
Caron,S.,&Kesidis,G.(2010,October).Incentive-basedenergyconsumptionschedulingalgorithmsforthesmartgrid.InSmartgridcommunications(SmartGridComm),2010FirstIEEEinternationalconferenceon(pp.391-396).IEEE.

D2.1:State-of-the-art,scenarios,requirementsandKPIs
Page78of84
Chandan, V.,Ganu, T., Wijaya, T.,Minou, M., Stamoulis, G., Thanos, G. and Seetharam, D. (2014) “DR:consumer and grid friendly demand response system” in Proceedings of the 5th internationalconferenceonFutureenergysystems,(pp.183-194),ACM.
Chao, H. P., & Wilson, R. (1987). Priority service: Pricing, investment, and market organization.TheAmericanEconomicReview,899-916.
Chen, L., Li, N., Low, S. H., & Doyle, J. C. (2010). Two market models for demand response in powernetworks.IEEESmartGridComm,10,397-402.
Chow,T.T. et al. (2004). Energymodellingofdistrict cooling system fornewurbandevelopment. EnergyandBuildings,36(11),pp.1153–1162.
ClearlyEnergy. Available at: https://www.clearlyenergy.com/residential-demand-response-programsFrederiksen,S.,&Werner,S.(2013).DistrictHeatingandCooling.Studentlitteratur.
Coalition, S. E. D. (SEDC) (2014).MappingDemand Response in Europe Today.Tracking CompliancewithArticle,15.
Danfoss, (2006). Optimum design of distribution and service pipes. Available at:http://heating.danfoss.com/PCMPDF/Technical_Article_OptimumDesign_lores.pdf [Accessed 29 May2014].
Daniels, K. M., & Lobel, R. (2014). Demand Response in Electricity Markets: Voluntary and AutomatedCurtailmentContracts.AvailableatSSRN2505203.
DeConinck,R.,Magnusson,F.,Åkesson,J.,&Helsen,L.(2015).Toolboxfordevelopmentandvalidationofgrey-boxbuildingmodelsforforecastingandcontrol.JournalofBuildingPerformanceSimulation,1–16.http://doi.org/10.1080/19401493.2015.1046933
Deng,S.,Zhang,Y.,Chen,L.,&Qi,W.(2010,March).PredictiveControlofHeatSupplyProcessBasedonBPPredictiveModelandGoldSectionAlgorithm. InPowerandEnergyEngineeringConference (APPEEC),2010Asia-Pacific(pp.1-3).IEEE.
DHC+, (2009). District heating and cooling: A vision towards 2020-2030-2050. Available at:http://www.dhcplus.eu/wp-content/uploads/2012/02/vision-dhc.pdf[Accessed29May2014].
Dotzauer,E. (2002).Simplemodel forpredictionof loads indistrict-heatingsystems. .AppliedEnergy,3-4(73),pp.277–284.
Dütschke, E.,& Paetz, A. G. (2013). Dynamic electricity pricing—Which programs do consumers prefer?.EnergyPolicy,59,226-234.
EnerNOC.(2014).CaliforniaBusinessesBenefitfromAutomatedDemandResponse(FAQ).Retrievedfromhttp://www.enernoc.com/our-resources/brochures-faq/automated-demand-response-faq[Accessed05December2014].
European Union (2014). The 2020 climate and energy package. Available at:http://ec.europa.eu/clima/policies/package/[Accessed29May2014].
Fahrioĝlu, M., & Alvarado, F. L. (2000). Designing incentive compatible contracts for effective demandmanagement.PowerSystems,IEEETransactionson,15(4),1255-1260.
Feldman,B.Lockhart,B(2014)“AutomatedDemandResponse,”NavigantResearchK.P.Ltd.Kiwipower:ourservice.Website.AccessedOn2015-09-23.
Ferber,S.(2012).Industry4.0–Germanytakesfirststepstowardthenextindustrialrevolution.

D2.1:State-of-the-art,scenarios,requirementsandKPIs
Page79of84
FERC.(2010).NationalActionPlanonDemandResponse.TheFederalEnergyRegulatoryCommissionStaff.Docket No. AD09-10. Retrieved from http://www.ferc.gov/legal/staff-reports/06-17-10-demandresponse.pdf[Accessed05December2014].
Freire,R.Z.,Oliveira,G.H.,Mendes,N.(2008).Predictivecontrollersforthermalcomfortoptimisationandenergysavings.Energyandbuildings401353–1365
Fischer, C. (2008). Feedback on Household Electricity Consumption: a Tool for Saving Energy? EnergyEfficiency,1(1),79–104.
Gabrielaitiene, I., Bøhm, B. & Sunden, B., 2007. Modelling temperature dynamics of a district heatingsystem in Naestved, Denmark—A case study. Energy Conversion andManagement, 48(1), pp.78–86.Available at: http://www.sciencedirect.com/science/article/pii/S0196890406001725 [Accessed August19,2015].
Gkatzikis,L.,Koutsopoulos,I.,&Salonidis,T.(2013).Theroleofaggregatorsinsmartgriddemandresponsemarkets.SelectedAreasinCommunications,IEEEJournalon,31(7),1247-1257.
Global Energy Partners LLC. (2010). Auto-DR: Smart Intergration of supply and demand for rapid gridresponse. (A White Paper). Retrieved fromhttp://cfile212.uf.daum.net/attach/16439D4C4FBDFF061352EF[Accessed05December2014].
Gneezy, U., Leonard, K. L., & List, J. A. (2008).Gender differences in competition: Evidence from amatrilinealandapatriarchalsociety(No.w13727).NationalBureauofEconomicResearch.
Goldman, C. A., Kintner-Meyer, M., & Heffner, G. (2002). Do" enabling technologies" affect customerperformanceinprice-responsiveloadprograms?.LawrenceBerkeleyNationalLaboratory.
Goldman, Charles. (2010). Coordination of Energy Efficiency and Demand Response. Lawrence BerkeleyNational Laboratory. LBNL Paper LBNL-3044E. Retrieved from:http://escholarship.org/uc/item/1z43c7bt[Accessed05December2014].
Grzenda,M.(2012).Consumer-orientedheatconsumptionprediction.Control&Cybernetics(41),pp.213–240.
Gustafsson,J.(2011).WirelessSensorNetworkArchitecturesasaFoundationforEfficientDistrictHeating.Sweden:LuleåUniversityofTechnology,.
Gustafsson,J.,Delsing,J.,&vanDeventer,J.(2010).Improveddistrictheatingsubstationefficiencywithanewcontrolstrategy.AppliedEnergy87(6),pp.1996–2004.
Halvgaard,R.,Poulsen,N.K.,Madsen,H.,&Jorgensen,J.B.(2012).Economicmodelpredictivecontrolforbuildingclimatecontrolinasmartgrid.InInnovativeSmartGridTechnologies(ISGT),2012IEEEPES(pp.1-6).IEEE.
Haring,T.,&Andersson,G.(2014,October).Contractdesignfordemandresponse.InInnovativeSmartGridTechnologiesConferenceEurope(ISGT-Europe),2014IEEEPES(pp.1-6).IEEE.
He,X.,Keyaerts,N.,Azevedo,I.,Meeus,L.,Hancher,L.,&Glachant,J.M.(2013).Howtoengageconsumersindemandresponse:Acontractperspective.UtilitiesPolicy,27,108-122.
He,X.,Hancher,L.,Azevedo,I.,Keyaerts,N.,Meeus,L.,&GLACHANT,J.M.(2013).Shift,notdrift:towardsactivedemandresponseandbeyond.
Henning,D.,Amiri,S.,&Holmgren,K.(2006).Modellingandoptimisationofelectricity,steamanddistrictheatingproductionforalocalSwedishutility.EuropeanJournalofOperationalResearch,175(2),1224-1247.
Henze,G.P.,Felsmann,C.,&Knabe,G.(2004).Evaluationofoptimalcontrolforactiveandpassivebuildingthermalstorage.InternationalJournalofThermalSciences,43(2),173-183.
D2.1:State-of-the-art,scenarios,requirementsandKPIs
Page80of84
Henze,G.P.,Kalz,D.E.,Felsmann,C.,Knabe,G.(2004).Impactofforecastingaccuracyonpredictiveoptimalcontrolofactiveandpassivebuildingthermalstorageinventory.HVAC&RRes.10(2),153–178.
Henze,G. P., Kalz, D. E., Liu, S.,& Felsmann, C. (2005). Experimental analysis ofmodel-based predictiveoptimalcontrolforactiveandpassivebuildingthermalstorageinventory.HVAC&RResearch,11(2),189-213.
Hogan,W.(2009).Providingincentivesforefficientdemandresponse.PreparedforElectricPowerSupplyAssociation,CommentsonPJMDemandResponseProposals,FERCDocketNEL09-68-000.
Holyhead, J. C., Ramchurn, S. D., & Rogers, A. (2015, July). Consumer Targeting in Residential DemandResponse Programmes. In Proceedings of the 2015 ACM Sixth International Conference on FutureEnergySystems(pp.7-16).ACM.
Homer,J.B.(2012).Partial-modeltestingasavalidationtoolforsystemdynamics(1983).SystemDynamicsReview,28(3),281-294.Larsen,H.V.,Pálsson,H.,Bøhm,B.,&Ravn,H.F. (2002).Aggregateddynamicsimulationmodelofdistrictheatingnetworks.Energyconversionandmanagement,43(8),995-1019.
IRENA. (2013). IEA-ETSAP and IRENA Technology Brief E17 - Thermal energy storage. Retrieved fromhttp://www.irena.org/DocumentDownloads/Publications/IRENAETSAP%20Tech%20Brief%20E17%20Thermal%20Energy%20Storage.pdf[Accessed05December2014].
Jaffe,A.,&Stavins,R. (1994).TheEneryParadoxandthediffusionofconservationTechnology.ResourceandEnergyEconomics,16(2),pages91-122.
Jiang,X.S.etal.,2014.Modellingandoperationoptimisationofanintegratedenergybaseddirectdistrictwater-heating system. Energy, 64, pp.375–388. Available at:http://www.sciencedirect.com/science/article/pii/S0360544213009195[AccessedAugust12,2015].
Jie, P., Tian, Z., Yuan, S., & Zhu, N. (2012). Modeling the dynamic characteristics of a district heatingnetwork.Energy,39(1),126-134.
Johansson,C.,&Wernstedt,F. (2005).DynamicSimulationofDistrictHeatingSystems. InThirdEuropeanSimulationandModellingConference,Oporto,Portugal.
Johansson, C. (2013). Open Source Project - District heating simulation framework. Retrieved fromwww.dhemos.org[Accessed05December2014]
Kensby, J., Trüschel, A., & Dalenbäck, J. O. (2015). Potential of residential buildings as thermal energystorageindistrictheatingsystems–Resultsfromapilottest.AppliedEnergy,137,773-781.
Khodaei,A.,Shahidehpour,M.,&Bahramirad,S. (2011).SCUCwithhourlydemandresponseconsideringintertemporalloadcharacteristics.SmartGrid,IEEETransactionson,2(3),564-571.
Kicsiny, R., 2014. New delay differential equation models for heating systems with pipes. InternationalJournal of Heat and Mass Transfer, 79, pp.807–815. Available at:http://www.sciencedirect.com/science/article/pii/S001793101400756X[AccessedAugust12,2015].
Kiliccote,S.,&Piette,M.A.(2005).Advancedcontroltechnologiesandstrategieslinkingdemandresponseandenergyefficiency.LawrenceBerkeleyNationalLaboratory.
Klein, S.A. et al., 2004. TRNSYS 16--A TRaNsient system simulation program, user manual. Solar EnergyLaboratory.Madison:UniversityofWisconsin-Madison.
Lee,S.H.,&Wilkins,C.L. (1983).Apracticalapproachtoappliance loadcontrolanalysis:awaterheatercasestudy.IEEETrans.PowerAppar.Syst.;(UnitedStates),102(4).
Lee, K., Braun, J. E.,(2008).Model-based demand-limiting control of building thermalmass. Building andEnvironment43,1633–1646

D2.1:State-of-the-art,scenarios,requirementsandKPIs
Page81of84
Lingman, P. (2013). European Roadmap for Industrial Process Automation. Retrieved fromwww.processit.eu [Accessed05December2014]Kahneman,D.,&Tversky,A. (1979).Prospect theory:Ananalysisofdecisionunderrisk.Econometrica:JournaloftheEconometricSociety,263-291.
Ljung,L.(1998).Systemidentification(pp.163-173).BirkhäuserBoston.
Maharjan, S., Zhu, Q., Zhang, Y., Gjessing, S., & Basar, T. (2013). Dependable demand responsemanagement in the smart grid:A Stackelberggameapproach. SmartGrid, IEEETransactionson,4(1),120-132.
Mavin, A.; Wilkinson, P.; Harwood, A.; Novak, M., "Easy Approach to Requirements Syntax (EARS)," inRequirementsEngineeringConference,2009.RE'09.17thIEEEInternational,vol.,no.,pp.317-322,Aug.312009-Sept.42009,doi:10.1109/RE.2009.9
McKinsey&Company.(2007).ReducingU.SGreenhouseGasEmissions:HowMuchandatWhatCost?
Miguel Castaño and Wolfgang Birk. New methods for interaction analysis of complex processes usingweightedgraphs.JournalofProcessControl,22(1):280–295,2012
Moghaddam,M.P.,Abdollahi,A.,&Rashidinejad,M.(2011).Flexibledemandresponseprogramsmodelingincompetitiveelectricitymarkets.AppliedEnergy,88(9),3257-3269.
Mohsenian-Rad,A.H.,Wong,V.W.,Jatskevich,J.,&Schober,R.(2010,January).Optimalandautonomousincentive-based energy consumption scheduling algorithm for smart grid. In Innovative Smart GridTechnologies(ISGT),2010(pp.1-6).IEEE.
Mohsenian-Rad, A. H., Wong, V. W., Jatskevich, J., Schober, R., & Leon-Garcia, A. (2010). Autonomousdemand-side management based on game-theoretic energy consumption scheduling for the futuresmartgrid.SmartGrid,IEEETransactionson,1(3),320-331.
Molyneaux, A., Leyland, G., & Favrat, D. (2010). Environomic multi-objective optimisation of a districtheatingnetworkconsideringcentralizedanddecentralizedheatpumps.Energy,35(2),751-758.
Morgan, S., Krarti,M. (2007). Impact of electricity rate structures on energy cost savings of pre-coolingcontrolsforofficebuildings.BuildEnviron;42(8):2810–8
Morgan, S.,Krarti, M. (2013).Impact of electricity rate structures on energy cost savings of pre-coolingcontrolsforofficebuildings.BuildEnviron;42(8):2810–8.
NavigantResearch (2014). Automated Demand Response, OpenADR, Commercial & Industrial ADR,ResidentialADR,andDRManagementSystems:GLobalMarketAnalysisandForecasts.Retrievedfromhttp://www.navigantresearch.com/research/automated-demand-response [Accessed 05 December2014].
Negnevitsky,M.,Nguyen,T.D.,&deGroot,M.(2010,July).Novelbusinessmodelsfordemandresponseexchange.InPowerandEnergySocietyGeneralMeeting,2010IEEE(pp.1-7).IEEE.
Ng, K. H., & Sheble, G. B. (1998). Direct load control-A profit-based load management using linearprogramming.PowerSystems,IEEETransactionson,13(2),688-694.
Nguyen,D.T.,Negnevitsky,M.,&DeGroot,M.(2011).Pool-baseddemandresponseexchange—conceptandmodeling.PowerSystems,IEEETransactionson,26(3),1677-1685.
Nielsen,H.A.,&Madsen,H. (2006).Modelling theheat consumption indistrict heating systemsusing agrey-boxapproach.EnergyandBuildings,38(1),63-71.
NODA IntelligentSystemsAB. (2015).NODA IntelligentSystemsAB: IntelligentEnergyServices.Retrievedfromhttps://www.noda.se/en/main
D2.1:State-of-the-art,scenarios,requirementsandKPIs
Page82of84
OfficeofEnergyEfficiencyandReneweableEnergy. (2013).ENERGY INCENTIVEPROGRAMS,CALIFORNIA.Retrieved from http://energy.gov/eere/femp/energy-incentive-programs-california [Accessed 05December2014].
Oldewurtel,F.,Jones,C.,Morari,M.2008.AtractableapproximationofchanceconstrainedstochasticMPCbasedonaffinedisturbancefeedback.In:47thIEEEConferenceonDecisionandControl,CDC.pp.4731–4736
OpenADRAlliance,Availableat:http://drrc.lbl.gov/openadr
OPOWER.(2014).Retrievedfromhttp://opower.com/[Accessed05December2014].
Pacific Gas and Electric Company (2014). Automated Demand Response Program. Retrieved fromhttp://www.pge.com/mybusiness/energysavingsrebates/demandresponse/adrp/ [Accessed 05December2014].
PJM Demand side response working group (2004). Demand response as ancillary services Whitepaper.Technicalreport,12.
Popescu,D.,Ungureanu,F.,&Hernández-Guerrero,A.(2009).Simulationmodelsfortheanalysisofspaceheatconsumptionofbuildings.Energy,34(10),1447-1453.
PÖYRY (2009). The Potential and costs of district heating networks. Retrieved fromhttp://www.poyry.co.uk/sites/www.poyry.uk/files/A_report_providing_a_technical_analysis_and_costing_of_DH_networks.pdf[Accessed05December2014].
QDR,Q. (2006). Benefits of demand response in electricitymarkets and recommendations for achievingthem.
REHVA(2013).ThermalandacousticcomfortrequirementsinEuropeanstandardsandnationalregulations.
Retrieved from www.rehva.eu/publications-and-resources/hvac-journal/2013/022013/ [Accessed 05December2014].
Rezaie, B., & Rosen, M. A. (2012). District heating and cooling: Review of technology and potentialenhancements.AppliedEnergy,93,2-10.
Rogers,A.,Ramchurn,S.,& Jennings,N.R. (2012).Delivering the smartgrid:Challenges forautonomousagentsandmulti-agentsystemsresearch.
RWTH-EBC 2014. AixLib. A Modelica library for building performance simulations. Institute for EnergyEfficient Buildings and Indoor Climate (EBC) at RWTH Aachen University. Available athttps://github.com/RWTH-EBC/AixLib.
Samson, A. (Ed.) (2014). The Behavioral Economics Guide 2014. Retrieved fromhttp://www.behavioraleconomics.com.
Schmidt,P. (2011).On thedesignofa reactor forhigh temperatureheat storagebymeansof reversiblechemicalreactions.Mastersthesis.Stockholm:KTH,Sweden.
Schneider-Electric. (2012). Software for profitable operation of your district utility. Retrieved fromhttp://www.schneider-electric.com/products/ww/en/5100-software/5125-informationmanagement/61418-termis-software/[Accessed05December2014].
Schweppe,F.C.,Tabors,R.D.,KirtleyJr,J.L.,Outhred,H.R.,Pickel,F.H.,&Cox,A.J.(1980).Homeostaticutilitycontrol.PowerApparatusandSystems,IEEETransactionson,(3),1151-1163.
Shippee,G. (1980). Energy consumptionand conservationpsychology:A reviewand conceptual analysis.EnvironmentalManagement,4(4),297-314.
Singh,S.K.&others,2010.ProcessControl:ConceptsDynamicsandApplications,PHILearningPvt.Ltd.

D2.1:State-of-the-art,scenarios,requirementsandKPIs
Page83of84
Skogestad, S., 2000. Plantwide control: the search for the self-optimizing control structure. Journal ofProcess Control, 10(5), pp.487–507. Available at:http://www.sciencedirect.com/science/article/pii/S0959152400000238[AccessedJuly6,2015].
Steer, K. C. B., Wirth, A., & Halgamuge, S. K. (2011). Control period selection for improved operatingperformanceindistrictheatingnetworks.EnergyandBuildings,43(2),605-613.
Stern, P. C. (1992). What psychology knows about energy conservation. American Psychologist, 47(10),1224.Schoukens, J., & Pintelon, R. (2014). Identification of linear systems: a practical guideline toaccuratemodeling.Elsevier.SmartEnergyDemandCoalition,(April2014).MappingDemandResponseinEuropeToday:TrackingCompliancewithArticle15.8oftheEnergyEfficiencyDirective”.
Strbac, G., Farmer, E. D., & Cory, B. J. (1996). Framework for the incorporation of demand-side in acompetitiveelectricitymarket.IEEProceedings-Generation,TransmissionandDistribution,143(3),232-237.
Su,C.L.,&Kirschen,D. (2009).Quantifying theeffectofdemandresponseonelectricitymarkets.PowerSystems,IEEETransactionson,24(3),1199-1207.
Tabors,R.D., Schweppe, F.C.,&Caramanis,M.C. (1989).Utilityexperiencewith real time rates.PowerSystems,IEEETransactionson,4(2),463-471.
Tello,P.,&Weerdmeester,R. (2013).SPIREroadmap.Sustainableprocess industry throughresourceandenergy efficiency, Brussels. Available online athttp://www.spire2030.eu/uploads/Modules/Publications/spire-roadmap_december_2013_pbp.pdf.
The Scottish Government (2011). A study into the recovery of heat from power generation in Scotland.Retrievedfromhttp://www.scotland.gov.uk/Publications/2011/11/04102846/2[Accessed05December2014].
Touretzky, C. R.,&Baldea,M. (2014). Integrating scheduling and control for economicMPCof buildingswithenergystorage.JournalofProcessControl,24(8),1292-1300.
Tyagi, V. V., & Buddhi, D. (2007). PCM thermal storage in buildings: a state of art. Renewable andSustainableEnergyReviews,11(6),1146-1166.
Tyler,H.Stefano,S.,Alberto,P.,Dustin,M.,andKyle,S.(2013),CBEThermalComfortTool.CenterfortheBuiltEnvironment,UniversityofCaliforniaBerkeley,http://cbe.berkeley.edu/comforttool/[Accessed29October2015]
Vitec. (2012). Simulation tool for analysis of district heating and cooling networks. Retrieved fromhttp://www.vitecsoftware.com/Energi/Produkter/Berakningssystem/Netsim/ [Accessed 05 December2014].
Vitec. (2015). Vitec Energy develops software for the energy industry. Retrieved fromhttp://www.vitecsoftware.com/Xu, B., Fu, L., & Di, H. (2008). Dynamic simulation of space heatingsystemswithradiatorscontrolledbyTRVsinbuildings.Energyandbuildings,40(9),1755-1764.
Wetter, M., Treeck, C. van, & Hensen, J. (2013). New generation computational tools for building andcommunity energy systems. IEA EBC Annex. Retrieved from http://www.iea-annex60.org/downloads/Annex60Proposal.pdf
YinR,Peng,X.,Piette,M.A.,Kiliccote,S.(2010).StudyonAuto-DRandpre-coolingofcommercialbuildingswiththermalmassinCalifornia.EnergyandBuildings;42(7):967–75
Yoeli,E.(2009).Doessocialapprovalstimulateprosocialbehavior?Evidencefromafieldexperimentintheresidentialelectricitymarket.UniversityofChicago,BoothSchoolofBusiness.

D2.1:State-of-the-art,scenarios,requirementsandKPIs
Page84of84
Zalba,B.,Marín, J.M.,Cabeza,L.F.,&Mehling,H. (2003).Reviewonthermalenergystoragewithphasechange: materials, heat transfer analysis and applications. Applied thermal engineering, 23(3), 251-283.Vucetic,S.,Tomsovic,K.,&Obradovic,Z.(2001).Discoveringprice-loadrelationshipsinCalifornia'selectricitymarket.PowerSystems,IEEETransactionson,16(2),280-286.
Zhong,H.,Xie,L.,&Xia,Q.(2012,July).Couponincentive-baseddemandresponse(CIDR)insmartgrid.InPowerandEnergySocietyGeneralMeeting,2012IEEE(pp.1-6).IEEE.