cw111012-03 lissajous figures - university of exeter · lissajous figures introduction lissajous...
TRANSCRIPT
PHY2028 (Practical Electronics II) Information Lissajous Figures
1
Lissajous Figures
Introduction
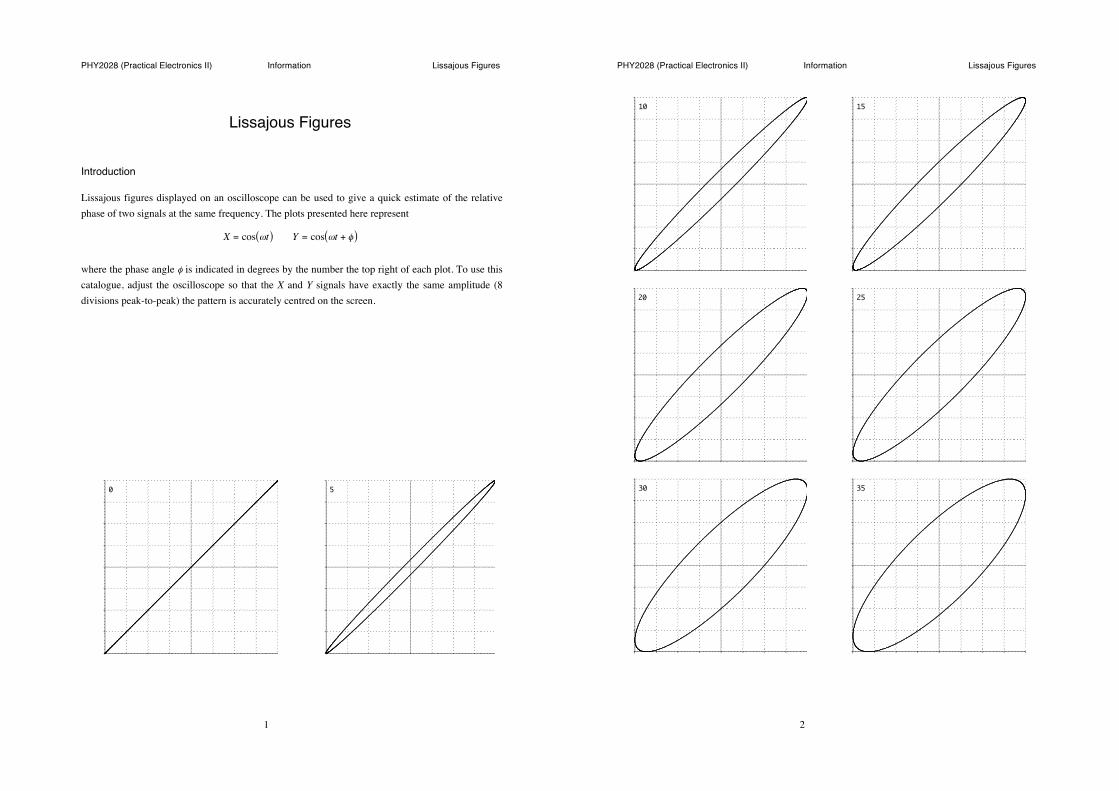
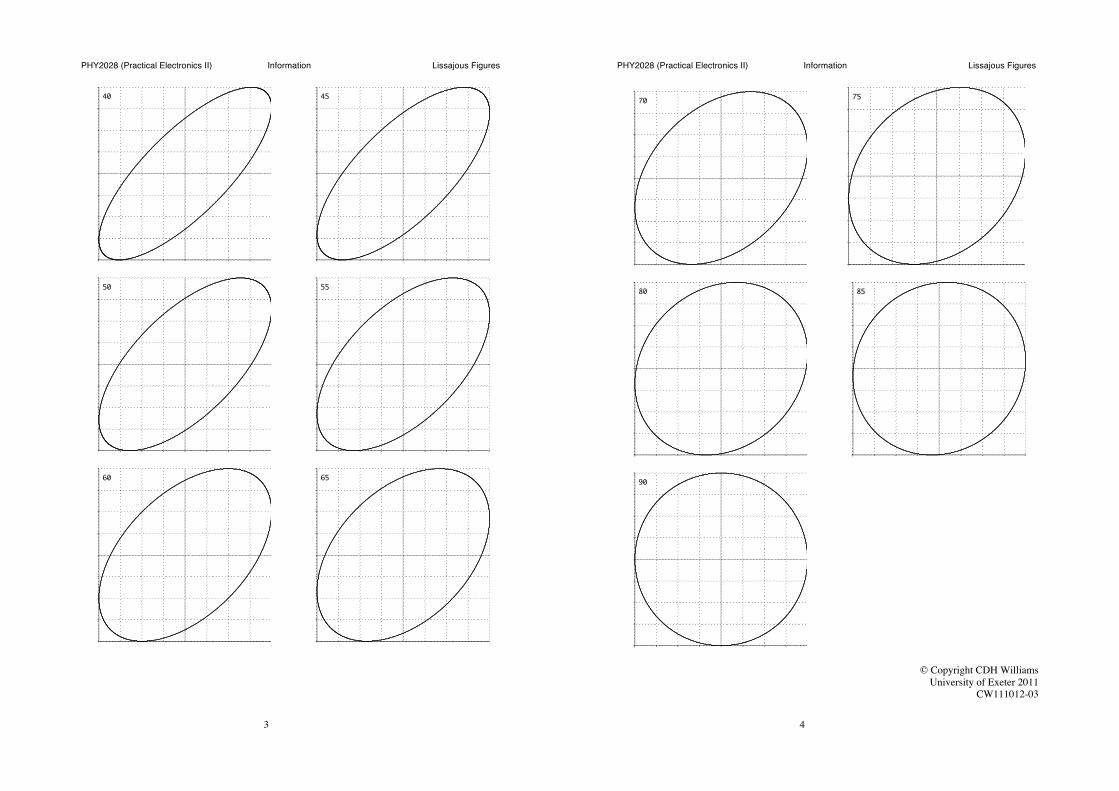
Lissajous figures displayed on an oscilloscope can be used to give a quick estimate of the relative phase of two signals at the same frequency. The plots presented here represent
X = cos ωt( ) Y = cos ωt + φ( )
where the phase angle φ is indicated in degrees by the number the top right of each plot. To use this catalogue, adjust the oscilloscope so that the X and Y signals have exactly the same amplitude (8 divisions peak-to-peak) the pattern is accurately centred on the screen.
0
5
PHY2028 (Practical Electronics II) Information Lissajous Figures
2
10
15
20
25
30
35
PHY2028 (Practical Electronics II) Information Lissajous Figures
3
40
45
50
55
60
65
PHY2028 (Practical Electronics II) Information Lissajous Figures
4
70
75
80
85
90
© Copyright CDH Williams University of Exeter 2011
CW111012-03