customer segmentation using unobserved heterogeneity in ...epubs.surrey.ac.uk/772713/1/jbr.pdf ·...
TRANSCRIPT

1
Customer segmentation using unobserved heterogeneity in the perceived-
value - loyalty-intentions link
Accepted for Publication in the Journal of Business Research
Arne Floh (first author, corresponding author) Senior Lecturer in Marketing Surrey Business School Guildford GU2 7XH United Kingdom T: +441483689185 E: [email protected] Dr. Alexander Zauner WU Vienna (Vienna University of Economics and Business), Department of Marketing Augasse 2-6, 1090 Vienna, Austria Tel: +43 (1) 31336-4098 E-mail: [email protected] Monika Koller Assistant Professor WU Vienna (Vienna University of Economics and Business) Department of Marketing Augasse 2-6, 1090 Vienna, Austria Tel.: +43 (1) 31336-5330 E-mail: [email protected]
Thomas Rusch PhD Candidate and Faculty Member WU Vienna (Vienna University of Economics and Business) Institute for Statistics and Mathematics Augasse 2-6, 1090 Vienna, Austria Tel: +43 (1) 31336-4338 E-mail: [email protected]

2
Abstract:
Multiple facets of perceived value perceptions drive loyalty intentions. However, this
value-loyalty link is not uniform for all customers. In fact, the present study identifies three
different segments that are internally consistent and stable across different service industries,
using two data sets: the wireless telecommunication industry (sample size 1,122) and the
financial services industry (sample size 982). Comparing the results of a single-class solution
with finite mixture results confirms the existence of unobserved customer segments. The three
segments found are characterized as “rationalists”, “functionalists” and “value maximizers”.
These results point the way for value-based segmentation in loyalty initiatives and reflect the
importance of a multidimensional conceptualization of perceived value, comprising cognitive
and affective components. The present results substantiate the fact that assuming a
homogeneous value-loyalty link provides a misleading view of the market. The paper derives
implications for marketing research and practice in terms of segmentation, positioning, loyalty
programs and strategic alliances.
Keywords: customer segmentation, perceived value, unobserved heterogeneity, finite mixture
modeling
3
Customer segmentation using unobserved heterogeneity in the perceived-
value - loyalty-intentions link
1 Introduction
The vast majority of research on perceived value assumes that value perceptions affect
all buyers in a comparable manner (e.g., Babin, & Babin, 2001; Sheth, Newman, & Gross,
1991) and, therefore, buyers respond similarly in terms of outcome variables such as customer
loyalty, word of mouth and willingness to pay. This assumption seems to be unrealistic in
many instances of behavioral research. Indeed, some researchers argue that, for any given
market offering, heterogeneous interpretations of perceived value and multiple customer
segments which apply different weights to the value drivers, exist (DeSarbo, Jedidi, & Sinha,
2001). In a similar fashion, Bolton (1998) claims that a considerable amount of heterogeneity
must exist because some customers perceive a higher value for a service offering than others.
Yet, only a few studies have explicitly accounted for buyer (i.e., consumer)
heterogeneity in relation to perceived value (Ruiz, Castro, & Armario, 2007) and its
predictive power regarding loyalty intentions. Additionally, extant research uses data from
single industries only and does not investigate whether there are common patterns of the
value-loyalty link across industries. This is surprising for at least two reasons: First, an
aggregate analysis of perceived value and its relation to other purchase-related constructs may
inappropriately combine members from heterogeneous sub-populations, resulting in
parameter estimates that are misleading (DeSarbo et al., 2001). Second, heterogeneity among
consumer preferences, attitudes, and perceived value is the main motivation behind customer
segmentation (Olsen, Prebensen, & Larsen, 2009). Customer segmentation has become a
central concept in marketing and many companies use it to better satisfy customer needs.
4
Against this background, this study examines unobserved customer heterogeneity
regarding the perceived-value - loyalty-intentions link, for the purpose of customer
segmentation. A multi-industry comparison enriches the extant knowledge by exploring how
the nature of perceived value affects the intention to stay loyal to a service provider. Based on
consumption value theory (Sheth et al., 1991; Sweeney & Soutar, 2001), the study uses a
multidimensional perceived value conceptualization to identify different consumer segments.
These segments differ regarding both their perceived value assessments and associated effects
on loyalty intentions towards the service provider.
The present study focuses on continuously provided services, such as those in the
telecommunications or financial services industries, in which the duration of the provider-
customer relationship is closely tied to profitability. Continuously provided services are
characterized by the distinctive feature that the customer typically enters into a formal
relationship with the service provider and subsequently consumes the service for a stipulated
period of time (Bolton, 1998). Analyzing potential heterogeneity in the customer perceived-
value - loyalty-intentions link is particularly important for such services’ segmentation efforts.
In order to determine the number of customer segments, the study uses regression
mixture modeling. Mixture models assume homogeneous attitudes and intentions within each
customer segment, and heterogeneous perceptions across segments (Wedel, & Kamakura,
2000). Additionally, individual level estimates account for individual heterogeneity1.
This study will be of use to marketing scholars and managers. Knowledge regarding
different consumer groups can help firms tailor their market offerings and communications
towards each segment more efficiently. Furthermore, determining which value dimensions
drive customer loyalty can help firms to develop customer loyalty programs. Since the results
are stable across industries, the results can be used in building strategic alliances with
companies in other industries, focusing on the same type of customer. Marketing scholars can
1 The authors thank an anonymous reviewer for this valuable advice.

5
use the results to further enhance the concept of perceived value. This study also contributes
to the issue of unobserved customer heterogeneity, which is still an under-researched area.
2 Conceptual background and model development
This section summarizes prior literature on consumer segmentation based on perceived value
and on the empirical methods adopted for this research. Then, it briefly conceptualizes
perceived value and its relationship with loyalty intentions and introduces the conceptual
model.
2.1 Prior literature on perceived value as a basis for segmentation
Smith (1956) is the first author to have recognized the existence of heterogeneity in the
demand for goods and services. Smith bases his assumption of market heterogeneity on the
economic theory of imperfect competition. He claims that market segmentation consists of
viewing a heterogeneous market as a number of smaller homogeneous markets, with differing
product preferences among important market segments. In other words, heterogeneity of
customer needs and preferences is the driving force behind market segmentation.
Since its introduction, market segmentation has become a central concept in both
marketing theory and practice (Wedel & Kamakura, 2000). Researchers have based the
segmentation of markets on various factors, including cultural, geographic, and
socioeconomic variables as well as personality, life-style, user status and usage frequency.
Customer segments based on these variables may be easy to understand and determine, but
may not provide the best possible explanatory power (Wedel & Kamakura, 2000).
As a consequence, marketing scholars highlight the need to account for heterogeneous
customer perceptions and expectations in order to develop better firm strategies (e.g.,
DeSarbo et al., 2001; Slater & Narver, 1998). Similarly, DeSarbo et al. (2001) propose
applying perceived value segmentation, emphasizing the failure to incorporate heterogeneity
in the underlying dimensions of value. Finally, authors such as Zeithaml (1988), Holbrook

6
(1994) and Sinha and DeSarbo (1998) agree that the sources of heterogeneity in perceptions
of perceived value include differences among consumers, product classes, and consumption
situations. Given the need for perceived value segmentation, it is surprising that few studies
have specifically addressed this issue empirically.
Swait and Sweeney (2000) discuss an approach to modeling consumer choice behavior
based on customers’ value orientations and their perceptions of various product and store
characteristics. Reflecting a consumer’s general value orientation concerning electrical
appliances (n = 1,040), they identify three segments: (a) quality-conscious, (b) value-
conscious, and (c) price-conscious. The framework they propose requires the joint estimation
of a latent segment membership function and a discrete choice model.
In another study, DeSarbo et al. (2001) propose a finite mixture methodology to
estimate the a priori unknown number of market segments and perceived value drivers at the
market level. In doing so, they find significant differences in perceptions of value for money
among business-to-business customers of an electric utility company (n = 1,509).
Ruiz et al. (2007) explain market heterogeneity in terms of value perceptions in the
wireless telecommunications industry (n = 877). Specifically, they explore how special
treatment of the customer by the service provider, the level of customer involvement with the
service, and the customer’s accumulated experience with the company act as predictors of
market heterogeneity. Based on regression mixture modeling, the authors find five latent
segments depending on perceived value dimensions.
Wiedmann, Hennigs, and Siebels (2009) explore a multidimensional framework of
luxury value to identify different types of luxury consumers according to the dimensions that
influence their perceptions of value. With the application of a hierarchical clustering
procedure, four value-based consumer segments emerge (n = 750): (a) the materialists, (b) the
rational functionalists, (c) the extravagant prestige-seekers, and (d) the introvert hedonists.

7
In general, extant research that accounts for market heterogeneity conceptualizes
perceived value as either unidimensional (DeSarbo et al., 2001; Swait & Sweeney, 2000;
Zeithaml, 1988) or as multidimensional construct (Ruiz et al., 2007; Wiedmann et al., 2009),
but without solid theoretical or substantive rationales for such conceptualizations. In contrast,
this study conceptualizes perceived value based on consumption value theory (Sheth et al.,
1991; Sweeney & Soutar, 2001). Hence, the study explicitly considers cognitive and affective
dimensions with potential relevance for consumers’ loyalty intentions.
Even more importantly, studies on customer segmentation have neglected the influence
of perceived value on behavioral intentions such as loyalty. In other words, prior research has
identified customer segments based on perceived value, but failed to consider potential
consequences and outcomes of these evaluations. However, particularly the effects of value
perceptions on loyalty intentions are of substantial worth for marketing practice in the light of
the current competitive landscape of exchangeable service offerings.
2.2 Model development: the perceived-value – loyalty-intentions link
Researchers regard perceived value as one of the most powerful forces in today’s
marketplace (Patterson & Spreng, 1997) and an underlying source of competitive advantage
(Woodruff, 1997), defining it as the customer’s overall evaluation of a market offering, based
on their perceptions of what they receive and what they give (Zeithaml, 1988).
Recently, researchers have conceptualized perceived value as a multidimensional
construct (Babin & Babin, 2001; Holbrook, 1994; Petrick, 2002; Sweeney & Soutar, 2001).
Considering functional as well as hedonic and social aspects, the multidimensional approach
overcomes the excessive concentration on economic value of the traditional value
conceptualization and echoes the growing relevance of emotions in consumer behavior
research (Sánchez-Fernández, Iniesta-Bonillo, & Holbrook, 2009). Moreover, the approach
accounts for the notion that consumption experiences usually involve more than one type of
8
value simultaneously. Based on seminal work by Sheth et al. (1991) and Sweeney and Soutar
(2001), this study adopts an extended four-dimensional conceptualization of perceived value,
which comprises both cognitive and affective factors (see also Oliver, 2010). The construct
reflects consumers’ functional, economic, emotional, and social value perceptions.
One can view loyalty intentions as a customer’s psychological disposition toward a
marketing offering. Loyalty intentions reflect favorable attitudes toward the brand or firm. To
explain the evolution of loyalty, the researcher must consider not only cognitive but also
affective aspects (Oliver, 2010; Vogel, Evanschitzky, & Ramaseshan, 2008). As value
incorporates cognitive and affective facets (Petrick, 2002; Sweeney & Soutar, 2001), the
authors of this paper suggest that perceived value is the key determinant of customer loyalty
intentions (Parasuraman & Grewal, 2000). Hence, higher levels of perceived value lead to
higher levels of customer loyalty, which, in the long run, determines the success of an
organization (Cronin, Brady, & Hult, 2000; Snoj, Korda, & Mumel, 2004; Ulaga & Chacour,
2001).
Figure 1 shows the conceptual model for this study. It reflects the abovementioned
proposed link between the underlying dimensions of perceived value and loyalty intentions.
The latent variable classes and dotted arrows pointing to the regression paths depict the
assumption of customer heterogeneity. It is worth mentioning that this study uses age, gender
and service industry as segmentation descriptors but the authors do not claim a causal effect
from these variables on the potential differences in the regression paths of the latent classes.
Figure 1 here
3 Methodology
3.1 Data collection and sampling
The authors test the model shown in Figure 1 on two different service industries
(wireless telecommunication and financial services), collecting data with an online
9
questionnaire. For both industries, a randomly selected sub sample of the customer data base
is contacted by the companies and asked for participating in a research study. Subsequently,
the authors only contact customers who agreed on participating in the current study. For
Sample 1 (wireless telecommunication service), 1,122 customers of one of the largest
European mobile service providers complete the survey (66 % of the customers who initially
agreed). For Sample 2 (financial service), 982 customers of one of the largest European debit
card issuing companies participate in the study (62 % of the customers who initially agreed).
3.2 Measures
This study adopts a multidimensional conceptualization of value, based on Sheth et al.
(1991) and Sweeney and Soutar (2001). It measures the constructs with items that are taken
from previous literature (Johnson, Herrmann, & Huber, 2006; Petrick, 2002; Sweeney &
Soutar, 2001) and adapted to the present context. The authors conduct two focus groups to test
whether the wording of the items is appropriate and the multidimensionality of the value
construct. Additionally, they conduct a pre-test with 12 respondents, using a think-aloud-
technique. Each construct comprises at least three items, as suggested by Anderson and
Gerbing (1988). The survey uses a likert scale ranging from 1 (strongly disagree) to 7
(strongly agree) throughout.
3.3 Assessment of measurement properties
Firstly, the authors conduct an explorative factor analysis to test the underlying
theoretical factor structure. Principle component analyses reveal four eigenvalues greater than
one, suggesting a four-factor solution. Web Appendix A shows that the factor loadings on the
intended constructs are all well above 0.6, with no cross-loadings higher than 0.42. Item
loadings lower than 0.2 are not reported in the table. The exploratory factor analysis reveals a

10
simple factor structure for both industries. The data confirms the multidimensional
conceptualization of perceived value.
Secondly, the authors run separate confirmatory factor analyses for each sample, to
assess the measurement properties of the scales. For both, the measurement model yield
highly satisfactory global fit indices (for the wireless telecommunication service MS: χ2 =
953; df = 98; CFI = .919; TLI = .900; RMSEA = .088; SRMR = .087 and for the financial
service DCS: MS: χ2 = 402; df = 98; CFI = .948; TLI = .937; RMSEA = .056; SRMR = .057).
All factor loadings are highly significant (p< 0.001) and exceed the suggested threshold of
0.5, demonstrating a high level of convergent validity. Composite reliability (CR), average
variance extracted (AVE), and Cronbach alpha scores (CA) suggest a high level of internal
consistency. Additionally, there is sufficient discriminate validity since the square root of the
AVE is greater than the correlation of each pair of factors. Web Appendix B gives a detailed
list of items and measurement properties for each sample. Web Appendix C shows the
correlation matrices for each pairs of factors and the square root of the AVE’s on the
diagonal.
3.4 Model estimation
To estimate the proposed model, the authors selected regression mixture modeling, also
called latent class regression (Fruehwirth-Schnatter, 2006; McLachlan & Peel, 2000). These
models allow the researcher to account for heterogeneity that is unobservable directly, either
because data are unavailable or because the reason for the heterogeneity is, in itself, latent.
Research shows the technique to be superior to classic clustering methods (McDonald, 2010;
Wedel & Kamakura, 2000) and thus recommends it for customer segmentation since (1) the
researcher does not define the classes a priori, but derives them from the data of the
segmentation bases (a priori segmentation seems unrealistic because many firms do not know
how many segments can be built in advance), (2) the researcher can compare alternative

11
models using statistical and managerial criteria, and (3) the technique groups homogeneous
consumer preferences together, so that the researcher can better consider the economic
boundaries of customer segmentation compared to individual-level segmentation. Given the
advantages of the technique, it is not surprising that previous researchers have successfully
applied regression mixture models to comparable applications in marketing (Cortinas,
Chocarro, & Villanueva, 2010; DeSarbo et al., 2001; Vriens, Wedel, & Wilms, 1996).
Technically speaking, regression mixture models assume that a certain number K of
unobserved segments generate the data. Each subject i (i = 1,…,n) belongs to one of them. Let
(y,x) denote an observation, where y is the dependent variable and x a vector of independent
variables (typically with an intercept included). Within each segment k, the relationship
between y and x is governed by the segment-specific parameter vector βk. Additional
segment-specific nuisance parameters are collected in the vector σk′. The conditional density
of y given x and θk = (β
k′,σ
k)′ in each segment is given as f(y|x,θk) and in our case is the
density of the normal distribution with mean x′βk and scalar nuisance parameter σk2, that is
(1)
The finite mixture model for all K segments k is then (Leisch, 2004)
(2)
with side conditions
Here, pk are the (unknown) prior probabilities (or mixing probabilities) of the k =
1,…,K segments, θk is as before and ϕ is the vector of all parameters combined, that is ϕ =

12
(p1,…,pk,θ1′,…,θk′). To estimate the unknown parameters from n observations
{(yi,xi)}i=1,…,n, one can use the EM algorithm (Dempster, Laird, & Rubin, 1977) as
implemented in M-Plus (Muthén, 1998-2004). Additionally, one can define the posterior
probability of (y,x) belonging to any class l,1 ≤ l ≤ K as
(3)
The estimated posterior probabilities for subject i, (l|xi,yi,φ;i) allow a kind of soft
partitioning since each subject is assigned a posterior probability of belonging to a class k (k =
1,...,K). This can be used to classify the observation into segment k (hard partitioning) by, for
example, assigning it to the class with the highest posterior probability or randomly assigning
it according to (l|xi,yi,φ;i).
As subsequent analyses, in this study the authors calculate individual-level predictors
based on the finite mixture results. These predictors are parametric empirical Bayes estimates
(Deely & Lindley, 1981; see also Kamakura & Wedel, 2004 for an improvement) and, as
such, conceptually similar to best linear unbiased predictions (BLUPS) in random coefficient
models. The prediction of the value subject i assigns to y (individual-level predictions) is
(4)
4 Results
4.1 Determining the number of classes
The authors use Mplus6 for estimating the mixture regression models. Since the
authors do not have any prior information about the number of classes, they carry out a series
of mixture regression models with K=1,2,3,4 segments (we calculate model solutions with
more than 4 classes, but stop since the class size became very small), on each industry
separately, to explore the number of classes and class probabilities.

13
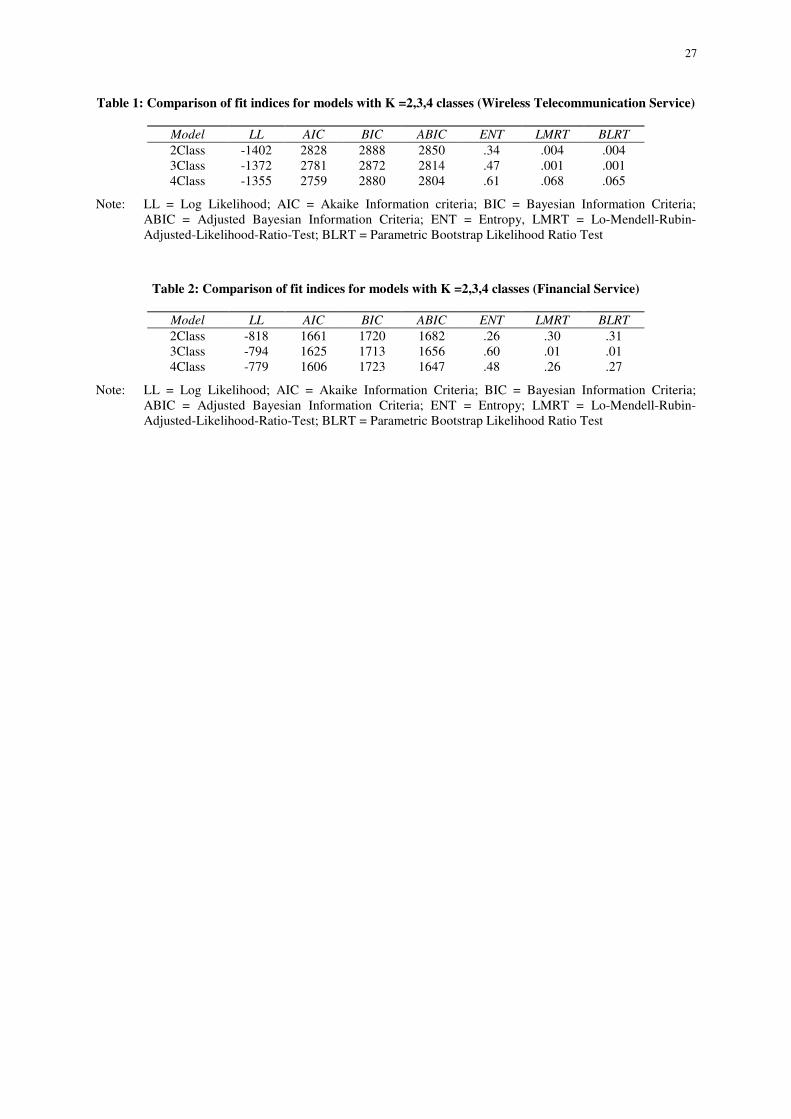
Consistent with current practice and scientific literature, the authors find that using a
mix of criteria is best for determining the number of classes and selecting the best model
(McLachlan & Peel, 2000). Tables 1 and 2 present the log likelihood values for each solution
and give an overview of the indices used to determine the number of groups. Following the
findings of a simulation study by Nylund, Asparouhov, and Muthén (2007), the authors
particularly emphasize the results of the parametric bootstrap likelihood ratio test (BLRT) for
determining the number of classes. BLRT uses bootstrap samples to estimate the distribution
of the log likelihood difference test statistic. The authors apply the BLRT to the data in this
study using a full set of bootstrap draws (McLachlan and Peel (2000) suggest a maximum of
100 draws) and increase the number of random starts to ascertain whether the results are
sensitive to the number of random starts for the k-class model (Nylund et al., 2007).
Finally, the authors use both managerial and theoretical perspectives to select the most
appropriate model.
Tables 1 & 2 here
The authors finally select the model with K=3 for the following reasons: First, the
BLRT clearly favor a three-class solution. Second, for the four-class solution, class sizes are
very small for some groups and the economic boundaries of customer segmentation are better
considered if the class sizes are substantial. Third, interpretations of the three-class solutions
are logically consistent. Moreover, results are in line with prior findings of comparable
applications (Swait & Sweeney, 2000). Fourth, the path coefficients and class means do not
differ significantly across some classes when K=4. Fifth and finally, convergence problems
and local optimal solutions occur when using four classes. The number of random starting
values and the number of iterations have to be larger to produce proper solutions.
Hence, the authors conclude that the model with K=3 is favorable for technical and
managerial reasons. The complete results of all calculated models are reported in Web

14
Appendix D, and only the results of the three-class solution are discussed and compared with
the single-class solution in the next section.
4.2 Mixture regression and single-class results
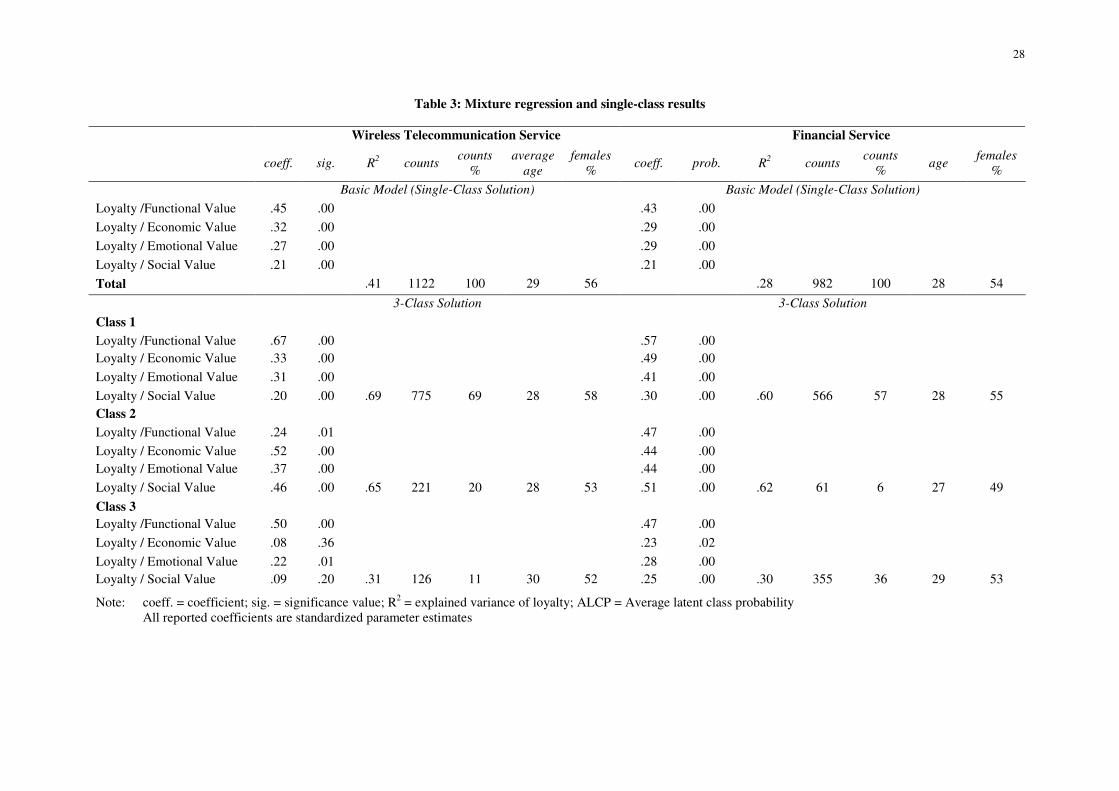
The findings shown in Table 3 indicate that the perceived value dimensions have a
substantial and significant effect on loyalty intentions. The top section shows the results for
the single-class solution, which assumes a homogeneous sample. The results also demonstrate
that perceived functional value is the most important loyalty driver (0.45 for the wireless
telecommunication service; 0.43 for the financial service). These results are in line with prior
research on perceived value and provide empirical evidence in support of this paper’s basic
model.
The finite mixture analysis suggests three classes of customers, whose value perceptions
along the various dimensions have varying impacts on their loyalty intentions towards the
service provider. For example, the standardized estimate of the economic value dimension is
rather low in class 3 (0.08), but slightly exceeds 0.5 in class 2 for the wireless
telecommunication service. Similar discrepancies occur for the financial service provider
(perceived economic value for class 2 is 0.44; for class 3, 0.23).
Next to these interclass differences within each service industry, the results are fairly
stable across the industries. In other words, ‘common’ heterogeneity exists in the perceived
value to loyalty intentions link across the two industries. Although this paper does not
formulate an explicit hypothesis, the data empirically supports its assumption of customer
heterogeneity.
Table 3 here
The comparison of the single-class solutions with the results of the mixture regression
analysis shows substantially differences. For example, the importance of perceived functional

15
value is significantly higher in class 1 than in the single-class solution for the wireless
telecommunication service (0.45 versus 0.67). Moreover, for the financial service, the two
affective (emotional and social) dimensions of perceived value in class 2 have much higher
weights than the single-class solution (0.51 versus 0.21). These differences also affect the
explained variance. The R2 of classes 2 and 3 are substantially higher than that of the single-
class solution. Again, these differences reflect that the assumption of a homogeneous sample
does not hold when measuring the link between perceived value and loyalty intentions.
The results of the member partitioning procedure are highly satisfactory and confirm the
three-class solution. The average latent class probabilities for most-likely latent class
membership exceed 73% in the wireless telecommunications service sample and 80% in the
financial service sample (see Table 4).
Table 4 here
4.3 Subsequent analysis and robustness test
To fully account for heterogeneity and, respectively, gauge the appropriateness of this
paper’s mixture model solution, the authors calculate individual-level predictors of the
regression coefficients2. Furthermore, they compare the observed values with the values the
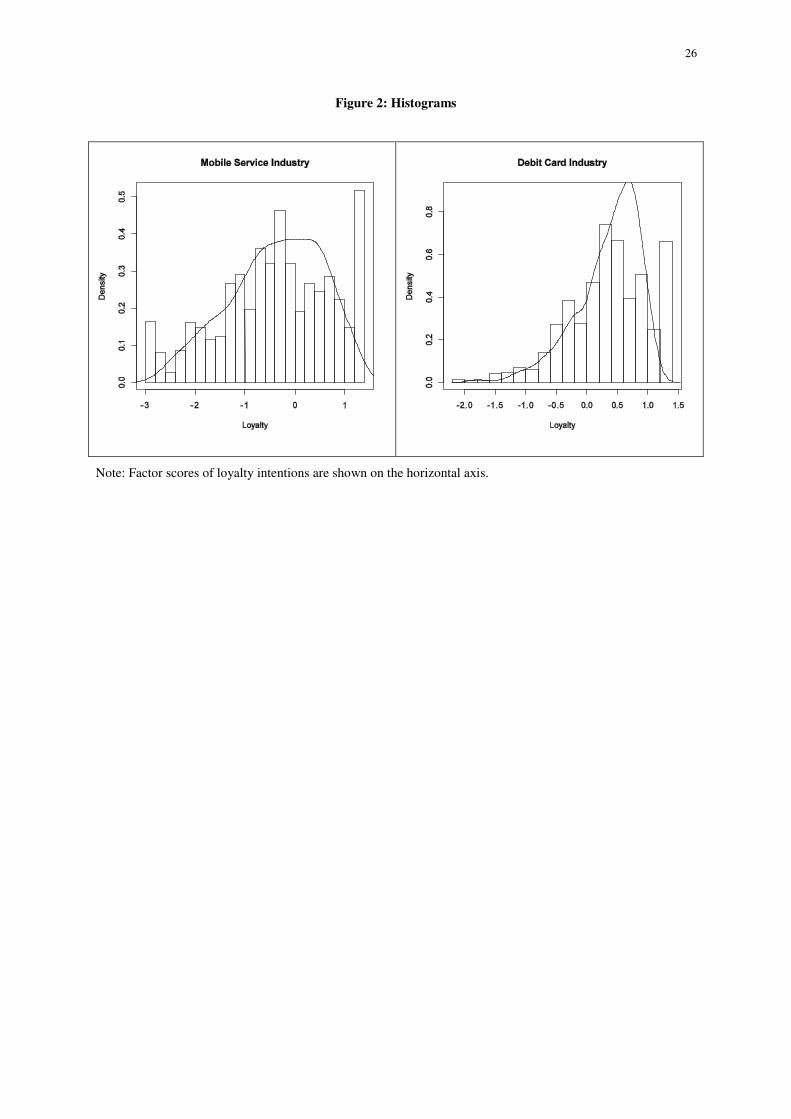
latent class regression predicts. Figure 2 presents the histograms of the observed loyalty
values for both industries. The smooth line is the density estimation (Gaussian kernel) of the
individual-level predictions from the fitted mixture models.
Figure 2 here
The distributions of both industries are skewed to the left, and therefore deviate from a
normal distribution. However, the density estimates show that the predicted values follow this
general form satisfactorily well. Hence, the three-class solution captures deviations from the
2 The FlexMix module of R was used for calculating the individual-level predictors.

16
normal distribution. A correlation between the observed and predicted values of
approximately 0.95 reflects this finding. In other words, the results of the finite mixture
solution largely capture the unobserved heterogeneity in the data and the remaining
heterogeneity within classes is negligible.
5 General discussion and implications
5.1 General discussion
A thorough and comprehensive identification and analysis of what customers actually
value is of utmost importance but falls short if it does not account for market heterogeneity.
When it comes to loyalty intentions, consumers attribute different weights to the four value
dimensions. The results of this paper strongly support the argument that perceived value
influences behavioral intentions, but also that the effects differ in magnitude depending on the
consumer segment. Hence, the basic model, assuming a homogeneous sample, provides a
misleading view of consumer evaluations, with regression coefficients reflecting merely the
‘midpoints’ of given perceptions.
Based on the findings of the finite mixture analyses, the authors identify the following
three classes:
Class 1 – The rationalists
Respondents of class 1 give substantially higher weight to the cognitive dimensions of
perceived value compared to the single-class solution and, therefore, are called the
rationalists. To gain loyalty intentions from this group, functional and economic value are
more important than emotional and social value dimensions. Although the cognitive aspects
are of predominant importance, in order to secure customer retention, the affective
dimensions need to be satisfied on a basic level, as well. Overall, the four perceived value
dimension explain more than 60% of the variance in loyalty intentions. The rationalists
represent the largest class in the analysis, accounting for 69% (wireless telecommunication

17
service) and 57% (financial service) of all customers. The proportion of female respondents is
slightly higher for both wireless telecommunication services (58%) and financial services
(55%). Additionally, rationalists are slightly younger than the average customer.
Class 2 – The value maximizers
For members of this group, all value dimensions are relevant in forming loyalty
intentions towards the service provider. Hence, members of this class are called the value
maximizers. Except for perceived economic value in relation to the wireless
telecommunication service industry, value maximizers assign higher weights to all value
dimensions compared to the single-class solution. With around 60% explained variance in
both industries, the creation of perceived value is equally as important as it is in class 1.
Considering this finding, members of this group only express loyalty if firms are able to
provide value in all four dimensions. Hence, people in this segment are more likely than those
in other groups to take social value aspects into account. They are concerned about other
people’s opinions and might want to attract attention and be accepted within their peer group.
Being the smallest identified segment, the value maximizers comprise 20% of wireless
telecommunications service customers and 6% of financial services customers. The
proportion of female respondents is lower for both service industries (wireless
telecommunications 53%; financial 49%). Additionally, value maximizers are slightly
younger than the average customer.
Class 3 – The functionalists
Members of this group concentrate on the functional value dimension when evaluating
the loyalty intentions towards continuously provided services and, therefore, are called the
functionalists. The remaining dimensions have lower regression coefficients than functional
value. Thus, firms need to offer user-friendly and reliable services. Economic, emotional, and
social value dimensions are of minor importance when serving this segment. Whereas in
classes 1 and 2, perceived value accounts for around 60% of variance, in class 3 only 30% of

18
variance in loyalty is explained by perceived value perceptions. The proportion of female
respondents is slightly lower for both service industries (wireless telecommunications 52%;
financial 53%. Additionally, functionalists are older than the average customer.
5.2 Managerial implications
The current study contributes to prior perceived value, customer segmentation, and
unobserved heterogeneity literature. The multidimensional conceptualization of customer
perceived value in explaining loyalty intentions proves successful in two different service
industries. Loyalty intentions in the wireless telecommunications and finance industries are
not only affected by cognitive value dimensions, such as functional and economic value, but
also by affective aspects, such as emotional and social value.
The results may guide future strategic decisions of marketing managers in the service
industry in the following ways:
First, the findings of this study show that ‘one service offering fits all’ is an appropriate
strategy in neither the wireless telecommunications nor the financial services industry. Given
the existence of common value-based segments across service industries, companies are
encouraged to develop segment-specific offerings in order to better target the needs of their
customers. The rationalists are by far the biggest group. Hence, from an economic business
perspective, it absolutely makes sense to cater for customers in this segment first. However,
big companies may not be interested in smaller segments, such as value maximizers or
functionalists. This theory implies that specialized companies may be able to run a successful
niche strategy to satisfy the needs of these smaller segments. Currently, service providers
predominantly engage in efforts relating to price (economic) and quality (functional value).
Although companies should provide high performance in these domains for the entire
customer base, they might also use value-added services to satisfy segment-specific needs for
affective value elements. In the case of both wireless telecommunications and financial

19
services, such add-ons might be tangent to the core service but might also entail product-
related elements, for example providing emotional and social signaling value via an attractive,
bundled cell phone or specially designed credit card.
Second and related to the previous implications, questions of positioning and service
differentiation arise when firms aim to satisfy heterogeneous customer needs. Therefore, some
companies have employed different positioning and multi-brand strategies in the past,
according to the preferences of their target group. For example, the success of Visa cards is
based on its world-wide acceptance (functional value) and its fees, which are affordable to
many customers (economic value). On the other hand, Diners Club clearly runs a premium
strategy, offering a wide range of value-added services (e.g. airport lounges) at higher costs.
Similar examples of different positioning and service differentiations can be found in the
wireless telecommunication and airline industries.
Third, companies in the wireless telecommunication and financial service industries
should incorporate this paper’s findings into their efforts to achieve customer loyalty. A
recent development in the loyalty and reward program literature suggests a differentiation of
hard rewards (more cognitively toned, e.g., additional functional or economic added value)
from soft rewards (more affectively-toned facets) for loyal customers (Wirtz, Mattila, &
Lwin, 2007). Given the differences in the impacts of value assessments on loyalty intentions
between segments, the present results recommend offering hard benefits (e.g., price
deductions) to rational functionalists, and soft rewards (e.g., VIP tickets for concerts) to value
maximizers, who place a high importance on affective value dimensions.
Fourth and finally, segmenting based on the multidimensional value to loyalty
intentions link smooths the way for establishing strategic alliances. For instance,
functionalists and rationalists may value prepaid wireless services offered at a discount
grocery store, whereas those customers seeking multiple value dimensions might prefer the
wireless service or financial service provider to engage in a strategic alliance with the leisure

20
industry, thus covering their affective consumption needs. In this case, both industries can
benefit from a positive halo effect as the consumers perceive the value dimensions they gain
to be sound and cohesive. This might strengthen the perceived brand image and ensure loyalty
intentions.
6 Limitations and outlook
Despite the strengths of this study, there are some limitations. First, the authors used
data from current users of wireless telecommunication services and financial services. This
limits the findings of the study as follows: (a) The authors cannot draw conclusions regarding
potential customers and related acquisition strategies. (b) Since service providers are diverse,
ranging from medical to financial services, the generalization of the findings to other services
may be risky. Inter-industry or even inter-market segmentation is an interesting topic for
future research (see Ko, Taylor, Sung, Lee, Wagner, Navarro, & Wang, 2011 for a global
application of this concept). The current data set, including only two industries, does not
allow for a study about perceived value typology across service industries. (c) The number of
industries also limits the pool of analysis techniques. Random coefficient models, which are
another promising means of accounting for customer heterogeneity, require nested data. If one
uses service industry as a reference variable, one requires a sufficient number of sub-
industries to fulfill the statistical requirements of such models.
Second, the data sets consist of survey data only and the study does not consider
moderators. Linkages between survey and transaction data may increase the predictive power
of customer segmentation. Unfortunately, transaction data are difficult to obtain due to
privacy issues and the inclusion of these kinds of data has the drawback that model estimation
becomes very complex. This study does not model or empirically test moderating variables,
such as trust, commitment, or involvement, which could provide further insights.

21
Third and finally, research on perceived value assumes linear relationships between the
respective variables. Yet, non-linear causal relationships or neuronal networks between
perceived value and related constructs are also conceivable (Wiedmann et al., 2009).
Despite these limitations, the authors are heavily convinced that the results are
trustworthy and valuable for marketing scholars and managers. Nevertheless, the authors
explicitly encourage other scholars to replicate the findings in different industries using the
various techniques available for dealing with unobserved customer heterogeneity.

22
References
Anderson, J. C., & Gerbing, D. W. (1988). Structural equation modeling in practice: A review and recommended two-step approach. Psychological Bulletin, 103(3), 411-423.
Babin, B. J., & Babin, L. (2001). Seeking something different? A model of schema typicality, consumer affect, purchase intentions and perceived shopping value. Journal of
Business Research, 54(2), 89-96.
Bolton, R. N. (1998). A dynamic model of the duration of the dustomer's relationship with a continuous service provider: The role of satisfaction. Marketing Science, 17(1), 45-65
Cortinas, M., Chocarro, R., & Villanueva, M. (2010). Understanding multi-channel banking customers. Journal of Business Research, 63(11), 1215-1221.
Cronin, J. J., Brady, M. K., & Hult, G. T. M. (2000). Assessing the effects of quality, value, and customer satisfaction on consumer behavioral intentions in service environments. Journal of Retailing, 76(2), 193.
Deely, J. J., & Lindley, D. V. (1981). Bayes empirical Bayes. Journal of the American
Statistical Association, 76(376), 833-841.
Dempster, A. P., Laird, N. M., & Rubin, D. B. (1977). Maximum likelihood from incomplete data via the EM algorithm. Journal of the Royal Statistical Society Series, 39(1), 1-38.
DeSarbo, W. S., Jedidi, K., & Sinha, I. (2001). Customer value analysis in a heterogeneous market. Strategic Management Journal, 22(9), 845-857.
Fruehwirth-Schnatter, S. (2006). Finite mixture models and Markov switching behavior. NY: Springer.
Holbrook, M. B. (1994). The nature of customer value, an axilogy of services in the
consumption experience. Thousand Oaks, CA: Sage.
Johnson, M. D., Herrmann, A., & Huber, F. (2006). The evolution of loyalty intentions. Journal of Marketing, 70(2), 122-132.
Kamakura, W. A., & Wedel, M. (2004). An empirical Bayes procedure for improving individual-level estimates and predictions from finite mixtures of multinominal logit models. Journal of Business & Economic Statistics, 22(1), 121-125.
Ko, E., Taylor, C. R., Sung, H., Lee, J., Wagner, U., Navarro, D. M.-C., & Wang, F. (2011). Global marketing segmentation usefulness in the sportswear industry. Journal of
Business Research, Article in Press.
Leisch, F. (2004). FlexMix: A general framework for finite mixture models and latent class regression in R. Journal of Statistical Software, 11(8), 1-18.
McDonald, M. (2010). Existentalism - a school of thought based on a conception of the absurdity of the universe. International Journal of Market Research, 52(4), 427-430.
McLachlan, G., & Peel, D. (2000). Finite mixture models. NY: John Wiley & Sons, Inc.
Muthén, B. O. (1998-2004). Mplus Technical Appendices. Los Angeles, CA: Muthén & Muthén
Nylund, K. L., Asparouhov, T., & Muthén, B. (2007). Deciding on the number of classes in latent class analysis and growth mixture modeling: A Monte Carlo simulation study. Structural Equation Modeling, 14(1), 535-569.

23
Oliver, R. L. (2010). Satisfaction - a behavioral perspective on the consumer. Armonk, NY: M.E. Sharpe.
Olsen, S. O., Prebensen, N., & Larsen, T. A. (2009). Including ambivalence as a basis for benefit segmentation: A study of convenience food in Norway. European Journal of
Marketing, 43(5/6), 763-783.
Parasuraman, A., & Grewal, D. (2000). The impact of technology on the quality-value-loyalty chain: A research agenda. Journal Academy of Marketing Science, 28(1), 168-174.
Patterson, P. G., & Spreng, R. A. (1997). Modelling the relationship between perceived value, satisfaction and repurchase intentions in a business-to-business, services context: An empirical examination. International Journal of Service Industry Management, 8(5), 414-434.
Petrick, J. F. (2002). Development of a multi-dimensional scale for measuring the perceived value of a service. Journal of Leisure Research, 34(2), 119-134.
Ruiz, D. M., Castro, C. B., & Armario, E. M. (2007). Explaining market heterogeneity in terms of value perceptions. Service Industries Journal, 27(8), 1087-1110.
Sánchez-Fernández, R., Iniesta-Bonillo, M. Ã., & Holbrook, M. B. (2009). The conceptualisation and measurement of consumer value in services. International
Journal of Market Research, 51(1), 93-113.
Sheth, J. N., Newman, B. I., & Gross, B. L. (1991). Why we buy what we buy: A theory of consumption values. Journal of Business Research, 22(2), 159-170.
Sinha, I., & DeSarbo, W. S. (1998). An integrated approach toward the spatial modeling of perceived customer value. Journal of Marketing Research, 35(2), 236-249.
Slater, S. F., & Narver, J. C. (1998). Customer-led and market-oriented: Let's not confuse the two. Strategic Management Journal, 19(10), 1001-1006.
Smith, W. (1956). Product differentation and market segmentation as alternative marketing strategies. Journal of Marketing, 21(1), 3-8.
Snoj, B., Korda, A. P., & Mumel, D. (2004). The relationships among perceived quality, perceived risk and perceived product value. Journal of Product & Brand Management,
13(3), 156-167.
Swait, J., & Sweeney, J. C. (2000). Perceived value and its impact on choice behavior in a retail setting. Journal of Retailing and Consumer Services, 7(2), 77-88.
Sweeney, J. C., & Soutar, G. N. (2001). Consumer perceived value: The development of a multiple item scale. Journal of Retailing, 77(2), 203-220.
Ulaga, W., & Chacour, S. (2001). Measuring customer-perceived value in business markets. Industrial Marketing Management, 30(6), 525-540.
Vogel, V., Evanschitzky, H., & Ramaseshan, B. (2008). Customer equity drivers and future sales. Journal of Marketing, 72(1), 98-108.
Vriens, M., Wedel, M., & Wilms, T. (1996). Metric conjoint segmentation methods: A Monte Carlo comparison. Journal of Marketing Research, 33(February), 73-85.
Wedel, M., & Kamakura, W. A. (2000). Market segmentation: Conceptual and
methodological foundations, Vol. 2. Dordrecht: Kluwer Academic Publisher.
Wiedmann, K.-P., Hennigs, N., & Siebels, A. (2009). Value-based segmentation of luxury consumption behavior. Psychology & Marketing, 26(7), 625-651.

24
Wirtz, J., Mattila, A. S., & Lwin, M. O. (2007). How effective are loyalty reward programs in driving share of wallet? Journal of Service Research, 9(4), 327-334.
Woodruff, R. B. (1997). Customer value: The next source for competitive advantage. Journal
of the Academy of Marketing Science, 25(2), 139-153.
Zeithaml, V. A. (1988). Consumer perceptions of price, quality, and value: A means-end model and synthesis of evidence. Journal of Marketing, 52(3), 2-22.

25
Loyalty Intentions
Class
Age
Sex
Industry
Functional Value
Economical Value
Emotional Value
SocialValue
Figure 1: Conceptual model
26
Figure 2: Histograms
Note: Factor scores of loyalty intentions are shown on the horizontal axis.
27
Table 1: Comparison of fit indices for models with K =2,3,4 classes (Wireless Telecommunication Service)
Model LL AIC BIC ABIC ENT LMRT BLRT
2Class -1402 2828 2888 2850 .34 .004 .004 3Class -1372 2781 2872 2814 .47 .001 .001 4Class -1355 2759 2880 2804 .61 .068 .065
Note: LL = Log Likelihood; AIC = Akaike Information criteria; BIC = Bayesian Information Criteria; ABIC = Adjusted Bayesian Information Criteria; ENT = Entropy, LMRT = Lo-Mendell-Rubin-Adjusted-Likelihood-Ratio-Test; BLRT = Parametric Bootstrap Likelihood Ratio Test
Table 2: Comparison of fit indices for models with K =2,3,4 classes (Financial Service)
Model LL AIC BIC ABIC ENT LMRT BLRT
2Class -818 1661 1720 1682 .26 .30 .31 3Class -794 1625 1713 1656 .60 .01 .01 4Class -779 1606 1723 1647 .48 .26 .27
Note: LL = Log Likelihood; AIC = Akaike Information Criteria; BIC = Bayesian Information Criteria; ABIC = Adjusted Bayesian Information Criteria; ENT = Entropy; LMRT = Lo-Mendell-Rubin-Adjusted-Likelihood-Ratio-Test; BLRT = Parametric Bootstrap Likelihood Ratio Test
28
Table 3: Mixture regression and single-class results
Note: coeff. = coefficient; sig. = significance value; R2 = explained variance of loyalty; ALCP = Average latent class probability All reported coefficients are standardized parameter estimates
Wireless Telecommunication Service Financial Service
coeff. sig. R
2 counts
counts
%
average
age
females
% coeff. prob. R
2 counts
counts
% age
females
%
Basic Model (Single-Class Solution) Basic Model (Single-Class Solution)
Loyalty /Functional Value .45 .00 .43 .00
Loyalty / Economic Value .32 .00 .29 .00
Loyalty / Emotional Value .27 .00 .29 .00
Loyalty / Social Value .21 .00 .21 .00
Total .41 1122 100 29 56 .28 982 100 28 54
3-Class Solution 3-Class Solution
Class 1
Loyalty /Functional Value .67 .00 .57 .00 Loyalty / Economic Value .33 .00 .49 .00
Loyalty / Emotional Value .31 .00 .41 .00
Loyalty / Social Value .20 .00 .69 775 69 28 58 .30 .00 .60 566 57 28 55
Class 2
Loyalty /Functional Value .24 .01 .47 .00
Loyalty / Economic Value .52 .00 .44 .00 Loyalty / Emotional Value .37 .00 .44 .00
Loyalty / Social Value .46 .00 .65 221 20 28 53 .51 .00 .62 61 6 27 49
Class 3 Loyalty /Functional Value .50 .00 .47 .00
Loyalty / Economic Value .08 .36 .23 .02
Loyalty / Emotional Value .22 .01 .28 .00 Loyalty / Social Value .09 .20 .31 126 11 30 52 .25 .00 .30 355 36 29 53

29
Table 4: Average latent class probabilities
Wireless Telecommunication Service Financial Service
Class 1 2 3 Class 1 2 3
1 .73 .13 .14 1 .80 .00 .20 2 .20 .80 .01 2 .00 .82 .18 3 .24 .01 .75 3 .16 .03 .81