customer-experience measurement & analytics
TRANSCRIPT

1
Measuring & Monetizing the
2About Us
Bottom-Line Analytics is a full-service consulting group
focused on marketing effectiveness and brand performance analytics
We are dedicated to the principles of innovation, excellence, and
uncompromising customer service
Everything we do is geared toward improving the commercial performance
of our clients
Our experts have a total of more than 100 years of direct experience in
research, insights, and ROI measurement
3
What is Customer Experience(CX) ?
• Social Media brand comments represent a large and valuable source for CX insights.
• CX are internal and personal responses of customers to a brand or service either
through direct usage or relationships with brand representatives and communications
• CX is customers positive or negative feedback regarding how well the brand’s promise
is fulfilled through this experience.
• CX often contains reviews of
– Product or brand performance
– The satisfaction with services and its delivery
– Other aspects of the brand promise, including value, reliability, brand loyalty and the degree of
personal attachment to a brand.
4Measuring the customer experience is imperative
“You’ve got to start with the customer experience
and work back toward the technology – not the other way around.”
~ Steve Jobs
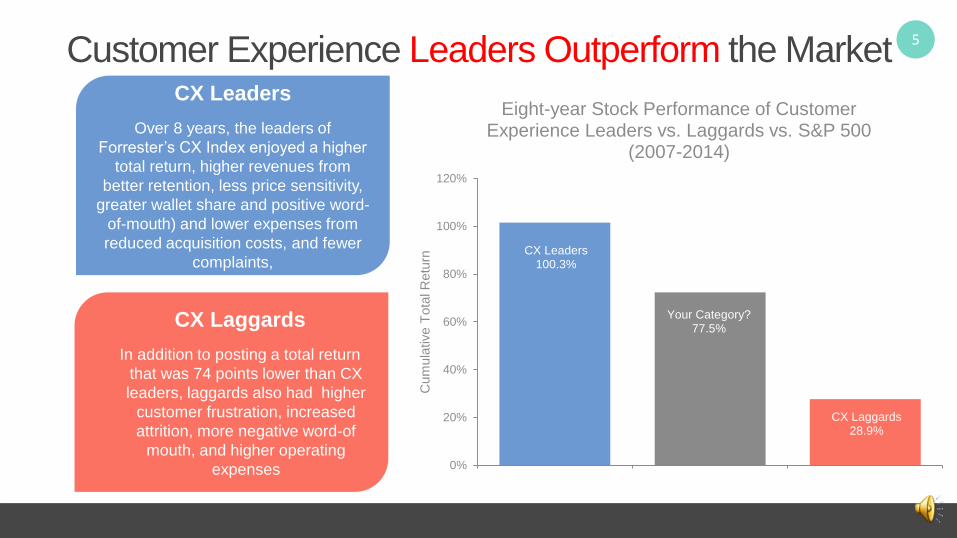
5Customer Experience Leaders Outperform the Market
CX Leaders100.3%
Your Category?77.5%
CX Laggards28.9%
0%
20%
40%
60%
80%
100%
120%
Cum
ula
tive T
ota
l R
etu
rn
Eight-year Stock Performance of Customer Experience Leaders vs. Laggards vs. S&P 500
(2007-2014)
CX Laggards
In addition to posting a total return
that was 74 points lower than CX
leaders, laggards also had higher
customer frustration, increased
attrition, more negative word-of
mouth, and higher operating
expenses
CX Leaders
Over 8 years, the leaders of
Forrester’s CX Index enjoyed a higher
total return, higher revenues from
better retention, less price sensitivity,
greater wallet share and positive word-
of-mouth) and lower expenses from
reduced acquisition costs, and fewer
complaints,
6
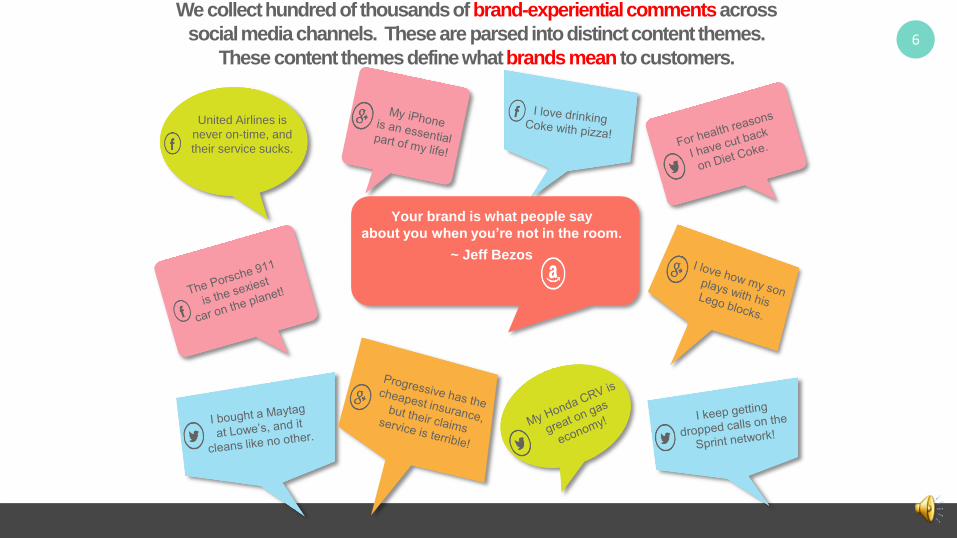
We collect hundred of thousands of brand-experiential commentsacross
social media channels. These are parsed into distinct content themes.
These content themes define what brands meanto customers.
United Airlines is
never on-time, and
their service sucks.
Your brand is what people say
about you when you’re not in the room.
~ Jeff Bezos
7We use a linguistics/language-based system to “score” social media textual brand
comments. We convert these texts to a metric called the SEItm
7
8C
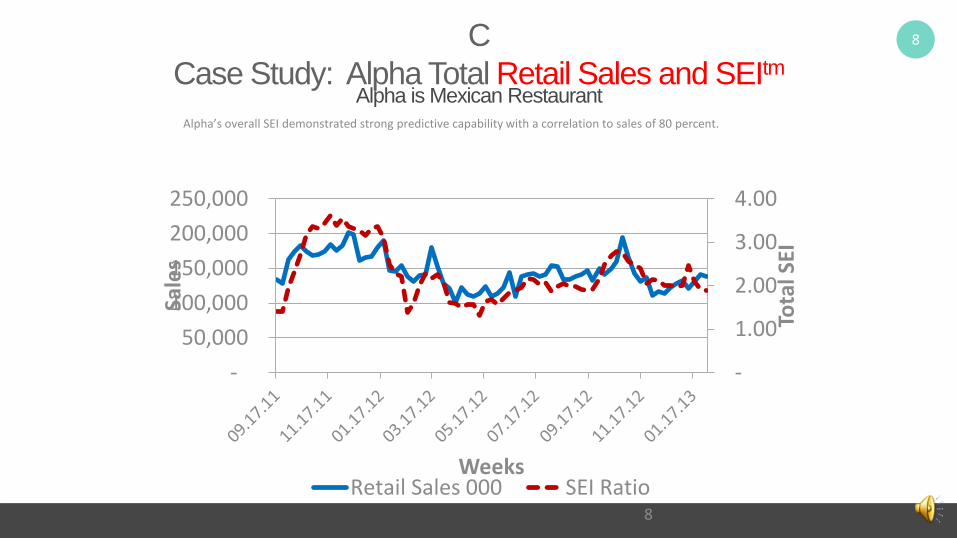
Case Study: Alpha Total Retail Sales and SEItmAlpha is Mexican Restaurant
-
1.00
2.00
3.00
4.00
-
50,000
100,000
150,000
200,000
250,000
Tota
l SEI
Sale
s
WeeksRetail Sales 000 SEI Ratio
Alpha’s overall SEI demonstrated strong predictive capability with a correlation to sales of 80 percent.
8
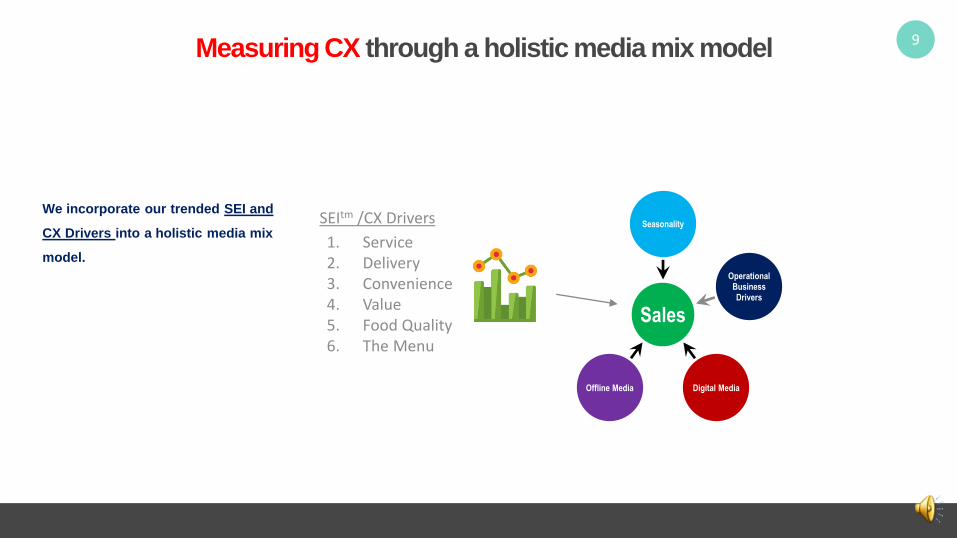
9Measuring CX through a holistic media mix model
Sales
Seasonality
Operational Business Drivers
Digital MediaOffline Media
We incorporate our trended SEI and
CX Drivers into a holistic media mix
model.1. Service2. Delivery3. Convenience4. Value5. Food Quality6. The Menu
SEItm /CX Drivers
10
Sales Contributions
52.6%
4.5%1.3%
2.2%
0.8% 5.6% 3.1% 2.2%1.1%
0.8%7.8%
1.0%1.7%
5.7%
1.3%
6.3%
1.9%
18.0%
Alpha Sales Contributions
Baseline Competitive.Media Digital.Display.Media Digital.Search.Media
Digital.Email Direct.Mail Media.Cable.TV Media.Network.TV
Media.Radio Media.Magazines Consumer.Promotion SEI.Service
SEI.Delivery SEI.Value SEI.Food Quality SEI.Convenience
SEI.The Menu
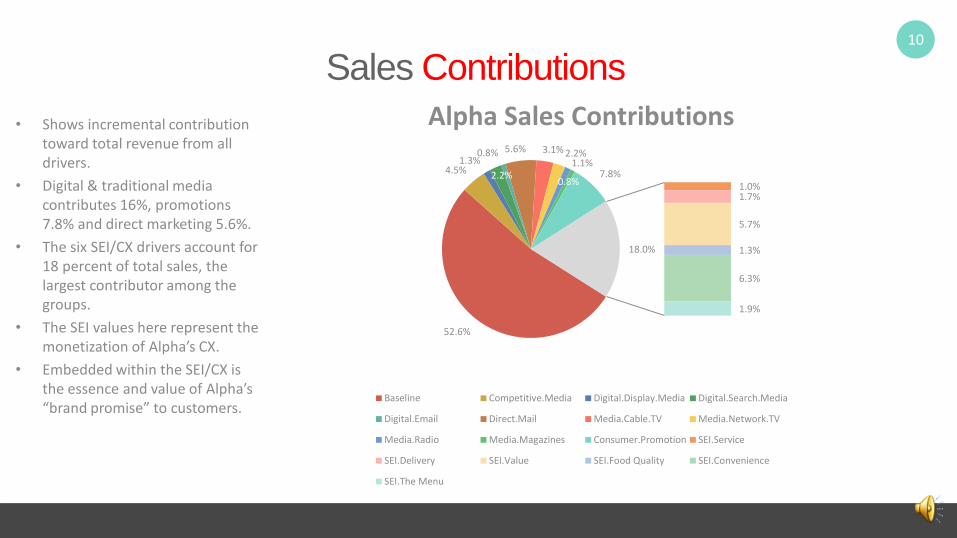
• Shows incremental contribution toward total revenue from all drivers.
• Digital & traditional media contributes 16%, promotions 7.8% and direct marketing 5.6%.
• The six SEI/CX drivers account for 18 percent of total sales, the largest contributor among the groups.
• The SEI values here represent the monetization of Alpha’s CX.
• Embedded within the SEI/CX is the essence and value of Alpha’s “brand promise” to customers.
11
Marketing Variance Business Drivers versus Last Year
-3.0%
-2.2%
-2.0%
-1.3%
-1.1%
-1.0%
-0.2%
-0.2%
-0.1%
0.0%
0.0%
0.1%
0.1%
0.1%
0.1%
0.3%
0.4%
0.4%
0.7%
3.7%
-4.0% -2.0% 0.0% 2.0% 4.0% 6.0%
SEI.The Menu
Retail Pricing
SEI.Food Quality
SEI.Service
SEI.Delivery
Baseline
Direct.Mail
Media.Network.TV
Media.Magazines
Digital.Email
Media.Radio
Digital.Search.Media
Media.Cable.TV
Consumer.Promotion
Digital.Display.Media
Economy**
Competitive.Media
SEI.Value
SEI.Convenience
Store.Penetration
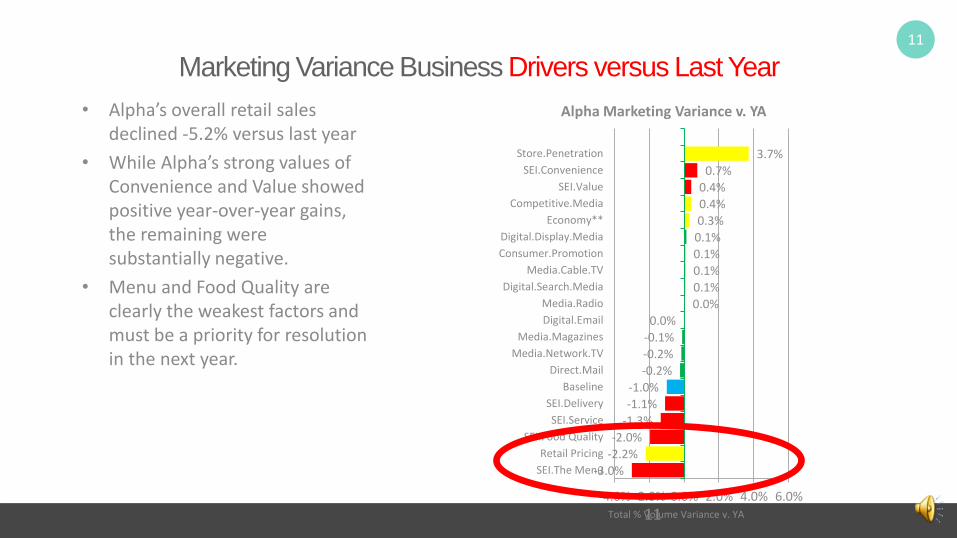
Alpha Marketing Variance v. YA• Alpha’s overall retail sales declined -5.2% versus last year
• While Alpha’s strong values of Convenience and Value showed positive year-over-year gains, the remaining were substantially negative.
• Menu and Food Quality are clearly the weakest factors and must be a priority for resolution in the next year.
11Total % Volume Variance v. YA
12
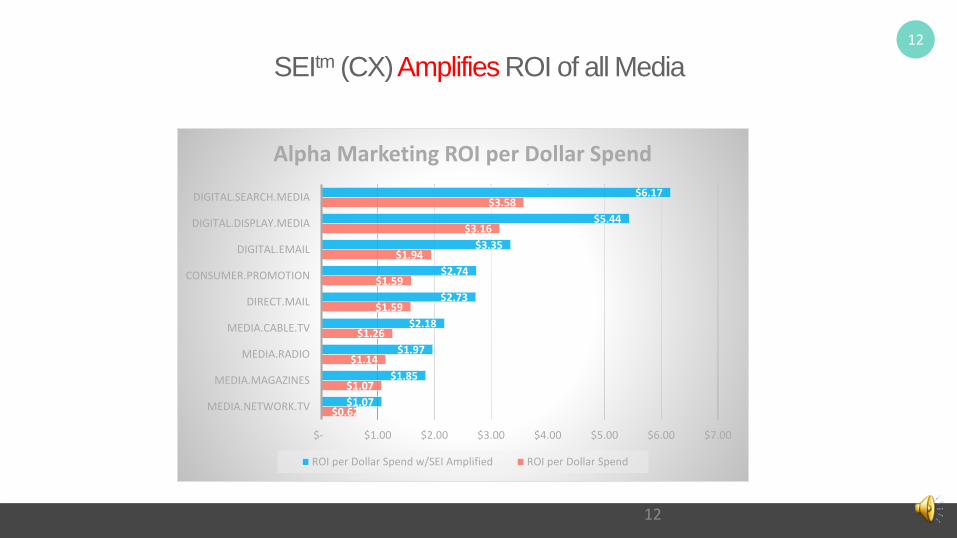
SEItm (CX) Amplifies ROI of all Media
12
$0.62
$1.07
$1.14
$1.26
$1.59
$1.59
$1.94
$3.16
$3.58
$1.07
$1.85
$1.97
$2.18
$2.73
$2.74
$3.35
$5.44
$6.17
$- $1.00 $2.00 $3.00 $4.00 $5.00 $6.00 $7.00
MEDIA.NETWORK.TV
MEDIA.MAGAZINES
MEDIA.RADIO
MEDIA.CABLE.TV
DIRECT.MAIL
CONSUMER.PROMOTION
DIGITAL.EMAIL
DIGITAL.DISPLAY.MEDIA
DIGITAL.SEARCH.MEDIA
Alpha Marketing ROI per Dollar Spend
ROI per Dollar Spend w/SEI Amplified ROI per Dollar Spend
13
CX content volume-drivers for Alpha over Time
13
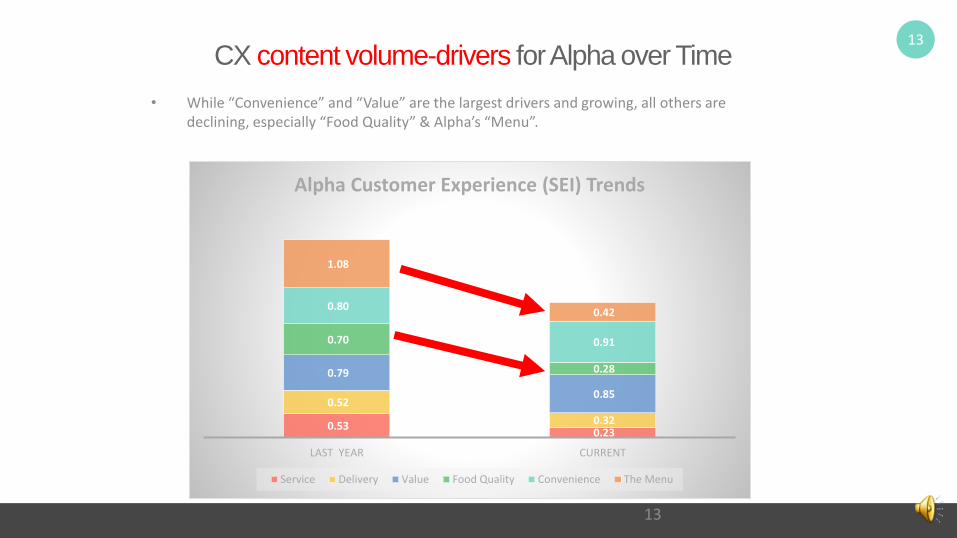
• While “Convenience” and “Value” are the largest drivers and growing, all others are declining, especially “Food Quality” & Alpha’s “Menu”.
0.53 0.23
0.52
0.32
0.79
0.85
0.70
0.28
0.80
0.91
1.08
0.42
LAST YEAR CURRENT
Alpha Customer Experience (SEI) Trends
Service Delivery Value Food Quality Convenience The Menu
14
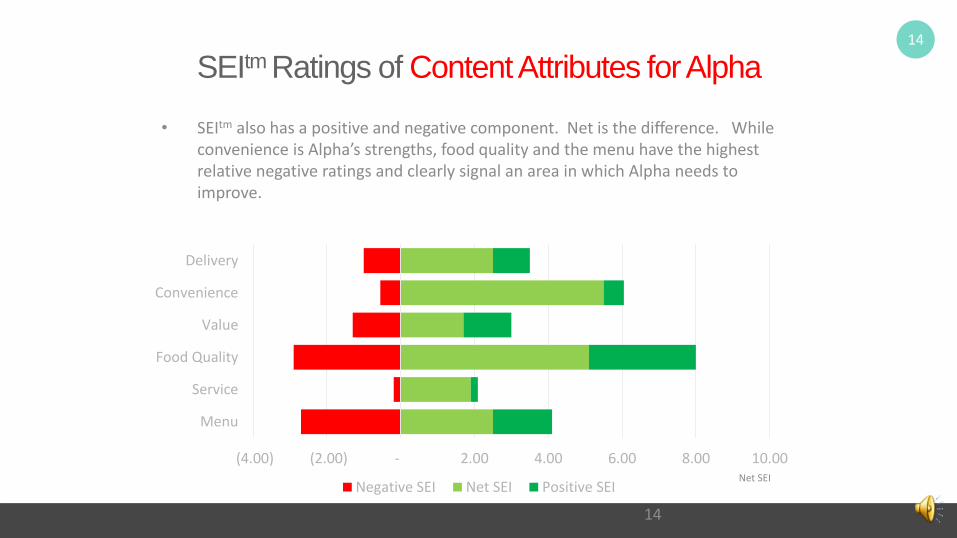
(4.00) (2.00) - 2.00 4.00 6.00 8.00 10.00
Menu
Service
Food Quality
Value
Convenience
Delivery
Negative SEI Net SEI Positive SEI
14
SEItm Ratings of Content Attributes for Alpha
• SEItm also has a positive and negative component. Net is the difference. While convenience is Alpha’s strengths, food quality and the menu have the highest relative negative ratings and clearly signal an area in which Alpha needs to improve.
Net SEI
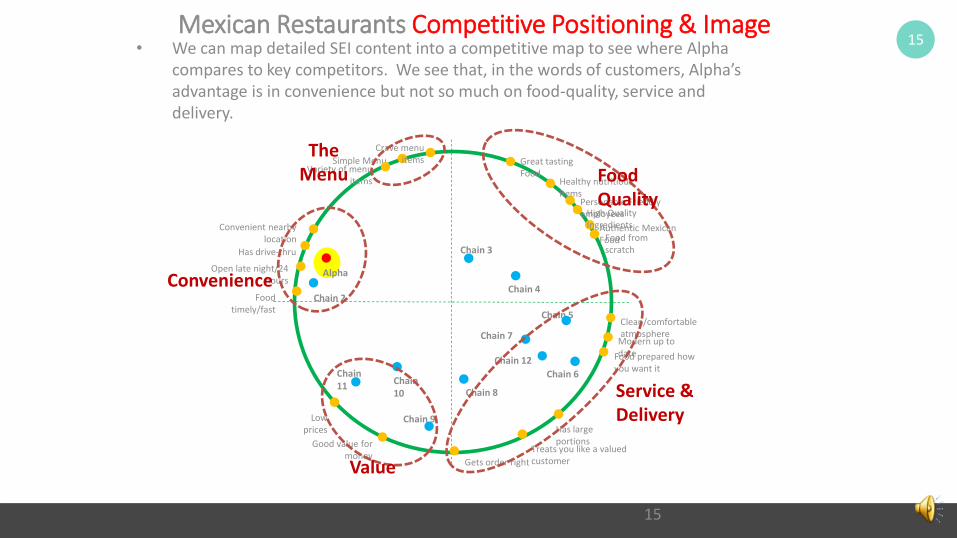
15Mexican Restaurants Competitive Positioning & Image
Great tasting Food
Personable Friendly employees
Treats you like a valued customer
Authentic Mexican Food
High Quality Ingredients
Food from scratch
Chain 4
Chain 3
Clean/comfortable atmosphere
Food prepared how you want it
Modern up to date
Has large portions
Healthy nutritious items
Gets order right
Chain 5
Chain 6
Chain 7
Chain 12
Chain 2
Simple Menu
Good value for money
Low prices
Open late night/24 hours
Chain 10
Chain 11
Alpha
Crave menu items
Food timely/fast
Convenient nearby location
Variety of menu items
Chain 9
Has drive-thru
Chain 8
Food Quality
Service & Delivery
The Menu
Convenience
Value
• We can map detailed SEI content into a competitive map to see where Alpha compares to key competitors. We see that, in the words of customers, Alpha’s advantage is in convenience but not so much on food-quality, service and delivery.
15

16
Strategic Implications
• For the case study restaurant brand, analysis underscored that traditional strategies of focusing only on
improving efficiencies in their drive-through and online ordering was not sufficient to drive growth.
• Our SEI analysis reveals that (1) service, (2) value, (3) delivery, (4) convenience, (5) food quality and (6)
menu form the underlying SEI drivers and comprise the “brand promise” that Alpha presents to its
customers, from which they give direct feedback on how they’re performing on these. By ignoring menu
diversity and improving food quality, they were driving customers to competition and generating a serious
decline in sales.
• The company launched a massive new ad campaign. This campaign has a “mea culpa” message. They
admitted directly to customers that they had ignored and lost their way on product quality and their menu
was substandard. They told customers directly that they were launching a massive effort to improve their
menu, product quality and the ingredients in their food.
• One year later, Alpha turned its business around from negative growth to positive sales gains.
16

17
17
Measuring the Customer-Brand Experience with SEItm reveals this to
be a significant driver across many businesses
Lesson: Brands can not ignore the
importance of measuring and tracking
the customer-experience
It is central to a firm’s aspiration to be
customer centric” & explains why
business is underperforming and what
needs to be done when things go wrong
for Alpha Corporation case
What if these companies had this tool?
• Chipotle
• Auto Air-Bag Recalls
• Toyota Acceleration problems
18BLA global leadership team
Michael Wolfe is CEO of Bottom-Line Analytics (US). Michael has 30 years of direct experience in marketing
science and analytics both on the client and consulting side. On the former, Michael has worked for Coca-Cola, Kraft
Foods, Kellogg’s and Fisher-Price. He has also consulted with such blue-chip firms as AT&T, McDonald’s, Coca-Cola,
Hyatt Corp., L’Oreal and Starbucks. Michael has broad experience in marketing analytics covering marketing ROI
modelling, social media analytics, pricing research and brand strategy.
Masood Akhtar is the Bottom-Line Analytics managing partner (EMEA). Masood is former Director of Analytics for
McCann Erickson and has also worked on brands such as; Mintel International Group, Kraft Foods, American Airlines,
Costa Coffee, Coca Cola and Hyatt Hotels Corp. He is an accomplished econometrician with extensive experience in
marketing ROI analytics, marketing research, market segmentation, social media analytics and marketing KPI
dashboards.

19
EMEA Office:
5th Floor, 39 Deansgate,
Manchester, M3 2BA, United Kingdom
Contact Us US Office:
Suite 100, 1780 Chadds Lake Dr, NE
Marietta, Georgia, 30068-1608
Atlanta, USA
Thank You!