current trends in substance abuse: minnesota and nationally
TRANSCRIPT
Current Trends in Substance Abuse:Minnesota and nationally
2011 drug court conferenceSt Paul, Minnesota
June 22, 2011
Carol FalkowskiDrug Abuse Strategy Officer
Minnesota Department of Human Services
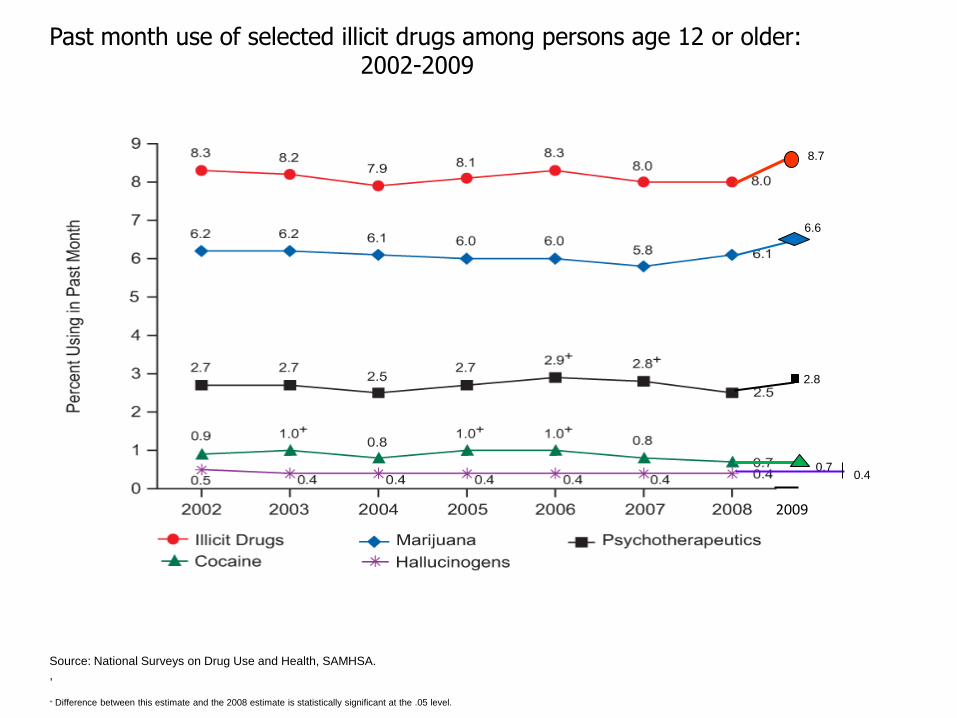
Past month use of selected illicit drugs among persons age 12 or older: 2002-2009
8.7
Source: National Surveys on Drug Use and Health, SAMHSA.
,
+ Difference between this estimate and the 2008 estimate is statistically significant at the .05 level.
8.7
6.6
2.8
2009
0.70.4
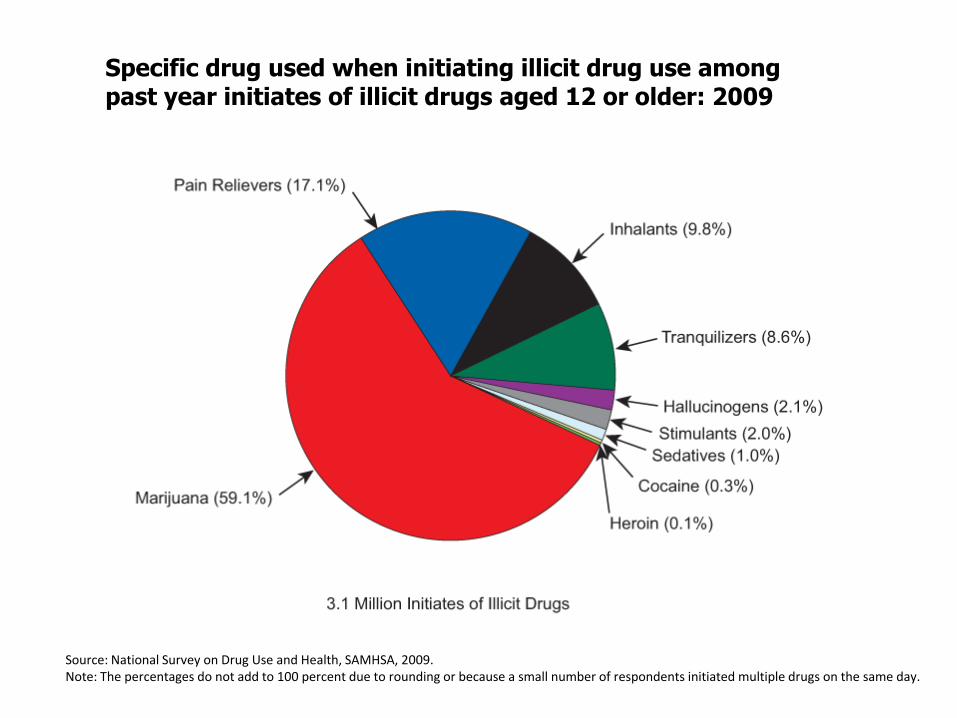
Specific drug used when initiating illicit drug use among past year initiates of illicit drugs aged 12 or older: 2009
Source: National Survey on Drug Use and Health, SAMHSA, 2009. Note: The percentages do not add to 100 percent due to rounding or because a small number of respondents initiated multiple drugs on the same day.
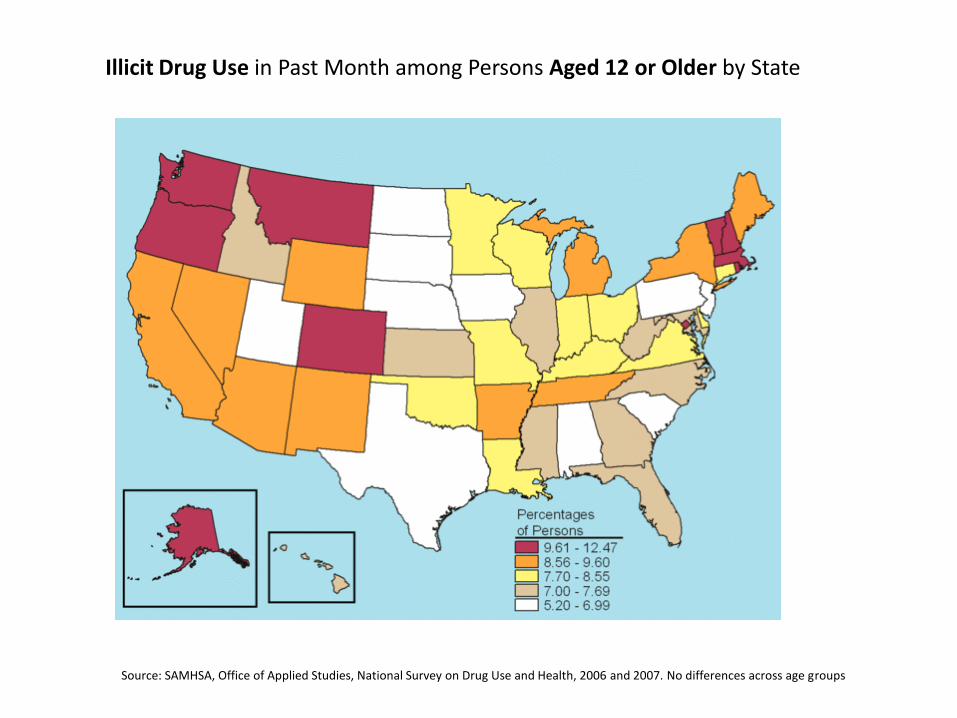
Illicit Drug Use in Past Month among Persons Aged 12 or Older by State
Source: SAMHSA, Office of Applied Studies, National Survey on Drug Use and Health, 2006 and 2007. No differences across age groups
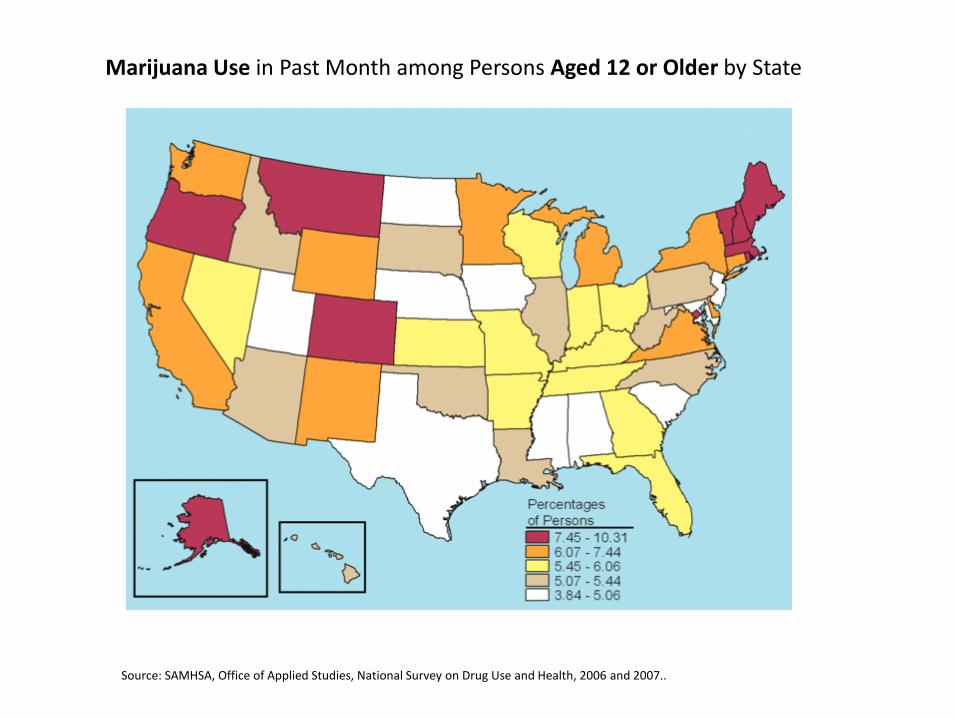
Marijuana Use in Past Month among Persons Aged 12 or Older by State
Source: SAMHSA, Office of Applied Studies, National Survey on Drug Use and Health, 2006 and 2007..
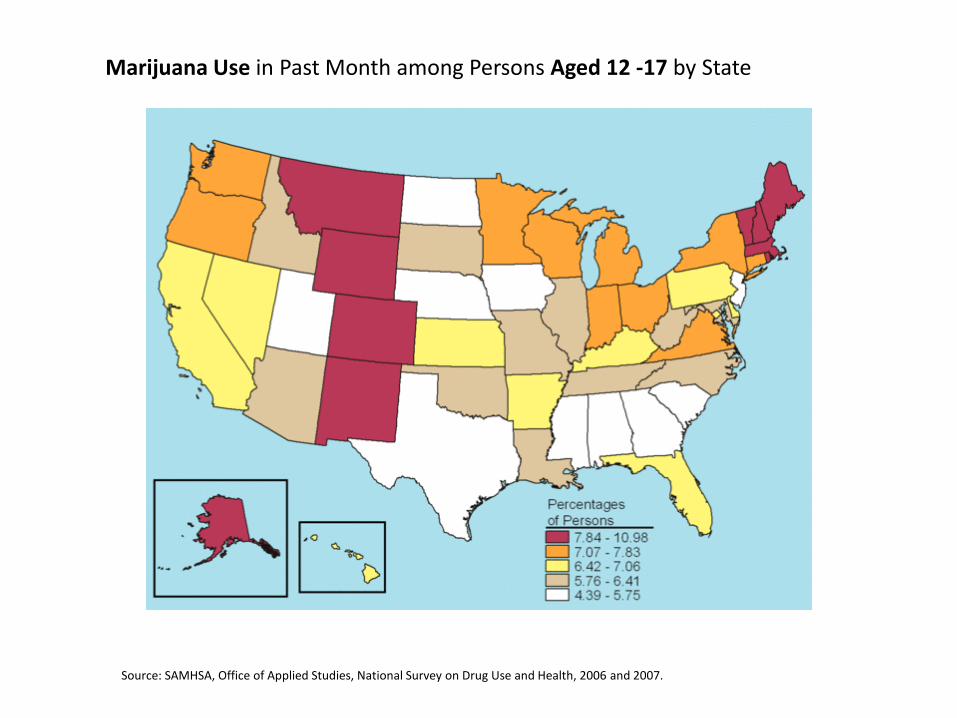
Marijuana Use in Past Month among Persons Aged 12 -17 by State
Source: SAMHSA, Office of Applied Studies, National Survey on Drug Use and Health, 2006 and 2007.
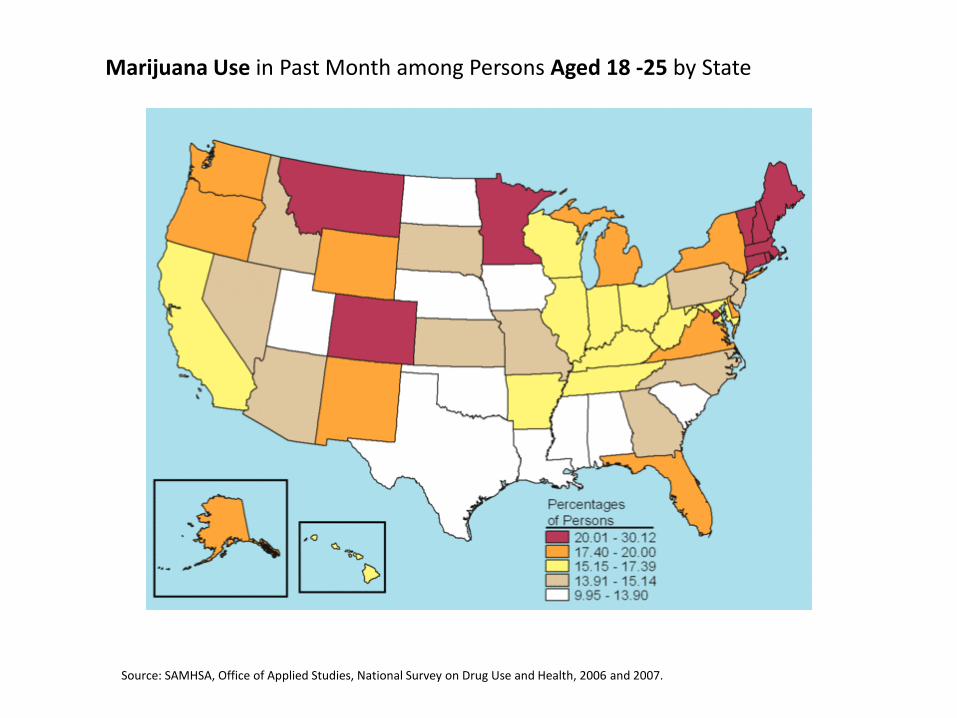
Marijuana Use in Past Month among Persons Aged 18 -25 by State
Source: SAMHSA, Office of Applied Studies, National Survey on Drug Use and Health, 2006 and 2007.
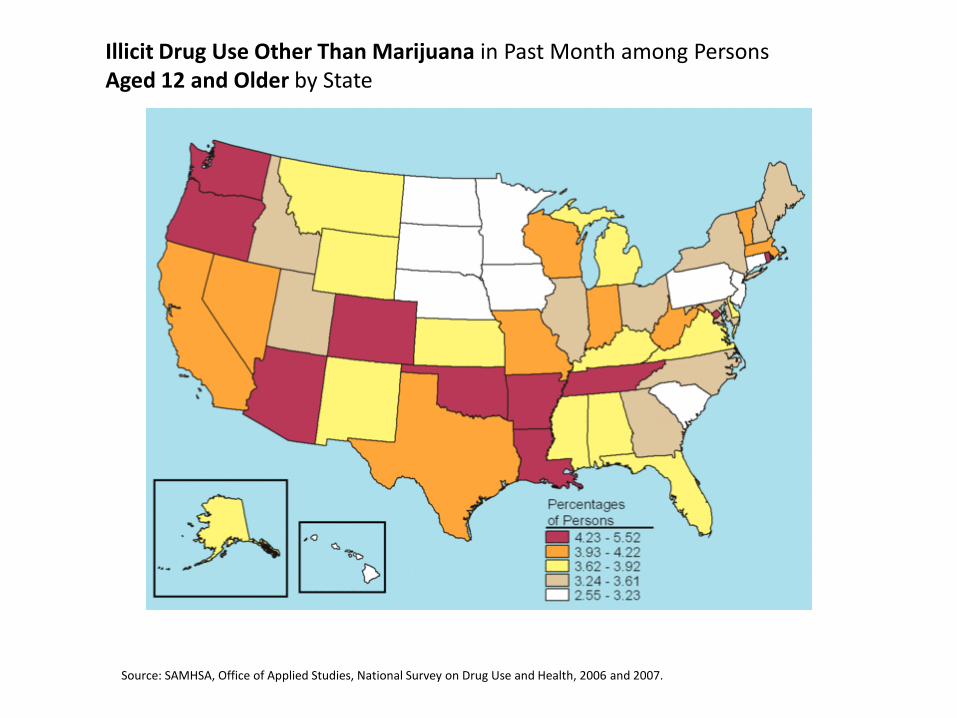
Illicit Drug Use Other Than Marijuana in Past Month among Persons Aged 12 and Older by State
Source: SAMHSA, Office of Applied Studies, National Survey on Drug Use and Health, 2006 and 2007.
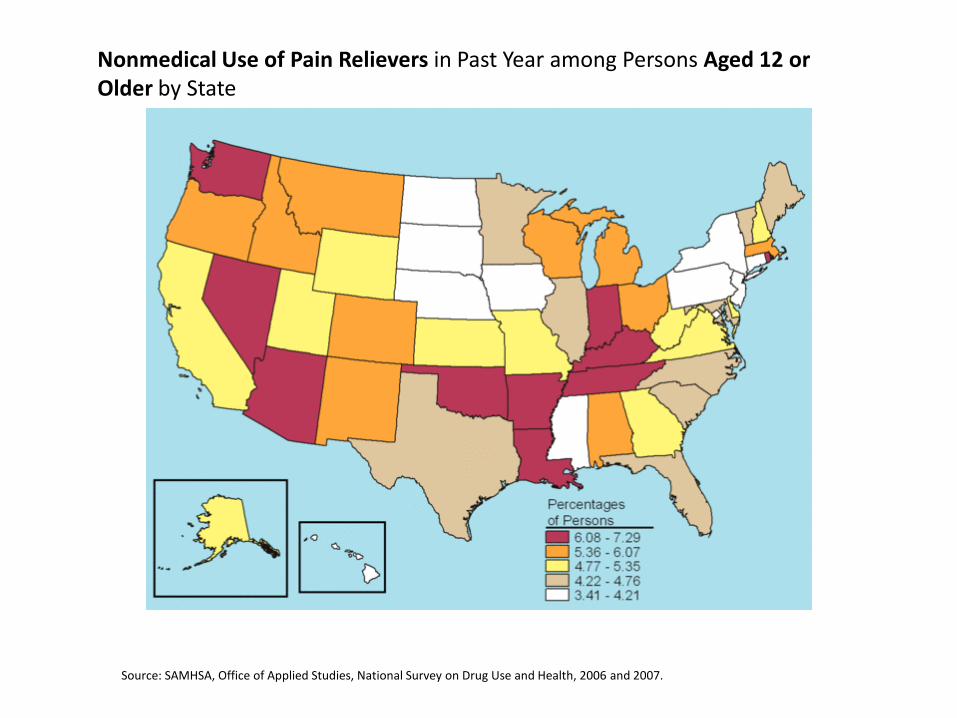
Nonmedical Use of Pain Relievers in Past Year among Persons Aged 12 or Older by State
Source: SAMHSA, Office of Applied Studies, National Survey on Drug Use and Health, 2006 and 2007.
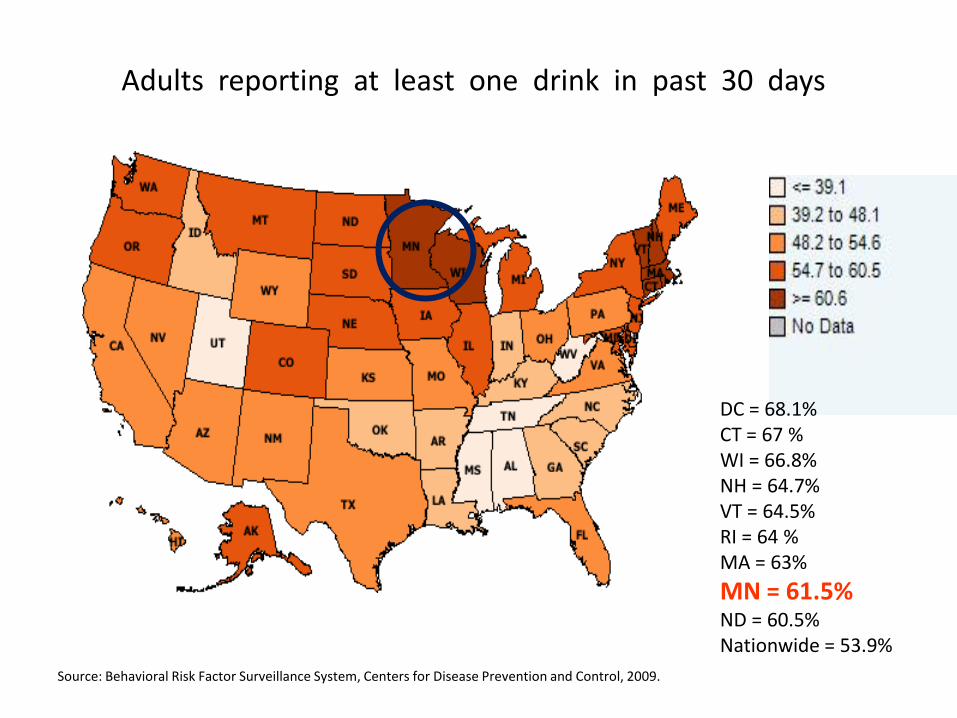
Adults reporting at least one drink in past 30 days
Source: Behavioral Risk Factor Surveillance System, Centers for Disease Prevention and Control, 2009.
DC = 68.1%CT = 67 %WI = 66.8%NH = 64.7%VT = 64.5%RI = 64 %MA = 63%
MN = 61.5%ND = 60.5%Nationwide = 53.9%
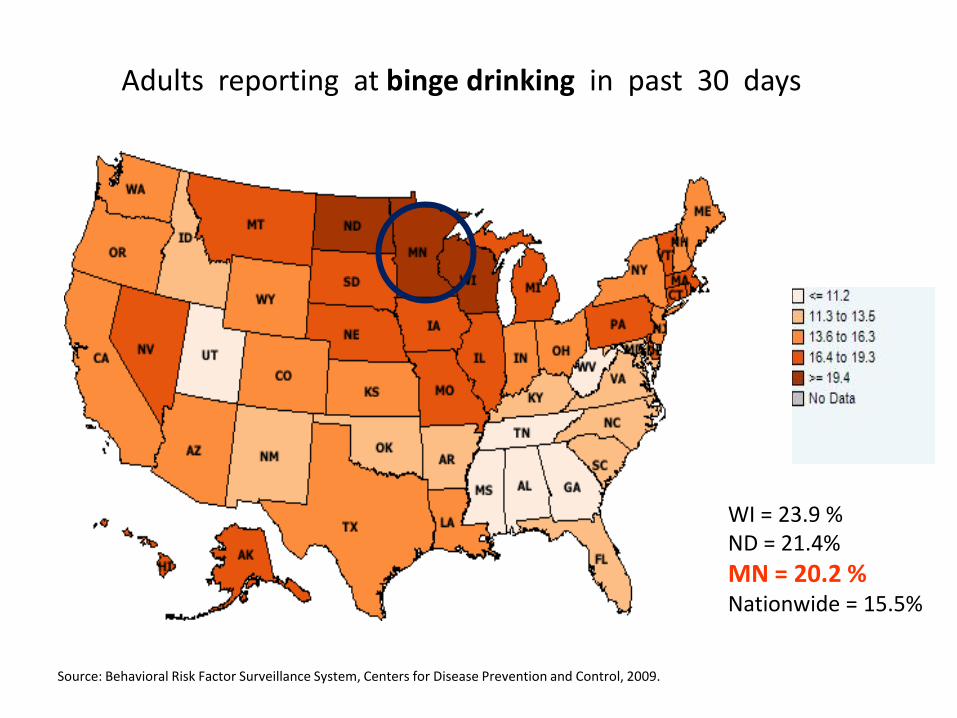
Adults reporting at binge drinking in past 30 days
Source: Behavioral Risk Factor Surveillance System, Centers for Disease Prevention and Control, 2009.
WI = 23.9 %ND = 21.4%
MN = 20.2 %Nationwide = 15.5%
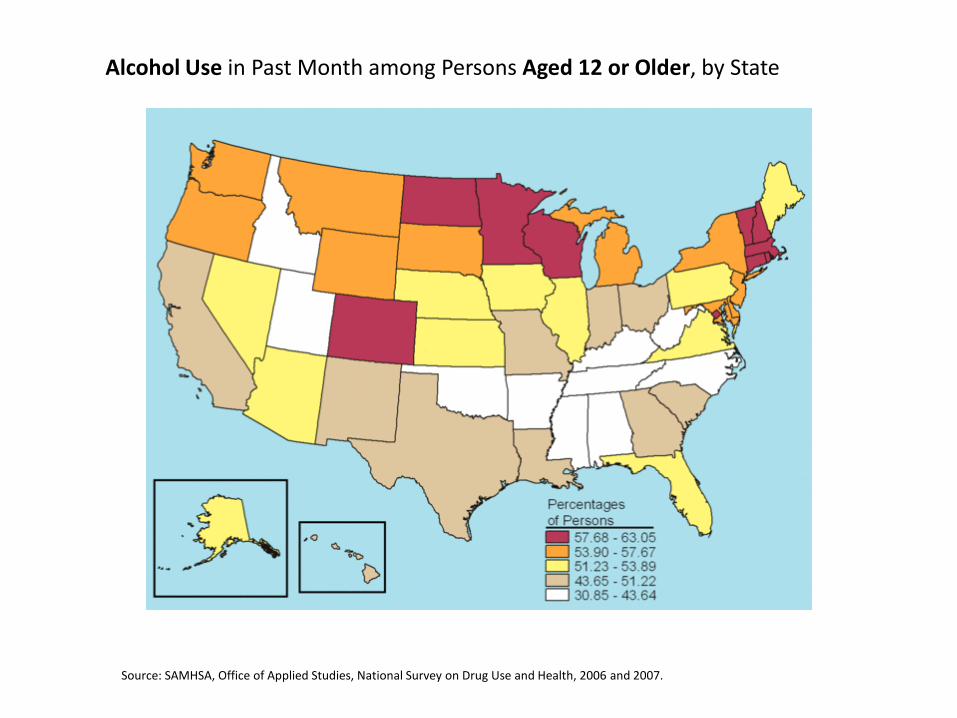
Alcohol Use in Past Month among Persons Aged 12 or Older, by State
Source: SAMHSA, Office of Applied Studies, National Survey on Drug Use and Health, 2006 and 2007.
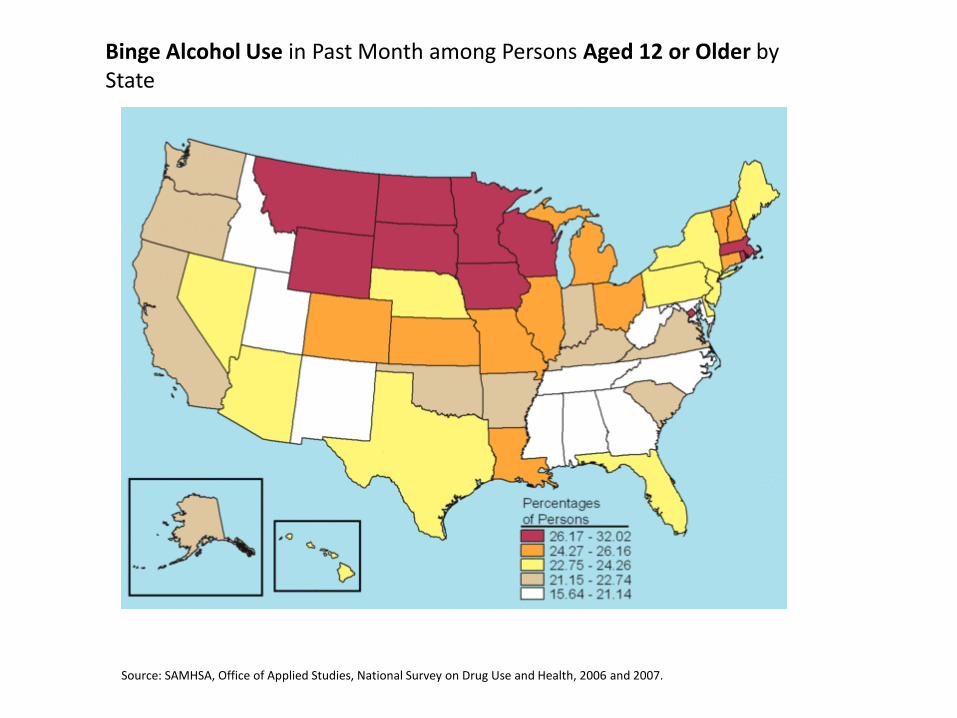
Binge Alcohol Use in Past Month among Persons Aged 12 or Older by State
Source: SAMHSA, Office of Applied Studies, National Survey on Drug Use and Health, 2006 and 2007.
1992 – 2010MINNESOTA STUDENT SURVEY
The Minnesota Student Survey is conducted every three years among students in Minnesota public schools, including charter schools and tribal schools in grades 6, 9, and 12.
• Of the 335 public operating school districts, 295 agreed to participate (88%).
• Student participation was voluntary. Pen and pencil surveys were anonymous.
• Across the state, approximately 79% of public school sixth graders, 75% of public school ninth graders, and 59% of public school twelfth graders participated in the 2010 Minnesota Student Survey.
• Overall participation across the three grades was approximately 71% of total enrollment.
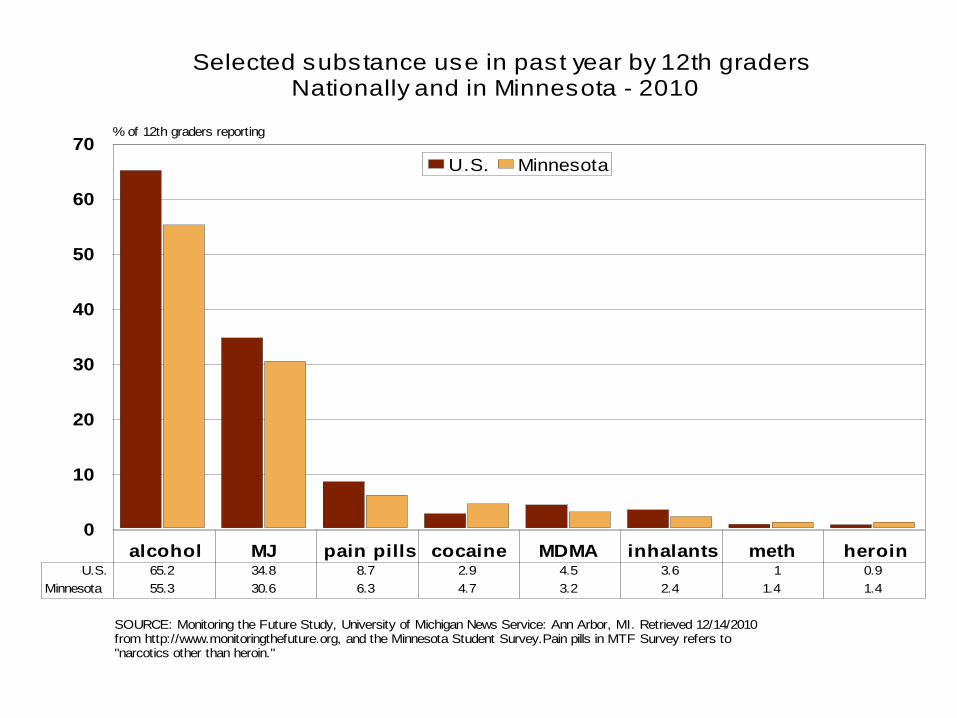
Selected substance use in past year by 12th graders Nationally and in Minnesota - 2010
SOURCE: Monitoring the Future Study, University of Michigan News Service: Ann Arbor, MI. Retrieved 12/14/2010 from http://www.monitoringthefuture.org, and the Minnesota Student Survey.Pain pills in MTF Survey refers to "narcotics other than heroin."
alcohol MJ pain pills cocaine MDMA inhalants meth heroin
0
10
20
30
40
50
60
70% of 12th graders reporting
U.S. Minnesota
U.S. 65.2 34.8 8.7 2.9 4.5 3.6 1 0.9
Minnesota 55.3 30.6 6.3 4.7 3.2 2.4 1.4 1.4
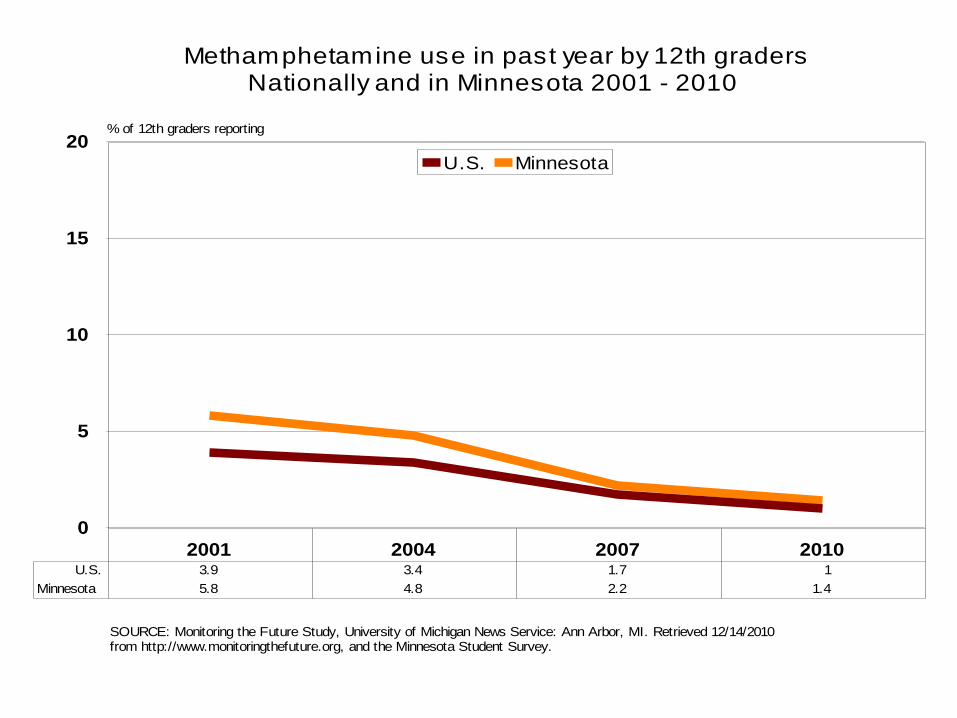
Methamphetamine use in past year by 12th graders Nationally and in Minnesota 2001 - 2010
SOURCE: Monitoring the Future Study, University of Michigan News Service: Ann Arbor, MI. Retrieved 12/14/2010 from http://www.monitoringthefuture.org, and the Minnesota Student Survey.
2001 2004 2007 2010
0
5
10
15
20% of 12th graders reporting
U.S. Minnesota
U.S. 3.9 3.4 1.7 1
Minnesota 5.8 4.8 2.2 1.4
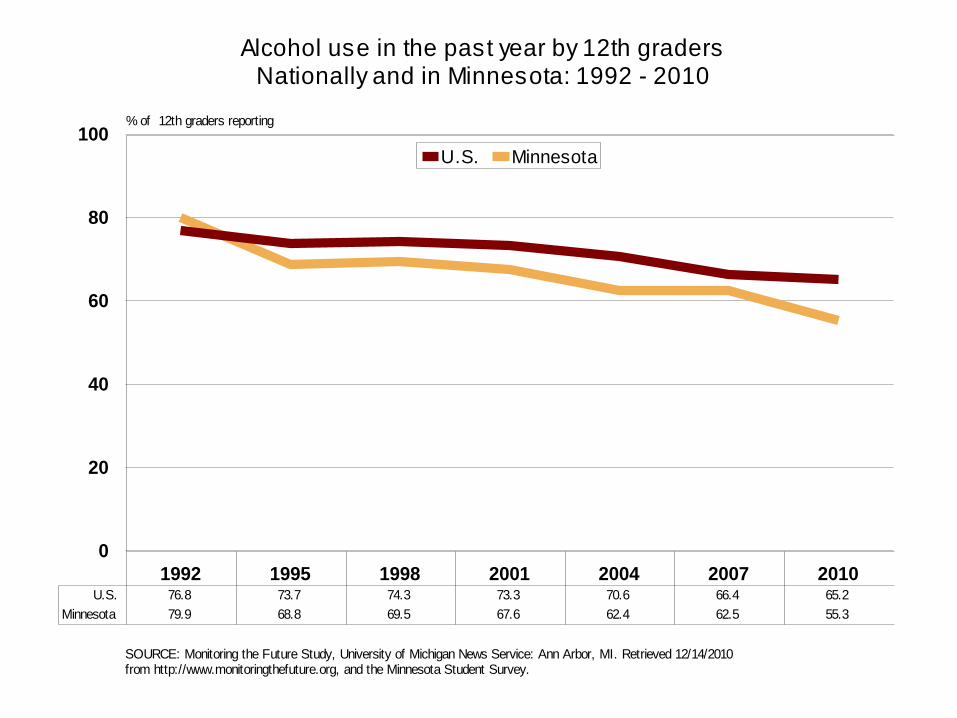
Alcohol use in the past year by 12th gradersNationally and in Minnesota: 1992 - 2010
SOURCE: Monitoring the Future Study, University of Michigan News Service: Ann Arbor, MI. Retrieved 12/14/2010 from http://www.monitoringthefuture.org, and the Minnesota Student Survey.
1992 1995 1998 2001 2004 2007 2010
0
20
40
60
80
100% of 12th graders reporting
U.S. Minnesota
U.S. 76.8 73.7 74.3 73.3 70.6 66.4 65.2
Minnesota 79.9 68.8 69.5 67.6 62.4 62.5 55.3
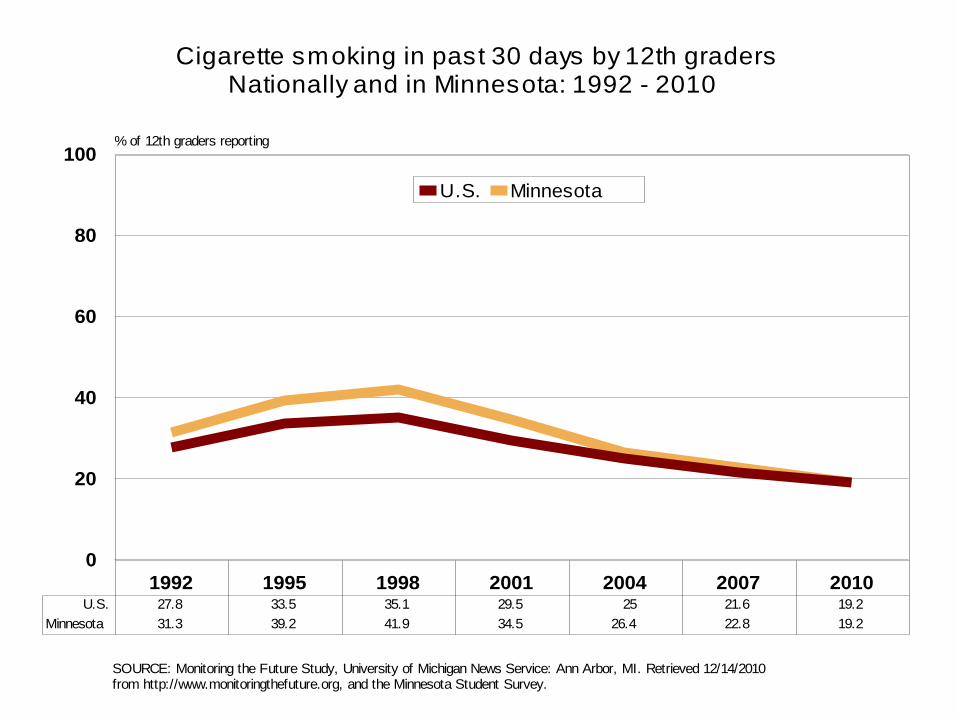
Cigarette smoking in past 30 days by 12th gradersNationally and in Minnesota: 1992 - 2010
SOURCE: Monitoring the Future Study, University of Michigan News Service: Ann Arbor, MI. Retrieved 12/14/2010 from http://www.monitoringthefuture.org, and the Minnesota Student Survey.
1992 1995 1998 2001 2004 2007 2010
0
20
40
60
80
100% of 12th graders reporting
U.S. Minnesota
U.S. 27.8 33.5 35.1 29.5 25 21.6 19.2
Minnesota 31.3 39.2 41.9 34.5 26.4 22.8 19.2
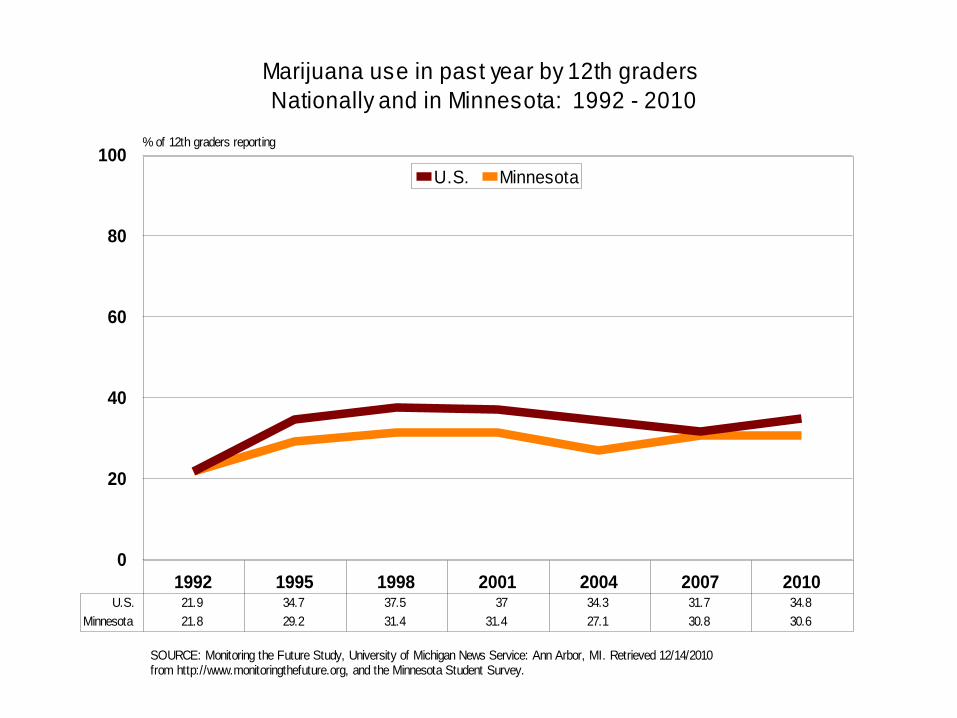
Marijuana use in past year by 12th graders
Nationally and in Minnesota: 1992 - 2010
SOURCE: Monitoring the Future Study, University of Michigan News Service: Ann Arbor, MI. Retrieved 12/14/2010 from http://www.monitoringthefuture.org, and the Minnesota Student Survey.
1992 1995 1998 2001 2004 2007 2010
0
20
40
60
80
100% of 12th graders reporting
U.S. Minnesota
U.S. 21.9 34.7 37.5 37 34.3 31.7 34.8
Minnesota 21.8 29.2 31.4 31.4 27.1 30.8 30.6
Synthetic marijuana products
• Cannabinoid compounds JWH-018 and JWH-073 are produced in a lab and sprayed on herbal mixtures
• Marketed as “incense” and sold online and in “head shops”• Labeled “not for human consumption” but marketed to those who are
interested in using them to achieve psychoactive effects similar to marijuana • These bind to the same cannabinoid receptors in the body as THC (delta-9-
tetrahydrocannabinol), the primary psychoactive component of marijuana. • Some of these compounds, however, bind more strongly to the receptors,
which could lead to a much more powerful and unpredictable effect.
Synthetic marijuana products
• Federally regulated, as of March 2011 and banned in some cities and states
• U.S. Drug Enforcement Administration (DEA) banned five synthetic cannabinoids by placing them in Schedule I status under the Controlled Substances Act.
• Schedule I status means that the substance is considered to have a high potential for abuse and no known medical benefits; and as such, it is illegal to possess or sell products that contain the substance.
• Effective March 2011 , this ban will continue for 1 year while the DEA continues to gather information about the chemicals.
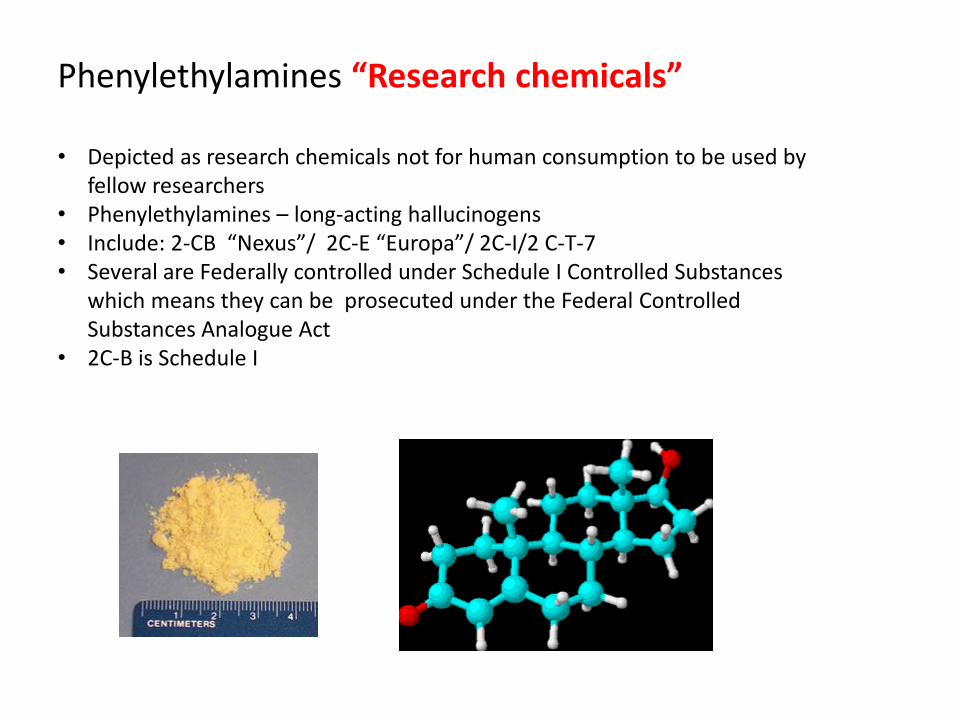
Phenylethylamines “Research chemicals”
• Depicted as research chemicals not for human consumption to be used by fellow researchers
• Phenylethylamines – long-acting hallucinogens• Include: 2-CB “Nexus”/ 2C-E “Europa”/ 2C-I/2 C-T-7• Several are Federally controlled under Schedule I Controlled Substances
which means they can be prosecuted under the Federal Controlled Substances Analogue Act
• 2C-B is Schedule I

Phenylethylamines, “Research chemicals”
• Typically is used by teenagers and young adults and used at raves, private parties, nightclubs, and other venues where the use of other drugs, such as MDMA (3,4-methylenedioxymethamphetamine, also known as ecstasy), is well-established.
• Phenylethylamines produce negative physical and psychological effects in users.• Physical effects include visual and auditory disturbances and distortions, increased
blood pressure, blurred vision, dehydration, dilated pupils, headaches, irregular heartbeat, jaw clenching, nausea, and vomiting.
• Psychological effects include emotional distress, hallucinations, inability to sleep, irritability, loss of memory, nervousness, restlessness, and tension.
• Risks increase with coingestants
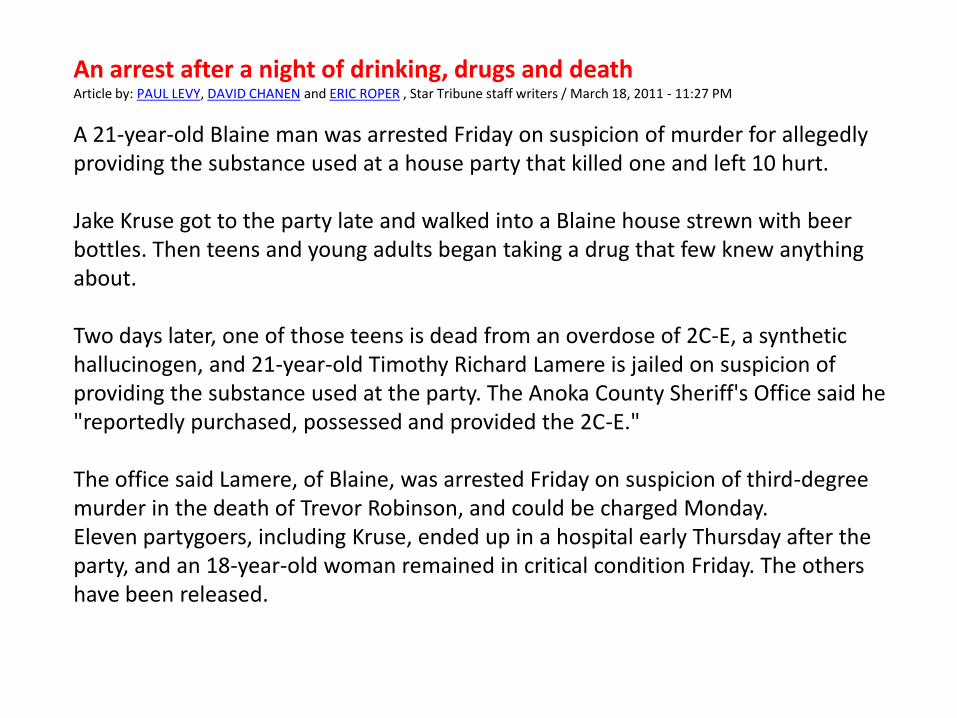
An arrest after a night of drinking, drugs and deathArticle by: PAUL LEVY, DAVID CHANEN and ERIC ROPER , Star Tribune staff writers / March 18, 2011 - 11:27 PM
A 21-year-old Blaine man was arrested Friday on suspicion of murder for allegedly providing the substance used at a house party that killed one and left 10 hurt.
Jake Kruse got to the party late and walked into a Blaine house strewn with beer bottles. Then teens and young adults began taking a drug that few knew anything about.
Two days later, one of those teens is dead from an overdose of 2C-E, a synthetic hallucinogen, and 21-year-old Timothy Richard Lamere is jailed on suspicion of providing the substance used at the party. The Anoka County Sheriff's Office said he "reportedly purchased, possessed and provided the 2C-E."
The office said Lamere, of Blaine, was arrested Friday on suspicion of third-degree murder in the death of Trevor Robinson, and could be charged Monday.Eleven partygoers, including Kruse, ended up in a hospital early Thursday after the party, and an 18-year-old woman remained in critical condition Friday. The others have been released.
N-BENZYLPIPERAZINE,
a.k.a., BZP, A2, Legal E or Legal X
• BZP has stimulant effects, produces euphoria and cardiovascular effects (increased heart rate and systolic blood pressure).
• Studies demonstrate that the abuse, dependence potential, pharmacology and toxicology of BZP are similar to those of amphetamine.
• Public health risks of BZP are similar to those of amphetamine.• BZP is about 10 times less potent than amphetamine in producing these effects in
subjects with histories of amphetamine dependence.• BZP is often abused in combination with 1-[3-(trifluoro-methyl)phenylpiperazine
(TFMPP), a non-controlled substance. • This combo is known among youthful users as a substitute for MDMA , yet no
scientific studies indicate this combination produces MDMA-like behavioral effects.
• In 2004, the DEA permanently placed BZP in Schedule I of the Controlled Substances Act (CSA) because of its high abuse potential and lack of accepted medical use.
Bath Salts (mephedrone)• “Bath Salts”• Mimic effects of cocaine
and MDMA• Hallucinations• Paranoia• Rapid heart rate• Suicidal thoughts• Contains
mephedrone (MDPV),an amphetamine
The "bath salts," which are being snorted and smoked to produce a cocaine- and meth-like high, have sent dozens of users to emergency rooms after violent behavior and hallucinations. Florida and Louisiana have banned the sale of the product.
Bath Salts (mephedrone)
• Also marketed as plant food, incense, cleaner, and incense• Used by snorting, injection and smoking• Sold in convience stores, gas stations, tattoo parlors,
pawn shops, truck stops• Labeled “not for human consumption”• Users range from teens to 40’s• User have extensive drug abuse histories• Dateline NBC tracks Minneapolis-based manufacturer
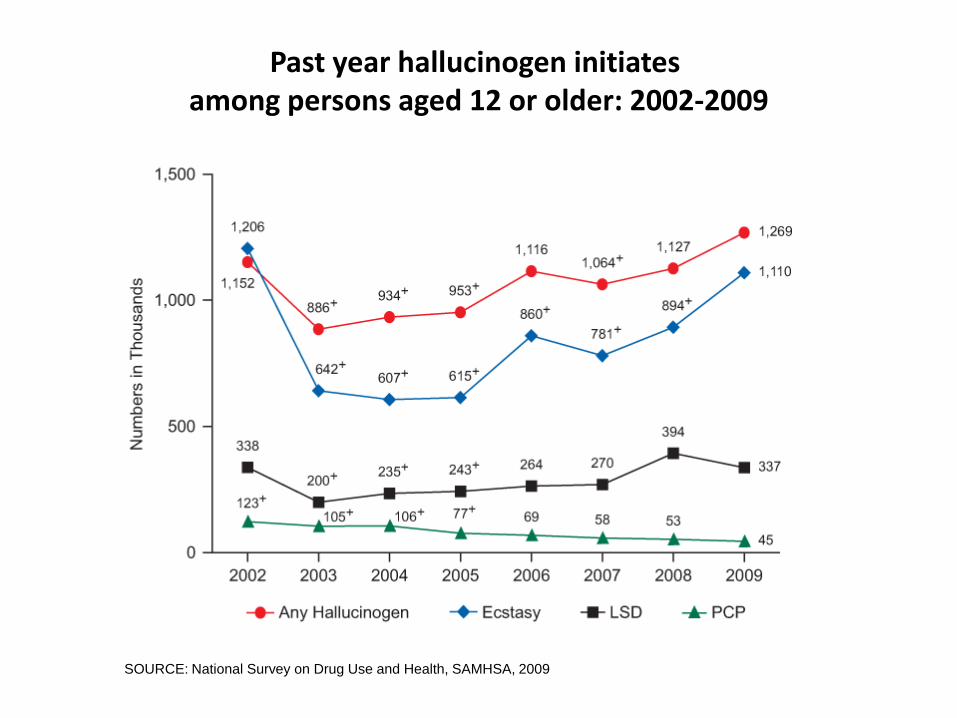
Past year hallucinogen initiates among persons aged 12 or older: 2002-2009
SOURCE: National Survey on Drug Use and Health, SAMHSA, 2009
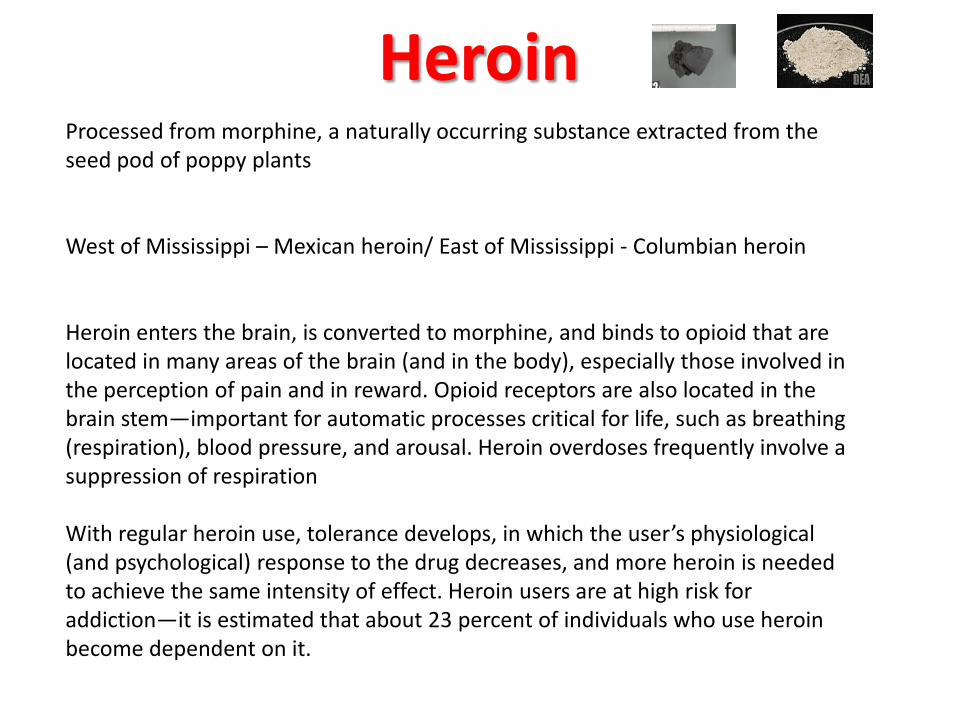
HeroinProcessed from morphine, a naturally occurring substance extracted from the seed pod of poppy plants
West of Mississippi – Mexican heroin/ East of Mississippi - Columbian heroin
Heroin enters the brain, is converted to morphine, and binds to opioid that are located in many areas of the brain (and in the body), especially those involved in the perception of pain and in reward. Opioid receptors are also located in the brain stem—important for automatic processes critical for life, such as breathing (respiration), blood pressure, and arousal. Heroin overdoses frequently involve a suppression of respiration
With regular heroin use, tolerance develops, in which the user’s physiological (and psychological) response to the drug decreases, and more heroin is needed to achieve the same intensity of effect. Heroin users are at high risk for addiction—it is estimated that about 23 percent of individuals who use heroin become dependent on it.
Prescription Drug Abuse
Ingesting another person’s prescription medication, or
taking it not as medically directed (dose, reasons).
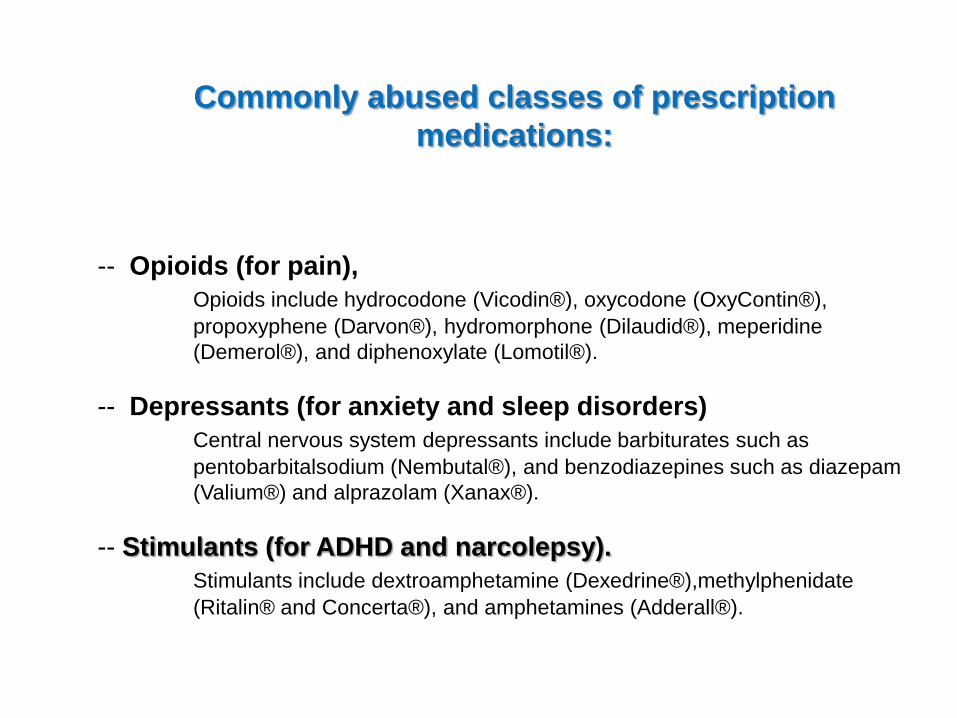
Commonly abused classes of prescription
medications:
-- Opioids (for pain),
Opioids include hydrocodone (Vicodin®), oxycodone (OxyContin®),
propoxyphene (Darvon®), hydromorphone (Dilaudid®), meperidine
(Demerol®), and diphenoxylate (Lomotil®).
-- Depressants (for anxiety and sleep disorders)
Central nervous system depressants include barbiturates such as
pentobarbitalsodium (Nembutal®), and benzodiazepines such as diazepam
(Valium®) and alprazolam (Xanax®).
-- Stimulants (for ADHD and narcolepsy).
Stimulants include dextroamphetamine (Dexedrine®),methylphenidate
(Ritalin® and Concerta®), and amphetamines (Adderall®).
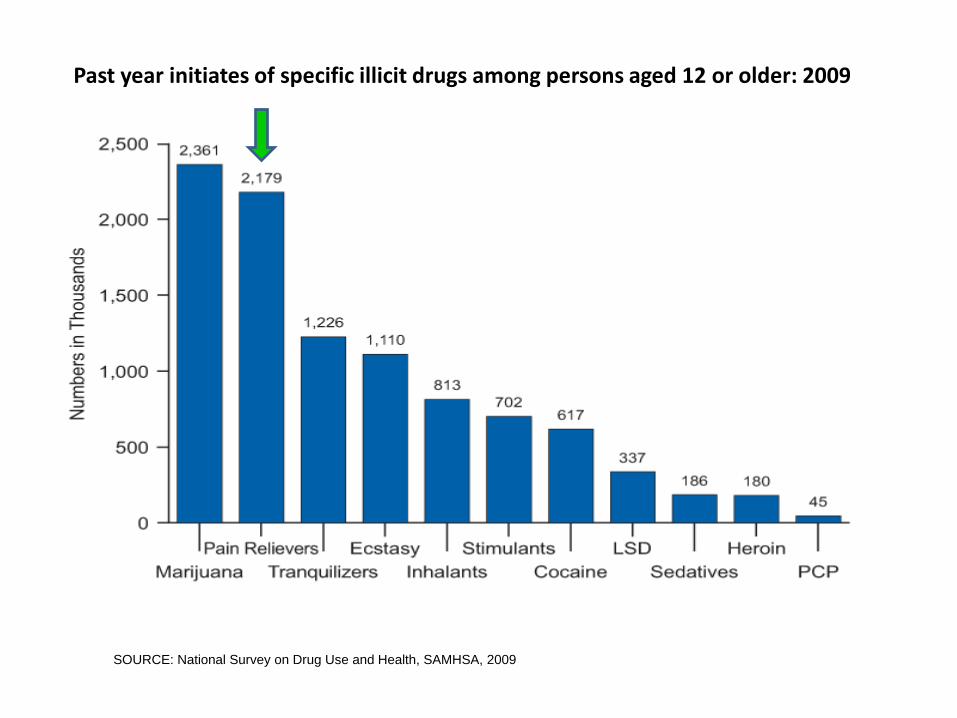
Past year initiates of specific illicit drugs among persons aged 12 or older: 2009
SOURCE: National Survey on Drug Use and Health, SAMHSA, 2009
2004 2005 2006 2007 2008 2009
0
200,000
400,000
600,000
800,000
1,000,000
1,200,000
1,400,000
627,291
1,244,679
991,363 973,591 Misuse or Abuse of
Illicit Drugs
Misuse or Abuse of
Pharmaceuticals
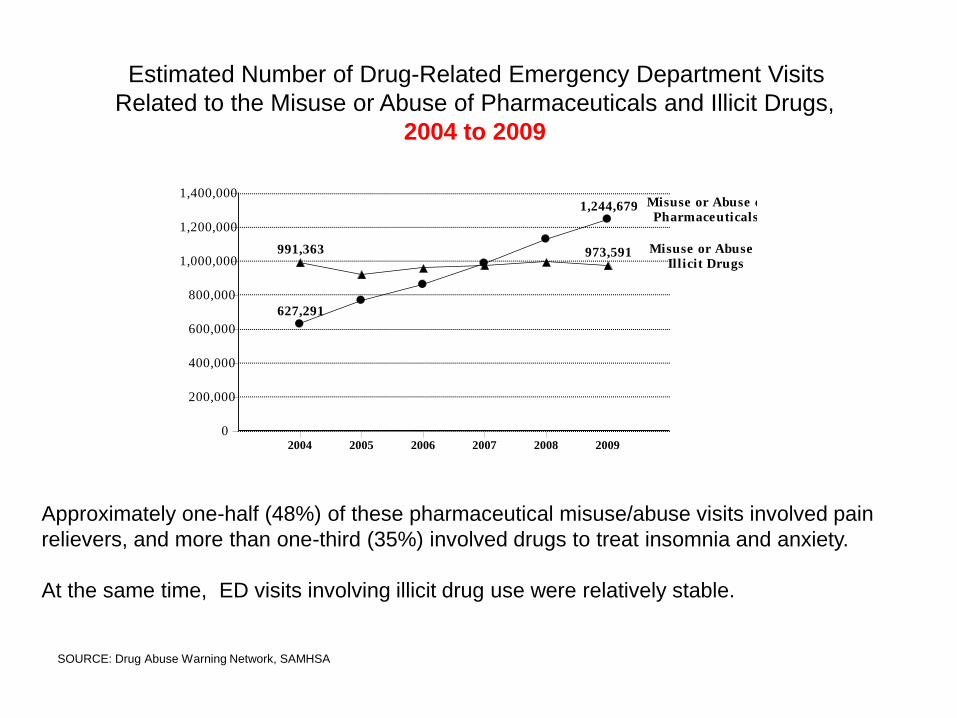
Approximately one-half (48%) of these pharmaceutical misuse/abuse visits involved pain
relievers, and more than one-third (35%) involved drugs to treat insomnia and anxiety.
At the same time, ED visits involving illicit drug use were relatively stable.
Estimated Number of Drug-Related Emergency Department Visits
Related to the Misuse or Abuse of Pharmaceuticals and Illicit Drugs,
2004 to 2009
SOURCE: Drug Abuse Warning Network, SAMHSA
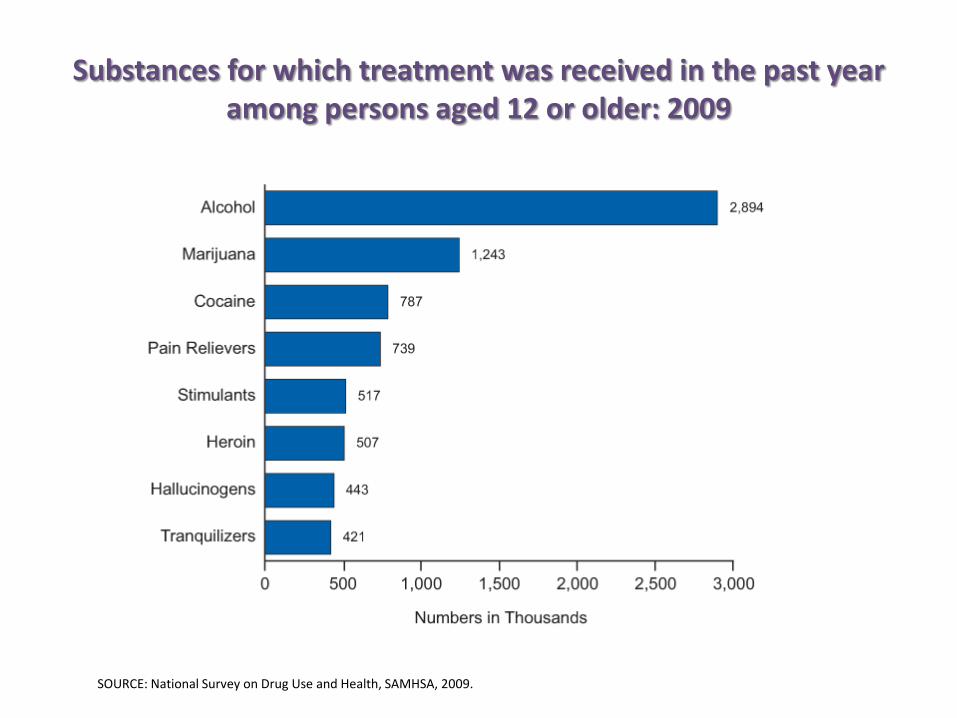
Substances for which treatment was received in the past year among persons aged 12 or older: 2009
SOURCE: National Survey on Drug Use and Health, SAMHSA, 2009.
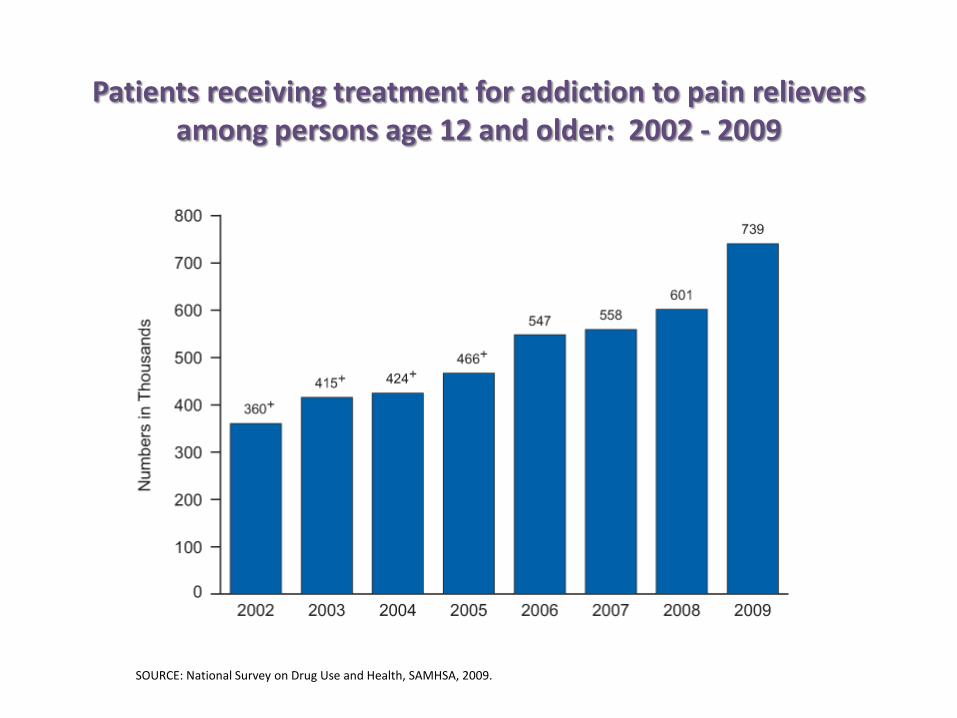
Patients receiving treatment for addiction to pain relievers among persons age 12 and older: 2002 - 2009
SOURCE: National Survey on Drug Use and Health, SAMHSA, 2009.
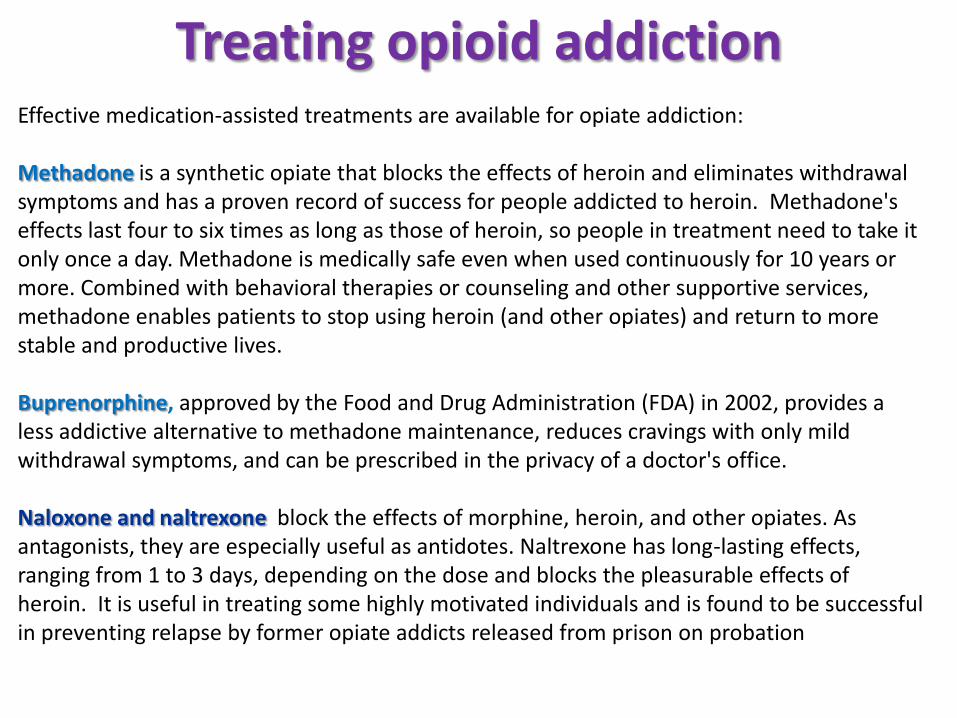
Treating opioid addictionEffective medication-assisted treatments are available for opiate addiction:
Methadone is a synthetic opiate that blocks the effects of heroin and eliminates withdrawal symptoms and has a proven record of success for people addicted to heroin. Methadone's effects last four to six times as long as those of heroin, so people in treatment need to take it only once a day. Methadone is medically safe even when used continuously for 10 years or more. Combined with behavioral therapies or counseling and other supportive services, methadone enables patients to stop using heroin (and other opiates) and return to more stable and productive lives.
Buprenorphine, approved by the Food and Drug Administration (FDA) in 2002, provides a less addictive alternative to methadone maintenance, reduces cravings with only mild withdrawal symptoms, and can be prescribed in the privacy of a doctor's office.
Naloxone and naltrexone block the effects of morphine, heroin, and other opiates. As antagonists, they are especially useful as antidotes. Naltrexone has long-lasting effects, ranging from 1 to 3 days, depending on the dose and blocks the pleasurable effects of heroin. It is useful in treating some highly motivated individuals and is found to be successful in preventing relapse by former opiate addicts released from prison on probation
What you can do:
The White House Office of National Drug Control Policy Federal blueprint for reducing prescription drug abuse:
GOAL: To reduce the nonmedical abuse of Rx drugs, and ensure access to Rx medication used legitimately
Requires community collaboration and cooperation across multiple tribes and levels of government
What you can do:EDUCATION
- Of parents, peers, patients, dispensers, and health care providersScope: Appropriate prescribing, adverse events, signs of abuse/abuse risk; signs of addiction;
storage of medications, and disposal of medications
- Working with physicians to achieve consensus standards on opiate painkiller prescribing.
What you can do:PRESCRIPTION DRUG MONITORING PROGRAMS
To help identify individuals who inappropriately obtain excessive amounts of controlled substances from multiple prescribers and pharmacies.
Minnesota PMP since 2010as of March 1, 2011:Controlled substance prescriptions collected = 6,875,346Approved users for the PMP database = 4,031
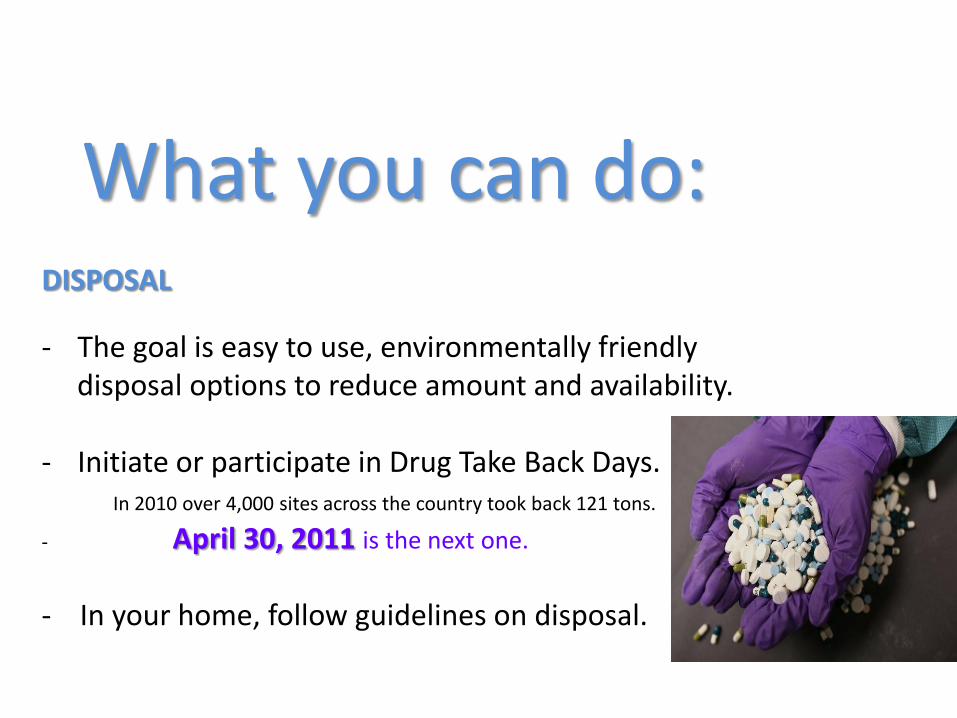
What you can do:DISPOSAL
- The goal is easy to use, environmentally friendlydisposal options to reduce amount and availability.
- Initiate or participate in Drug Take Back Days. In 2010 over 4,000 sites across the country took back 121 tons.
- April 30, 2011 is the next one.
- In your home, follow guidelines on disposal.
What you can do:LAW ENFORCEMENT
Increase training of law enforcement to • Heighten interdiction• Disrupt and dismantle drug trafficking organizations,• Share intelligence and investigative information across departments and
jurisdictions.
Take legislative steps to prohibit “pill mills” (rogue pain clinics).

What about Minnesota?
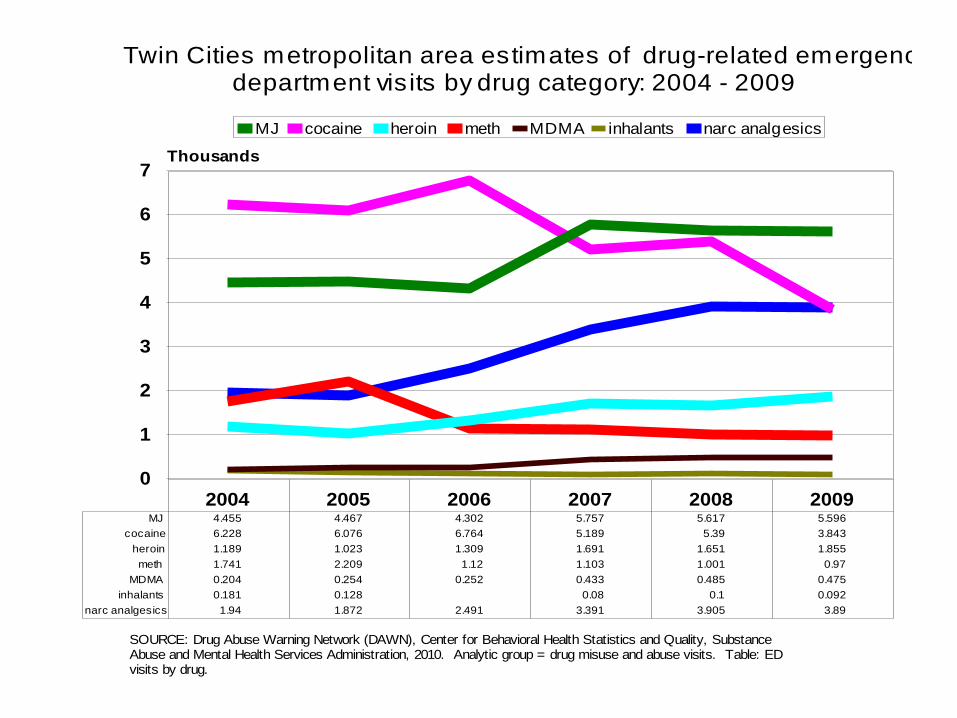
Twin Cities metropolitan area estimates of drug-related emergency department vis its by drug category: 2004 - 2009
SOURCE: Drug Abuse Warning Network (DAWN), Center for Behavioral Health Statistics and Quality, Substance Abuse and Mental Health Services Administration, 2010. Analytic group = drug misuse and abuse visits. Table: ED visits by drug.
2004 2005 2006 2007 2008 20090
1
2
3
4
5
6
7Thousands
MJ cocaine heroin meth MDMA inhalants narc analgesics
MJ 4.455 4.467 4.302 5.757 5.617 5.596
cocaine 6.228 6.076 6.764 5.189 5.39 3.843
heroin 1.189 1.023 1.309 1.691 1.651 1.855
meth 1.741 2.209 1.12 1.103 1.001 0.97
MDMA 0.204 0.254 0.252 0.433 0.485 0.475
inhalants 0.181 0.128 0.08 0.1 0.092
narc analgesics 1.94 1.872 2.491 3.391 3.905 3.89
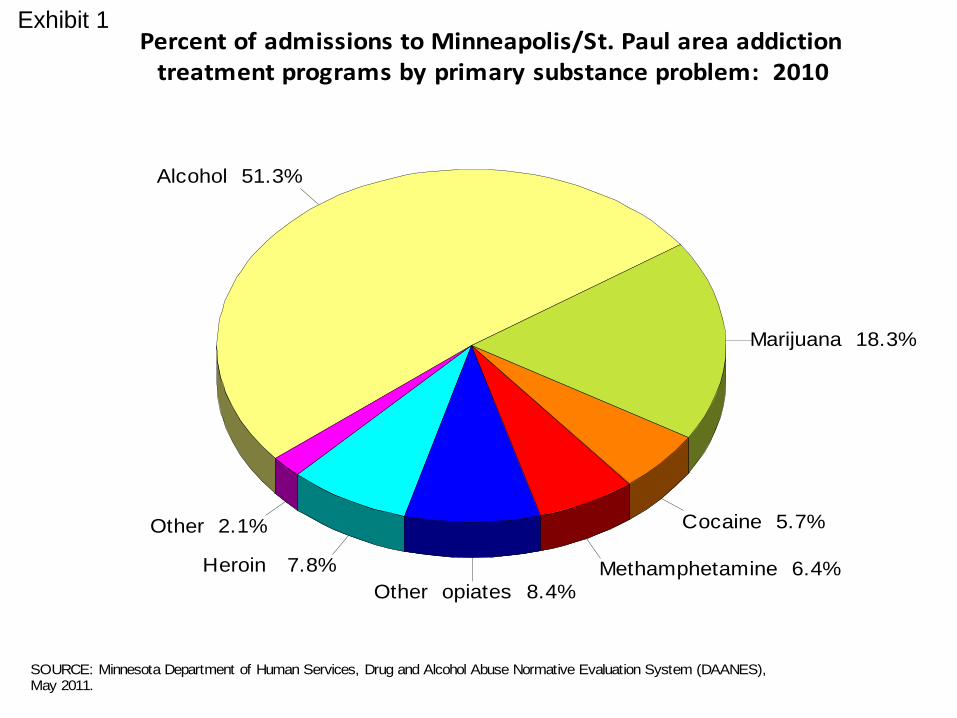
Percent of admissions to Minneapolis/St. Paul area addiction treatment programs by primary substance problem: 2010
SOURCE: Minnesota Department of Human Services, Drug and Alcohol Abuse Normative Evaluation System (DAANES), May 2011.
Heroin 7.8%
Other opiates 8.4%Methamphetamine 6.4%
Cocaine 5.7%
Marijuana 18.3%
Alcohol 51.3%
Other 2.1%
Exhibit 1
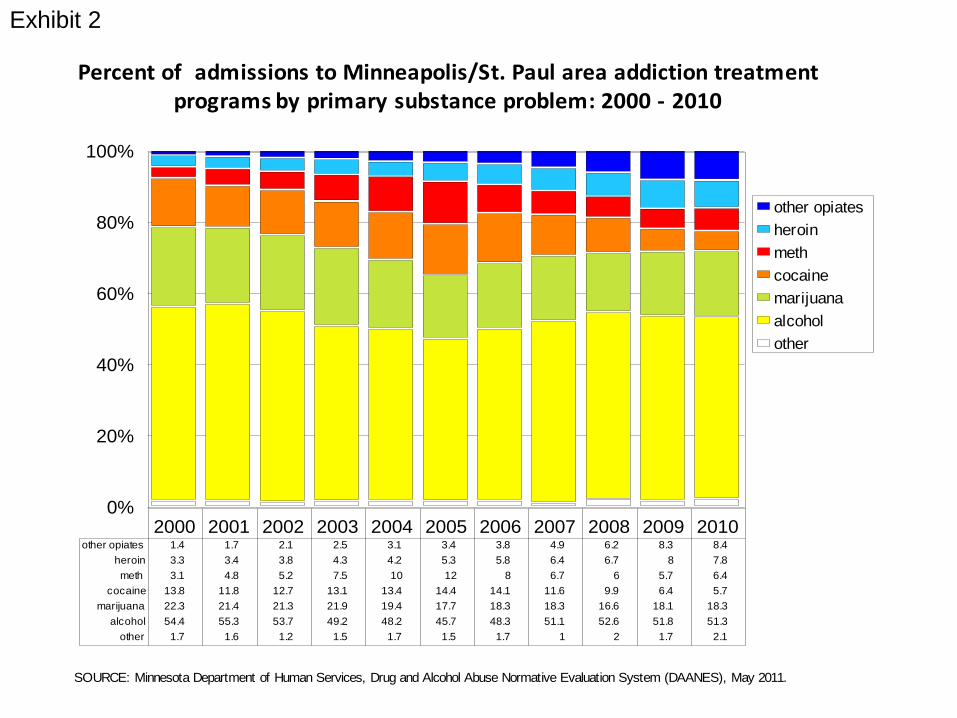
Percent of admissions to Minneapolis/St. Paul area addiction treatment programs by primary substance problem: 2000 - 2010
SOURCE: Minnesota Department of Human Services, Drug and Alcohol Abuse Normative Evaluation System (DAANES), May 2011.
2000 2001 2002 2003 2004 2005 2006 2007 2008 2009 20100%
20%
40%
60%
80%
100%
other
alcohol
marijuana
cocaine
meth
heroin
other opiates
other 1.7 1.6 1.2 1.5 1.7 1.5 1.7 1 2 1.7 2.1
alcohol 54.4 55.3 53.7 49.2 48.2 45.7 48.3 51.1 52.6 51.8 51.3
marijuana 22.3 21.4 21.3 21.9 19.4 17.7 18.3 18.3 16.6 18.1 18.3
cocaine 13.8 11.8 12.7 13.1 13.4 14.4 14.1 11.6 9.9 6.4 5.7
meth 3.1 4.8 5.2 7.5 10 12 8 6.7 6 5.7 6.4
heroin 3.3 3.4 3.8 4.3 4.2 5.3 5.8 6.4 6.7 8 7.8
other opiates 1.4 1.7 2.1 2.5 3.1 3.4 3.8 4.9 6.2 8.3 8.4
Exhibit 2
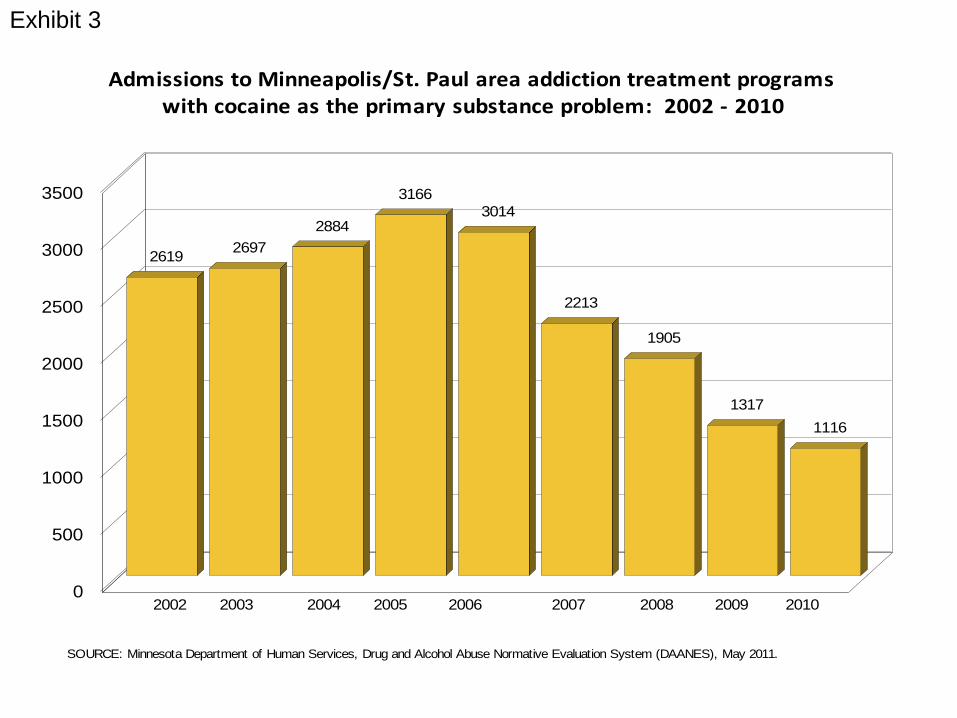
Admissions to Minneapolis/St. Paul area addiction treatment programs with cocaine as the primary substance problem: 2002 - 2010
SOURCE: Minnesota Department of Human Services, Drug and Alcohol Abuse Normative Evaluation System (DAANES), May 2011.
26192697
2884
3166
3014
2213
1905
1317
1116
0
500
1000
1500
2000
2500
3000
3500
2002 2003 2004 2005 2006 2007 2008 2009 2010
Exhibit 3
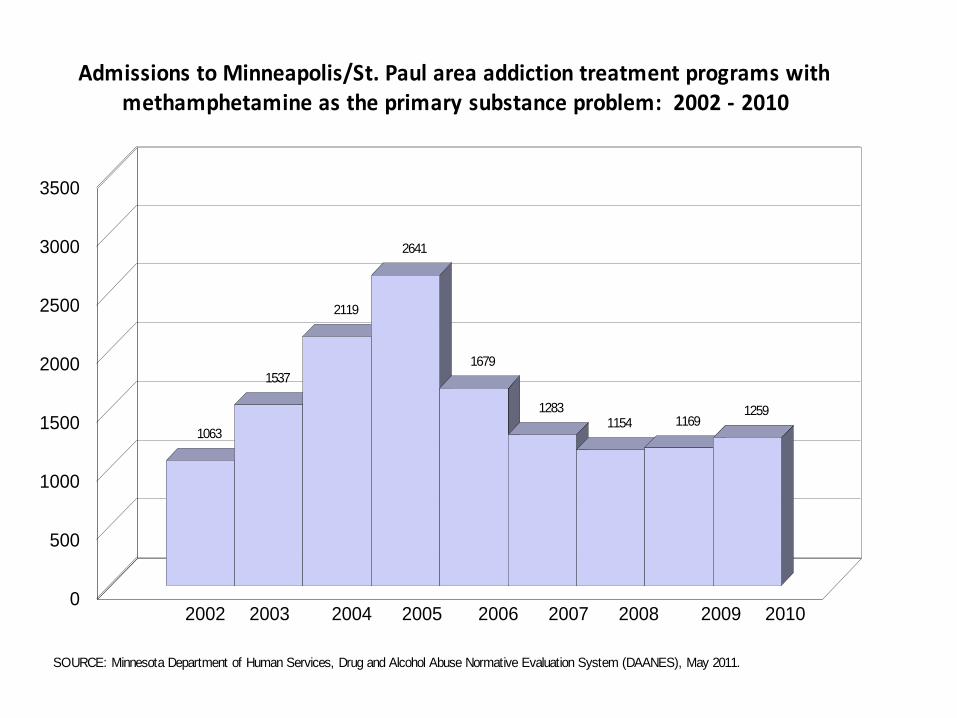
Admissions to Minneapolis/St. Paul area addiction treatment programs with methamphetamine as the primary substance problem: 2002 - 2010
SOURCE: Minnesota Department of Human Services, Drug and Alcohol Abuse Normative Evaluation System (DAANES), May 2011.
1063
1537
2119
2641
1679
12831154 1169
1259
0
500
1000
1500
2000
2500
3000
3500
2002 2003 2004 2005 2006 2007 2008 2009 2010
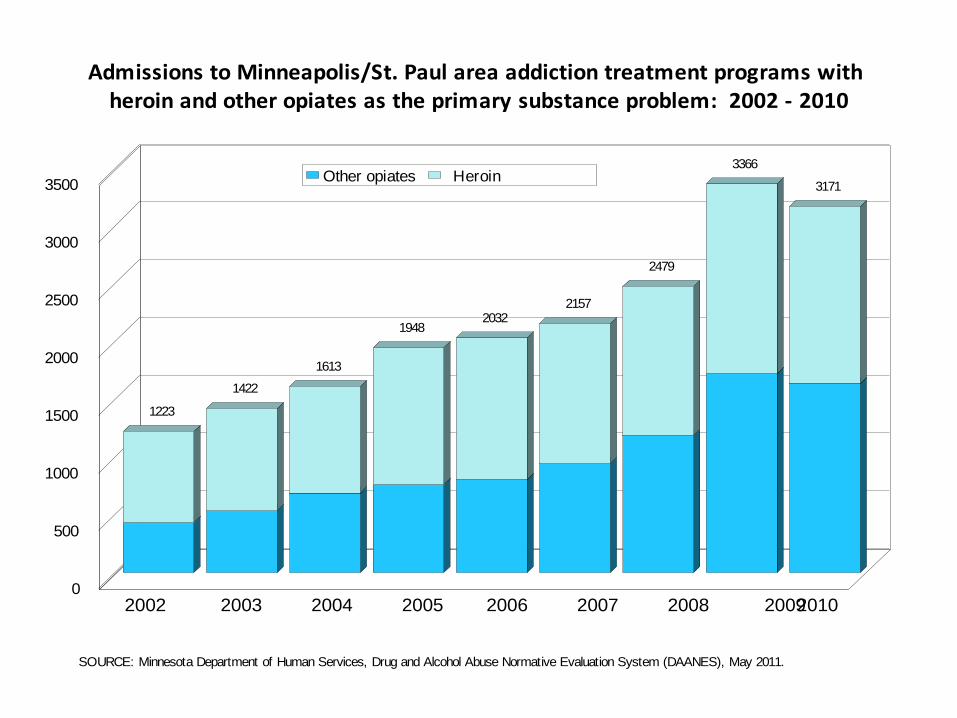
Admissions to Minneapolis/St. Paul area addiction treatment programs with heroin and other opiates as the primary substance problem: 2002 - 2010
SOURCE: Minnesota Department of Human Services, Drug and Alcohol Abuse Normative Evaluation System (DAANES), May 2011.
1223
1422
1613
19482032
2157
2479
3366
3171
0
500
1000
1500
2000
2500
3000
3500Other opiates Heroin
2002 2003 2004 2005 2006 2007 2008 20092010
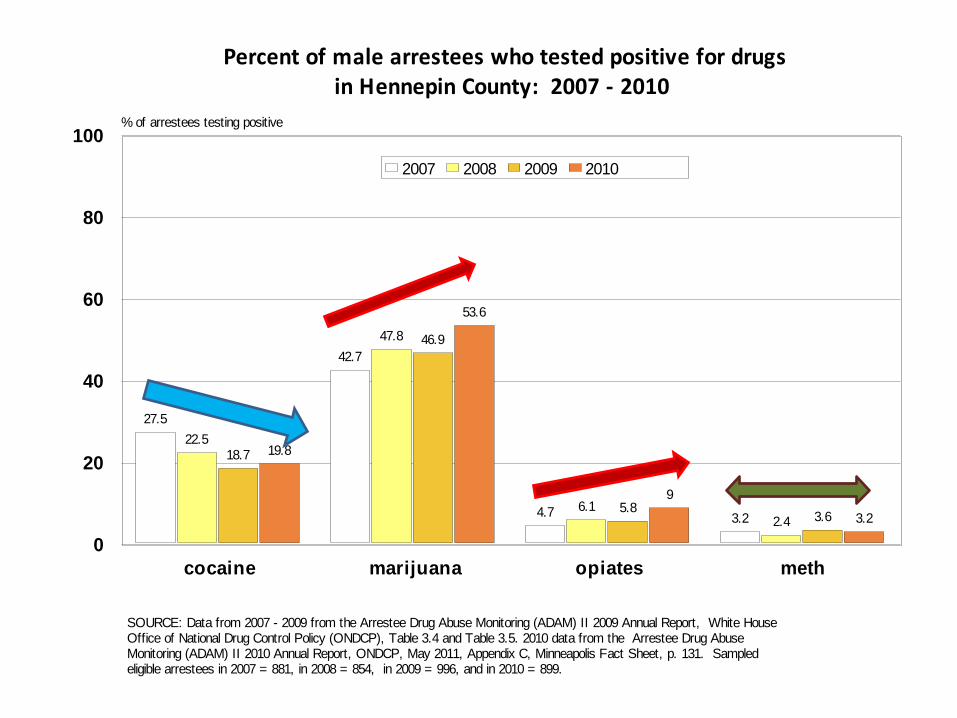
Percent of male arrestees who tested positive for drugs in Hennepin County: 2007 - 2010
SOURCE: Data from 2007 - 2009 from the Arrestee Drug Abuse Monitoring (ADAM) II 2009 Annual Report, White House Office of National Drug Control Policy (ONDCP), Table 3.4 and Table 3.5. 2010 data from the Arrestee Drug Abuse Monitoring (ADAM) II 2010 Annual Report, ONDCP, May 2011, Appendix C, Minneapolis Fact Sheet, p. 131. Sampled eligible arrestees in 2007 = 881, in 2008 = 854, in 2009 = 996, and in 2010 = 899.
27.5
42.7
4.7 3.2
22.5
47.8
6.12.4
18.7
46.9
5.83.6
19.8
53.6
9
3.2
cocaine marijuana opiates meth
0
20
40
60
80
100% of arrestees testing positive
2007 2008 2009 2010
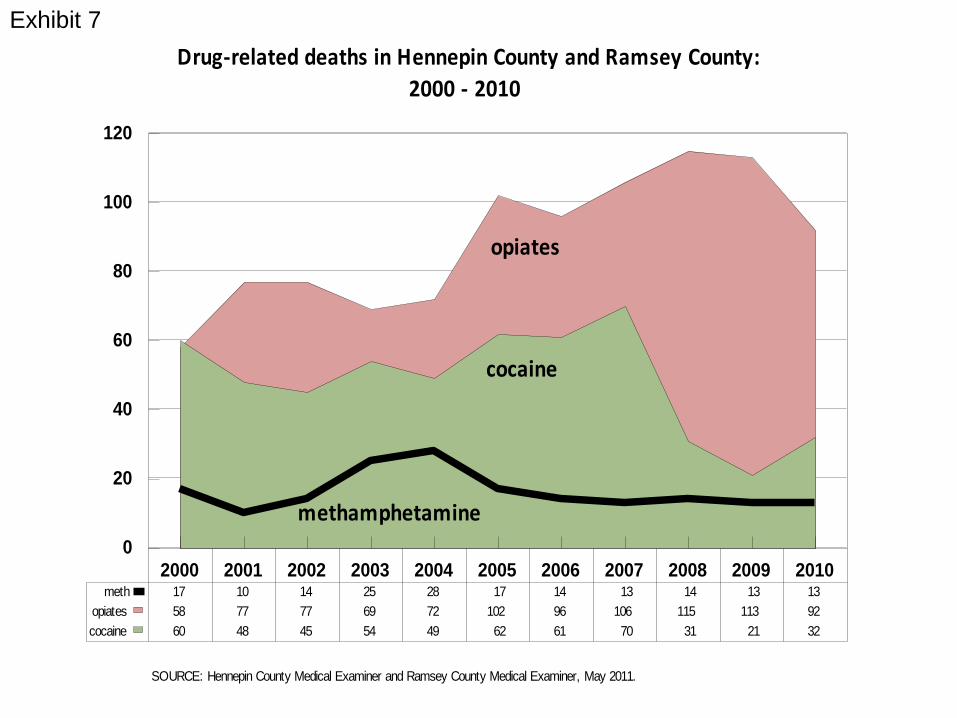
Drug-related deaths in Hennepin County and Ramsey County:
2000 - 2010
2000 2001 2002 2003 2004 2005 2006 2007 2008 2009 2010
0
20
40
60
80
100
120
cocaine 60 48 45 54 49 62 61 70 31 21 32
opiates 58 77 77 69 72 102 96 106 115 113 92
meth 17 10 14 25 28 17 14 13 14 13 13
cocaine
opiates
methamphetamine
SOURCE: Hennepin County Medical Examiner and Ramsey County Medical Examiner, May 2011.
Exhibit 7
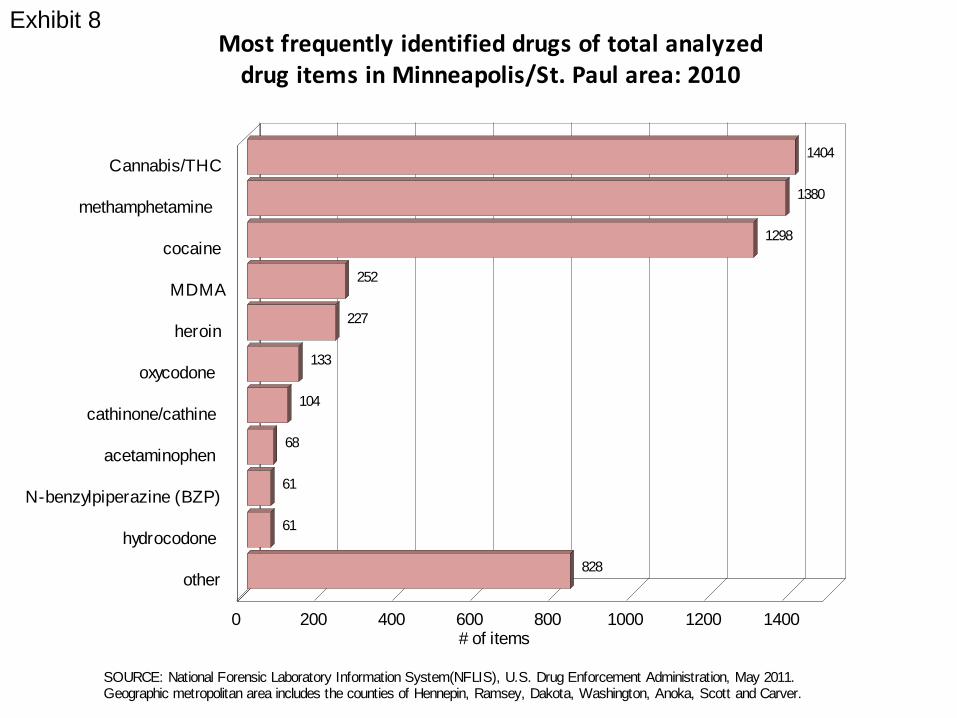
Most frequently identified drugs of total analyzed drug items in Minneapolis/St. Paul area: 2010
SOURCE: National Forensic Laboratory Information System(NFLIS), U.S. Drug Enforcement Administration, May 2011. Geographic metropolitan area includes the counties of Hennepin, Ramsey, Dakota, Washington, Anoka, Scott and Carver.
1404
1380
1298
252
227
133
104
68
61
61
828
Cannabis/THC
methamphetamine
cocaine
MDMA
heroin
oxycodone
cathinone/cathine
acetaminophen
N-benzylpiperazine (BZP)
hydrocodone
other
0 200 400 600 800 1000 1200 1400# of items
Exhibit 8

Percent of male arrestees who tested positive for drugs in Hennepin County: 2007 - 2010
SOURCE: Data from 2007 - 2009 from the Arrestee Drug Abuse Monitoring (ADAM) II 2009 Annual Report, White House Office of National Drug Control Policy (ONDCP), Table 3.4 and Table 3.5. 2010 data from the Arrestee Drug Abuse Monitoring (ADAM) II 2010 Annual Report, ONDCP, May 2011, Appendix C, Minneapolis Fact Sheet, p. 131. Sampled eligible arrestees in 2007 = 881, in 2008 = 854, in 2009 = 996, and in 2010 = 899.
27.5
42.7
4.7 3.2
22.5
47.8
6.12.4
18.7
46.9
5.83.6
19.8
53.6
9
3.2
cocaine marijuana opiates meth
0
20
40
60
80
100% of arrestees testing positive
2007 2008 2009 2010
What is addiction?
Addiction is a chronic, relapsing brain disease characterized by compulsive drug seeking and use, despite harmful consequences associated with use.
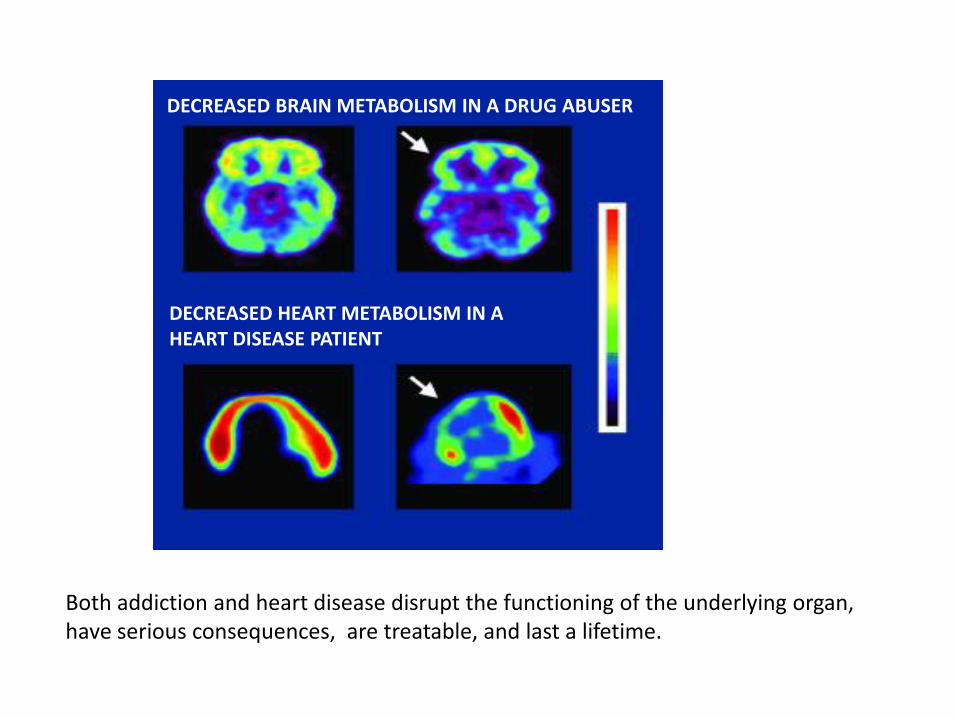
DECREASED BRAIN METABOLISM IN A DRUG ABUSER
DECREASED HEART METABOLISM IN AHEART DISEASE PATIENT
Both addiction and heart disease disrupt the functioning of the underlying organ, have serious consequences, are treatable, and last a lifetime.
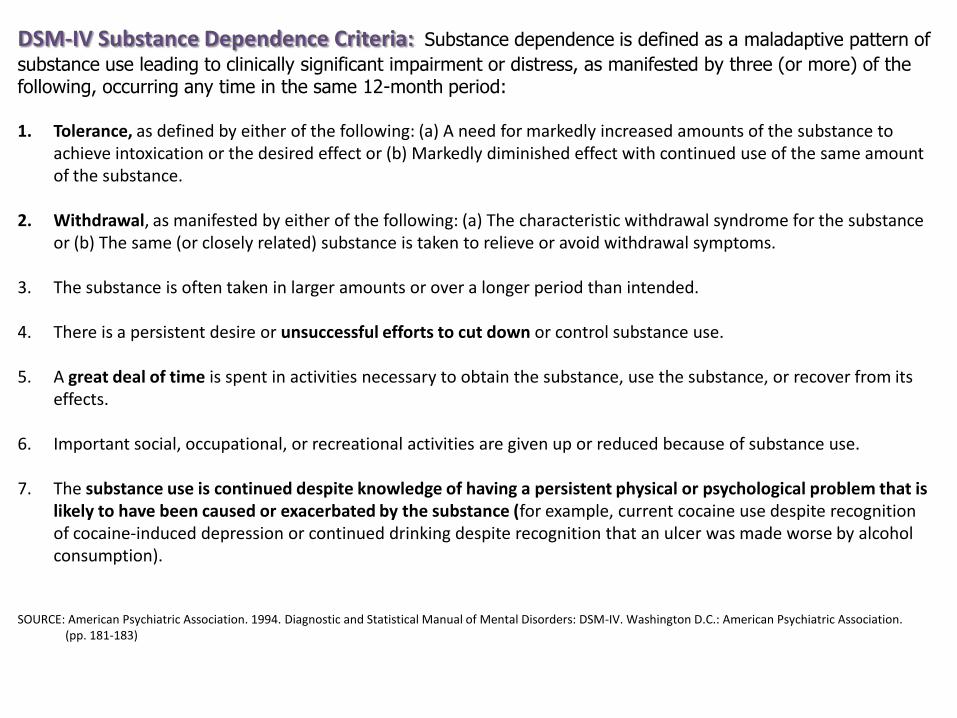
DSM-IV Substance Dependence Criteria: Substance dependence is defined as a maladaptive pattern of
substance use leading to clinically significant impairment or distress, as manifested by three (or more) of the following, occurring any time in the same 12-month period:
1. Tolerance, as defined by either of the following: (a) A need for markedly increased amounts of the substance to achieve intoxication or the desired effect or (b) Markedly diminished effect with continued use of the same amount of the substance.
2. Withdrawal, as manifested by either of the following: (a) The characteristic withdrawal syndrome for the substance or (b) The same (or closely related) substance is taken to relieve or avoid withdrawal symptoms.
3. The substance is often taken in larger amounts or over a longer period than intended.
4. There is a persistent desire or unsuccessful efforts to cut down or control substance use.
5. A great deal of time is spent in activities necessary to obtain the substance, use the substance, or recover from its effects.
6. Important social, occupational, or recreational activities are given up or reduced because of substance use.
7. The substance use is continued despite knowledge of having a persistent physical or psychological problem that is likely to have been caused or exacerbated by the substance (for example, current cocaine use despite recognition of cocaine-induced depression or continued drinking despite recognition that an ulcer was made worse by alcohol consumption).
SOURCE: American Psychiatric Association. 1994. Diagnostic and Statistical Manual of Mental Disorders: DSM-IV. Washington D.C.: American Psychiatric Association. (pp. 181-183)
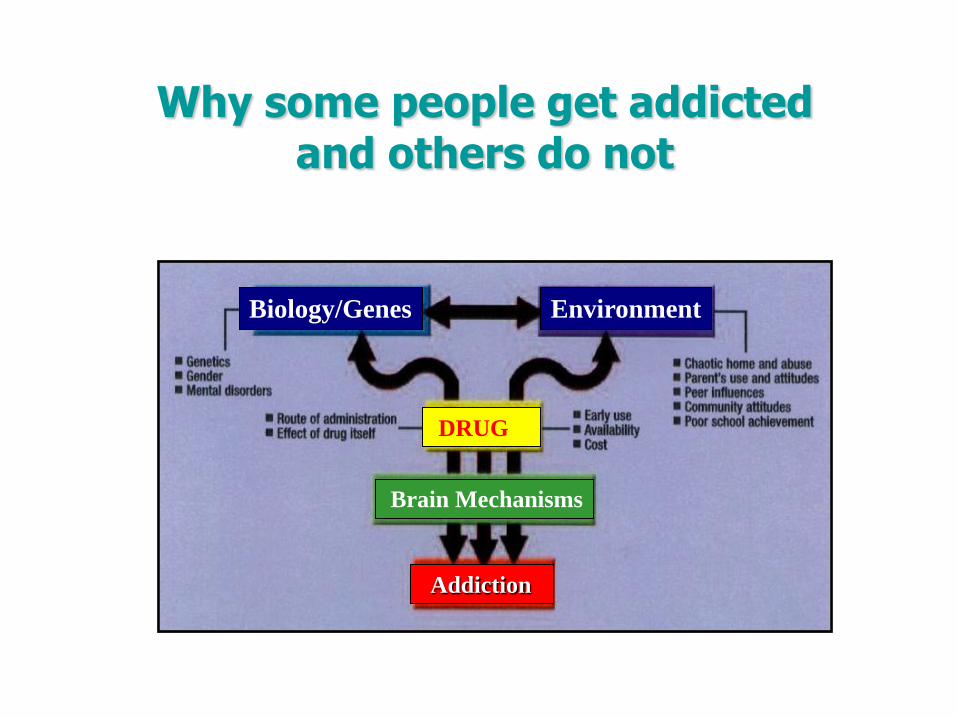
Why some people get addictedand others do not
DRUG
Biology/Genes Environment
Brain Mechanisms
Addiction
How effective is
addiction treatment?
The outcomes of addiction treatment are comparable to the outcomesof other chronic diseases with behavioral components.
SOURCE: McLellan, T., et al., Journal of the American Medical Association, 284 (2000.)
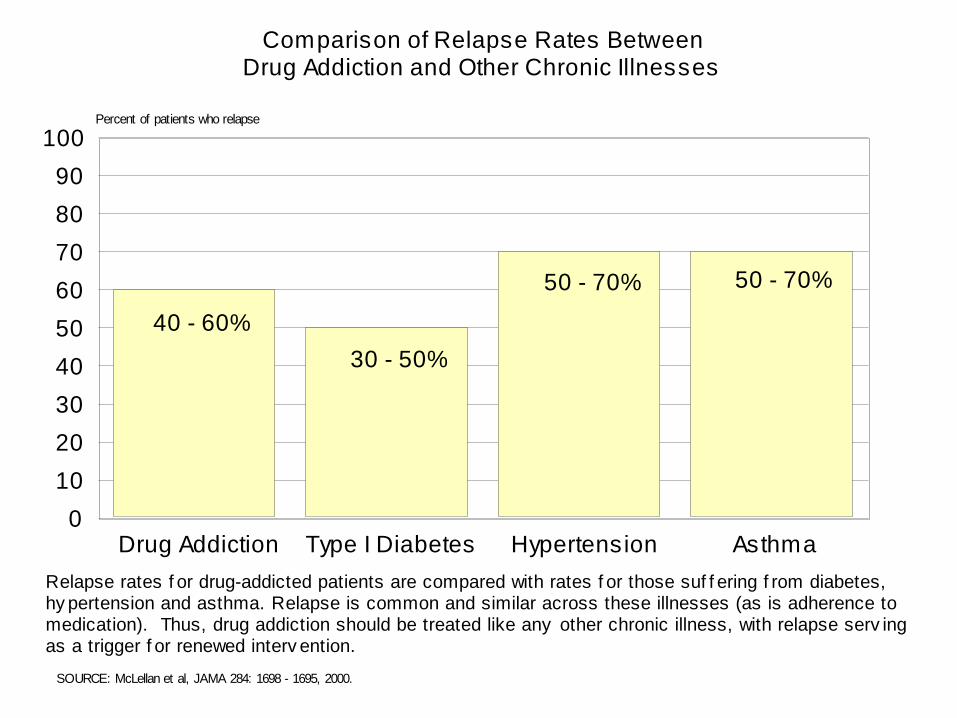
Comparison of Relapse Rates BetweenDrug Addiction and Other Chronic Illnesses
SOURCE: McLellan et al, JAMA 284: 1698 - 1695, 2000.
Drug Addiction Type I Diabetes Hypertension Asthma0
10
20
30
40
50
60
70
80
90
100Percent of patients who relapse
40 - 60%
30 - 50%
50 - 70% 50 - 70%
Relapse rates f or drug-addicted patients are compared with rates f or those suf f ering f rom diabetes, hy pertension and asthma. Relapse is common and similar across these illnesses (as is adherence to medication). Thus, drug addiction should be treated like any other chronic illness, with relapse serv ingas a trigger f or renewed interv ention.
64
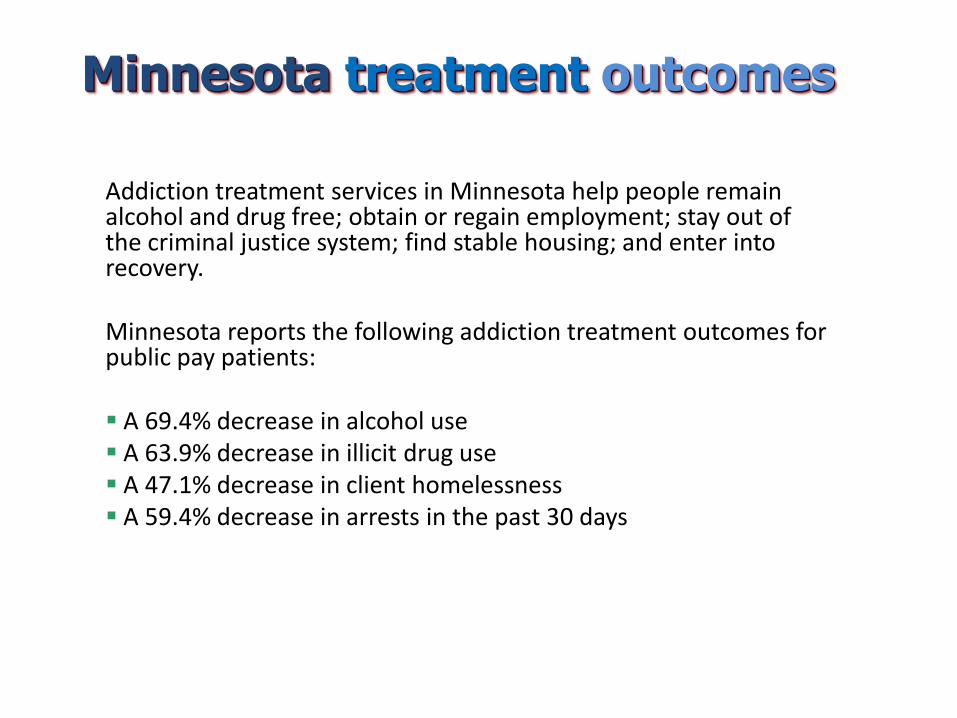
Minnesota treatment outcomes
Addiction treatment services in Minnesota help people remain alcohol and drug free; obtain or regain employment; stay out of the criminal justice system; find stable housing; and enter into recovery.
Minnesota reports the following addiction treatment outcomes for public pay patients:
A 69.4% decrease in alcohol use A 63.9% decrease in illicit drug use A 47.1% decrease in client homelessness A 59.4% decrease in arrests in the past 30 days
65
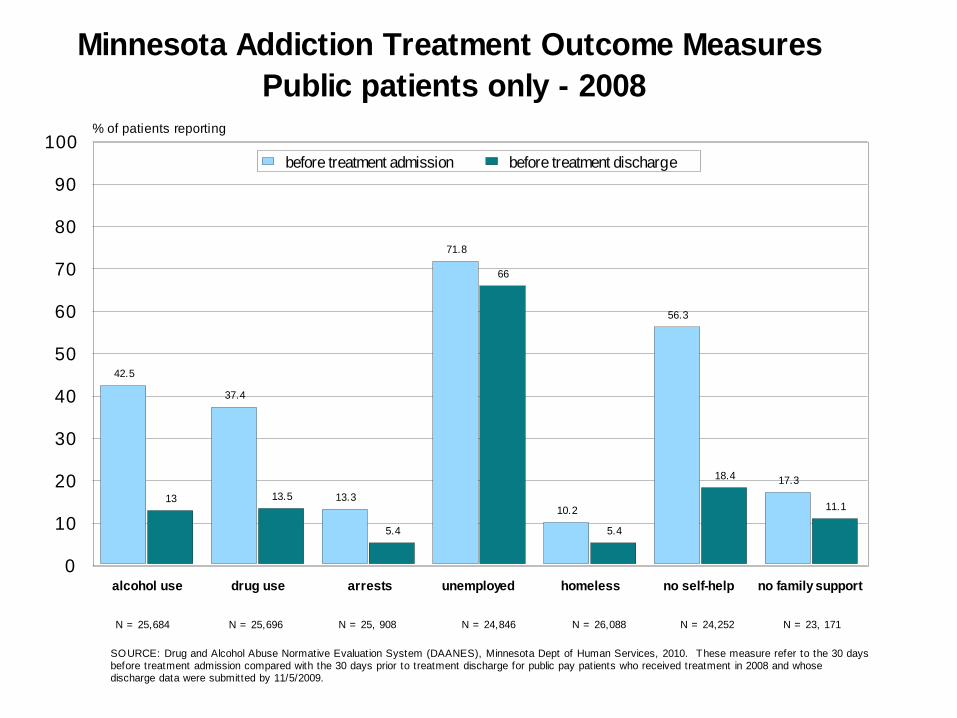
Minnesota Addiction Treatment Outcome Measures
Public patients only - 2008
SOURCE: Drug and Alcohol Abuse Normative Evaluation System (DAANES), Minnesota Dept of Human Services, 2010. These measure refer to the 30 days before treatment admission compared with the 30 days prior to treatment discharge for public pay patients who received treatment in 2008 and whose discharge data were submitted by 11/5/2009.
42.5
37.4
13.3
71.8
10.2
56.3
17.3
13 13.5
5.4
66
5.4
18.4
11.1
alcohol use drug use arrests unemployed homeless no self-help no family support
0
10
20
30
40
50
60
70
80
90
100% of patients reporting
before treatment admission before treatment discharge
N = 25,684 N = 25,696 N = 25, 908 N = 24,846 N = 26,088 N = 24,252 N = 23, 171
What about identifying
addiction?
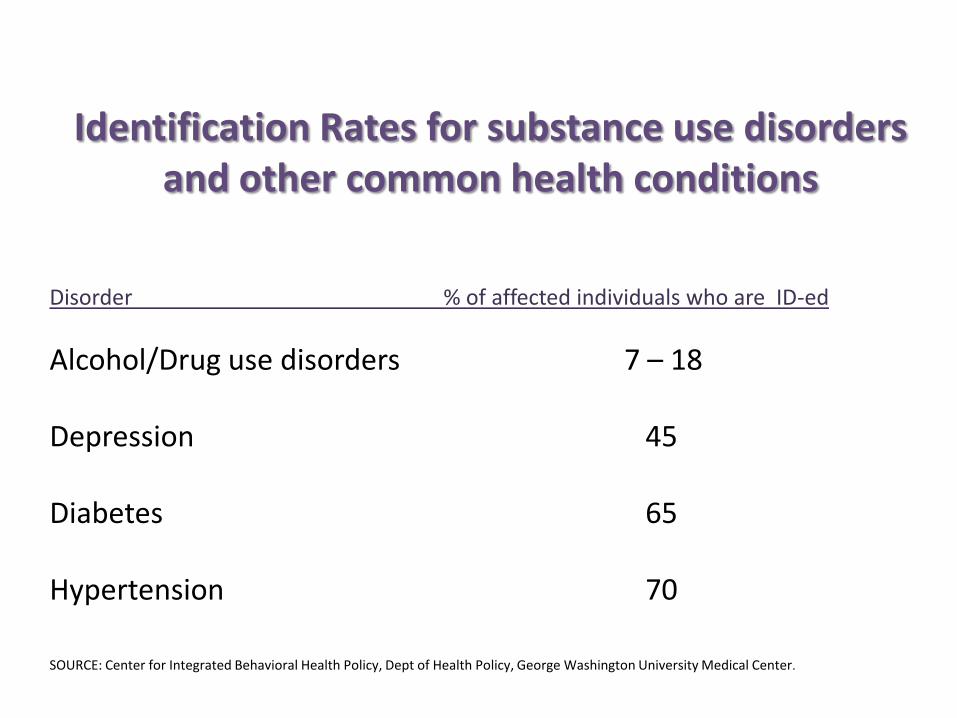
Identification Rates for substance use disorders and other common health conditions
Disorder % of affected individuals who are ID-ed
Alcohol/Drug use disorders 7 – 18
Depression 45
Diabetes 65
Hypertension 70
SOURCE: Center for Integrated Behavioral Health Policy, Dept of Health Policy, George Washington University Medical Center.

4 Most cost effective screeningand brief interventions
• Discuss daily aspirin use: men over 40, women over 50
• Childhood immunizations
• Smoking cessation/advice to quit ; adults
• Alcohol screening and brief intervention
SOURCE: Solberg, LI, et al, Primary care intervention to reduce alcohol misuse: ranking its health impact and cost effectiveness, Am J Prev Med. 2008; 34 (2)
Screening, Evaluation and Treatment (SET)
Initiative of MN DHS to train primary care doctors in state contracted HMOs to screen, evaluate and treat substance use disorders.
NEW in 2011: