current trends in ethanol, bioplastics, cogeneration and ... · current trends in ethanol,...
TRANSCRIPT

International Sugar Organization
11 September 2014
Kingsman Miami Sugar Conference
Current Trends in Ethanol, Bioplastics, Cogeneration and Sustainability
Jose Orive Executive Director
International Sugar Organization
1

2 International Sugar Organization
Structure of Presentation
Quick Round-up on World Sugar in 2014/15
The World Ethanol Market in 2014 and Beyond
The World Ethanol Market in 2013 and 2014
The main markets: USA, Brazil, EU
Long-Term Outlook by Region to 2020
Bioplastics and Cogeneration
Conclusions and Implications for Key Stakeholders
2

International Sugar Organization
5- Year World Surplus Weighing on Sugar Prices • The accumulated world sugar
surplus over 4 seasons
means the global stocks to
consumption ratio will
remain above 40% for at
least another year.
036912151821242730
135
145
155
165
175
185
US
cen
ts/lb
mln
mtrv
Production Consumption ISA price
3
International Sugar Organization
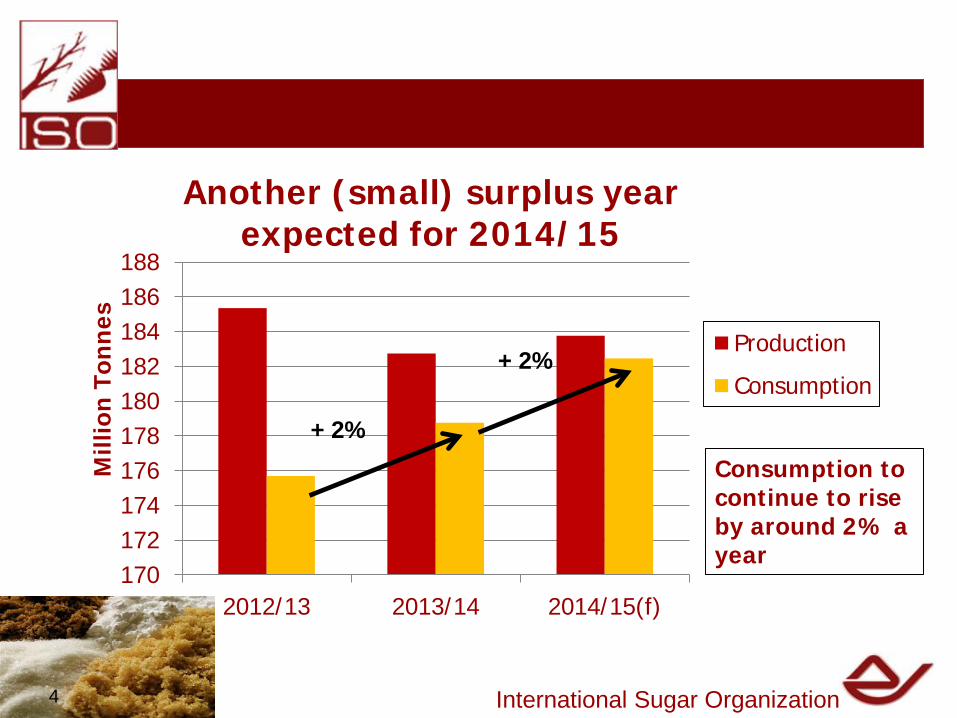
170172174176178180182184186188
2012/13 2013/14 2014/15(f)
Mill
ion
Tonn
es
Another (small) surplus year expected for 2014/15
Production
Consumption+ 2%
+ 2% Consumption to continue to rise by around 2% a year
4
International Sugar Organization
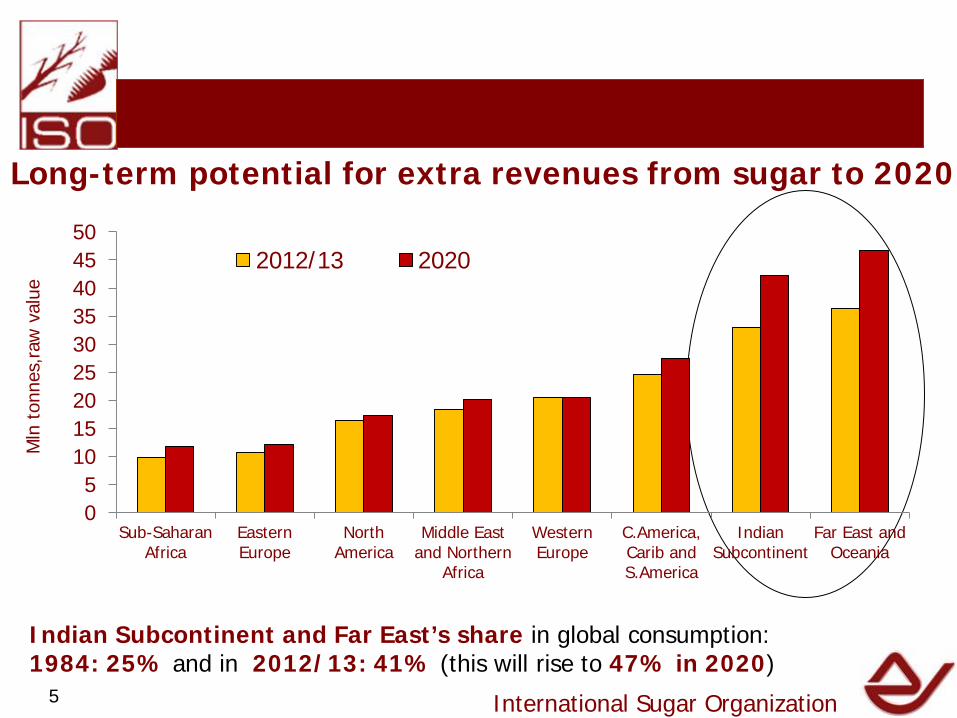
Long-term potential for extra revenues from sugar to 2020
Indian Subcontinent and Far East’s share in global consumption: 1984: 25% and in 2012/13: 41% (this will rise to 47% in 2020)
05
101520253035404550
Sub-SaharanAfrica
EasternEurope
NorthAmerica
Middle Eastand Northern
Africa
WesternEurope
C.America,Carib andS.America
IndianSubcontinent
Far East andOceania
Mln
ton
nes,
raw
val
ue 2012/13 2020
5

6 6
Brazil: Sugar and Ethanol to 2015/16 (Sugar in mln tonnes, tel quel; ethanol in bln litres)
April/ March
International Sugar Organization
Year Sugar Production
Sugar Exports
Ethanol Production
2010/2011 38.0 27.5 27.5
2011/2012 35.9 24.9 22.6
2012/2013 38.2 26.8 23.6
2013/2014 37.5 26.6 27.6
2014/2015 (f)
37.6 25.5 27.1
2015/2016 (f)
37.0 25.0 28.7
6
International Sugar Organization 7
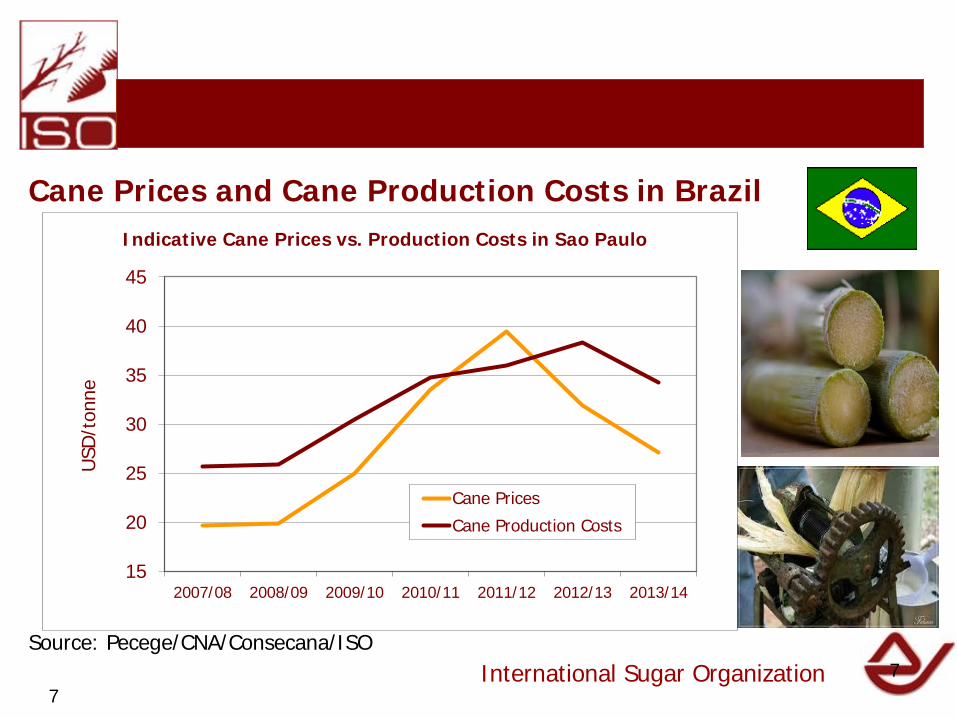
Cane Prices and Cane Production Costs in Brazil
Source: Pecege/CNA/Consecana/ISO
15
20
25
30
35
40
45
2007/08 2008/09 2009/10 2010/11 2011/12 2012/13 2013/14
USD
/ton
ne
Indicative Cane Prices vs. Production Costs in Sao Paulo
Cane Prices
Cane Production Costs
7

International Sugar Organization 8
Revenues from sugar are 40% lower than in 2011 – Ethanol revenues down only 15%
Source: ISO
05
1015202530354045
2007 2008 2009 2010 2011 2012 2013
Estimated Total Revenues from Sugar/Ethanol in Brazil, in Bln USD
Sugar
Ethanol
Total
8

International Sugar Organization
The Ethanol Market in 2014 and Beyond
9
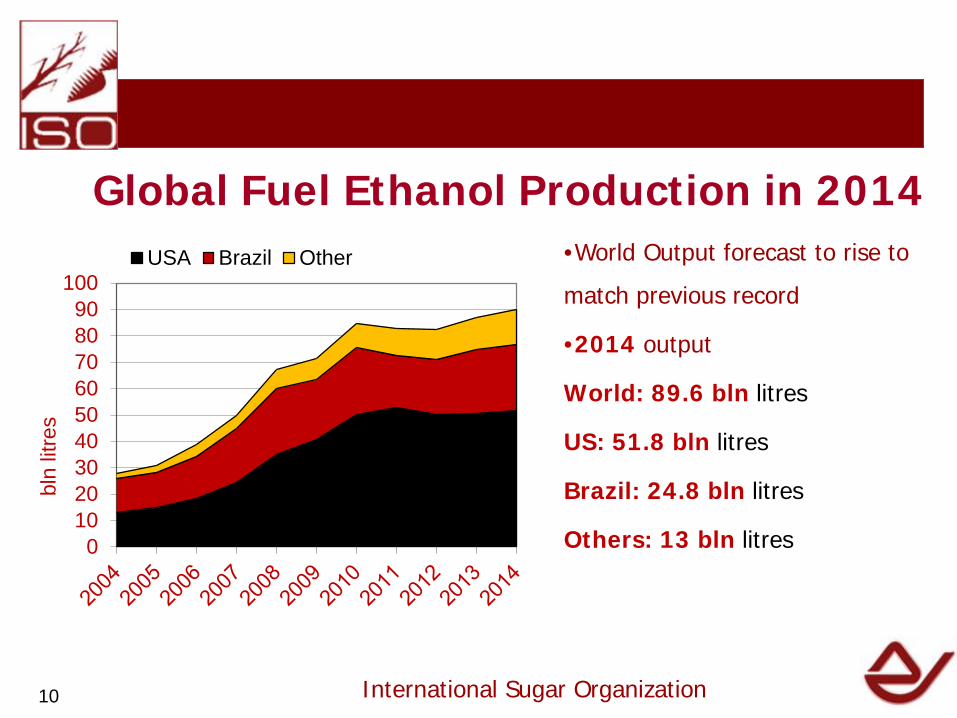
Global Fuel Ethanol Production in 2014
International Sugar Organization
•World Output forecast to rise to
match previous record
•2014 output
World: 89.6 bln litres
US: 51.8 bln litres
Brazil: 24.8 bln litres
Others: 13 bln litres 0102030405060708090
100
bln
litre
s
USA Brazil Other
10

Fuel Ethanol Production, outside USA and Brazil
International Sugar Organization
0500
1,0001,5002,0002,5003,0003,5004,0004,5005,000
EU China Canada Thailand India Australia Argentina Colombia
mln
litr
es 2010 2011 2012 2013e 2014f
Among other producers, EU already had record output in 2013; strong
growth for Thailand and Argentina in both 2013 and 2014.
11

In other countries: FDI and blend mandates should encourage ethanol output growth
Country Blend % Time
Argentina E5 2010
Peru, Uruguay E8 2011
Bolivia E10 2010
Canada E-5 2008
China E-5 2008
Colombia E-10 2008
Dominican Rep. E-7.5 authorised
Ethiopia E-5 2009
India E-10 In 17 of 25 states
Indonesia E-10 2009
Jamaica E-10 2009
Kenya E-10 Future date
Malaysia E-5 2010
Mexico E-5 2012
Paraguay E-25 2010
Philippines E-5 2009
Vietnam E-5 2009
International Sugar Organization 12

13 13
International Sugar Organization
Global Fuel Ethanol Demand to 2020
Top consumers of Fuel Ethanol United States – 75 bln litres (RFS2) Brazil 35 bln litres EU (28) 11 bln litres China - 8 bln litres Others 28 bln litres World Total – 157 bln litres – Up 80% from today’s level, in part counting on success of second generation ethanol demand in the US. 13

Brazil contraction affecting world trade in 2014 – more countries needed
(Mln Litres)
EU,100 US, 900
EU, 500
Canada, 1,000
Brazil, 300
Caribbean, 100
Thailand to Philippines, 100
Asia, 400
International Sugar Organization 14

International Sugar Organization
Bioplastics and Cogeneration
15
• Annual production capacity expected to rise from 1.4 mln tonnes in 2012 to 6.2 million tonnes by 2017.
• Production in the EU may require 1.2 mln tonnes of sugar by 2020.
• Some are less optimistic for demand growth, but here sustainability is key if marketed correctly by the industry.
Bioplastics
International Sugar Organization 16
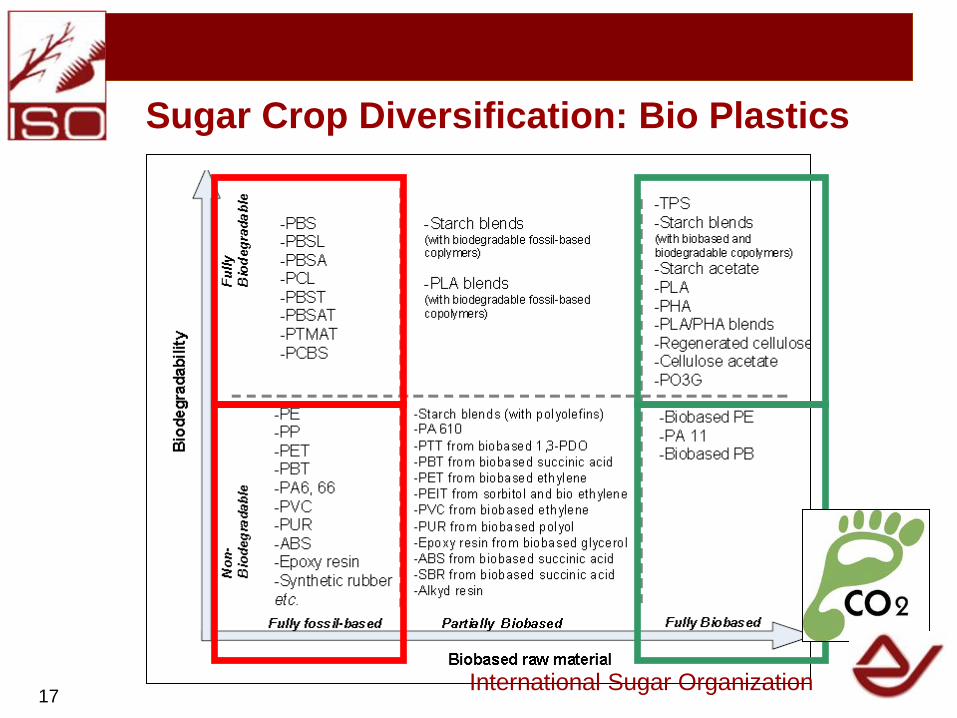
Sugar Crop Diversification: Bio Plastics
International Sugar Organization 17
18
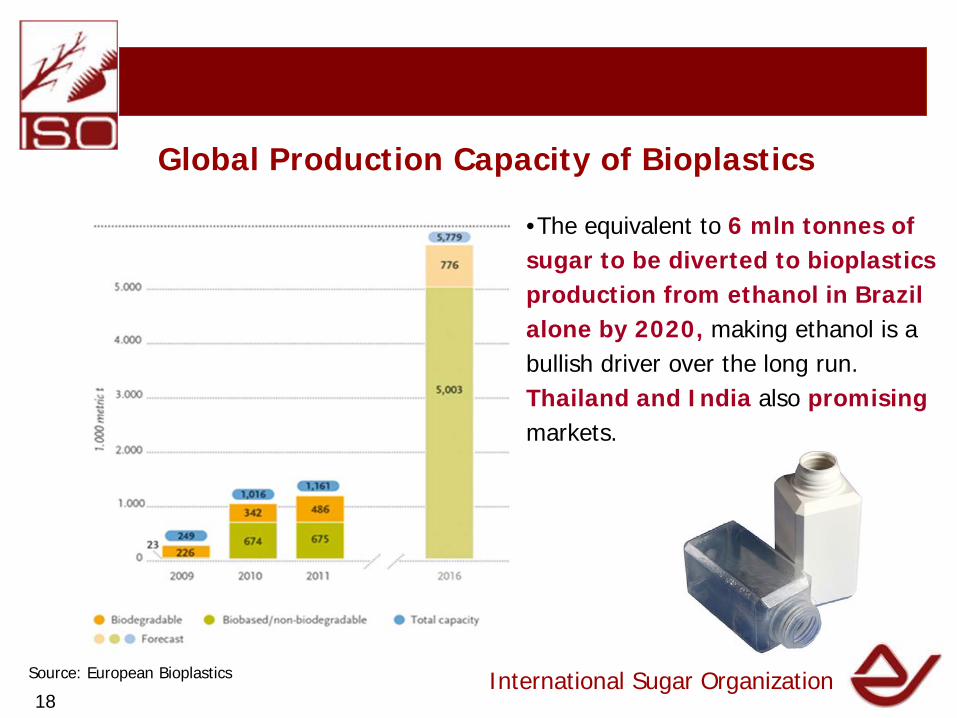
Global Production Capacity of Bioplastics
Source: European Bioplastics International Sugar Organization
•The equivalent to 6 mln tonnes of sugar to be diverted to bioplastics production from ethanol in Brazil alone by 2020, making ethanol is a bullish driver over the long run. Thailand and India also promising markets.
18

Cogeneration in Brazil
International Sugar Organization
0200400600800
1,0001,2001,4001,6001,8002,000
2005 2006 2007 2008 2009 2010 2011 2012 2013 2014
Electricity Exported to the Grid, Brazil, in average MW
10
60
110
160
210
260
310
360
2005 2006 2007 2008 2009 2010 2011 2012 2013
Spot Electricity Prices in Brazil as of end-May, in BRL/MWh
19
20
Brazil
India
Thailand
Cost Rica Guatemala
Mauritius
Réunion
El Salvador
Pakistan
Australia
Uganda Kenya Philippines
South Africa
Colombia
Swaziland
Mexico Vietnam
Honduras
Nicaragua
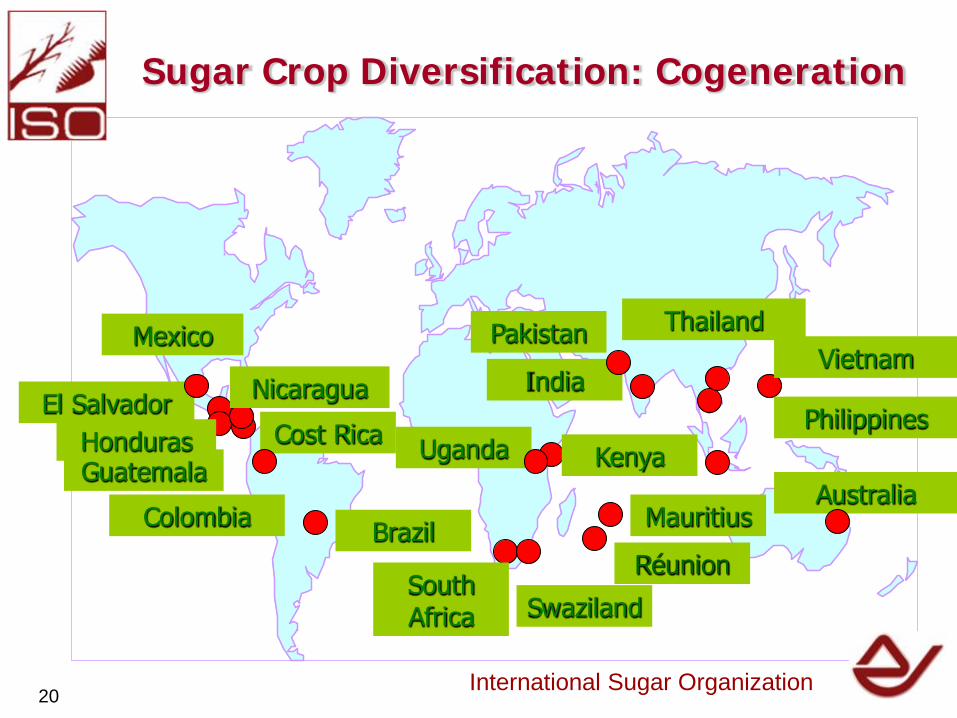
Sugar Crop Diversification: Cogeneration
International Sugar Organization 20

0 500 1000 1500 20001998-99
2000-01
2002-03
2004-05
2006-07
2008-09
2010-11
2012-13
Evolution of Sugar Mill Cogeneration with Bagasse
GWh
International Sugar Organization
Cogeneration in Guatemala
21

International Sugar Organization
Conclusions – Diversifying away from Sugar?
Small sugar surplus projected for 2014/15: 1) Higher output projected for India, EU, Russia and Ukraine; 2) But key producer Brazil facing shrinking revenues from sugar ; 3) Rapid consumption growth in Asia provides bullish outlook over the
longer-term.
In the meantime, countries should be focusing on alternative sources of revenue, like fuel ethanol, bioplastics and cane-bagasse cogeneration.
22
23
Conclusions – Ethanol, Bioplastics and Cogeneration
• World record output for fuel ethanol in 2014.
• The equivalent of 6 mln tonnes of sugar to be diverted to bioplastics production from ethanol in Brazil alone by 2020. Bullish for the Longer Term.
• World fuel ethanol demand/supply to grow by 80% to 157 bln litres by 2020.
• Record spot market electricity prices in Brazil providing an unmissable opportunity to cane bagasse cogeneration.
International Sugar Organization 23
Tuesday 25 - Wednesday 26 November 2014
23rd ISO Seminar
“Sugar and Ethanol: Fresh Options“
Canary Wharf, London.
www.isosugar.org
International Sugar Organization
Thank you!