culture, institutions and school achievement in brazil · culture, institutions and school...
TRANSCRIPT
Culture, Institutions and School Achievement in Brazil
Daniel A. F. Lopes, Geraldo A. Silva Filhoand Leonardo Monasterio *
Resumo
Este trabalho estima o impacto da cultura no desempenho acadêmico de estudantesbrasileiros em testes padronizados. A partir de dados com identificação por aluno, aplicamosum algoritmo de classificação de ancestralidade que atribui ao aluno, com base nos sobrenomesdos pais, um dos seguintes grupos: ibéricos, japoneses, italianos, germânicos, europeus doleste e sírio-libaneses. Mostramos que os alunos com ancestralidade europeia não-ibérica ejaponesa obtêm notas, na prova de Matemática da Avaliação Nacional da Alfabetização e naProva Brasil, estatística e substantivamente mais elevadas, mesmo com um amplo conjuntode controles individuais, familiares e municipais. Testamos ainda, por meio de proxies, ahipótese de persistência das instituições locais, influenciadas pela imigração em massa noBrasil no século XIX e XX, e mostramos que os mecanismos de transmissão familiar dacultura permanecem robustos para os alunos com ancestralidades japonesa ou italiana.
Palavras-chaves: avaliação educacional, imigração, cultura, ancestralidade.
Área Anpec: Área 12 - Economia Social e Demografia Econômica.
Jel codes: I2, F22
Abstract
This paper estimates the impact of culture on the academic performance of Brazilianstudents in standardized tests. Based on data with student identification, we apply an algo-rithm of surname classification that assigns the student, based on the surnames of his/herparents, to one of the following ancestry groups: Iberian, Japanese, Italian, Germanic, East-ern European and Syrian-Lebanese. We show that students with non-Iberian and JapaneseEuropean ancestry obtain statistically and substantively higher scores on 3rd and 5th gradestandard Math tests, even with a large set of individual, family and municipal controls. Wealso tested the hypothesis of persistence of local institutions, established during the era ofmass immigration in Brazil in the 19th and 20th centuries, and we showed that the mecha-nisms of family transmission of culture remain robust for students with Japanese and Italianancestry.
Keywords: educational evaluation, immigration, culture, ancestry.
*Lopes: Universidade Católica de Brasília (UCB); Silva Filho: Instituto Nacional de Estudos e PesquisasEducacionais Anísio Teixeira (INEP); Monasterio: Instituto de Pesquisa Econômica Aplicada (IPEA) and UCB.
2
1 IntroductionCan culture explain the diversity of societal outcomes as opposed to institutions and eco-
nomic factors? This paper follows the literature on cultural transmission and explores the im-portance of a distinct cultural trait transmitted from parents to children as an alternative andcomplementary source of persistence in educational outcomes across generations. Several studiesfind a persistent correlation between individual educational achievement and family socioeconomicbackground (BLACK; DEVEREUX; SALVANES, 2005; JR.; LEVITT, 2004; HERTZ et al., 2008).This research has found at most moderately-sized (and often zero) causal effects, suggesting thatmuch of the correlation between parents’ and children’s educational outcomes must be due toother family characteristics, including access to high quality schools (ROUSE; BARROW, 2006),or inherited abilities and traits (KRAPOHL et al., 2014).
We will be primarily interested in differences in culture which we define, for our purposes,as systematic differences in preferences and beliefs across either socially or spatially differentiatedgroups. Parents transmit to their children not only human capital, income, wealth, and genetictraits but also a specific set of cultural values (BISIN; VERDIER, 2000). Vertical transmissiondenotes transmission within the family – its intensity may be purposefully chosen by parents, andtends to induce persistence. Horizontal transmission refers to the mechanism through which valuesand beliefs are transmitted via social interactions with peers or with adults external to the family.
In this paper, we study the educational outcomes of higher than second-generation de-scendants1 of immigrants.These children, born and raised in Brazil, face the institutions but theypotentially differ in their cultural heritage as reflected in their ancestors’ country of origin. Themajor concern our analysis needs to address is how to separate the effects of culture from theeffects of strictly economic factors and institutions. To circumvent this problem we exploit thedifference in the “portability” of culture relative to economic and institutional conditions. Whenindividuals emigrate, they may take some aspects of their culture with them and transmit themintergenerationally, while living in the economic and formal institutional environment of the hostcountry.This suggests that studying immigrants or their descendants may be a useful strategy forisolating some aspects of culture. Relying on the experience of descendants of immigrants fromvarious countries of ancestry who live in the same country – in order to assess the effect of cultureon economic or other social outcomes – is often referred to as the epidemiological approach to theanalysis of culture.
Following Fernández & Fogli (2009), Figlio et al. (2016) and SØrensen et al. (2016), ouridentification strategy relies on the opportunity to observe children whose ancestors migrated toBrazil in the same location (same classroom), thus distinguishing between the cultural factorsfrom other institutional and economic factors. We explore the educational outcomes of higherthan second-generation Brazilian students in a dataset that contain individual-level administrativedata from the Instituto Nacional de Estudos e Pesquisas Educacionais Anísio Teixeira (INEP) on3rd and 5th graders. First, this paper presents the novel use of administrative data to study therelevance of cultural traits in explaining educational outcomes of descendants of immigrants in thevery long run. INEP data allow us to observe the entire population of public school students, andto control for classroom and school fixed effects and several socioeconomic characteristics. Second,we are able to follow these students over time during their primary education years, measuringnot only their educational achievement at one point in time, but also the change over time. Cross-1 Studying high-order generation immigrants rather than immigrants has the benefit of minimizing shocks to
“normal” behavior resulting from immigration (e.g., language barriers). On the other hand, the fact that they aresecond or higher-order generation descendants might weaken the strength of cultural effects on economic actionssince cultural transmission is restricted mostly to parents and ethnic social networks rather than operating insociety at large.
3
section comparisons can confound cultural transmission with unmeasured shared correlates betweenparents and children, but longitudinal data permit the opportunity to explore both levels andtrajectories of outcomes. To analyze the importance of culture, we link each student within groupsof countries based on her forebears’ country of origin.
Another main problem our analysis has to deal with is how to disentangle the effectsof culture from those of local institutions2. Immigrants might have influenced the design andevolution of local institutions, as suggested by Kreutz (2000). Hence, cultural transmission mightbe occurring horizontally. We explore data on colony settlement geographical distribution in RioGrande do Sul and São Paulo as instrument for local institutions. That is, if the human capital ofone’s ancestry group is an important input in the formation of one’s own human capital (as arguedby Borjas, Bronars & Trejo (1992), Borjas (1995), then systematic differences in human capitalacross ancestry groups may be responsible for our results.
2 Literature reviewOur paper speaks to three sets of literature. Besides being related to the literature on cul-
tural transmission (ALESINA; GIULIANO; NUNN, 2013; ALESINA; GIULIANO, 2015; ALGAN;CAHUC, 2010; GALOR; MOAV, 2002; GALOR; MICHALOPOULOS, 2012; GUISO; SAPIENZA;ZINGALES, 2006; NUNN; WANTCHEKON, 2011; SACERDOTE, 2005; TABELLINI, 2008;VOIGTLÄNDER; VOTH, 2012), our paper relates to the inter-generational mobility literatureand to the research on immigrants’ assimilation. Chetty, Hendren & Katz (2016) find that localconditions matter less for immigrants consistently with the conjecture that culture, rather thanneighborhood’s characteristics, can play an important role for immigrants. The literature on im-migrants has systematically identified an “advantage” of some immigrant groups but, as far aswe know, no paper has identified which cultural factors may be responsible for these findings inthe very long run (CARD; DINARDO; ESTES, 1998; ABRAMITZKY; BOUSTAN; ERIKSSON,2014).
This study also relates to the literature attempting to identify the long-term, slow-movingdeterminants of economic and social outcomes, and how they are shaped by endogenous processesand historical accidents (ENGERMAN; SOKOLOFF, 1997; ACEMOGLU; JOHNSON; ROBIN-SON, 2002; NUNN, 2008). It also relates to a growing literature on the historical determinantsof local institutions and economic performance in Brazil. Naritomi, Soares & Assunção (2012)study the colonial origins of institutions in Brazil looking back to the sugar-cane and gold cyclesof the seventeenth and eighteenth centuries. Musacchio, Martinez & Viarengo (2014) study thepolitical economy of education in Brazil during the period of increased decentralization of revenuesafter the proclamation of the Republic. Carvalho Filho & Colistete (2010) study the connectionsbetween the coffee cycle, European immigration of farm laborers and the establishment of publicinstruction institutions in the state of São Paulo. Rocha, Ferraz & Soares (forthcoming) also ana-lyzed the case of the colonies in São Paulo and found evidence suggesting the role of human capitalof immigrants in the long-term development of such areas. Carvalho Filho & Monasterio (2012)study the long run impact of state-sponsored settlements of European immigrants in SouthernBrazil finding evidence for cultural spillovers.2 Despite accounting for both vertical and horizontal transmissions of culture the issue of whether omitted variable
bias remains.
4
3 Data3.1 Ancestry: immigration, ancestry and surnames in Brazil
Since ancestry data are not directly available, we link school records using family names,henceforth surnames, to surname-ancestry identification algorithm proposed by Monasterio (2017).
Brazilian censuses and administrative data (such as School Census and Annual Social In-formation Report - Relação Anual de Informações Sociais, RAIS) do not record information onthe people’s ancestry. There are just five categories of color/race, namely, white (branco), mixed(pardo), black (preto), far-eastern (amarelo for the Chinese and Japanese) and native-Brazilian(i.e. Amerindians, índio). 3
INEP databases provide information on the color/race for students, but not for their par-ents. Furthermore, white (Iberian), mixed and black Brazilians do not have distinct surnames thatwould make it feasible to identify their ancestry based only by piece of information. Thereforewe had to focus this paper on the students identified as white, mixed and far-eastern as a way toovercome this limitation of the dataset.
3.1.1 Immigration to Brazil
Non-Iberian immigration to Brazil was promoted by the government when it became clearthat the days of legal slavery were counted. There were experiments of subsidized immigrationstarting on the first half of the 19th century, but the main flows were concentrated after theemancipation of slaves in 1888. Between 1872 and 1920 more than 3,2 million foreigners arrived inBrazil (LEVY, 1974). In 1920, 5.1% of the population were foreigners or naturalized. From thenon, Brazilian legislation and public policies closed the country to immigration. In 2010, just 0.3%of the population were born outside the Brazil.
Subsidized immigration was a positive human capital shock. Educational levels were reallylow in Brazil, even compared to other poor countries (CHAUDHARY et al., 2012). In 1920, only23% of Brazilian of all ages could read of write. In general, immigrants were not high qualifiedin their home countries, but their human capital endowments were probably higher than theBrazilians: 52% of foreigners were literate (DGE, 1929).
Were there differences in human capital or culture between immigrant groups? If so, howto measure these differences? We resort to method proposed by A’Hearn, Baten & Crayen (2009).It is based on a simple idea: individuals with low quantitative skills tend to round their ages innumbers ending in 5 or 0. Therefore the distribution of the last digit of age will be skewed in favorof these numbers in groups with low numeracy skills. The ABCC index is a measure of the degreeof the (inverse) of age heaping for groups. Its interpretation is straightforward: it varies from 0 to100 and the higher the value, the higher the numeracy of the group (CRAYEN; BATEN, 2010).
Stolz, Baten & Botelho (2013) have estimated ABCC for immigrants using data fromarrivals in Rio de Janeiro. Their estimates suggests that numeracy skills of non-Iberian Europeanimmigrants were much higher than the Brazilians. We follow the same method using data forindividuals born between 1860 and 1920 registered by the Hospedaria dos Imigrantes de São Paulo(São Paulo Immigrant Hostel). This data includes internal migrants in Brazil. The results areshown in the first column of Table 1. They result suggest that migrant Brazilians had a numeracylevel much lower than the foreign immigrants, even lower than the ones that came from Portugal3 See Piza & Rosemberg (1999) and Osório (2004) for discussions on color and race in the Brazilian official
surveys.
5
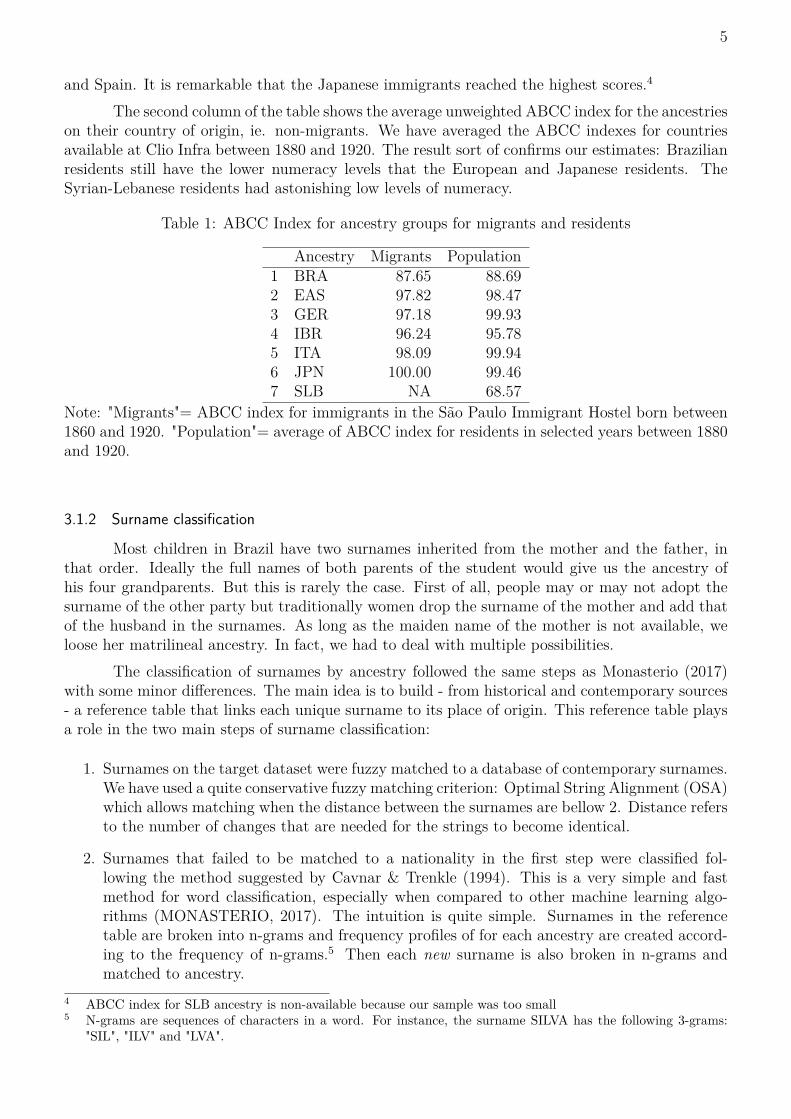
and Spain. It is remarkable that the Japanese immigrants reached the highest scores.4
The second column of the table shows the average unweighted ABCC index for the ancestrieson their country of origin, ie. non-migrants. We have averaged the ABCC indexes for countriesavailable at Clio Infra between 1880 and 1920. The result sort of confirms our estimates: Brazilianresidents still have the lower numeracy levels that the European and Japanese residents. TheSyrian-Lebanese residents had astonishing low levels of numeracy.
Table 1: ABCC Index for ancestry groups for migrants and residents
Ancestry Migrants Population1 BRA 87.65 88.692 EAS 97.82 98.473 GER 97.18 99.934 IBR 96.24 95.785 ITA 98.09 99.946 JPN 100.00 99.467 SLB NA 68.57
Note: "Migrants"= ABCC index for immigrants in the São Paulo Immigrant Hostel born between1860 and 1920. "Population"= average of ABCC index for residents in selected years between 1880and 1920.
3.1.2 Surname classification
Most children in Brazil have two surnames inherited from the mother and the father, inthat order. Ideally the full names of both parents of the student would give us the ancestry ofhis four grandparents. But this is rarely the case. First of all, people may or may not adopt thesurname of the other party but traditionally women drop the surname of the mother and add thatof the husband in the surnames. As long as the maiden name of the mother is not available, weloose her matrilineal ancestry. In fact, we had to deal with multiple possibilities.
The classification of surnames by ancestry followed the same steps as Monasterio (2017)with some minor differences. The main idea is to build - from historical and contemporary sources- a reference table that links each unique surname to its place of origin. This reference table playsa role in the two main steps of surname classification:
1. Surnames on the target dataset were fuzzy matched to a database of contemporary surnames.We have used a quite conservative fuzzy matching criterion: Optimal String Alignment (OSA)which allows matching when the distance between the surnames are bellow 2. Distance refersto the number of changes that are needed for the strings to become identical.
2. Surnames that failed to be matched to a nationality in the first step were classified fol-lowing the method suggested by Cavnar & Trenkle (1994). This is a very simple and fastmethod for word classification, especially when compared to other machine learning algo-rithms (MONASTERIO, 2017). The intuition is quite simple. Surnames in the referencetable are broken into n-grams and frequency profiles of for each ancestry are created accord-ing to the frequency of n-grams.5 Then each new surname is also broken in n-grams andmatched to ancestry.
4 ABCC index for SLB ancestry is non-available because our sample was too small5 N-grams are sequences of characters in a word. For instance, the surname SILVA has the following 3-grams:
"SIL", "ILV" and "LVA".
6
Our reference table has 74,608 unique surnames linked to the the following ancestries:Iberian (i.e. Portuguese and Spanish; IBR; 10,204 surnames); German (GER; 22,295); Italian(ITA; 26,153); Japanese (JPN; 5,359); Eastern European (EAS; 7,717); and Syrian-Lebanese (SLB;2,880)6. This covers the main ethnic groups that have arrived in Brazil during the age of migrations.
The 2013 Annual Social Information Report (Relação Anual de Informações Sociais), arestricted-access administrative file that contains 46.8 million observations of workers in the for-mal labor market, was our source of contemporary surnames. In RAIS there are 530,876 uniquesurnames. The ancestry algorithm of surname classification outlined above was then applied tothis dataset. Finally, these pairs of surnames-ancestry were merged to the surnames of the studentsand their parents in the INEP dataset.
3.2 EducationINEP administers the Brazilian national basic education evaluation system (known by its
Portuguese acronym, SAEB) that entails a biannual standardized proficiency test on Math andreading for students from the 3rd, 5th, and 9th grades7. All students from public schools that have atleast 10 students in the 3rd grade and 20 students in the 5th grade do the exams. For the 3rd graders,exams (ANA) are taken in only one discipline, Math or reading. Pupils are randomly assigned toMath or reading test. Meanwhile 5th graders take Prova Brasil exams of both disciplines. Thisexam data also includes contextual information obtained from 5th graders’ questionnaire, fromwhere we get students socioeconomic characteristics and some of theirs family rearing practices.Although ANA and Prova Brasil grades are not in the same proficiency scale, it is arguable thatthey are comparable since their contents are quite similar.
The ANA exam is the first nationwide standardized test taken by Brazilian public schoolsstudents, when they are at the end of the 3rd grade. According to the Brazilian School Census,in 2013, there were 2,758,968 students in the 3rd grade enrolled in public schools, correspondingto 84.2% of the total of all 3rd graders. Of these students, 1,131,566 took the Reading test, and1,127,076 the Math test, with 41.0% and 40.9% of coverage, respectively.
Despite the lack of a unified unique identification number for individuals in Brazil, since2008 every student enrolled in basic education has a unique identifying code for School Censusadministered by INEP8. Every school system has to inform yearly their students enrollment status.Consequently we managed to follow the cohort of students who were enrolled in the 3rd grade in2013 academic year back and forth, from daycare in 2008 or school entrance between 2008 and2011 to the 2015 academic year. The students who had progressed from the 3rd grade withoutrepetition or dropout reached the 5th grade in 2015.
Using the individual identifying number, we merged proficiency tests microdata with schoolcensus microdata at the individual level. From school censuses we get 3rd grade students’ surnames,6 Monasterio (2017) does not identify Syrian-Lebanese surnames.7 The national basic education evaluation system, SAEB (Sistema de Avaliação da Educação Básica), is composed
by three standardized proficiency tests: (i) the National School Performance Assessment (Anresc, also knownas Prova Brasil), taken by public schools 5th and 9th graders; (ii) the National Evaluation of Basic Education(Aneb) that includes a representative sample of private schools students and smaller public schools students fromthe 5th, 9th and 12th grades; and, more recently, (iii) the National Assessment of Literacy (Avaliação Nacionalda Alfabetização, ANA), taken by public schools 3rd graders. The exams are taken only in odd academic years.We get data from 2013 Avaliação Nacional da Alfabetização - ANA, the first edition of this exam, and 2015Prova Brasil.
8 INEP databases containing identification of individuals, including their parents and own names can be ob-tained through the Research Support Service (SAP). However, researchers have to work with data insideINEP dependencies. Further information on how to request access to the databases can be obtained athttp://portal.inep.gov.br/solicitacao-de-acesso
7
demographic characteristics, and schooling trajectory from their entrance into Brazilian schoolsystem, whether in daycare, kindergarten or 1st grade, to their 5th grade in the 2015 academic year.Since census data contains student’s birth place and municipality of residence in each academicyear, the longitudinal data allowed us to recover family geographical mobility history - it waspossible to gather information about whether the student lives where he was born and whetherone’s family moved to another municipality in the period of analysis and when (2008-2015).
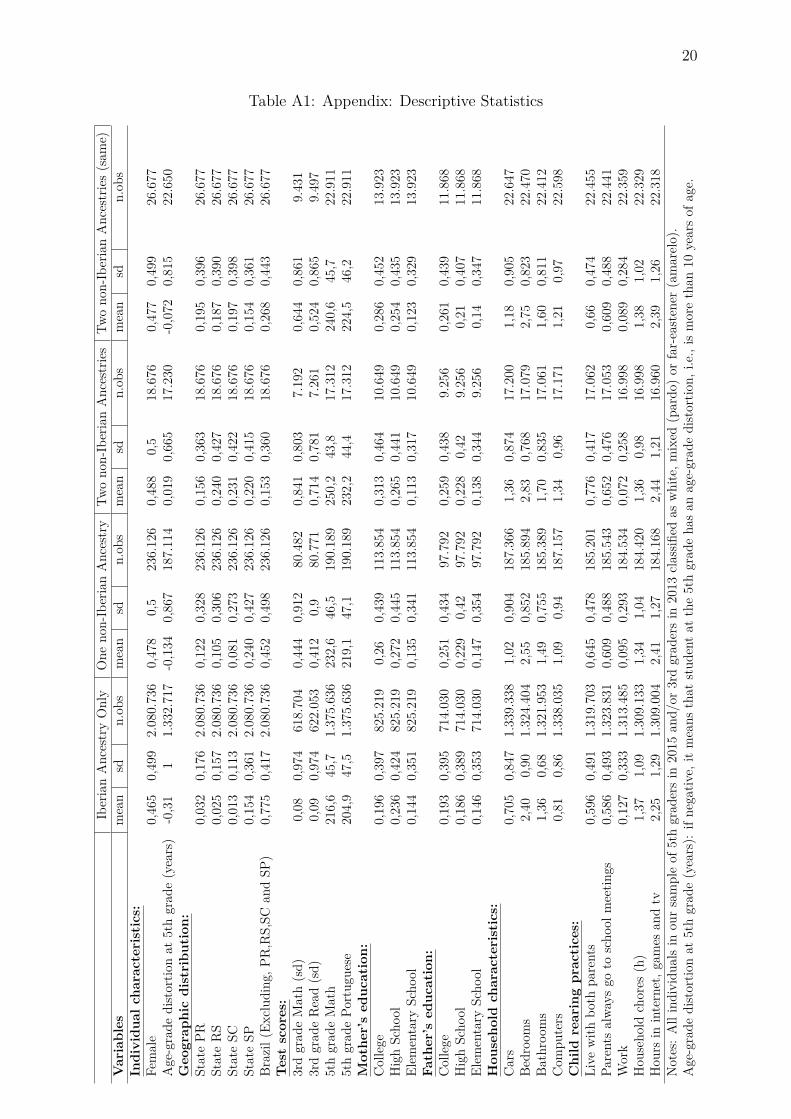
Considering the 3rd graders in 2013 who get to 5th grade in 2015, 2,115,542 students wereenrolled in public schools and, therefore, would be potential participants of ANA and Prova Brasilexams, our sources of information on school proficiency. In fact, 1,592,674 of these students tookthe 5th grade Math exam and 664,108 had also taken the 3rd grade Math exam, correspondingto our sample for the analysis of the gap in terms of gains in proficiency from the 3rd grade to5th grade between students from different ancestry. However, in order to avoid problems alreadymentioned in section 3.1 and to make the students of the sample more comparable among eachother we restricted the analysis to individuals who self-declared as white, mixed or far-eastern.Then these students were labeled according to their ancestry. The Appendix presents descriptivestatistics comparing four groups of students according to their ancestry status: (i) whether havingboth parents of Iberian ancestry; (ii) having just one of them of non-Iberian ancestry; (iii) havingboth parents of non-Iberian ancestry, but not the same ancestry; and (iv) having both parents ofthe same ancestry.
We study the following two different outcomes: 3rd graders test scores in mathematics and5th graders test scores in Mathematics. Studying test score growth is especially important becausetest score levels might reflect some omitted variable correlated with country-of-ancestry, but it isvery rare for students to dramatically change their relative position in the nationwide test scoredistribution between grades 3 and 5.
4 Empirical strategyAs discussed in the introduction, our empirical strategy is to isolate the effects of culture
from those of markets and institutions by studying the educational outcomes of children who weremostly born in, and reside in, Brazil, but whose ancestors were born in another country.
To investigate this hypothesis, we face several challenges, for details see Fernández & Fogli(2009), Guiso, Sapienza & Zingales (2006). First, if parents share a culture of high educationalattainment, they are likely to be highly educated and, thus, more likely to have high incomeand live in areas with better schools, therefore hindering our ability to distinguish between atransmission of cultural values and a direct effect of parental education or income. Therefore,controlling for school and classroom fixed effects, as well as individual characteristics and measuresof family income might help us track the direct effect of culture on education. We also controlfor local geographic variation in markets and institutions by including controls for municipalitycharacteristics and mobility controls - whether the student has moved from its place of origin in2013 or 2015, and we cluster observations at the classroom level.
As pointed out in Figlio et al. (2016) one may object from the outset that there is noreason to believe immigrants have the preferences/beliefs that are representative of the averagein their country of origin. This may or may not be true for different cultural attributes, but inany case, this factor will tend to bias the test of our hypothesis toward not finding any effect ofculture on education. More importantly, for our analysis to be meaningful, culture should evolverelatively slowly over the time period in which we are interested. Otherwise, in general, the beliefs
8
transmitted from parents to children would not be captured9.All our regressions contain a large set of controls, including demographics (gender and age-
grade distortion and special education needs), socioeconomic status SES (measured by indicatorvariables regarding availability of household goods and amenities, and parental education). Becausespecial education and family income are all potential consequences of parental cultural background,we investigate the degree to which our results are driven by the decision of whether or not to controlfor these variables. In our main specifications, we control for these variables.
4.1 Ancestry DummiesBefore starting our empirical analysis, we first examine whether there exist systematic dif-
ferences between each educational outcome and culture proxy. We turn to the more traditionalapproach by using country-of-ancestry dummies rather than the quantitative home country vari-ables as our cultural proxies. This has the benefit of not requiring the relationship between cultureand outcomes to be linear in the cultural proxy. Furthermore, it may allow different features ofculture to play a role in educational outcomes other than those captured past aggregate culturalproxies. It has, however, the drawback of not specifying how culture matters. We estimate thefollowing model:
𝑌𝑖𝑎𝑚 = 𝛼𝑍𝑎 + 𝛽𝑋𝑖 + 𝛾𝑔 + 𝜁𝑚 + 𝛿𝑐 + 𝜇𝑠 + 𝜔𝑝 + 𝜖𝑖𝑐 (1)
where 𝑌𝑖𝑎𝑚 is an outcome of interest for student i coming from ancestry a who resides inmunicipality m, and 𝑍𝑎 is our measure of proxy for culture measured at the country-of-ancestrylevel. 𝑋𝑖 are time invariant individual controls. Our specification also includes, a dummy indicatingwhether the student is considered a Mover, a continuous variable 𝛾𝑔 reflecting past performancein standardized Math tests, in the outcomes for which this is relevant, a full set of fixed effects tocontrol for specific differences in performance across different classrooms/schools. The standarderrors are clustered at the classroom level.
4.2 Variation to Culture ExposureA potential concern with the OLS estimates reported up to this point is that the culture
proxy, assigned based on a student’s father surname, could capture some omitted ancestry char-acteristics, in particular unobserved human capital. Following SØrensen et al. (2016) we exploitthe fact that students with parents whose ancestors originated from the same country receivevarying exposure to its culture. We compare students with one parent with non-Iberian ances-try, two parents with non-Iberian ancestries but not identical and two non-Iberian parents withidentical ancestries, and assume that the cultural impulse is larger with two non-Iberian parentssharing identical ancestries10. The identifying assumption is that the assignment of Iberians andnon-Iberians to one- and two non-Iberian couples is plausibly random, conditional on country ofancestry and parental characteristics. We then repeat the previous specification replacing 𝑍𝑎 by aset of dummies of culture exposure while keeping our controls unchanged.9 Some cultural traits may change faster (e.g eating habits) while other (e.g fertility decisions and living arrange-
ments) may evolve at a much slower pace10 It is still unclear why and how having parents sharing same set of values,norms and beliefs would, hypothetically,
render better outcomes. We aim to further investigate the interaction between ancestry and culture exposurein future research
9
4.3 Institutions and Horizontal Cultural TransmissionTransmission through family ties – ie. vertical transmission – is only one of the possibilities
that values and beliefs of individuals are passed to each other. Social interactions outside thenuclear family and institutions (in the broad sense) transmit culture as well. Immigration mayhave impacted not only the ancestry of Brazilians but also its local institutions and thereforeindividual test scores.
There is a vast literature on the long term impact of historical events (GUISO; SAPIENZA;ZINGALES, 2006; ALESINA; GIULIANO; NUNN, 2013; NUNN, 2008; TABELLINI, 2008; AL-GAN; CAHUC, 2010). According to this line of research, fortuitous or exogenous facts or decisionsshow their local impact in the very long term. In the Brazilian case, the initial location of thenewly arrived may have caused changes in local institutions that persisted and show up in testscores.
Carvalho Filho & Colistete (2010), Carvalho Filho & Monasterio (2012), and Rocha, Ferraz& Soares (forthcoming) study the long term impact of immigration to Brazil on contemporarydata. The first paper asserts that foreign-born immigrants caused an increase in the supply of localpublic instruction and this results in higher average test scores (and higher income per capita) atthe municipal level. The second paper focus on the long-term impact of subsidized immigrationto Rio Grande do Sul. Their results suggest that municipalities closer to official settlements havebetter socioeconomic outcomes in 2000. Finally, the third paper shows that in municipalities inSão Paulo that received state sponsored settlements still have higher levels of schooling and incomeper capita.
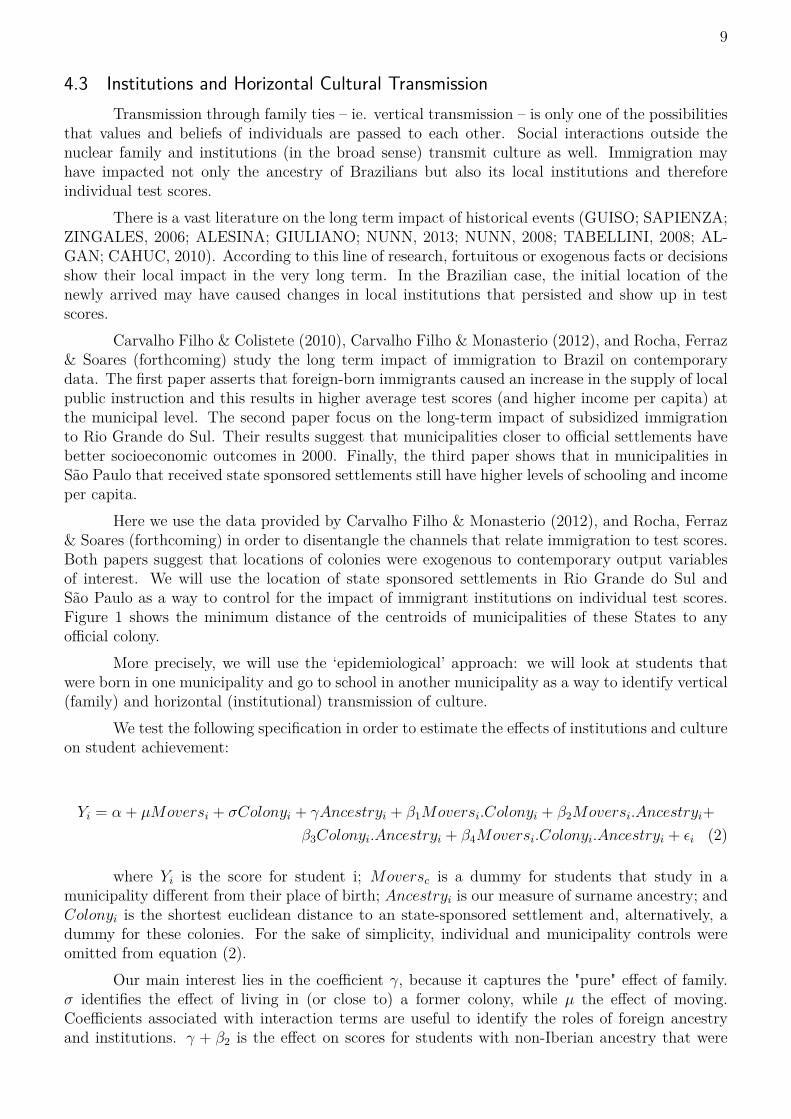
Here we use the data provided by Carvalho Filho & Monasterio (2012), and Rocha, Ferraz& Soares (forthcoming) in order to disentangle the channels that relate immigration to test scores.Both papers suggest that locations of colonies were exogenous to contemporary output variablesof interest. We will use the location of state sponsored settlements in Rio Grande do Sul andSão Paulo as a way to control for the impact of immigrant institutions on individual test scores.Figure 1 shows the minimum distance of the centroids of municipalities of these States to anyofficial colony.
More precisely, we will use the ‘epidemiological’ approach: we will look at students thatwere born in one municipality and go to school in another municipality as a way to identify vertical(family) and horizontal (institutional) transmission of culture.
We test the following specification in order to estimate the effects of institutions and cultureon student achievement:
𝑌𝑖 = 𝛼 + 𝜇𝑀𝑜𝑣𝑒𝑟𝑠𝑖 + 𝜎𝐶𝑜𝑙𝑜𝑛𝑦𝑖 + 𝛾𝐴𝑛𝑐𝑒𝑠𝑡𝑟𝑦𝑖 + 𝛽1𝑀𝑜𝑣𝑒𝑟𝑠𝑖.𝐶𝑜𝑙𝑜𝑛𝑦𝑖 + 𝛽2𝑀𝑜𝑣𝑒𝑟𝑠𝑖.𝐴𝑛𝑐𝑒𝑠𝑡𝑟𝑦𝑖+𝛽3𝐶𝑜𝑙𝑜𝑛𝑦𝑖.𝐴𝑛𝑐𝑒𝑠𝑡𝑟𝑦𝑖 + 𝛽4𝑀𝑜𝑣𝑒𝑟𝑠𝑖.𝐶𝑜𝑙𝑜𝑛𝑦𝑖.𝐴𝑛𝑐𝑒𝑠𝑡𝑟𝑦𝑖 + 𝜖𝑖 (2)
where 𝑌𝑖 is the score for student i; 𝑀𝑜𝑣𝑒𝑟𝑠𝑐 is a dummy for students that study in amunicipality different from their place of birth; 𝐴𝑛𝑐𝑒𝑠𝑡𝑟𝑦𝑖 is our measure of surname ancestry; and𝐶𝑜𝑙𝑜𝑛𝑦𝑖 is the shortest euclidean distance to an state-sponsored settlement and, alternatively, adummy for these colonies. For the sake of simplicity, individual and municipality controls wereomitted from equation (2).
Our main interest lies in the coefficient 𝛾, because it captures the "pure" effect of family.𝜎 identifies the effect of living in (or close to) a former colony, while 𝜇 the effect of moving.Coefficients associated with interaction terms are useful to identify the roles of foreign ancestryand institutions. 𝛾 + 𝛽2 is the effect on scores for students with non-Iberian ancestry that were
10
Figure 1: Minimum distance to official settlements in Rio Grande do Sul and São Paulo
Source: Carvalho Filho & Monasterio (2012) for Rio Grande do Sul; Rocha, Ferraz & Soares (forthcoming) for SãoPaulo Note: axes indicate latitude and longitude.
not born in a Colony but have moved. 𝛾 + 𝛽3 the impact for those who where born in a colonyand not moved. Finally, 𝛾 + 𝛽1 + 𝛽4 shows the effect on scores for those students with non-Iberianancestry that were born in a colony and have moved.
5 Results5.1 Individual Results
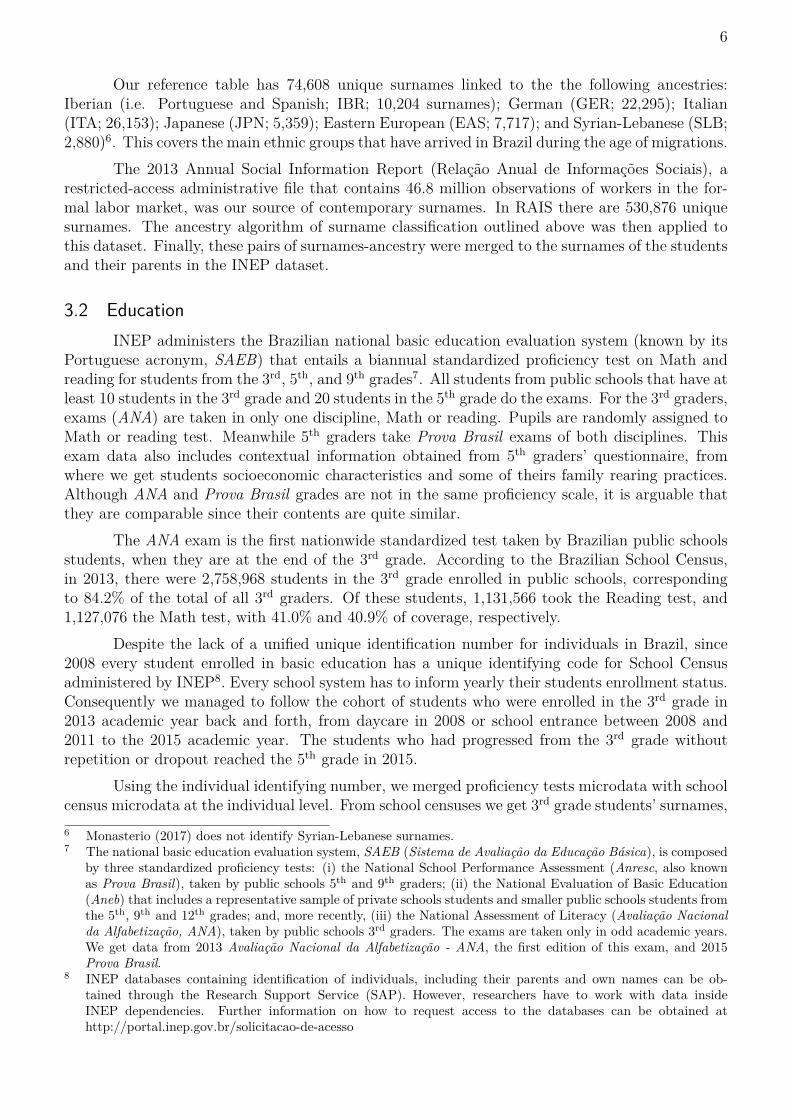
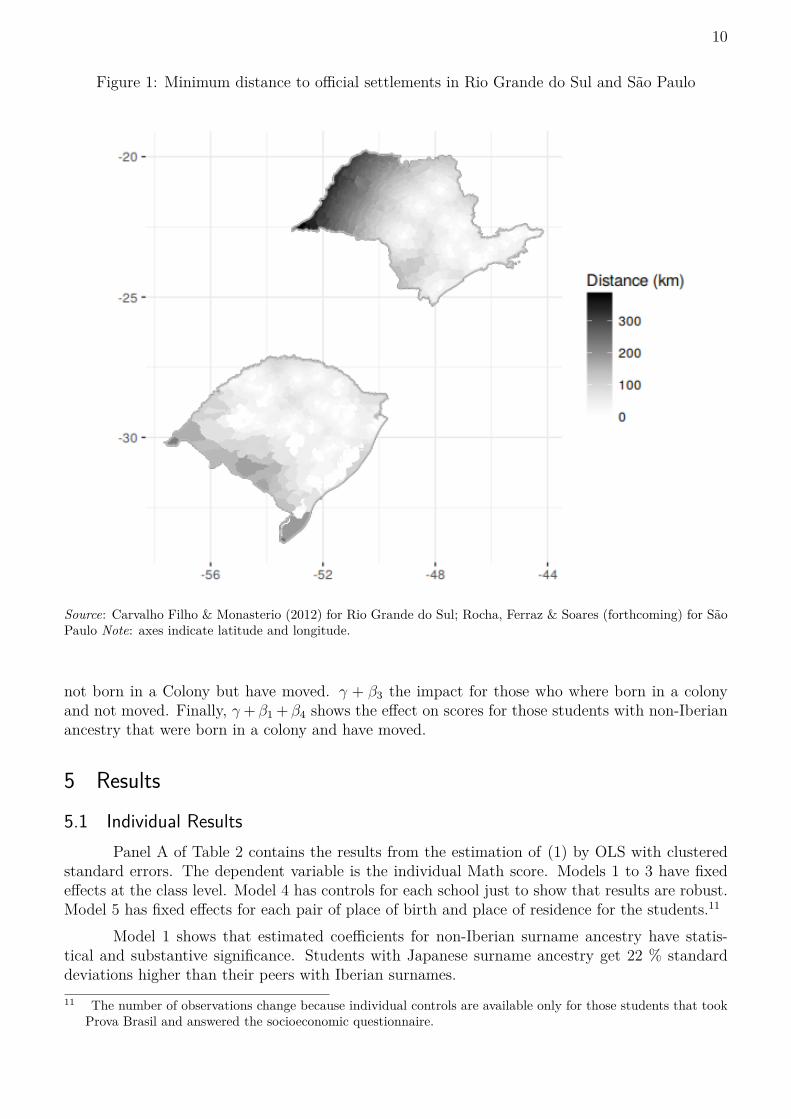
Panel A of Table 2 contains the results from the estimation of (1) by OLS with clusteredstandard errors. The dependent variable is the individual Math score. Models 1 to 3 have fixedeffects at the class level. Model 4 has controls for each school just to show that results are robust.Model 5 has fixed effects for each pair of place of birth and place of residence for the students.11
Model 1 shows that estimated coefficients for non-Iberian surname ancestry have statis-tical and substantive significance. Students with Japanese surname ancestry get 22 % standarddeviations higher than their peers with Iberian surnames.11 The number of observations change because individual controls are available only for those students that took
Prova Brasil and answered the socioeconomic questionnaire.
11
Table 2: 3rd and 5th graders Math scores and Student’s ancestry
Panel (A) Dependent Variable: 3rd Math test scoresStudent’s Ancestry (1) (2) (3) (4) (5)Japanese 0.216*** 0.171*** 0.159*** 0.160*** 0.198***
(0.0207) (0.0225) (0.0288) (0.0261) (0.0241)Germanic 0.157*** 0.102*** 0.101*** 0.102*** 0.102***
(0.00821) (0.00889) (0.0114) (0.0101) (0.00926)Italian 0.121*** 0.0791*** 0.0780*** 0.0791*** 0.0869***
(0.00541) (0.00591) (0.00750) (0.00669) (0.00616)Eastern European 0.146*** 0.101*** 0.0915*** 0.0902*** 0.101***
(0.0139) (0.0152) (0.0184) (0.0164) (0.0155)Syrian-Lebanese 0.0494*** 0.0160 0.0199 0.0158 0.00354
(0.0165) (0.0186) (0.0231) (0.0209) (0.0195)Constant 0.309*** 0.545*** 0.538*** 0.480*** 0.544***
(0.000887) (0.00250) (0.00319) (0.00260) (0.00349)Observations 274,176 197,527 196,973 318,231 197,527R-squared 0.356 0.370 0.371 0.256 0.278Panel (B) Dependent Variable: 5th graders Math test scoresANA 2013 Math scores 0.563*** 0.556*** 0.556*** 0.554*** 0.576***
(0.00244) (0.00251) (0.00251) (0.00184) (0.00276)Japanese 0.129*** 0.128*** 0.139*** 0.149*** 0.151***
(0.0164) (0.0165) (0.0222) (0.0200) (0.0176)Germanic 0.0568*** 0.0546*** 0.0567*** 0.0587*** 0.0583***
(0.00634) (0.00636) (0.00814) (0.00742) (0.00678)Italian 0.0428*** 0.0405*** 0.0353*** 0.0406*** 0.0439***
(0.00419) (0.00422) (0.00540) (0.00490) (0.00447)Eastern European 0.0467*** 0.0399*** 0.0407*** 0.0423*** 0.0407***
(0.0110) (0.0111) (0.0139) (0.0128) (0.0114)Syrian-Lebanese 0.0320** 0.0278** 0.0258 0.0281* 0.0280**
(0.0129) (0.0132) (0.0171) (0.0156) (0.0139)Constant -0.572*** -0.513*** -0.520*** -0.537*** -0.525***
(0.00140) (0.00223) (0.00267) (0.00211) (0.00297)Observations 229,314 222,792 222,161 345,711 222,670R-squared 0.562 0.564 0.564 0.512 0.539FE Class Class Class School O/RF test 0 0 0 0 0Individual controls Yes Yes Yes YesFamily SES Yes Yes Yes YesMunicipality controls Yes Yes YesMobility controls Yes YesRobust standard errors clustered at classroom level in parentheses.*** p<0.01, ** p<0.05, * p<0.1O/R: Pair Place of Origin/ Place of Residence Fixed Effects
12
As expected, the inclusion of controls for individual characteristics, family socioeconomicstatus and municipality controls 12 reduces the size of the coefficients; Syrian-Lebanese surnameslose statistical significance. We must stress the result in Model 5. We are comparing studentsthat not only share the same observable individual and family characteristics, but were born andstudy in the same pair of municipalities. Even in that full specification the coefficients for surnameancestry remain stable and significant.
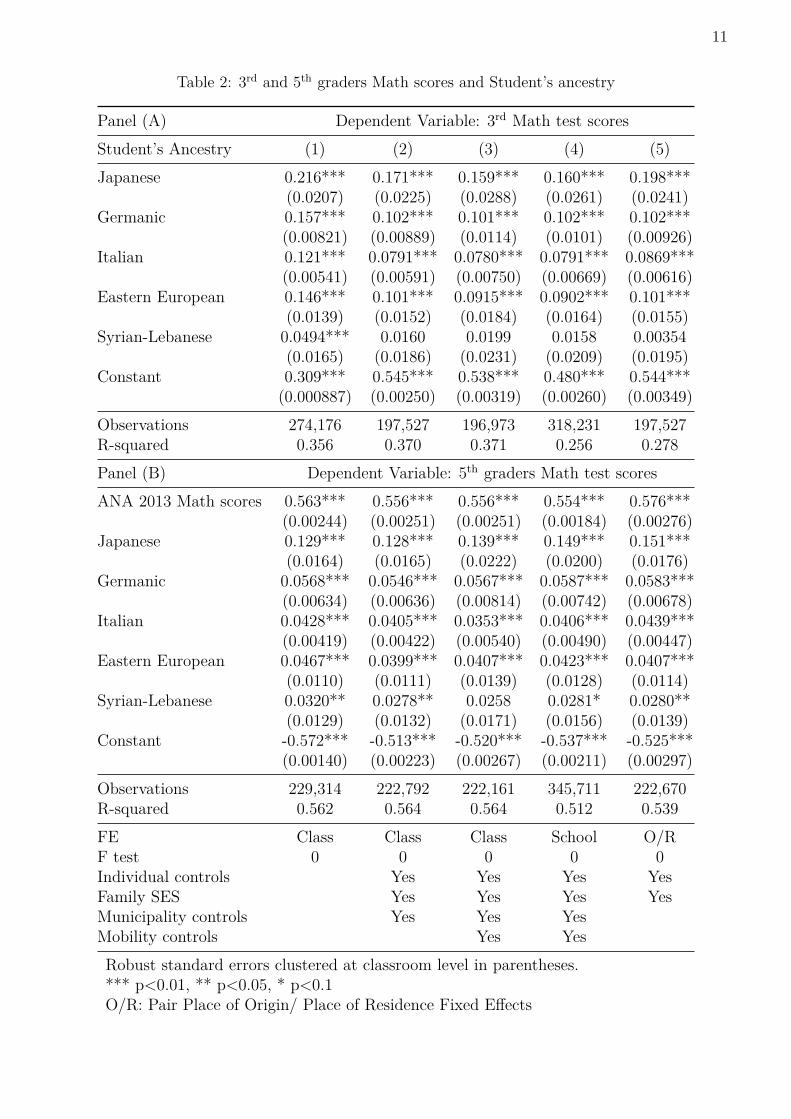
Models 1 to 5 in Panel B of 2 have the same controls of Panel A with two major differences:dependent variable is the 5th grader Math score and we are controlling for the Math score that thesame student got 2 year earlier (ANA 2013 Math score). Estimated coefficients associated withancestry variables retain the general pattern. Interestingly, coefficients associated with Germanic,Italian, and Eastern European ancestry have dropped. However coefficients for Japanese havegrown ever more and for Syrian-Lebanese have become statistically significant. The fact thatancestry dummies remain significant after the inclusion of past scores suggest that the effects ofancestry take a while to have full effect.
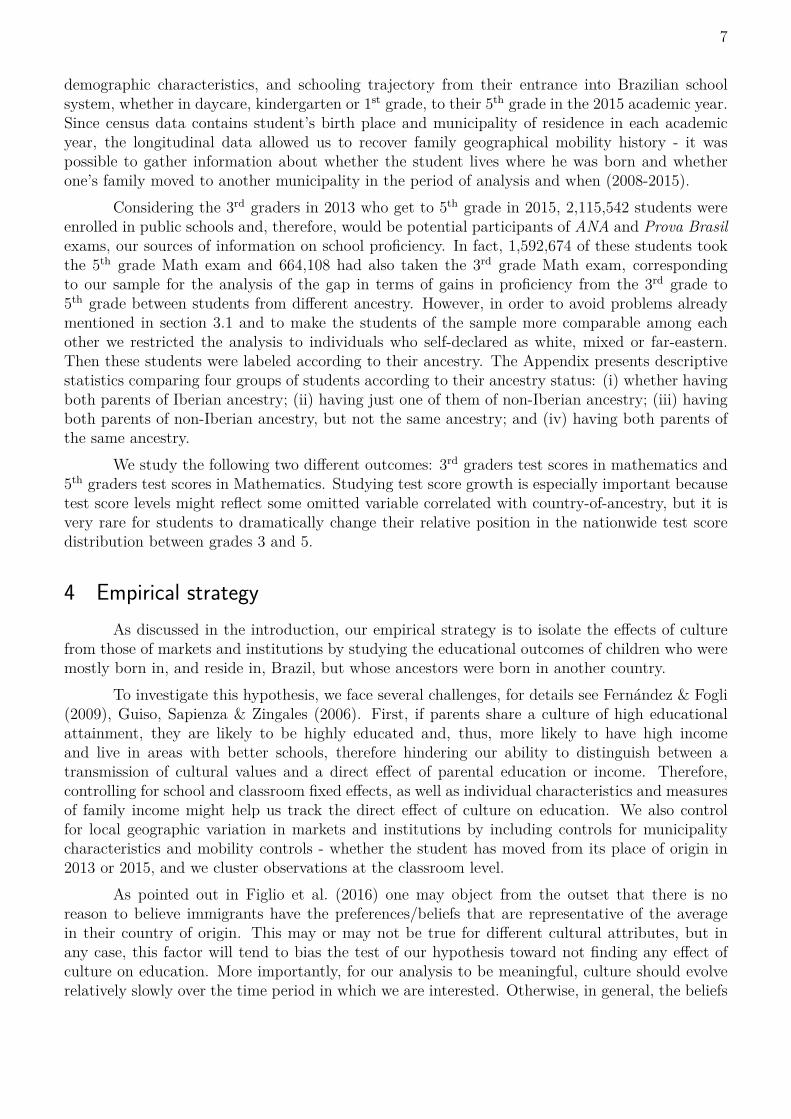
Table 3: 3rd and 5th graders Math scores and Student Variation in Culture Exposure
Panel (A) Dependent Variable: 3rd graders Math test scoresCulture Exposure (1) (2) (3) (4) (5)One Ancestry 0.104*** 0.0684*** 0.0668*** 0.0652*** 0.0818***
(0.00440) (0.00484) (0.00605) (0.00488) (0.00502)Two Ancestries (not same) 0.182*** 0.135*** 0.131*** 0.125*** 0.151***
(0.0100) (0.0110) (0.0136) (0.0120) (0.0111)Two Ancestries (same) 0.254*** 0.176*** 0.176*** 0.176*** 0.208***
(0.0114) (0.0123) (0.0157) (0.0140) (0.0125)Constant 0.313*** 0.545*** 0.538*** 0.484*** 0.541***
(0.00126) (0.00278) (0.00353) (0.00277) (0.00371)Observations 259,694 188,578 188,042 302,018 188,578R-squared 0.359 0.374 0.374 0.257 0.279Panel (B) Dependent Variable: 5th graders Math test scoresANA 2013 Math test scores 0.564*** 0.558*** 0.557*** 0.561*** 0.577***
(0.00250) (0.00257) (0.00258) (0.00246) (0.00282)One Ancestry 0.0412*** 0.0378*** 0.0303*** 0.0307*** 0.0435***
(0.00340) (0.00343) (0.00437) (0.00414) (0.00362)Two Ancestries (not same) 0.0773*** 0.0754*** 0.0773*** 0.0811*** 0.0848***
(0.00771) (0.00773) (0.00971) (0.00905) (0.00795)Two Ancestries (same) 0.102*** 0.0969*** 0.104*** 0.105*** 0.115***
(0.00871) (0.00873) (0.0111) (0.0103) (0.00895)Constant -0.574*** -0.515*** -0.522*** -0.524*** -0.528***
(0.00160) (0.00240) (0.00288) (0.00292) (0.00312)Observations 218,942 212,850 212,245 212,130 212,735R-squared 0.566 0.568 0.568 0.533 0.539FE Class Class Class School O/RF test 0 0 0 0 0Individual controls Yes Yes Yes YesFamily SES Yes Yes Yes YesMunicipality controls Yes Yes YesMobility controls Yes YesRobust standard errors in parentheses*** p<0.01, ** p<0.05, * p<0.1O/R: Pair Place of Origin/Place of Residence Fixed Effects
12 Municipality controls include the following set of variables: urban population, workforce, share of workers inthe formal sector, share of workers employed with and without regular employment, total population, incomeper capita, Theil and Gini indexes for income distribution.
13
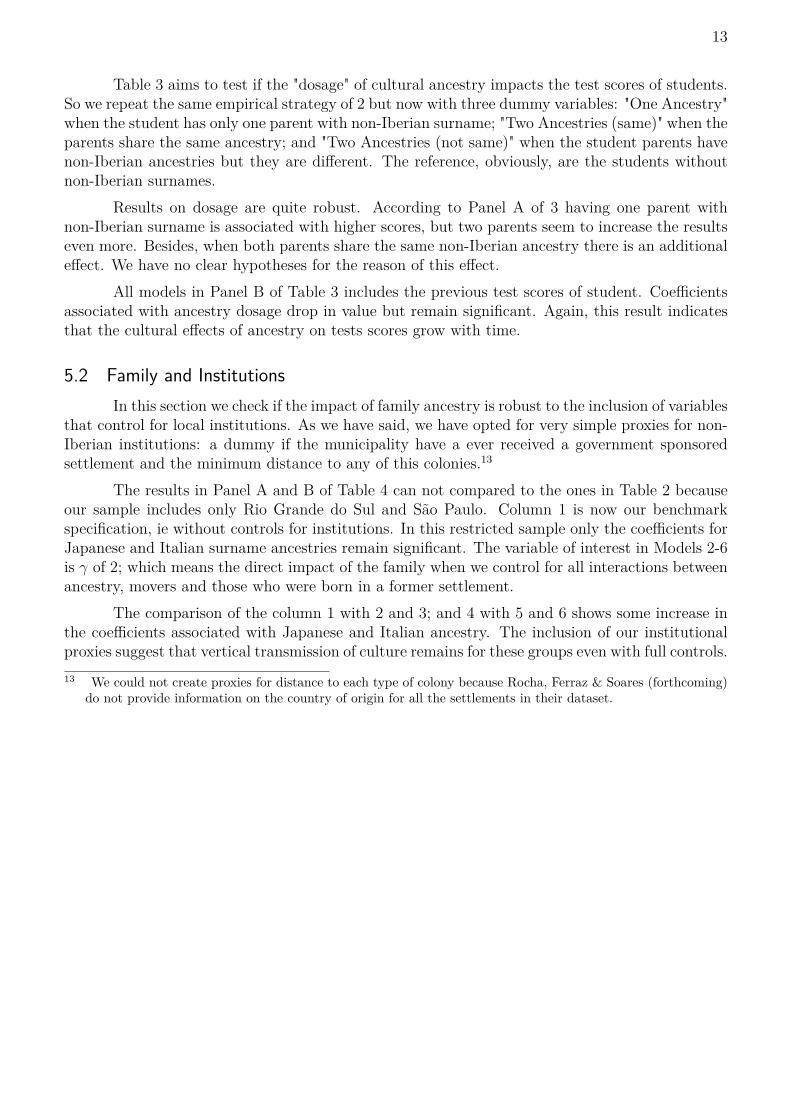
Table 3 aims to test if the "dosage" of cultural ancestry impacts the test scores of students.So we repeat the same empirical strategy of 2 but now with three dummy variables: "One Ancestry"when the student has only one parent with non-Iberian surname; "Two Ancestries (same)" when theparents share the same ancestry; and "Two Ancestries (not same)" when the student parents havenon-Iberian ancestries but they are different. The reference, obviously, are the students withoutnon-Iberian surnames.
Results on dosage are quite robust. According to Panel A of 3 having one parent withnon-Iberian surname is associated with higher scores, but two parents seem to increase the resultseven more. Besides, when both parents share the same non-Iberian ancestry there is an additionaleffect. We have no clear hypotheses for the reason of this effect.
All models in Panel B of Table 3 includes the previous test scores of student. Coefficientsassociated with ancestry dosage drop in value but remain significant. Again, this result indicatesthat the cultural effects of ancestry on tests scores grow with time.
5.2 Family and InstitutionsIn this section we check if the impact of family ancestry is robust to the inclusion of variables
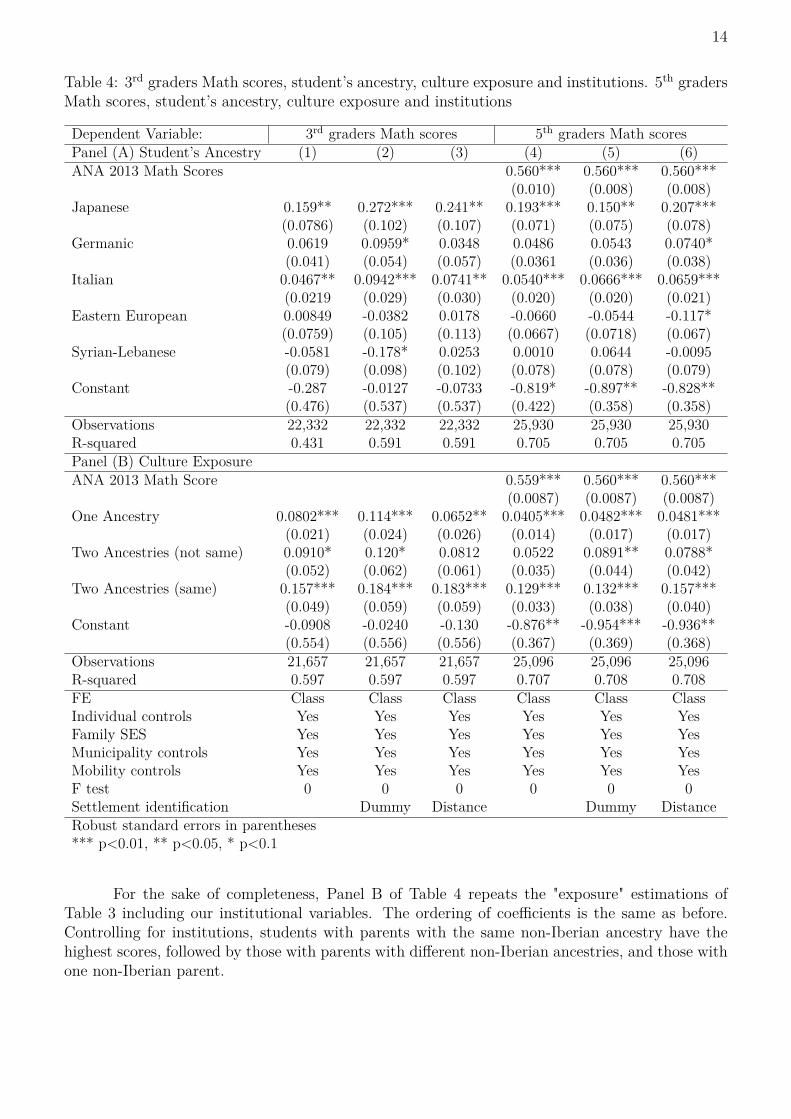
that control for local institutions. As we have said, we have opted for very simple proxies for non-Iberian institutions: a dummy if the municipality have a ever received a government sponsoredsettlement and the minimum distance to any of this colonies.13
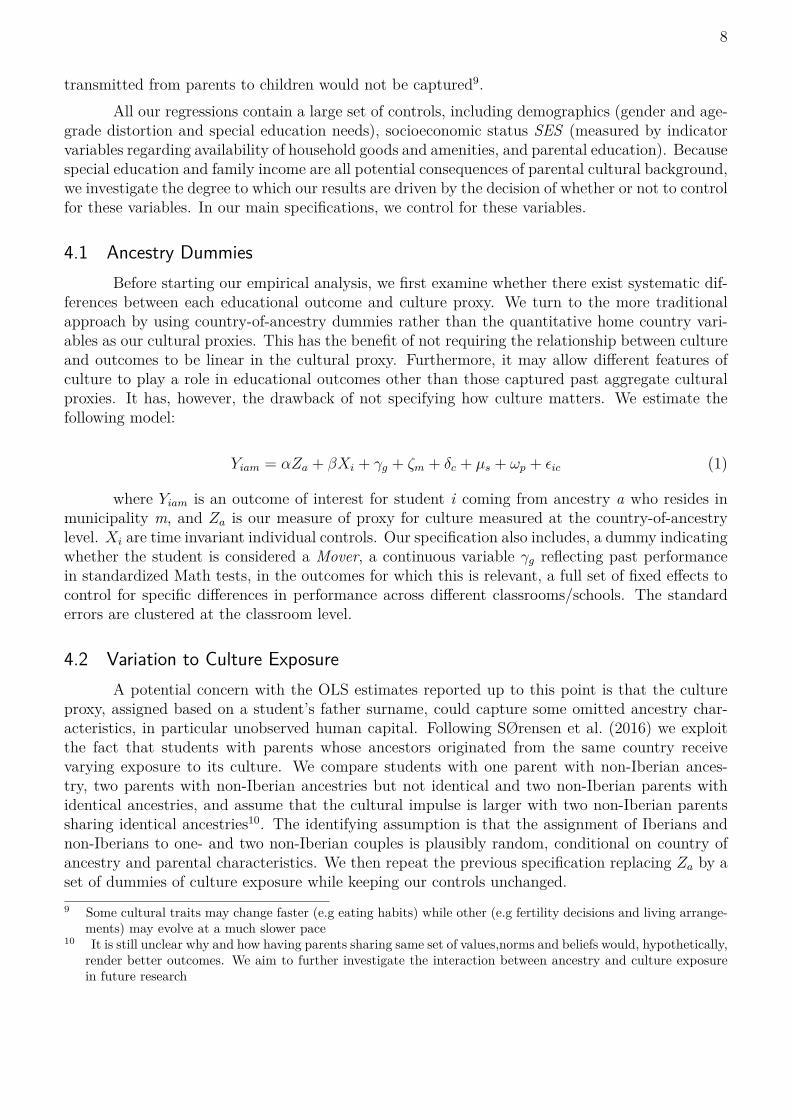
The results in Panel A and B of Table 4 can not compared to the ones in Table 2 becauseour sample includes only Rio Grande do Sul and São Paulo. Column 1 is now our benchmarkspecification, ie without controls for institutions. In this restricted sample only the coefficients forJapanese and Italian surname ancestries remain significant. The variable of interest in Models 2-6is 𝛾 of 2; which means the direct impact of the family when we control for all interactions betweenancestry, movers and those who were born in a former settlement.
The comparison of the column 1 with 2 and 3; and 4 with 5 and 6 shows some increase inthe coefficients associated with Japanese and Italian ancestry. The inclusion of our institutionalproxies suggest that vertical transmission of culture remains for these groups even with full controls.13 We could not create proxies for distance to each type of colony because Rocha, Ferraz & Soares (forthcoming)
do not provide information on the country of origin for all the settlements in their dataset.
14
Table 4: 3rd graders Math scores, student’s ancestry, culture exposure and institutions. 5th gradersMath scores, student’s ancestry, culture exposure and institutions
Dependent Variable: 3rd graders Math scores 5th graders Math scoresPanel (A) Student’s Ancestry (1) (2) (3) (4) (5) (6)ANA 2013 Math Scores 0.560*** 0.560*** 0.560***
(0.010) (0.008) (0.008)Japanese 0.159** 0.272*** 0.241** 0.193*** 0.150** 0.207***
(0.0786) (0.102) (0.107) (0.071) (0.075) (0.078)Germanic 0.0619 0.0959* 0.0348 0.0486 0.0543 0.0740*
(0.041) (0.054) (0.057) (0.0361 (0.036) (0.038)Italian 0.0467** 0.0942*** 0.0741** 0.0540*** 0.0666*** 0.0659***
(0.0219 (0.029) (0.030) (0.020) (0.020) (0.021)Eastern European 0.00849 -0.0382 0.0178 -0.0660 -0.0544 -0.117*
(0.0759) (0.105) (0.113) (0.0667) (0.0718) (0.067)Syrian-Lebanese -0.0581 -0.178* 0.0253 0.0010 0.0644 -0.0095
(0.079) (0.098) (0.102) (0.078) (0.078) (0.079)Constant -0.287 -0.0127 -0.0733 -0.819* -0.897** -0.828**
(0.476) (0.537) (0.537) (0.422) (0.358) (0.358)Observations 22,332 22,332 22,332 25,930 25,930 25,930R-squared 0.431 0.591 0.591 0.705 0.705 0.705Panel (B) Culture ExposureANA 2013 Math Score 0.559*** 0.560*** 0.560***
(0.0087) (0.0087) (0.0087)One Ancestry 0.0802*** 0.114*** 0.0652** 0.0405*** 0.0482*** 0.0481***
(0.021) (0.024) (0.026) (0.014) (0.017) (0.017)Two Ancestries (not same) 0.0910* 0.120* 0.0812 0.0522 0.0891** 0.0788*
(0.052) (0.062) (0.061) (0.035) (0.044) (0.042)Two Ancestries (same) 0.157*** 0.184*** 0.183*** 0.129*** 0.132*** 0.157***
(0.049) (0.059) (0.059) (0.033) (0.038) (0.040)Constant -0.0908 -0.0240 -0.130 -0.876** -0.954*** -0.936**
(0.554) (0.556) (0.556) (0.367) (0.369) (0.368)Observations 21,657 21,657 21,657 25,096 25,096 25,096R-squared 0.597 0.597 0.597 0.707 0.708 0.708FE Class Class Class Class Class ClassIndividual controls Yes Yes Yes Yes Yes YesFamily SES Yes Yes Yes Yes Yes YesMunicipality controls Yes Yes Yes Yes Yes YesMobility controls Yes Yes Yes Yes Yes YesF test 0 0 0 0 0 0Settlement identification Dummy Distance Dummy DistanceRobust standard errors in parentheses*** p<0.01, ** p<0.05, * p<0.1
For the sake of completeness, Panel B of Table 4 repeats the "exposure" estimations ofTable 3 including our institutional variables. The ordering of coefficients is the same as before.Controlling for institutions, students with parents with the same non-Iberian ancestry have thehighest scores, followed by those with parents with different non-Iberian ancestries, and those withone non-Iberian parent.
15
6 Final remarksThis paper sheds light on the role of culture in explaining the diversity of educational
outcomes among primary school students in Brazil. This is the first attempt, to our knowledge, ofusing individual-level data to study the impact of distinct cultural traits on academic achievement.Leveraging the capabilities of a surname-based matching algorithm we were able to identify theancestry of major immigrant groups that arrived in Brazil in the turn of the XIX century and thebeginning of the XX century.
In order to isolate the effect of culture from those of institutions and markets we follow twoavenues. First, we follow Fernández & Fogli (2009), Figlio et al. (2016), SØrensen et al. (2016)and use the epidemiological approach to study higher than second-generation Brazilians. Second,even though the epidemiological approach allow us to control for the Macro institutional setting,we explore the historical episode of mass migration to disentangle potential persistent effects ofculture from those of local institutions, in the lines of Tabellini (2008), Guiso, Sapienza & Zingales(2006) and control for colonial settlements and presence of movers in our data.
Our results suggests that there is an Ancestry premium in educational performance. Us-ing Iberian Brazilians as our reference group, we provide evidence that students bearing eithernon-Iberian europeans (Germanic, Italians, Eastern Europeans) or japanese ancestries achievesubstantially higher scores in Mathematics standardized test conducted at 3rd and 5rd grades. Notonly it seems to exist a gap, but as the students move up from 3rd and 5rd the gap gets wider.These results are robust to several specifications, including individual and family controls, as wellas municipality and mobility controls. It is noteworthy, that the results stands while using class-room fixed effects (i.e, controlling for teacher quality, classroom size and so forth). Implications interms of social inequality is therefore paramount.
To test the strength of our argument, we also proceed to control for potential interactionbetween ancestry and local institutions. Performing this analysis for the States which we havedata on exact location of colonial settlements we show that, students bearing either japanese oritalian ancestries seems to hold the effect of culture, implying a stronger vertical transmission ofpreferences and beliefs(ie. within family). On the other hand, Germanic and Eastern Europeansdescendents exhibit statistically insignificant coefficients for our culture proxy, which might suggestthat horizontal rather than vertical transmission is occurring.
Additionally, we explored the role of variation in culture exposure, regardless from whichancestry group the student belongs, and we found statistically significant results pointing to amonotonically increasing differential between those students with one foreign ancestry, two non-identical foreign and two identical ancestries.
We have been able to investigate whether culture matters for educational performance.Future research, might indicate How and Why it matters.It might be that parenting skills areimportant, discrimination or unobserved human capital are actually playing along with our cultureproxy. Moreover if there is gap between students, there is also a room for policy aiming to mitigatethis educational differential, that may impact income distribution and social mobility in the long-run.
16
Bibliography
ABRAMITZKY, R.; BOUSTAN, L. P.; ERIKSSON, K. A nation of immigrants: Assimilationand economic outcomes in the age of mass migration. Journal of Political Economy, v. 122, n. 3,p. 467–506, 2014. Disponível em: <https://doi.org/10.1086/675805>.
ACEMOGLU, D.; JOHNSON, S.; ROBINSON, J. A. Reversal of Fortune: Geography andInstitutions in the Making of the Modern World Income Distribution. The Quarterly Journal ofEconomics, v. 117, n. 4, p. 1231–1294, nov. 2002. ISSN 0033-5533, 1531-4650. Disponível em:<http://qje.oxfordjournals.org/content/117/4/1231>.
A’HEARN, B.; BATEN, J.; CRAYEN, D. Quantifying quantitative literacy: age heaping and thehistory of human capital. The Journal of Economic History, Cambridge University Press, v. 69,n. 3, p. 783–808, 2009.
ALESINA, A.; GIULIANO, P. Culture and institutions. Journal of Economic Literature, v. 53,n. 4, p. 898–944, December 2015. Disponível em: <http://www.aeaweb.org/articles?id=10.1257-/jel.53.4.898>.
ALESINA, A.; GIULIANO, P.; NUNN, N. On the origins of gender roles: Women and the plough*. The Quarterly Journal of Economics, v. 128, n. 2, p. 469–530, 2013. Disponível em: <+http://dx.doi.org/10.1093/qje/qjt005>.
ALGAN, Y.; CAHUC, P. Inherited trust and growth. American Economic Review, v. 100, n. 5,p. 2060–92, December 2010. Disponível em: <http://www.aeaweb.org/articles?id=10.1257/aer-.100.5.2060>.
BISIN, A.; VERDIER, T. “beyond the melting pot”: Cultural transmission, marriage, and theevolution of ethnic and religious traits*. The Quarterly Journal of Economics, v. 115, n. 3, p.955–988, 2000. Disponível em: <+ http://dx.doi.org/10.1162/003355300554953>.
BLACK, S. E.; DEVEREUX, P. J.; SALVANES, K. G. The more the merrier? the effect of familysize and birth order on children’s education*. The Quarterly Journal of Economics, v. 120, n. 2,p. 669–700, 2005. Disponível em: <+ http://dx.doi.org/10.1093/qje/120.2.669>.
BORJAS, G. J. Ethnicity, neighborhoods, and human-capital externalities. The AmericanEconomic Review, American Economic Association, v. 85, n. 3, p. 365–390, 1995. Disponível em:<http://www.jstor.org/stable/2118179>.
BORJAS, G. J.; BRONARS, S. G.; TREJO, S. J. Self-selection and internal migration in theunited states. Journal of Urban Economics, v. 32, n. 2, p. 159 – 185, 1992. ISSN 0094-1190.Disponível em: <http://www.sciencedirect.com/science/article/pii/0094119092900034>.
CARD, D.; DINARDO, J.; ESTES, E. The More Things Change: Immigrants and the Childrenof Immigrants in the 1940s, the 1970s, and the 1990s. [S.l.], 1998. (Working Paper Series, 6519).Disponível em: <http://www.nber.org/papers/w6519>.
CARVALHO FILHO, I. de; COLISTETE, R. P. MPRA Paper, Education Performance: WasIt All Determined 100 Years Ago? Evidence From São Paulo, Brazil. 2010. Disponível em:<https://mpra.ub.uni-muenchen.de/24494/>.
17
CARVALHO FILHO, I. de; MONASTERIO, L. Immigration and the origins of regional inequality:Government-sponsored European migration to southern Brazil before World War I. RegionalScience and Urban Economics, v. 42, n. 5, p. 794–807, 2012. ISSN 0166-0462. Disponível em:<http://www.sciencedirect.com/science/article/pii/S0166046211000962>.
CAVNAR, W. B.; TRENKLE, J. M. N-gram-based text categorization. Ann Arbor MI, v. 48113,n. 2, p. 161–175, 1994. Disponível em: <http://citeseerx.ist.psu.edu/viewdoc/download?doi=10-.1.1.21.324rep=rep1type=pdf>.
CHAUDHARY, L. et al. Big BRICs, weak foundations: The beginning of public elementaryeducation in Brazil, Russia, India, and China. Explorations in Economic History, Elsevier, v. 49,n. 2, p. 221–240, 2012.
CHETTY, R.; HENDREN, N.; KATZ, L. F. The effects of exposure to better neighborhoods onchildren: New evidence from the moving to opportunity experiment. American Economic Review,v. 106, n. 4, p. 855–902, April 2016. Disponível em: <http://www.aeaweb.org/articles?id=10-.1257/aer.20150572>.
CRAYEN, D.; BATEN, J. Global trends in numeracy 1820–1949 and its implications for long-termgrowth. Explorations in Economic History, Elsevier, v. 47, n. 1, p. 82–99, 2010.
DGE. Recenseamento do Brazil. Typ. da Estatística, 1929. Disponível em: <http://servicodados-.ibge.gov.br/Download/Download.ashx?http=1u=biblioteca.ibge.gov.br/visualizacao/livros-/liv31687.pdf>.
ENGERMAN, S.; SOKOLOFF, K. Factor endowments, institutions, and differential paths ofgrowth among new world economies: a view from economic historians of the United States. In:How Latin America Fell Behind. Stanford CA: Stanford University Press, 1997.
FERNÁNDEZ, R.; FOGLI, A. Culture: An empirical investigation of beliefs, work, and fertility.American Economic Journal: Macroeconomics, v. 1, n. 1, p. 146–77, January 2009. Disponívelem: <http://www.aeaweb.org/articles?id=10.1257/mac.1.1.146>.
FIGLIO, D. et al. Long-Term Orientation and Educational Performance. [S.l.], 2016. (WorkingPaper Series, 22541). Disponível em: <http://www.nber.org/papers/w22541>.
GALOR, O.; MICHALOPOULOS, S. Evolution and the growth process: Natural selectionof entrepreneurial traits. Journal of Economic Theory, v. 147, n. 2, p. 759 – 780, 2012. ISSN0022-0531. Issue in honor of David Cass. Disponível em: <http://www.sciencedirect.com/science-/article/pii/S0022053111000573>.
GALOR, O.; MOAV, O. Natural selection and the origin of economic growth*. TheQuarterly Journal of Economics, v. 117, n. 4, p. 1133–1191, 2002. Disponível em: <+http://dx.doi.org/10.1162/003355302320935007>.
GUISO, L.; SAPIENZA, P.; ZINGALES, L. Does culture affect economic outcomes? Journal ofEconomic Perspectives, v. 20, n. 2, p. 23–48, June 2006. Disponível em: <http://www.aeaweb-.org/articles?id=10.1257/jep.20.2.23>.
HERTZ, T. et al. The inheritance of educational inequality: International comparisons andfifty-year trends. The B.E. Journal of Economic Analysis & Policy, v. 7, n. 2, p. 1–48, 2008.Disponível em: <http://EconPapers.repec.org/RePEc:bpj:bejeap:v:7:y:2008:i:2:n:10>.
JR., R. G. F.; LEVITT, S. D. Understanding the black-white test score gap in the first two yearsof school. The Review of Economics and Statistics, v. 86, n. 2, p. 447–464, 2004. Disponível em:<http://dx.doi.org/10.1162/003465304323031049>.
18
KRAPOHL, E. et al. The high heritability of educational achievement reflects many geneticallyinfluenced traits, not just intelligence. Proceedings of the National Academy of Sciences, v. 111,n. 42, p. 15273–15278, 2014. Disponível em: <http://www.pnas.org/content/111/42/15273-.abstract>.
KREUTZ, L. A. Escolas comunitárias de imigrantes no Brasil: instÃde coordenaçÃeestruturas de apoio. Revista Brasileira de EducaçÃ, scielo, p. 159 – 176, 12 2000. ISSN1413-2478. Disponível em: <http://www.scielo.br/scielo.php?script=sci arttextpid=S1413-24782000000300010nrm=iso>.
LEVY, M. S. F. O papel da migração internacional na evolução da população brasileira (1872 a1972). Revista de Saúde Pública, SciELO Brasil, v. 8, n. supl., p. 49–90, 1974.
MONASTERIO, L. Surnames and ancestry in brazil. PloS ONE, Public Library of Science, v. 12,n. 5, p. e0176890, 2017.
MUSACCHIO, A.; MARTINEZ, A.; VIARENGO, M. Colonial Institutions, Commodity Booms,and the Diffusion of Elementary Education in Brazil, 1889-1930. [S.l.], 2014. (Working PaperSeries, 20029). Disponível em: <http://www.nber.org/papers/w20029>.
NARITOMI, J.; SOARES, R. R.; ASSUNçãO, J. J. Institutional Development and ColonialHeritage within Brazil. The Journal of Economic History, v. 72, n. 02, p. 393–422, 2012.
NUNN, N. The Long-Term Effects of Africa’s Slave Trades. Quarterly Journal of Economics,v. 123, n. 1, p. 139–176, 2008. Disponível em: <http://dash.harvard.edu/handle/1/3710252>.
NUNN, N.; WANTCHEKON, L. The slave trade and the origins of mistrust in africa.American Economic Review, v. 101, n. 7, p. 3221–52, December 2011. Disponível em:<http://www.aeaweb.org/articles?id=10.1257/aer.101.7.3221>.
OSÓRIO, R. G. O sistema classificatório de cor ou raça do IBGE. In: Joaze Bernardino; DanielaGaldino (Ed.). Levando a raça a sério: ação afirmativa e a universidade. Rio de Janeiro: LPP,UERJ„ 2004. p. 85–135.
PIZA, E.; ROSEMBERG, F. Cor nos censos brasileiros. Revista USP, v. 40, p. 122–137, 1999.
ROCHA, R.; FERRAZ, C.; SOARES, R. Human Capital Persistence and Development. AmericanEconomic Review: Applied Economics, forthcoming. Disponível em: <http://bibliotecadigital-.fgv.br/ocs/index.php/sbe/EBE10/paper/download/2328/1133>.
ROUSE, C. E.; BARROW, L. Us elementary and secondary schools: equalizing opportunityor replicating the status quo? The Future of Children, Woodrow Wilson School of Public andInternational Affairs at Princeton University and the Brookings Institution, p. 99–123, 2006.
SACERDOTE, B. Slavery and the intergenerational transmission of human capital. The Reviewof Economics and Statistics, v. 87, n. 2, p. 217–234, 2005. Disponível em: <http://dx.doi.org/10-.1162/0034653053970230>.
SØRENSEN, R. J. et al. Culture and school performance:Evidence from second generationimmigrants to Norway. [S.l.], 2016. Disponível em: <http://home.bi.no/fag89001/Culture.pdf>.
STOLZ, Y.; BATEN, J.; BOTELHO, T. Growth effects of nineteenth-century mass migrations:"Fome Zero" for Brazil? European Review of Economic History, Oxford University Press, v. 17,n. 1, p. 95–121, 2013.

TABELLINI, G. Presidential address institutions and culture. Journal of the European EconomicAssociation, Blackwell Publishing Ltd, v. 6, n. 2-3, p. 255–294, 2008. ISSN 1542-4774. Disponívelem: <http://dx.doi.org/10.1162/JEEA.2008.6.2-3.255>.
VOIGTLÄNDER, N.; VOTH, H.-J. Persecution perpetuated: The medieval origins of anti-semiticviolence in nazi germany*. The Quarterly Journal of Economics, v. 127, n. 3, p. 1339–1392, 2012.Disponível em: <+ http://dx.doi.org/10.1093/qje/qjs019>.
20
Table A1: Appendix: Descriptive StatisticsIb
eria
nA
nces
try
Onl
yO
neno
n-Ib
eria
nA
nces
try
Two
non-
Iber
ian
Anc
estr
ies
Two
non-
Iber
ian
Anc
estr
ies
(sam
e)V
aria
bles
mea
nsd
n.ob
sm
ean
sdn.
obs
mea
nsd
n.ob
sm
ean
sdn.
obs
Indi
vidu
alch
arac
teri
stic
s:Fe
mal
e0,
465
0,49
92.
080.
736
0,47
80,
523
6.12
60,
488
0,5
18.6
760,
477
0,49
926
.677
Age
-gra
dedi
stor
tion
at5t
hgr
ade
(yea
rs)
-0,3
11
1.33
2.71
7-0
,134
0,86
718
7.11
40,
019
0,66
517
.230
-0,0
720,
815
22.6
50G
eogr
aphi
cdi
stri
buti
on:
Stat
ePR
0,03
20,
176
2.08
0.73
60,
122
0,32
823
6.12
60,
156
0,36
318
.676
0,19
50,
396
26.6
77St
ate
RS
0,02
50,
157
2.08
0.73
60,
105
0,30
623
6.12
60,
240
0,42
718
.676
0,18
70,
390
26.6
77St
ate
SC0,
013
0,11
32.
080.
736
0,08
10,
273
236.
126
0,23
10,
422
18.6
760,
197
0,39
826
.677
Stat
eSP
0,15
40,
361
2.08
0.73
60,
240
0,42
723
6.12
60,
220
0,41
518
.676
0,15
40,
361
26.6
77Br
azil
(Exc
ludi
ng,P
R,R
S,SC
and
SP)
0,77
50,
417
2.08
0.73
60,
452
0,49
823
6.12
60,
153
0,36
018
.676
0,26
80,
443
26.6
77T
est
scor
es:
3rd
grad
eM
ath
(sd)
0,08
0,97
461
8.70
40,
444
0,91
280
.482
0,84
10,
803
7.19
20,
644
0,86
19.
431
3rd
grad
eR
ead
(sd)
0,09
0,97
462
2.05
30,
412
0,9
80.7
710,
714
0,78
17.
261
0,52
40,
865
9.49
75t
hgr
ade
Mat
h21
6,6
45,7
1.37
5.63
623
2,6
46,5
190.
189
250,
243
,817
.312
240,
645
,722
.911
5th
grad
ePo
rtug
uese
204,
947
,51.
375.
636
219,
147
,119
0.18
923
2,2
44,4
17.3
1222
4,5
46,2
22.9
11M
othe
r’s
educ
atio
n:C
olle
ge0,
196
0,39
782
5.21
90,
260,
439
113.
854
0,31
30,
464
10.6
490,
286
0,45
213
.923
Hig
hSc
hool
0,23
60,
424
825.
219
0,27
20,
445
113.
854
0,26
50,
441
10.6
490,
254
0,43
513
.923
Elem
enta
rySc
hool
0,14
40,
351
825.
219
0,13
50,
341
113.
854
0,11
30,
317
10.6
490,
123
0,32
913
.923
Fath
er’s
educ
atio
n:C
olle
ge0,
193
0,39
571
4.03
00,
251
0,43
497
.792
0,25
90,
438
9.25
60,
261
0,43
911
.868
Hig
hSc
hool
0,18
60,
389
714.
030
0,22
90,
4297
.792
0,22
80,
429.
256
0,21
0,40
711
.868
Elem
enta
rySc
hool
0,14
60,
353
714.
030
0,14
70,
354
97.7
920,
138
0,34
49.
256
0,14
0,34
711
.868
Hou
seho
ldch
arac
teri
stic
s:C
ars
0,70
50,
847
1.33
9.33
81,
020,
904
187.
366
1,36
0,87
417
.200
1,18
0,90
522
.647
Bedr
oom
s2,
400,
901.
324.
404
2,55
0,85
218
5.89
42,
830,
768
17.0
792,
750,
823
22.4
70Ba
thro
oms
1,36
0,68
1.32
1.95
31,
490,
755
185.
389
1,70
0,83
517
.061
1,60
0,81
122
.412
Com
pute
rs0,
810,
861.
338.
035
1,09
0,94
187.
157
1,34
0,96
17.1
711,
210,
9722
.598
Chi
ldre
arin
gpr
acti
ces:
Live
with
both
pare
nts
0,59
60,
491
1.31
9.70
30,
645
0,47
818
5.20
10,
776
0,41
717
.062
0,66
0,47
422
.455
Pare
nts
alwa
ysgo
tosc
hool
mee
tings
0,58
60,
493
1.32
3.83
10,
609
0,48
818
5.54
30,
652
0,47
617
.053
0,60
90,
488
22.4
41W
ork
0,12
70,
333
1.31
3.48
50,
095
0,29
318
4.53
40,
072
0,25
816
.998
0,08
90,
284
22.3
59H
ouse
hold
chor
es(h
)1,
371,
091.
309.
133
1,34
1,04
184.
420
1,36
0,98
16.9
981,
381,
0222
.329
Hou
rsin
inte
rnet
,gam
esan
dtv
2,25
1,29
1.30
9.00
42,
411,
2718
4.16
82,
441,
2116
.960
2,39
1,26
22.3
18N
otes
:A
llin
divi
dual
sin
our
sam
ple
of5t
hgr
ader
sin
2015
and/
or3r
dgr
ader
sin
2013
clas
sified
asw
hite
,mix
ed(p
ardo
)or
far-
east
ener
(am
arel
o).
Age
-gra
dedi
stor
tion
at5t
hgr
ade
(yea
rs):
ifne
gativ
e,it
mea
nsth
atst
uden
tat
the
5th
grad
eha
san
age-
grad
edi
stor
tion,
i.e.,
ism
ore
than
10ye
ars
ofag
e.