cultural biases in economic exchange? *
TRANSCRIPT

CULTURAL BIASES IN ECONOMIC EXCHANGE?∗
LUIGI GUISO
PAOLA SAPIENZA
LUIGI ZINGALES
How much do cultural biases affect economic exchange? We answer this ques-tion by using data on bilateral trust between European countries. We documentthat this trust is affected not only by the characteristics of the country beingtrusted, but also by cultural aspects of the match between trusting country andtrusted country, such as their history of conflicts and their religious, genetic, andsomatic similarities. We then find that lower bilateral trust leads to less trade be-tween two countries, less portfolio investment, and less direct investment, even af-ter controlling for the characteristics of the two countries. This effect is stronger forgoods that are more trust intensive. Our results suggest that perceptions rooted inculture are important (and generally omitted) determinants of economic exchange.
We always have been, we are, and I hope that we alwaysshall be detested in France.
Duke of Wellington
I. INTRODUCTION
There are remarkable differences in the level of trust amongEuropean managers. When asked to score fellow managers of dif-ferent countries on the basis of their trustworthiness their re-sponses implied the following ranking (where 1 is the best and 5the worst):1
∗We thank Giuseppe Nicoletti for providing the Organisation for EconomicCo-operation and Development data set, Michele Gambera for providing the Morn-ingstar portfolio data, and Roc Armenter for his excellent job as a research assis-tant. We also thank Franklin Allen, Marianne Baxter, Patricia Ledesma, MitchellPetersen, Andrei Shleifer, Rene Stulz, and Samuel Thompson for their very help-ful comments. We thank Jim Fearon and Romain Wacziarg for their help with themeasure of linguistic common roots. We benefited from the comments of partici-pants to seminars at the European University Institute, Wharton, NorthwesternUniversity, University of Chicago, University of Wisconsin, NBER Corporate Fi-nance, International Trade, and Behavioral Meetings and Peggy Eppink for edito-rial help. Luigi Guiso acknowledges financial support from MURST and the EEC.Paola Sapienza acknowledges financial support from the Center for InternationalEconomics and Development at Northwestern University. Luigi Zingales acknowl-edges financial support from the Center for Research on Security Prices and theStigler Center at the University of Chicago.
1. The survey was carried out by the 3i/Cranfield European Enterprise Centeron a total of 1,016 managers (managing companies under 500 employees) fromfive major European Community countries: Great Britain (433 responses), France(127), Germany (135), Italy (185), and Spain (136). See Burns, Myers, and Bailey(1993).C© 2009 by the President and Fellows of Harvard College and the Massachusetts Institute ofTechnology.The Quarterly Journal of Economics, August 2009
1095
at National D
ong Hw
a University L
ibrary on April 5, 2014
http://qje.oxfordjournals.org/D
ownloaded from

1096 QUARTERLY JOURNAL OF ECONOMICS
View Great Britain France Germany Italy Spain
British 1 4 2 5 3French 4 2 1 5 3German 2 3 1 5 4Italian 3 2 1 4 5Spanish 2 4 1 5 3
Among these managers there seem to be some common views:everyone ranks German managers relatively high and Italianones relatively low. There is also a “home-country bias”: man-agers trust their fellow countrymen more than what managersfrom other countries rank them. For instance, Italian managersrank themselves fourth in trustworthiness, while they are rankedfifth (last) by every other group. More surprising, there are somematch-specific attitudes. French managers rate British managersmuch lower than any other ones except the Italians, which seemsat odds with the ranking chosen by every other group. However,the British managers reciprocate this attitude (as the Duke ofWellington’s opening quote seems to suggest).
These facts are not peculiar to this data set. As we show,they are exactly replicated in an independent and broader survey(Eurobarometer). In this paper, we use this larger data set toexplain why the perception of trustworthiness differs so greatlyacross Europe. We also use it to explore the economic consequencesof these different perceptions.
To disentangle the country-specific components of trust fromthe match-specific ones we regress bilateral trust on fixed effectsfor the country receiving trust (country-of-destination fixed ef-fects) and fixed effects for the country trusting (country-of-originfixed effects). The country-of-destination fixed effects capture thecommon view about the trustworthiness of a country, which derivefrom the quality of the law and its enforcement. The country-of-origin fixed effects capture possible systematic differences in theway different populations answer the survey.
We then try to explain bilateral trust, after controlling for theabove fixed effects, with differences in information and culture.We find that geographical distance between two countries, theirproximity, and the commonality between the two languages havea significant effect on bilateral trust. By contrast, bilateral trustis negatively correlated with a country’s exposure in the domesticnewspapers of another country. Sharing the same legal origin (avariable that could proxy for both information and culture) has
at National D
ong Hw
a University L
ibrary on April 5, 2014
http://qje.oxfordjournals.org/D
ownloaded from

CULTURAL BIASES IN ECONOMIC EXCHANGE? 1097
a positive and significant effect on the level of trust, as long aswe do not control for the common linguistic root. Once we controlfor linguistic root, the commonality-of-law effect halves and be-comes insignificant, suggesting that most of the effect comes fromcultural commonalities.
As a first pure measure for a country’s cultural tradition, weuse commonality of religion. Religion had (and still has) a greatimpact on what is taught in school and how it is taught. Hence,we expect that two countries with the same religion tend to havesimilar cultures and therefore will trust each other more. Indeed,we find this to be the case. A pair of countries where 90% ofcitizens share the same religion (e.g., Italy and Spain) has a levelof bilateral trust one-quarter of a standard deviation higher.
To further measure cultural similarity between two popula-tions, we introduce two new variables. First is the genetic distancebetween two populations that—as Ammerman and Cavalli-Sforza(1985) claim—reflects the history of invasions during the Neo-lithic Age and thus their common linguistic and cultural roots. AsDeBruine (2002) has shown in an experiment, people trust peoplewho look like them more than those who do not. We find this to betrue also in our sample. A one-standard-deviation increase in ge-netic distance reduces the level of bilateral trust by 1.8 standarddeviations.
Second, we derive from Biasutti (1954) an indicator of so-matic distance, based on the average frequency of specific traits(hair color, height, etc.) present in the indigenous population.People trust other people who look like them more. A one-standard-deviation increase in somatic distance decreases trustby one-quarter of a standard deviation. When we use both theaforementioned variables, only the latter remains significant.
Finally, to capture the effect of more recent aspects of the cul-tural tradition, we use a country’s history of wars. People’s priorscan be affected by their education and in particular by the historythey study in school. For instance, Italian education emphasizesthe struggles that led to the reunification of the country in thenineteenth century. Because the major battles during this periodwere fought against Austria, Italian students may develop, as ourdata show, a negative image of Austrians. We find that countrieswith a long history of wars tend to trust each other less. Franceand England, which have a record 198 years of war (more thanten times the average of nineteen) should exhibit a bilateral trustthat is 0.7 of a standard deviation lower than average, which fully
at National D
ong Hw
a University L
ibrary on April 5, 2014
http://qje.oxfordjournals.org/D
ownloaded from

1098 QUARTERLY JOURNAL OF ECONOMICS
accounts for the lower bilateral trust we observe between the twocountries.
Once we establish the cultural roots of trust, we move tostudy the effect of trust on international trade and investments.Unlike Anderson and Marcouiller (2002), De Groot et al. (2004),Berkowitz, Moenius, and Pistor (2006), and Nunn (2007), wholook at the effect of country-level institutional variables (for eitherthe importing or the exporting country) on trade, we look at theeffect of a match-specific variable (bilateral trust) on trade andinvestments.
We find that a higher level of bilateral trust can explaincross-country trade beyond what extended gravity models can ac-count for, even after controlling for the better estimates of trans-portation costs suggested by Giuliano, Spilimbergo, and Tonon(2006). At sample means, a one-standard-deviation increase inthe importer’s trust toward the exporter raises exports by 10%.Consistent with a trust-based explanation, we find that trustmatters more for trade in goods that Rauch (1999) classifies asdifferentiated goods, which can vary greatly in quality.
We then instrument trust with its long-term cultural compo-nents (the commonality in religion and in ethnic origin) and obtainmuch larger coefficients. Despite the fact that we pass the test ofoveridentifying restrictions, this difference suggests that cultureis likely to affect trade through other channels besides trust.
We find similar results when we analyze the pattern of foreigndirect investments (FDI) and portfolio investments. A country ismore willing to invest in another (either directly or via the equitymarket) when it trusts the other country’s citizens more. Not onlydo the latter results confirm our trade ones, but they also suggestthat cultural effects are not limited to unsophisticated consumers,but are also present among sophisticated professionals such asmutual fund managers.
Our combined results suggest that cultural relationships af-fect trust and are an important omitted factor in internationaltrade and investments. In this respect, our paper is part ofa new strand of literature that looks at the effect of cultureon economic and political outcomes (Barro and McCleary 2003;Guiso, Sapienza, and Zingales 2003, 2004b, 2006, 2008a, 2008b;Fernandez and Fogli 2007; Giuliano 2007; and Tabellini 2007,2008).
Because genetically similar countries trust each other moreand thus can transfer technology faster and more effectively, our
at National D
ong Hw
a University L
ibrary on April 5, 2014
http://qje.oxfordjournals.org/D
ownloaded from

CULTURAL BIASES IN ECONOMIC EXCHANGE? 1099
results explain the correlation between level of development andgenetic distance found by Spolaore and Wacziarg (2009). Finally,our results are validated in a micro setting by Bottazzi, Da Rin,and Hellmann (2007), who find that that venture capitalists aremore likely to invest in start-ups of countries they trust more.
In our attempt to explain several international exchange puz-zles, our paper is similar to that of Portes and Rey (2005). How-ever, they do not consider trust as a key determinant, but insteadfocus on differences in information, measured as telephone traf-fic between two countries and the number of local foreign bankbranches.2
II. BILATERAL TRUST
We obtain our measures of trust from a set of surveys con-ducted by Eurobarometer and sponsored by the European Com-mission. The surveys were designed to measure public awarenessof, and attitudes toward, the Common Market and other Euro-pean Community institutions (see the Online Data Appendix fordetails). They were conducted on a representative sample of thetotal population of age sixteen (or fifteen depending on the wave)and older: about 1,000 individuals per country. The set of countriessampled varies over time with the enlargement of the EuropeanUnion: there were five in 1970 (France, Belgium, The Netherlands,Germany, and Italy), when the first survey was conducted, and ithad grown to seventeen in 1995, the last survey to which we haveaccess (besides the five countries above, Luxembourg, Denmark,Ireland, Great Britain, Northern Ireland, Greece, Spain, Portugal,Norway, Sweden, Finland, and Austria are also included).
One distinct feature of these surveys is that respondents wereasked to report how much they trust their fellow citizens andhow much they trust the citizens of each of the countries in theEuropean Union. More specifically, they were asked the following:
2. Our paper is also related to those of Vlachos (2004), Morse and Shive (2006),and Cohen (2009). Morse and Shive (2006) relate portfolio choices to the degree ofpatriotism of a country. Cohen (2009) shows that employees’ bias toward investingin their own company is not due to information, but to some form of loyalty towardtheir company, which can easily be interpreted as trust. Both of these papersthus illustrate one specific dimension in which cultural biases can affect economicchoices. Our paper can be seen as a generalization of Rauch and Trindade (2002).They find that the percentage of ethnic Chinese in a country helps predict the levelof trade beyond the standard specification. We show that this result is not specificto ethnic networks. Any cultural barrier (or lack thereof) significantly impactstrade and investments.
at National D
ong Hw
a University L
ibrary on April 5, 2014
http://qje.oxfordjournals.org/D
ownloaded from

1100 QUARTERLY JOURNAL OF ECONOMICS
“I would like to ask you a question about how much trust you havein people from various countries. For each, please tell me whetheryou have a lot of trust, some trust, not very much trust, or no trustat all.”
In some of the surveys, this same question was also asked withreference to citizens of a number of non–European Union coun-tries, including the United States, Russia, Switzerland, China,Japan, Turkey, and some Eastern and Central European countries(Bulgaria, Slovakia, Romania, Hungary, Poland, Slovenia, and theCzech Republic). To ensure a relative degree of homogeneity intrading-rule and living standards, we restrict our analysis to thecountries belonging to the European Economic Area (EEA): Euro-pean Union members plus Norway. These are also the countriesfor which we have both the trust from and to, thereby making thematrix quadratic.3
As in every survey, there may be some doubts about the waypeople interpret the trust question. First, there is some ambiguityon how to interpret it. In a trust game, the level of trust maps intothe amount of money you are willing to risk. Here, this mappingis missing. Second, we are concerned whether a high level of trustreflects a high trust in a generic citizen of a different country ora better ability to identify the trustworthy people in a differentcountry, which translates into a higher willingness to trust them.
To address these doubts, in a separate survey we asked asample of 1,990 individuals both the question above and the twofollowing ones: (i) “Suppose that a random person you do not knowpersonally receives by mistake a sum of 1,000 euros that belongto you. He or she is aware that the money belongs to you andknows your name and address. He or she can keep the moneywithout incurring in any punishment. According to you what isthe probability (a number between zero and 100) that he or shereturns the money?” and (ii) “How good are you (very good, good,not very good, not good at all) in detecting people who are trust-worthy?” (Guiso, Sapienza, and Zingales, 2008c). We find that thefirst question is highly statistically correlated with the measureof trust used in this paper, but the second one is not (the sign isactually negative, albeit not statistically significant). Hence, thesedata provide evidence that the reported level of trust reflects thesubjective probability that a random person is trustworthy.
3. In the NBER working paper version we also considered the full rectangularmatrix of trust.
at National D
ong Hw
a University L
ibrary on April 5, 2014
http://qje.oxfordjournals.org/D
ownloaded from

CULTURAL BIASES IN ECONOMIC EXCHANGE? 1101
There can also be doubts on the external validity of this ques-tion. Glaeser et al. (2000), for instance, raise doubts on the va-lidity of the World Values Survey (WVS) trust question (whichis similar to the one we use), by showing that it is not corre-lated with the sender behavior in the standard trust game (Berg,Dickhaut, and McCabe 1995). However, Sapienza, Toldra, andZingales (2007) argue that the sender’s behavior in the trustgame is not a good measure of trust, because it is affected byother regarding preferences. From the trust game we can de-rive a better indicator of trust: the sender’s expectation aboutthe receiver’s behavior. Sapienza, Toldra, and Zingales (2007)show that the WVS trust question as well as other similar trustquestions are strongly correlated with these expectations. Fur-thermore, in a sample of Dutch households, Guiso, Sapienza,and Zingales (2008c) find a correlation between the answer tothe WVS question on trust and the decision to invest in eq-uity. Thus, this survey-based measure does have some externalvalidity.
This WVS-type of question measures generalized trust, thetrust people have toward a random member of an identifiablegroup (e.g., Guiso, Sapienza, and Zingales [2004b]; McEvily et al.[2006]). This is different from personalized trust, the mutual trustpeople develop through repeated interactions (Greif 1993), whichis more important in relational contracts.
For our purposes, we first recoded the answers to the trustquestion, setting them to 1 (no trust at all), 2 (not very muchtrust), 3 (some trust), and 4 (a lot of trust). We then aggregatedresponses by country and year, computing the mean value of theresponses to each survey.
Table I shows the average level of trust that citizens from eachcountry have toward citizens of other countries. There is consid-erable variation in the level of trust exhibited from one country toanother. The average level of trust ranges from a minimum trustof 2.13 (the trust of Portuguese toward Austrians) to a maximumof 3.69 (the trust of Finns toward Finns).
Besides this variability, in Table I we find the same three reg-ularities found in the small survey presented in the Introduction.First, there are systematic differences in how much a given coun-try trusts and how much it is trusted by others (see the last rowand last column of Table I). For instance, Panel B shows that thePortuguese and the Greeks are those who trust the least and theSwedes those who trust the most.
at National D
ong Hw
a University L
ibrary on April 5, 2014
http://qje.oxfordjournals.org/D
ownloaded from

1102 QUARTERLY JOURNAL OF ECONOMICST
AB
LE
IT
HE
TR
US
TM
AT
RIX
Cou
ntr
ies
ofde
stin
atio
n
Cou
ntr
ies
ofor
igin
Au
sB
elU
KD
enN
LF
inF
raG
erG
reIr
eIt
aN
orP
orS
paS
we
Ave
rage
Au
stri
a3.
562.
952.
612.
952.
952.
942.
623.
092.
522.
552.
433.
002.
502.
583.
052.
82B
elgi
um
2.83
3.28
2.84
3.01
2.90
2.92
2.92
2.75
2.45
2.75
2.40
2.91
2.53
2.59
2.99
2.80
Un
ited
Kin
gdom
2.89
2.91
3.29
3.13
3.16
2.98
2.32
2.62
2.54
2.61
2.51
3.06
2.74
2.47
3.03
2.82
Den
mar
k3.
223.
183.
223.
393.
333.
202.
863.
122.
613.
022.
533.
502.
672.
663.
413.
06N
eth
erla
nds
2.90
3.18
3.00
3.29
3.28
3.25
2.72
2.84
2.59
2.80
2.35
3.30
2.74
2.64
3.34
2.95
Fin
lan
d3.
293.
073.
183.
303.
143.
692.
922.
892.
682.
922.
513.
482.
672.
613.
353.
05F
ran
ce2.
703.
072.
552.
962.
942.
913.
182.
742.
532.
722.
432.
972.
592.
682.
992.
80G
erm
any
2.98
2.84
2.69
2.97
2.90
2.85
2.85
3.50
2.51
2.59
2.36
2.92
2.48
2.66
2.99
2.81
Gre
ece
2.32
2.60
2.34
2.56
2.55
2.42
2.78
2.31
3.21
2.55
2.33
2.40
2.60
2.71
2.51
2.55
Irel
and
2.93
2.93
2.81
2.99
3.00
2.92
2.81
2.78
2.50
3.33
2.65
2.93
2.65
2.64
2.92
2.85
Ital
y2.
662.
642.
512.
702.
772.
782.
662.
632.
402.
372.
802.
782.
322.
642.
892.
64N
orw
ay—
3.18
3.27
3.53
3.26
—2.
932.
992.
523.
012.
65—
2.60
2.56
—2.
95P
ortu
gal
2.13
2.66
2.66
2.66
2.70
2.18
2.91
2.54
2.41
2.51
2.55
2.22
3.29
2.59
2.24
2.55
Spa
in2.
652.
732.
312.
732.
852.
712.
372.
662.
472.
572.
612.
792.
513.
322.
842.
67S
wed
en3.
533.
233.
433.
573.
333.
493.
043.
132.
883.
262.
813.
652.
972.
863.
593.
25
Ave
rage
2.90
2.96
2.85
3.05
3.00
2.95
2.79
2.84
2.59
2.77
2.53
2.99
2.66
2.68
3.01
Not
e.T
his
tabl
edi
spla
ysth
eav
erag
ele
velo
ftru
stfr
omci
tize
ns
ofco
un
try
ofor
igin
(row
s)to
citi
zen
sof
cou
ntr
yof
dest
inat
ion
(col
um
ns)
.Tru
stis
calc
ula
ted
byta
kin
gth
eav
erag
ere
spon
seto
the
foll
owin
gqu
esti
on:“
Iw
ould
like
toas
kyo
ua
ques
tion
abou
th
owm
uch
tru
styo
uh
ave
inpe
ople
from
vari
ous
cou
ntr
ies.
For
each
,ple
ase
tell
me
wh
eth
eryo
uh
ave
alo
tof
tru
st,s
ome
tru
st,n
otve
rym
uch
tru
st,o
rn
otr
ust
atal
l.”T
he
answ
ers
are
code
din
the
foll
owin
gw
ay:1
(no
tru
stat
all)
,2(n
otve
rym
uch
tru
st),
3(s
ome
tru
st),
4(a
lot
oftr
ust
).
at National D
ong Hw
a University L
ibrary on April 5, 2014
http://qje.oxfordjournals.org/D
ownloaded from

CULTURAL BIASES IN ECONOMIC EXCHANGE? 1103
To isolate these country-specific factors we run the followingregression:
(1) ¯Trusti jt = κi + λ j +n∑
t=1
γtYeart + εi jt,
where ¯Trusti jt is the trust of country i for country j in the surveydone at time t, κi a country-of-origin fixed effect, λ j a country-of-destination fixed effect, and Yeart calendar-year dummies. Be-cause we are interested in trust across different populations, wedrop all the observations when i = j.
In Figure I, we report the fixed effects of the country of ori-gin and the country of destination relative to Ireland (the actualestimates are reported in the Online Appendix). A Swedish cit-izen trusts others 17% more on average than an Irish citizenand 27% more than a Greek citizen. The least trusted popula-tion is the Italians (like in the introductory example), whereasthe most trusted ones are the Swedes. Interestingly, there is acorrelation between trusting and being trusted. Nordic countriesare at the top of the level of trustworthiness and tend to trustothers the most. Although not definitive proof, this fact suggeststhat people excessively apply the level of trustworthiness of theirown countrymen to people from other countries. This result is alsoconsistent with experimental evidence in Glaeser et al. (2000) andSapienza, Toldra, and Zingales (2007).
If all (or almost all) the variation in the data was explainedby the attitude that citizens of a country have toward trust (beingtrusted), there would be little hope for relative trust to be able toaffect the patterns of bilateral trade. However, country-of-originfixed effects and country-of-destination fixed effects explain only64% of the variability in trust. There remains a considerable por-tion to be explained with match-specific variables. The British,for instance, tend to trust the French even less than they trustthe Italians and the Spanish and much less than they trust theBelgians and the Dutch. The French reciprocate by trusting theBritish as much as they trust (little) the Greeks.
III. WHAT EXPLAINS BILATERAL DIFFERENCES IN TRUST?
In this section we try to explain bilateral trust with match-specific variables, after controlling for country fixed effects.To avoid understating the standard errors due to repeated
at National D
ong Hw
a University L
ibrary on April 5, 2014
http://qje.oxfordjournals.org/D
ownloaded from

1104 QUARTERLY JOURNAL OF ECONOMICS
FIGURE IFixed Effects of Country of Origin and Destination Relative to Ireland
at National D
ong Hw
a University L
ibrary on April 5, 2014
http://qje.oxfordjournals.org/D
ownloaded from

CULTURAL BIASES IN ECONOMIC EXCHANGE? 1105
observations, we follow Bertrand, Duflo, and Mullainathan (2004)and collapse the data by averaging over time the residuals of re-gressing trust on calendar-year dummies. Hence, our regressionwill be
(2) ¯Trusti j = κi + λ j + βXij + εi j,
where ¯Trusti j are the residuals of regressing trust on calendar-year dummies averaged over time and Xij are match-specific vari-ables that we describe soon.
III.A. Determinants of Bilateral Trust
Why should countries differ in their trust toward the samepopulation? One possibility is that these variations are just noiseand, as such, it should not be correlated with any possible deter-minants. Another possibility is that these variations arise fromdifferences in the information sets: more informed countries willhave a better estimate, whereas poorly informed ones will have aworse estimate. The alternative is that there might be some sortof bias, in either the perception or the behavior. The British mighthave a distorted view of French reliability or the French mightderive a special pleasure from breaching the trust of a Britishperson. For the moment, we are going to collapse both of these lat-ter explanations, which are difficult to separate, under the termof “cultural determinants,” but we will return to this later.
Proxies for Information. As measures of information, we usethe geographical distance between the two countries, their prox-imity, and the commonality between the two languages. The geo-graphical distance between two countries is the log of distance inkilometers between the major cities (usually the capital) of therespective countries.4 We also add a dummy variable to indicatewhen two countries share a common land border (Frankel, Stein,and Wei 1995). As a measure of language commonality, we usean indicator variable equal to 1 if two countries share the sameofficial language.5 We use the transportation cost estimates intro-duced by Giuliano, Spilimbergo, and Tonon (2006) as an additional
4. This measure is from Frankel, Stein, and Wei (1995). We also tried ourregressions with alternative measures of distance between two countries and theresults did not change substantially. Specifically, we used distance in radians ofthe unit circle between country centroids (Boisso and Ferrantino 1997) and thegreat circle between the largest cities (Fitzpatrick and Modlin 1986).
5. This variable is from Jon Haveman’s website: http://www.macalester.edu/research/economics/PAGE/HAVEMAN/Trade.Resources/TradeData.html.
at National D
ong Hw
a University L
ibrary on April 5, 2014
http://qje.oxfordjournals.org/D
ownloaded from

1106 QUARTERLY JOURNAL OF ECONOMICS
measure of distance. These transportation costs are measured us-ing shipping companies’ quotes collected from Import Export Wiz-ard (a shipping company providing transportation quotes aroundthe world).6
To measure the level of information the citizens of one countryhave about citizens of another, we follow Portes and Rey (2005)and collect the number of times the country toward which trustis expressed appears in the headlines of a major newspaper inthe country that expresses the trust. In Factiva, we searched thenewspaper with the highest circulation for each country. For eachpair of countries i and j, we recorded the number of articles in thenewspaper of country i that mentioned country j or its citizens inthe headline. We divided this number by the number of total newsstories on foreign countries.7
In addition to these measures, we use the La Porta et al.(1998) classification of legal origin and construct a dummy vari-able equal to 1 when the legal system of two countries is derivedfrom the same legal family (i.e., French, German, Scandinavian,English). Commonality in legal origin may in principle reflect thefact that citizens of countries having similar legal systems trusteach other more because there is less fear of the unknown. Thelegal tradition is likely to be very highly correlated with a commonheritage and other cultural variables. Thus, controlling for com-mon legal origin, we underestimate the potential effect of culturein biasing the perception of trustworthiness.
Proxies for Culture. The first proxy for culture is an indicatorof religious similarity equal to the empirical probability that tworandomly chosen individuals in two countries will share the samereligion. We obtain this measure by taking the product of the frac-tion of individuals in country j and in country i who have religionk and then we sum across all religions k (k = Catholic, Protestant,Jewish, Muslim, Hindu, Buddhist, Orthodox, no religion, otheraffiliation). To calculate this variable we use the percentage ofpeople belonging to each religious denomination from the WVS(see Guiso, Sapienza, and Zingales [2003]).
Although religious differences are rooted in past history, thishistory is relatively recent (300–400 years) and could reflect some
6. http://www.importexportwizard.com. Specifically, we use the cost in U.S.dollars of transporting 1,000 kg of unspecified freight type load (including machin-ery, chemicals, etc.) with no special handling required, using the optimal combi-nation of going through land and water to transport the goods.
7. In Factiva, we were unable to locate any newspaper from Greece andFinland. Hence, when we use press coverage the size of sample drops.
at National D
ong Hw
a University L
ibrary on April 5, 2014
http://qje.oxfordjournals.org/D
ownloaded from

CULTURAL BIASES IN ECONOMIC EXCHANGE? 1107
comparative advantage in trading. For this reason, we resort toethnic differences to capture deeper cultural roots. Much of theethnic variation in Europe reflects Neolithic invasions: two-thirdsof Europeans descend from Asian invaders and one-third fromAfrican invaders (Cavalli-Sforza 2000).8
To measure these ethnic differences, we use the genetic dis-tance between indigenous populations as developed by Cavalli-Sforza, Menozzi, and Piazza (1996).9 This measure is based onthe existence of genetic or DNA polymorphism (a situation inwhich a gene or a DNA sequence exists in at least two differentforms [alleles]). A simple example of polymorphism is the ABOblood group classification. Although ABO alleles are present inall populations, the frequency of each allele varies substantiallyacross populations. For example, the O allele is frequent in 61%of African populations and 98% of Native American populations.These frequency differences in alleles hold true for other genes orDNA sequences as well. As a first approximation, Cavalli-Sforza,Menozzi, and Piazza (1996) derive a measure of the differences inthe genetic composition between two populations by summing thedifferences in frequencies of these polymorphisms.10
As an alternative measure of distance between two popula-tions, we derive an indicator of somatic distance, based on theaverage frequency of specific traits in the indigenous populationreported by Biasutti (1954). For height, hair color (pigmentation),and cephalic index (the ratio of the length and width of the skull),Biasutti (1954) draws a map of the prevailing traits in each coun-try in Europe. For each trait, European Union countries fall intothree different categories. For hair color we have “Blond prevails,”“Mix of blond and dark,” and “Dark prevails.” We arbitrarily assignthe score of 1 to the first, 2 to the second, and 3 to the third. Whenone’s country somatic characteristics belong to more than one cat-egory, we take the country’s most prevalent category. We thencompute the somatic distance between two countries as the sumof the absolute value of the difference in each of these traits (seeOnline Appendix for more details). Somatic and genetic distances
8. Giuliano, Spilimbergo, and Tonon (2006) claim that genetic distance issimply a proxy for transportation costs, at least in the Neolithic Age. Historicaltransportation costs, however, are not identical to current ones. Before the creationof several tunnels, the Alps represented a formidable barrier to communicationbetween Italy and the neighboring countries. Hence, when we control for today’stransportation costs in the regressions, genetic (or somatic) distance captures thehistorical transportation costs, which led to different cultural enclaves.
9. See also Menozzi, Piazza, and Cavalli-Sforza (1978).10. For a more detailed description of this measure see the Online Appendix.
at National D
ong Hw
a University L
ibrary on April 5, 2014
http://qje.oxfordjournals.org/D
ownloaded from
1108 QUARTERLY JOURNAL OF ECONOMICS
are highly correlated (.53). Hence, we will be able to use only oneat a time.
Besides proxies for cultural distance, both somatic and ge-netic distances can be interpreted as measures of genetic dissim-ilarities. As DeBruine (2002) has shown in an experiment, peopletrust people who look like them more than those who do not.Hence, these two variables might proxy for a genetic element intrust, rather than for a cultural one. Either way, however, they area source of a potential bias that distorts an objective assessmentof the trustworthiness of a foreign population.
To capture these long-term elements of culture, we also usea measure of linguistic common roots created by Fearon andLaitin (2003). It is based on a count of the number of commonbranches two languages share in the language trees as reportedby Ethnologue.11
As a last measure of culture, we compute the number of yearsa country pair has been engaged in a war between year 1000 and1970. Because “history is very much a mythical construction, inthe sense that it is a representation of the past linked to the estab-lishment of an identity in the present” (Friedman 1992, pg. 195),we reconstruct wars using today’s borders. Cultural formation atschool is a vehicle for prolonging the memory of facts that tookplace many years ago (this is why we count wars over almost amillennium). Presumably, countries that have a long history ofwars and conflict will mistrust each other. As Table I shows, theclear tendency of the French to trust the British less than anyother country may reflect the 198 years that these two countrieshave waged war against each other since year 1000.
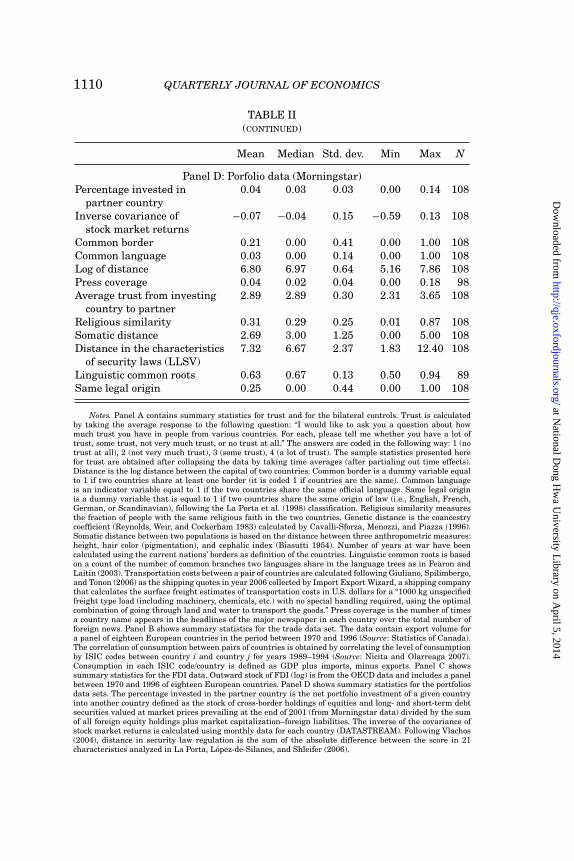
The summary statistics of these variables are reported inTable II (Panels A, C, D, and E), computed for the different samplesused in the paper.
III.B. Empirical Results
In Table III, we report the results of our estimates on thedeterminants of trust according to (2). Our dependent variable
11. http://www.ethnologue.com. Two languages that come from completelydifferent families have zero branches in common, whereas (say) English andFrench have one branch in common because they are both Indo-European, butEnglish is Germanic and French is Romance. Fearon and Laitin (2003) argue thatfor a measure of cultural distance, the move from zero to one common node ismore meaningful than a move from, say, five to six, so that a transformation with“diminishing returns” is better than simply counting common nodes. So, we uselinguistic common roots = # common nodes/(1 + # common nodes), though we alsotried other specifications with similar results.
at National D
ong Hw
a University L
ibrary on April 5, 2014
http://qje.oxfordjournals.org/D
ownloaded from

CULTURAL BIASES IN ECONOMIC EXCHANGE? 1109
TABLE IISUMMARY STATISTICS
Mean Median Std. dev. Min Max N
A. Trust and control variablesAverage trust 0.06 0.04 0.30 −0.62 0.90 207Log of distance 7.08 7.18 0.64 5.16 8.12 207Common border 0.14 0.00 0.35 0.00 1.00 207Common language 0.04 0.00 0.19 0.00 1.00 207Same legal origin 0.27 0.00 0.45 0.00 1.00 207Religious similarity 0.29 0.23 0.26 0.00 0.87 207Genetic distance 73.66 63.00 54.80 9.00 289.00 207
(FST values ×10,000)Somatic distance 2.56 3.00 1.26 0.00 5.00 207Fraction of years at war 0.02 0.00 0.03 0.00 0.20 207
(1000–1970)Linguistic common roots 0.51 0.50 0.24 0.00 0.94 180Transportation costs 186.13 185.00 17.09 160.00 249.00 207Press coverage 0.03 0.01 0.04 0.00 0.31 179
B. Statistics of CanadaLog of export to 14.78 14.79 1.58 9.94 17.83 595
partner countryAverage trust from 2.74 2.74 0.28 1.99 3.57 595
importer to exporterPress coverage 0.04 0.02 0.05 0.00 0.31 595Log of distance 6.86 7.01 0.69 5.16 8.12 595Common border 0.21 0.00 0.41 0.00 1.00 595Common language 0.06 0.00 0.24 0.00 1.00 595Religious similarity 0.33 0.32 0.26 0.00 0.87 595Somatic distance 2.49 3.00 1.21 0.00 5.00 595Same origin of the law 0.30 0.00 0.46 0.00 1.00 595Transportation costs 5.19 5.18 0.08 5.08 5.52 595Linguistic common roots 0.56 0.50 0.17 0.00 0.94 573Correlation of consumption 0.89 0.90 0.06 0.72 0.99 474
by industry
C. OECD foreign direct investmentOutward stock of FDI (log) 21.10 21.40 2.14 12.42 24.18 439Average trust from country 2.77 2.77 0.27 2.10 3.53 439
to each partnerPress coverage 0.05 0.04 0.06 0.00 0.31 439Log of distance 6.78 6.96 0.72 5.16 8.12 439Common border 0.24 0.00 0.43 0.00 1.00 439Common language 0.09 0.00 0.28 0.00 1.00 439Same legal origin 0.32 0.00 0.47 0.00 1.00 439Religious similarity 0.37 0.34 0.23 0.01 0.87 439Somatic distance 2.67 3.00 1.27 0.00 5.00 439Linguistic common roots 0.56 0.50 0.21 0.00 0.94 413Transportation costs 5.18 5.15 0.09 5.08 5.52 439
at National D
ong Hw
a University L
ibrary on April 5, 2014
http://qje.oxfordjournals.org/D
ownloaded from
1110 QUARTERLY JOURNAL OF ECONOMICS
TABLE II(CONTINUED)
Mean Median Std. dev. Min Max N
Panel D: Porfolio data (Morningstar)Percentage invested in 0.04 0.03 0.03 0.00 0.14 108
partner countryInverse covariance of −0.07 −0.04 0.15 −0.59 0.13 108
stock market returnsCommon border 0.21 0.00 0.41 0.00 1.00 108Common language 0.03 0.00 0.14 0.00 1.00 108Log of distance 6.80 6.97 0.64 5.16 7.86 108Press coverage 0.04 0.02 0.04 0.00 0.18 98Average trust from investing 2.89 2.89 0.30 2.31 3.65 108
country to partnerReligious similarity 0.31 0.29 0.25 0.01 0.87 108Somatic distance 2.69 3.00 1.25 0.00 5.00 108Distance in the characteristics 7.32 6.67 2.37 1.83 12.40 108
of security laws (LLSV)Linguistic common roots 0.63 0.67 0.13 0.50 0.94 89Same legal origin 0.25 0.00 0.44 0.00 1.00 108
Notes. Panel A contains summary statistics for trust and for the bilateral controls. Trust is calculatedby taking the average response to the following question: “I would like to ask you a question about howmuch trust you have in people from various countries. For each, please tell me whether you have a lot oftrust, some trust, not very much trust, or no trust at all.” The answers are coded in the following way: 1 (notrust at all), 2 (not very much trust), 3 (some trust), 4 (a lot of trust). The sample statistics presented herefor trust are obtained after collapsing the data by taking time averages (after partialing out time effects).Distance is the log distance between the capital of two countries. Common border is a dummy variable equalto 1 if two countries share at least one border (it is coded 1 if countries are the same). Common languageis an indicator variable equal to 1 if the two countries share the same official language. Same legal originis a dummy variable that is equal to 1 if two countries share the same origin of law (i.e., English, French,German, or Scandinavian), following the La Porta et al. (1998) classification. Religious similarity measuresthe fraction of people with the same religious faith in the two countries. Genetic distance is the coancestrycoefficient (Reynolds, Weir, and Cockerham 1983) calculated by Cavalli-Sforza, Menozzi, and Piazza (1996).Somatic distance between two populations is based on the distance between three anthropometric measures:height, hair color (pigmentation), and cephalic index (Biasutti 1954). Number of years at war have beencalculated using the current nations’ borders as definition of the countries. Linguistic common roots is basedon a count of the number of common branches two languages share in the language trees as in Fearon andLaitin (2003). Transportation costs between a pair of countries are calculated following Giuliano, Spilimbergo,and Tonon (2006) as the shipping quotes in year 2006 collected by Import Export Wizard, a shipping companythat calculates the surface freight estimates of transportation costs in U.S. dollars for a “1000 kg unspecifiedfreight type load (including machinery, chemicals, etc.) with no special handling required, using the optimalcombination of going through land and water to transport the goods.” Press coverage is the number of timesa country name appears in the headlines of the major newspaper in each country over the total number offoreign news. Panel B shows summary statistics for the trade data set. The data contain export volume fora panel of eighteen European countries in the period between 1970 and 1996 (Source: Statistics of Canada).The correlation of consumption between pairs of countries is obtained by correlating the level of consumptionby ISIC codes between country i and country j for years 1989–1994 (Source: Nicita and Olarreaga 2007).Consumption in each ISIC code/country is defined as GDP plus imports, minus exports. Panel C showssummary statistics for the FDI data. Outward stock of FDI (log) is from the OECD data and includes a panelbetween 1970 and 1996 of eighteen European countries. Panel D shows summary statistics for the portfoliosdata sets. The percentage invested in the partner country is the net portfolio investment of a given countryinto another country defined as the stock of cross-border holdings of equities and long- and short-term debtsecurities valued at market prices prevailing at the end of 2001 (from Morningstar data) divided by the sumof all foreign equity holdings plus market capitalization–foreign liabilities. The inverse of the covariance ofstock market returns is calculated using monthly data for each country (DATASTREAM). Following Vlachos(2004), distance in security law regulation is the sum of the absolute difference between the score in 21characteristics analyzed in La Porta, Lopez-de-Silanes, and Shleifer (2006).
at National D
ong Hw
a University L
ibrary on April 5, 2014
http://qje.oxfordjournals.org/D
ownloaded from

CULTURAL BIASES IN ECONOMIC EXCHANGE? 1111T
AB
LE
III
DE
TE
RM
INA
NT
OF
TR
US
T
(1)
(2)
(3)
(4)
(5)
(6)
(7)
(8)
(9)
Com
mon
lan
guag
e0.
050.
09∗
0.11
∗0.
09∗
0.08
0.02
0.04
0.05
0.08
(0.0
7)(0
.05)
(0.0
6)(0
.05)
(0.0
5)(0
.06)
(0.0
6)(0
.06)
(0.0
6)L
og(d
ista
nce
)−0
.11∗
∗∗−0
.04∗
−0.0
5∗−0
.04
−0.0
1−0
.01
0.00
0.01
−0.0
1(0
.03)
(0.0
2)(0
.03)
(0.0
3)(0
.02)
(0.0
2)(0
.03)
(0.0
3)(0
.03)
Com
mon
bord
er−0
.01
−0.0
5−0
.01
−0.0
5−0
.04
−0.0
4−0
.05
−0.0
5−0
.03
(0.0
5)(0
.04)
(0.0
4)(0
.04)
(0.0
3)(0
.03)
(0.0
4)(0
.04)
(0.0
4)F
ract
ion
ofye
ars
atw
ar−1
.16∗
∗∗−1
.07∗
∗∗−1
.16∗
∗∗−1
.07∗
∗∗−1
.16∗
∗∗−1
.26∗
∗∗−1
.26∗
∗∗−1
.07∗
∗∗
(100
0–19
70)
(0.2
9)(0
.39)
(0.2
9)(0
.29)
(0.2
9)(0
.39)
(0.3
9)(0
.39)
Rel
igio
us
sim
ilar
ity
0.15
∗∗∗
0.24
∗∗∗
0.15
∗∗∗
0.15
∗∗∗
0.11
∗∗0.
13∗∗
∗0.
13∗∗
∗0.
15∗∗
∗
(0.0
4)(0
.05)
(0.0
4)(0
.04)
(0.0
4)(0
.05)
(0.0
5)(0
.05)
Som
atic
dist
ance
−0.0
6∗∗∗
−0.0
6∗∗∗
−0.0
5∗∗∗
−0.0
4∗∗∗
−0.0
4∗∗∗
−0.0
4∗∗∗
−0.0
3∗∗∗
(0.0
1)(0
.01)
(0.0
1)(0
.01)
(0.0
1)(0
.01)
(0.0
1)G
enet
icdi
stan
ce−1
0.00
∗0.
06(5
.94)
(5.0
7)D
iffe
ren
ces
inG
DP
per
−0.1
4∗∗∗
−0.1
4∗∗∗
−0.1
3∗∗∗
−0.1
3∗∗∗
−0.0
9∗∗
capi
ta(p
erce
nta
ge)
(0.0
4)(0
.03)
(0.0
3)(0
.03)
(0.0
3)S
ame
lega
lori
gin
0.07
∗∗0.
050.
050.
05(0
.03)
(0.0
3)(0
.03)
(0.0
4)L
ingu
isti
cco
mm
onro
ots
0.20
∗0.
20∗
0.21
∗
(0.1
1)(0
.11)
(0.1
1)T
ran
spor
tati
onco
sts∗
1,00
0−0
.58
−1.0
5(1
.00)
(0.9
6)P
ress
cove
rage
−0.7
3∗∗
(0.3
4)O
bser
vati
ons
207
207
207
207
207
207
180
180
154
R2
.772
.840
.806
.840
.854
.858
.832
.832
.837
Not
es.
Th
ede
pen
den
tva
riab
leis
the
aver
age
tru
stac
ross
indi
vidu
als
ofa
give
nco
un
try
tow
ard
citi
zen
sof
oth
erco
un
trie
s.T
oap
prop
riat
ely
esti
mat
eth
est
anda
rder
rors
,w
efi
rst
regr
esse
dth
eob
serv
atio
ns
onye
arfi
xed
effe
cts,
and
then
we
took
the
resi
dual
and
coll
apse
dth
eob
serv
atio
ns
byye
ar.T
rust
isca
lcu
late
dby
taki
ng
the
aver
age
resp
onse
toth
efo
llow
ing
ques
tion
:“I
wou
ldli
keto
ask
you
aqu
esti
onab
out
how
mu
chtr
ust
you
hav
ein
peop
lefr
omva
riou
sco
un
trie
s.F
orea
ch,
plea
sete
llm
ew
het
her
you
hav
ea
lot
oftr
ust
,so
me
tru
st,n
otve
rym
uch
tru
st,o
rn
otr
ust
atal
l.”T
he
answ
ers
are
code
din
the
foll
owin
gw
ay:1
(no
tru
stat
all)
,2(n
otve
rym
uch
tru
st),
3(s
ome
tru
st),
4(a
lot
oftr
ust
).A
llot
her
vari
able
sar
ere
port
edin
the
not
esto
Tab
leII
.Th
ere
gres
sion
sin
clu
deco
un
try-
of-o
rigi
nan
dco
un
try-
of-d
esti
nat
ion
fixe
def
fect
s.S
pati
alco
rrec
ted
stan
dard
erro
r(s
eeC
onle
y[1
999]
)ar
ere
port
edin
pare
nth
eses
.C
oeffi
cien
tis
stat
isti
call
ydi
ffer
ent
from
zero
atth
e∗∗
∗ 1%
,∗∗ 5
%,a
nd
∗ 10%
leve
l.
at National D
ong Hw
a University L
ibrary on April 5, 2014
http://qje.oxfordjournals.org/D
ownloaded from

1112 QUARTERLY JOURNAL OF ECONOMICS
is average residual trust.12 Because in regression (1) we removedthe effect of a country-of-origin factor and a country-of-destinationfactor, this specification tries to capture the match-specific factorthat drives trust. To correct for potential geographical clusteringof our standard errors, all our OLS regressions report spatial cor-rected standard error (Conley 1999).13
We start by regressing the average residual trust of country i’scitizens toward citizens of country j on our proxies for differencesin the information sets (column (1)). If familiarity breeds trust,we should expect that distance and common language have a pos-itive effect on trust. More information, however, allows us to makemore precise inferences about other populations’ trustworthiness,which does not necessarily imply more or less trust on average.
Common language has a positive effect on trust, but in thebasic specification this effect is not statistically significant. Bycontrast, a greater distance between two countries reduces thelevel of trust between them. A one-standard-deviation increase inlog distance decreases trust by one-fourth of a standard deviation.The common-border dummy has a negative sign, but it is notstatistically significant.
In column (2), we introduce our cultural variables. The re-sults show that cultural factors are important overall. The threecultural proxies are jointly statistically significant with an F-testof 21.6. Countries with a long history of wars tend to trust eachother less. France and England, for example, which have a recordof 198 years of war (more than ten times the average of nineteen)should exhibit a bilateral trust that is 0.7 of a standard deviationlower than average, which accounts for the lower bilateral trustthat we observe between them. Religious similarity has a positiveimpact on trust: compared to a case where no common religion isshared, a match where 90% of the citizens share the same reli-gion (e.g., Italy and Spain) raises trust by 15 percentage points(corresponding to 40% of its standard deviation).
The coefficient of somatic distance shows that citizens of onecountry tend to be more trusting toward citizens of other countriesthat are somatically closer. A one-standard-deviation increase in
12. We obtained similar results (not reported) when we use as dependentvariable median trust or the percentage of individuals trusting a lot.
13. Because we have both the trust from France to Great Britain and fromGreat Britain to France, and all of the bilateral regressors for this pair of countriesare unchanged, we need to assume that their residuals are not independent. Forthis reason, in a previous version we clustered the standard errors at the pair-of-countries level, with very similar results.
at National D
ong Hw
a University L
ibrary on April 5, 2014
http://qje.oxfordjournals.org/D
ownloaded from

CULTURAL BIASES IN ECONOMIC EXCHANGE? 1113
somatic distance lowers bilateral trust by one-quarter of a stan-dard deviation. If we modify our measure of somatic distance to in-clude only differences in the more visible traits (hair and height),the effect is even stronger (not reported).
In column (3), we substitute for somatic distance with ge-netic distance. The effect is similar but stronger. A one-standard-deviation increase in genetic distance lowers bilateral trust by 1.8standard deviations. When we introduce both in the regression(column (4)), the genetic-distance coefficient drops dramaticallyand loses statistical significance. This is not surprising given thehigh correlation between these two variables. Because both aretrying to capture the same dimension, we will drop the least sig-nificant of the two (i.e., genetic distance) from the following re-gressions.
Alesina and La Ferrara (2002) document that, in the UnitedStates, differences in income are important factors in explainingtrust within a community. In column (5), we try to see whetherthese ideas also apply to trust across communities (or countries)by inserting the relative difference in gross domestic productper capita as an additional regressor. Confirming Alesina andLa Ferrara (2002), this variable has a negative and statisticallysignificant effect on trust, but its insertion does not change themagnitude of the coefficients of the other variables substantially.
Another possibility is that our cultural variables are a proxyfor differences in the legal origin. If countries with a similar legalsystem understand each other more and trust more, it is am-biguous whether this is an information effect or a cultural effect.For this reason, in column (6), we introduce an indicator variableequal to 1 if two countries have the same legal origin. Not sur-prisingly, this variable has a positive and statistically significanteffect. Countries with a common legal origin have one-fourth of astandard deviation higher trust. This effect reduces the impact oftwo of the other three cultural variables (religion similarity andsomatic distance), but they remain statistically significant.
Another variable that may proxy for culture, but may alsoproxy for ease in (verbal) communication is the commonality inlinguistic roots. When we insert it in column (7), we find thatit has a positive but not statistically significant effect. Interest-ingly, commonality of linguistic roots reduces the effect of com-mon legal origin (which becomes insignificant) but does not affectthe other cultural proxies, which remain statistically significant.Thus, even when we control for variables that, at least in part,
at National D
ong Hw
a University L
ibrary on April 5, 2014
http://qje.oxfordjournals.org/D
ownloaded from

1114 QUARTERLY JOURNAL OF ECONOMICS
proxy for culture, our cultural variables retain an economicallyand statistically significant effect.
Giuliano, Spilimbergo, and Tonon (2006) claim that geneticdistance is just a proxy for transportation costs, which are mis-measured by the log distance between two countries. If this werethe case, trust might simply be the result of trade, with little orno cultural effect. To address this concern, we add transportationcosts to the regression (column (8)). Transportation costs have anegative effect on trust, but this effect is not statistically signifi-cant. More important, the coefficients of all the other variables (inparticular, somatic distance) are unaffected. This result is not spe-cific to somatic distance; with genetic distance, we reach similarconclusions.
Finally, in column (9) we introduce a direct measure of theknowledge that citizens of country i have regarding the citizens ofcountry j, as measured by press coverage. The coefficient is neg-ative and statistically significant. The most likely interpretationof this result is that newspapers tend to report bad news and thiscreates a negative bias, which is stronger when more news abouta country is reported. All the other results remain the same.
IV. THE EFFECT OF TRUST ON TRADE
Now that we have a better sense of the determinants of bilat-eral trust we can explore its effects. Is it true that trust (or lackthereof) has first-order economic effects, as suggested by Arrow(1972)?14 More important, can we establish that some culturalfactors impact economic exchange? To do so, we try to see whatthe effect of trust is when inserted in traditional models of eco-nomic exchange across countries. We start with trade of goods andservices.
IV.A. Data
The first variables we use are data on trade of goods andservices assembled by Statistics of Canada. The World TradeDatabase is derived from UN COMTRADE data; its advantageover other data sets is that it provides bilateral trade statis-tics at the four-digit Standard International Trade Classification(SITC) level.15 This database provides a time series of trade value,
14. For a simple model of how small differences in trust can have first-order ef-fects on economic decisions, see Section I of Guiso, Sapienza, and Zingales (2004a).
15. We also used an aggregate OECD data set, based on custom data, andfound very similar results.
at National D
ong Hw
a University L
ibrary on April 5, 2014
http://qje.oxfordjournals.org/D
ownloaded from

CULTURAL BIASES IN ECONOMIC EXCHANGE? 1115
disaggregated according to trading partner and four-digit SITClevel for the period 1970–1996. Of this long panel we use onlydata for the years for which trust survey data are available (1970,1976, 1980, 1986, 1990, 1993, 1994, and 1996). The sample statis-tics for the data are reported in Panel C of Table III.16
IV.B. Empirical Results
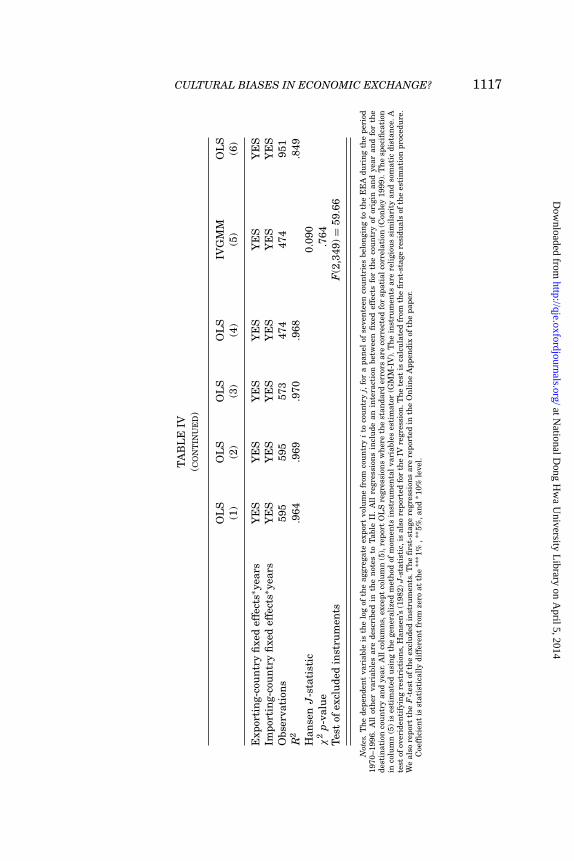
Table IV estimates the effect of trust on the amount of tradebetween two countries according to the following model:
LogExport jit = κi ∗ Yeart + λ j ∗ Yeart + βTrusti jt + δXij + εi jt,
(3)
where Export jit is the export of country j in country i in year taggregated over four-digit SITC industries. Trusti jt is the trustof citizens of country i for citizens of country j in the survey inyear t, and Xij are bilateral-specific variables, which do not varyover time, such as distance; κi a country-of-origin fixed effect,λ j a country-of-destination fixed effect, and Yeart calendar-yeardummies.
De facto, regression (3) is a standard gravity regression (e.g.,Anderson and van Wincoop [2003]), with the addition of our mea-sure of trust of the importing country toward the exporting one,the Giuliano, Spilimbergo, and Tonon (2006) measure of trans-portation costs, country fixed effects for both the importing andthe exporting countries, and calendar-year dummies. FollowingAnderson and van Wincoop (2003), we insert fixed exporter-by-year and importer-by-year fixed effects to account for time-variantfrictions.17 Because we are looking at European countries and ag-gregate the statistics at the country level, we do not have anyzero-flow observations, which could bias the estimates (Lindersand de Groot 2006).18 The standard errors reported in bracketsare corrected for spatial correlation (Conley 1999).
16. In a robustness test, as a dependent variable we used the log of the averagelevel of export in the years following each survey: 1970–1974 with the 1970 survey,1975–1979 with the 1976 survey, 1980–1984 with the 1980 survey, 1985–1988 withthe 1986 survey, 1989–1991 with the 1990 survey, 1992 with the 1992 survey, 1993with the 1993 survey data, 1994 with the 1994 survey data, and 1995–1996 withthe 1996. The results (available from the authors) are unchanged.
17. Our results are even stronger if instead of the interaction terms we in-clude exporter fixed effect, importer fixed effect, and year fixed effect (see Guiso,Sapienza, and Zingales [2004a]). Anderson and van Wincoop (2003) argue againstthe insertion of “remoteness” into the gravity equation. Our results are unchangedif we add a measure of remoteness.
18. For a theoretical justification of the use of the gravity equation, seeHelpman and Krugman (1985).
at National D
ong Hw
a University L
ibrary on April 5, 2014
http://qje.oxfordjournals.org/D
ownloaded from

1116 QUARTERLY JOURNAL OF ECONOMICST
AB
LE
IVE
FF
EC
TO
FT
RU
ST
ON
TR
AD
E
OL
SO
LS
OL
SO
LS
IVG
MM
OL
S(1
)(2
)(3
)(4
)(5
)(6
)
Mea
ntr
ust
ofpe
ople
inim
port
ing
0.36
∗∗0.
29∗
0.25
0.34
∗∗1.
20∗∗
∗0.
19co
un
try
tope
ople
inex
port
ing
cou
ntr
y(0
.17)
(0.1
7)(0
.19)
(0.1
6)(0
.20)
(0.2
2)In
tera
ctio
nbe
twee
ntr
ust
and
0.83
∗∗∗
dive
rsifi
edgo
od(0
.05)
Com
mon
lan
guag
e0.
58∗∗
∗0.
32∗∗
0.37
∗∗0.
82∗∗
∗0.
94∗∗
∗1.
04∗∗
∗(0
.22)
(0.1
6)(0
.16)
(0.2
1)(0
.14)
(0.2
7)L
og(d
ista
nce
)−0
.31∗
∗∗−0
.43∗
∗∗−0
.43∗
∗∗−0
.57∗
∗∗−0
.61∗
∗∗−0
.73∗
∗∗(0
.09)
(0.0
9)(0
.09)
(0.1
0)(0
.07)
(0.1
2)C
omm
onbo
rder
0.49
∗∗∗
0.43
∗∗∗
0.41
∗∗∗
0.41
∗∗∗
0.36
∗∗∗
0.35
∗∗∗
(0.1
1)(0
.10)
(0.1
1)(0
.10)
(0.0
6)(0
.13)
Pre
ssco
vera
ge0.
45−0
.03
−0.0
9−1
.34
−0.8
9−2
.83∗
∗(1
.05)
(0.9
3)(0
.94)
(1.0
)(0
.60)
(1.1
2)T
ran
spor
tati
onco
sts
−1.8
1∗∗
−0.3
3−0
.28
0.10
0.63
−1.8
3(0
.79)
(0.7
4)(0
.76)
(0.7
3)(0
.52)
(1.1
7)S
ame
lega
lori
gin
0.45
∗∗∗
0.43
∗∗∗
0.36
∗∗∗
0.24
∗∗∗
0.57
∗∗∗
(0.1
0)(0
.10)
(0.1
1)(0
.07)
(0.1
5)L
ingu
isti
cco
mm
onro
ots
0.09
(0.2
8)C
orre
lati
onof
con
sum
ptio
n−0
.95
−1.0
5∗∗∗
−1.8
2∗∗
betw
een
the
two
cou
ntr
ies
(0.6
8)(0
.37)
(0.8
9)
at National D
ong Hw
a University L
ibrary on April 5, 2014
http://qje.oxfordjournals.org/D
ownloaded from
CULTURAL BIASES IN ECONOMIC EXCHANGE? 1117
TA
BL
EIV
(CO
NT
INU
ED
)
OL
SO
LS
OL
SO
LS
IVG
MM
OL
S(1
)(2
)(3
)(4
)(5
)(6
)
Exp
orti
ng-
cou
ntr
yfi
xed
effe
cts∗
year
sY
ES
YE
SY
ES
YE
SY
ES
YE
SIm
port
ing-
cou
ntr
yfi
xed
effe
cts∗
year
sY
ES
YE
SY
ES
YE
SY
ES
YE
SO
bser
vati
ons
595
595
573
474
474
951
R2
.964
.969
.970
.968
.849
Han
sen
J-s
tati
stic
0.09
0χ
2p-
valu
e.7
64T
est
ofex
clu
ded
inst
rum
ents
F(2
,349
)=
59.6
6
Not
es.
Th
ede
pen
den
tva
riab
leis
the
log
ofth
eag
greg
ate
expo
rtvo
lum
efr
omco
un
try
ito
cou
ntr
yj,
for
apa
nel
ofse
ven
teen
cou
ntr
ies
belo
ngi
ng
toth
eE
EA
duri
ng
the
peri
od19
70–1
996.
All
oth
erva
riab
les
are
desc
ribe
din
the
not
esto
Tab
leII
.A
llre
gres
sion
sin
clu
dean
inte
ract
ion
betw
een
fixe
def
fect
sfo
rth
eco
un
try
ofor
igin
and
year
and
for
the
dest
inat
ion
cou
ntr
yan
dye
ar.A
llco
lum
ns,
exce
ptco
lum
n(5
),re
port
OL
Sre
gres
sion
sw
her
eth
est
anda
rder
rors
are
corr
ecte
dfo
rsp
atia
lco
rrel
atio
n(C
onle
y19
99).
Th
esp
ecifi
cati
onin
colu
mn
(5)
ises
tim
ated
usi
ng
the
gen
eral
ized
met
hod
ofm
omen
tsin
stru
men
tal
vari
able
ses
tim
ator
(GM
M-I
V).
Th
ein
stru
men
tsar
ere
ligi
ous
sim
ilar
ity
and
som
atic
dist
ance
.Ate
stof
over
iden
tify
ing
rest
rict
ion
s,H
anse
n’s
(198
2)J
-sta
tist
ic,i
sal
sore
port
edfo
rth
eIV
regr
essi
on.T
he
test
isca
lcu
late
dfr
omth
efi
rst-
stag
ere
sidu
als
ofth
ees
tim
atio
npr
oced
ure
.W
eal
sore
port
the
F-t
est
ofth
eex
clu
ded
inst
rum
ents
.Th
efi
rst-
stag
ere
gres
sion
sar
ere
port
edin
the
On
lin
eA
ppen
dix
ofth
epa
per.
Coe
ffici
ent
isst
atis
tica
lly
diff
eren
tfr
omze
roat
the
∗∗∗ 1
%,∗
∗ 5%
,an
d∗ 1
0%le
vel.
at National D
ong Hw
a University L
ibrary on April 5, 2014
http://qje.oxfordjournals.org/D
ownloaded from

1118 QUARTERLY JOURNAL OF ECONOMICS
As in the standard gravity equation, a greater distancebetween two countries negatively affects the level of exports,whereas the presence of a common border and of a common lan-guage positively affects it. All these effects are highly statisticallysignificant. As in Giuliano, Spilimbergo, and Tonon (2006), thetransportation costs measure has a negative effect on trade, whichis statistically significant at the 5% level.19
After controlling for all these variables, our measure of trusthas a positive and statistically significant effect on trade. Theeffect is also economically very large. A one-standard-deviationincrease in trust increases exports to a country by ten percentagepoints, equal to 1.6 standard deviations.
In column (2), we test the robustness of this result to theinsertion of an indicator variable for commonality of legal origin.This variable can capture the fact that similar institutions fostermore trade because they provide more guarantee to the partiesinvolved (De Groot et al. 2004; Vlachos 2004). Alternatively, itcan capture part of the cultural effect. This indicator variable hasa positive and statistically significant effect on trade. Countrieswith the same legal tradition trade among themselves 1.5 timesmore. We find a similar effect when we introduce the commonalityof linguistic roots, which does not have a statistically significantimpact on trade (column (3)).
Another possible objection is that trust might pick up someother cultural similarities such as commonalities in taste. If twocountries share the same taste for consumption (e.g., for cheese),they might trade more. To address this problem we construct anindex of similarity in consumption patterns across countries. Thisindex is calculated by computing domestic consumption as thesum of gross domestic production in each ISIC code plus importsand minus exports between 1989 and 1994. For each pair of coun-tries, then, we compute the correlation in consumption across ISICsectors.20
When we insert this variable in the OLS specification ofour trade regression (column (4)), the sign is negative, but not
19. In an unreported regression, we also controlled for the geographical bar-riers used by Giuliano, Spilimbergo, and Tonon (2006): the presence of a commonsea and the presence of a mountain chain between two countries. These variablesare not significant and do not affect the other results.
20. Data on consumptions are calculated by extracting data from thefollowing data set: http://econ.worldbank.org/WBSITE/EXTERNAL/EXTDEC/EXTRESEARCH/0,,contentMDK:21085384∼pagePK:64214825 ∼piPK:64214943∼theSitePK:469382,00.html.
at National D
ong Hw
a University L
ibrary on April 5, 2014
http://qje.oxfordjournals.org/D
ownloaded from

CULTURAL BIASES IN ECONOMIC EXCHANGE? 1119
statistically significant. The size and the statistical significanceof the coefficient of trust are unaffected. A similar concern is thatcountries with a more similar structure of production trade morewith each other. To address it, we create an index of productionsimilarity by correlating the GDP data across sectors in the sameway as described above. The results (not reported) are unchanged.
There are at least three reasons to worry about these OLSresults. First, although it is possible that trust fosters trade, itis equally possible that trade breeds trust. The second problemis that bilateral trust can capture the effect of other omittedvariables (e.g., the existence of established trading outposts, assuggested by Rauch and Trindade [2002]). Finally, measurementerrors in the trust variable may affect our results.
To address these concerns we instrument our trust variableby using the generalized method of moments estimator (GMM-IV),which allows for heteroscedasticity of unknown form. As instru-ments we use the cultural determinants of trust (commonality ofreligion and somatic distance). Note that these instruments aretime invariant, yet the average level of trust varies over time.These two instruments pass the Hansen J-test for overidentify-ing restrictions, but were we to add also the history of wars, thetest would fail.
The IV estimates are presented in column (5). Not only doestrust retain its effect on trade, but the size of the coefficient in-creases fourfold. A possible explanation is that our instrumentsmay be only weakly correlated with trust. If this is the case, thenthe two-stage least-squares regressions will be biased and thestandard errors misleading. To address this concern, we computethe F-statistics for the joint hypothesis that the instruments’ co-efficients are zero in the first-stage regression and report it atthe bottom of the table. In this specification, the F-test is 59.66,comfortably above the threshold recommended by Stock and Yogo(2002).
An alternative explanation for the difference in the coefficientis that our trust measure is a noisy measure of the true trustbetween two countries, and the increase in the coefficient would bethe result of a reduction in the standard attenuation bias presentwhen variables are measured with error. If this is the case, thetrue economic effect is closer to the GMM-IV estimates, whichsuggests a much larger result. A one-standard-deviation increasein trust increases exports to a country by 63 percentage points.The magnitude of this effect is not very different from the one
at National D
ong Hw
a University L
ibrary on April 5, 2014
http://qje.oxfordjournals.org/D
ownloaded from

1120 QUARTERLY JOURNAL OF ECONOMICS
found by Rauch and Trindade (2002). They find that the presenceof ethnic Chinese networks increases the amount of bilateral tradein differentiated goods by 60%.
Alternatively, it is possible that—test of overidentifying re-strictions notwithstanding—our instruments are not orthogonalto trade, but pick up a set of cultural, institutional, and legal con-nections that facilitate trade flows. These cultural effects mustbe match specific because the institutional factors are controlledfor in the country-of-origin or in the country-of-destination fixedeffects. If this is the case, our results suggest the importance ofculture-specific factors in trade relationships. These factors canhelp explain the famous Rose (2000) result (confirmed by Rose andStanley [2005]) that currency unions are associated with a verylarge increase in trade. Because most of the countries belongingto currency unions in the Rose (2000) sample were countries veryculturally connected, where trust is higher, trade will be naturallyhigher once the obstacle to trade imposed by national currenciesis removed.
In the last column of Table IV, we test whether the impact oftrust on trade varies according to what theory would suggest. Ourhypothesis predicts that trust should matter more for goods whosequality can differ more. For these goods, contracts are more diffi-cult to write and hence they are more likely to leave gaps, wheretrust plays a very important role. Rauch (1999) distinguishes be-tween goods traded in an organized exchange, goods with a refer-ence price, and differentiated goods. Clearly, goods can be tradedin an organized exchange only if they are very homogeneous inquality. Similarly, they can have a reference price only if theyare not too dissimilar in their intrinsic quality. Hence, Rauch’s(1999) classification can also be interpreted as a classification ofthe degree of trust intensiveness of the different goods.21
For this reason, in the last column of Table IV, we aggregateexports for two subsamples of industries (organized exchange anddifferentiated goods); then, we run the regression by using theinteraction between trust and whether the good is classified asa differentiated good. The effect of trust appears to be economi-cally and statistically indistinguishable from zero for the sampleof homogeneous goods, which are traded in organized exchanges.
21. Rauch (1999) made a “conservative” and a “liberal” classification of in-dustries. To minimize ambiguity we excluded industries that were classified indifferent ways under the two classifications and ran our regressions only for orga-nized exchange goods and differentiated goods.
at National D
ong Hw
a University L
ibrary on April 5, 2014
http://qje.oxfordjournals.org/D
ownloaded from

CULTURAL BIASES IN ECONOMIC EXCHANGE? 1121
By contrast, the effect is quantitatively large and statistically dif-ferent from zero (and from the coefficient for homogeneous goods)for differentiated goods: trade in differentiated goods increases by39% in response to a one-standard-deviation increase in trust.
V. FOREIGN DIRECT INVESTMENT (FDI)
If trust has an impact on trade, it should have an even biggerimpact on the willingness to invest in a country. For this reason,we study the impact of trust on FDI.
V.A. Data
Statistics on FDI transactions and positions are based on thedatabase developed by the OECD Directorate for Financial, Fiscal,and Enterprise Affairs. These statistics are compiled according tothe concept used for balance of payments (flows) and internationalinvestment positions (stocks) statistics. We use only data for coun-tries that belonged to the EEA for the years when trust surveydata are available (1970, 1976, 1980, 1986, 1990, 1993, 1994, and1996).
According to the classification used in the balance-of-paymentaccounts, an FDI enterprise is an incorporated enterprise in whicha foreign investor (a resident of another country) has at least10% of the shares or voting power. As for trade, we restrict ourattention to EEA country members, where the same rules for FDIapply. Summary statistics are reported in Table II, Panel D.
V.B. Empirical Results
Table V reports the effect of country i’s trust toward people ofcountry j on the FDI of country i in country j. The specification isas in regression (3) except that the dependent variable is the logof the stock of FDI from country i to country j. Spatial standarderrors are reported in brackets.
Column (1) reports the basic specification where, in additionto mean trust, we have country fixed effects, border, language,distance, and press coverage.22 The impact of trust is positiveand statistically significant. A one-standard-deviation increase intrust raises the level of FDI by 27%. This result is robust to adding
22. Because number of years at war was significant in the trade regressions,we also inserted it here. Dropping it does not affect the significance and the mag-nitude of other results.
at National D
ong Hw
a University L
ibrary on April 5, 2014
http://qje.oxfordjournals.org/D
ownloaded from

1122 QUARTERLY JOURNAL OF ECONOMICS
TABLE VEFFECT OF TRUST ON FDI
OLS OLS OLS OLS IVGMM(1) (2) (3) (4) (5)
Mean trust toward 1.35∗∗∗ 0.94∗ 0.70 0.84∗ 6.65∗∗∗people in destination (0.51) (0.51) (0.48) (0.49) (1.24)country
Common language 0.12 0.17 −0.57∗ −0.75∗∗ −2.05∗∗∗(0.31) (0.29) (0.30) (0.38) (0.43)
Log (distance) −0.46∗ −0.22 −0.48∗∗ −0.56∗∗ −0.70∗∗∗(0.26) (0.27) (0.23) (0.24) (0.26)
Common border 0.47∗∗ 0.44∗∗ 0.26 0.34 0.26(0.20) (0.20) (0.20) (0.21) (0.21)
Press coverage 2.65 1.67 0.76 1.00 8.97∗∗∗(2.29) (2.18) (2.04) (2.24) (2.69)
Transportation costs −4.55∗∗ −0.23 −0.32 5.13∗∗(1.76) (1.66) (1.80) (2.31)
Common law 1.28∗∗∗ 1.36∗∗∗ 1.38∗∗∗(0.27) (0.31) (0.26)
Linguistic common roots −0.86 −2.41∗∗∗(0.55) (0.66)
Investing-country fixed YES YES YES YES YESeffects∗years
Destination-country fixed YES YES YES YES YESeffects∗years
Observations 445 445 445 419 419R2 .854 .860 .879 .880Hansen J-statistic 0.031χ2 p-value .859Test of excluded F(2,328) =
instruments in first stage 24.34
Notes. The dependent variable is the log of outward investment (stocks) from the OECD data (1970–1996)for seventeen countries belonging to the EEA. The independent variables are defined in the notes to TableII. All regressions include the interaction between fixed effects for the country of origin and year and fixedeffects for the destination country and year. All columns, except column (5), report OLS regressions where thestandard errors are corrected for spatial correlation (Conley 1999). The specification in column (5) is estimatedusing the generalized method of moments instrumental variables estimator (GMM-IV). The instruments arereligious similarity and somatic distance. A test of overidentifying restrictions, Hansen’s (1982) J-statistic,is also reported for the IV regression. The test is calculated from the first-stage residuals of the estimationprocedure. We also report the F-test of the excluded instruments. The first-stage regressions are reportedin the Online Appendix of the paper. The standard errors reported in parentheses are corrected for spatialcorrelation (Conley 1999).
Coefficient is statistically different from zero at the ∗∗∗1% , ∗∗5%, and ∗10% level.
an interaction between the importer- and exporter-country fixedeffects and year dummies (not reported).
In column (2), we insert the Giuliano, Spilimbergo, andTonon (2006) measure of transportation costs. Transportationcosts should not have a direct effect on FDI, but could have an
at National D
ong Hw
a University L
ibrary on April 5, 2014
http://qje.oxfordjournals.org/D
ownloaded from

CULTURAL BIASES IN ECONOMIC EXCHANGE? 1123
indirect one. Transportation costs act as a barrier to trade, whichmight induce direct investment as a substitute to export. Alter-natively, transportation costs might act as a proxy for other cul-tural barriers not captured by our measure of trust. There is alsoanother, economic not cultural, effect that goes in the oppositedirection: the larger the transportation costs, the larger the FDImonitoring costs. By contrast, common legal rules facilitate FDImonitoring and reduce the importance of transportation costs.Transportation costs have a negative coefficient, which is border-line statistically significant at the 10% level, suggesting that thesecond interpretation is more likely. When we introduce trans-portation costs, the effect of trust drops by 30% and becomes sta-tistically insignificant at conventional levels.
However, when we introduce an indicator variable for com-mon law origin (column (3)), the coefficient of transportation costsdrops almost to zero and becomes statistically insignificant (sug-gesting that it was a proxy for some cultural effect), while theeffect of trust returns significant, but only at the 10% level. Coun-tries with the same origin of the law have more than four times thelevel of FDI in each other. This result is consistent with Bottazzi,Da Rin, and Hellmann (2007), who find that venture capitalistsare more likely to invest in start-ups of countries they trust more.The picture remains unchanged when we control for commonalityof linguistic roots (column (4)).
Finally, in column (5) we report the IV regression wherewe use religious similarity and somatic distance as instruments.When we do so, the coefficient of trust increases dramaticallyand is highly statistically significant. As reported in the table,these two instruments pass the Hansen J-test for overidentify-ing restrictions. It is not surprising that the magnitude of theimpact of trust on FDI is twice as large as the impact on trade.Because FDI are long-term investments, they are more subjectto contract incompleteness than any other trade, even the tradeof differentiated goods. As such, they should be very trust inten-sive. Nevertheless, the large difference between OLS estimatesand IV ones is worrisome. In principle, it could be a problem ofweak instruments. However, the F-test on the coefficients of theinstruments in the first-stage regression is F(2, 328) = 24.34. Al-ternatively, it could be because other cultural factors, correlatedwith religious similarity and somatic distance, greatly affect FDI.In this latter case, this result suggests that cultural relationshipsare an important omitted factor in FDI.
at National D
ong Hw
a University L
ibrary on April 5, 2014
http://qje.oxfordjournals.org/D
ownloaded from

1124 QUARTERLY JOURNAL OF ECONOMICS
VI. INTERNATIONAL PORTFOLIO DIVERSIFICATION
Finally, we investigate whether trust also affects the patternof portfolio investments. By construction, portfolio investmentsinvolve investments in minority positions in foreign companies.Hence, if we do find evidence for the effect of trust, we cannotattribute it to selective behavior by the citizens of the countryhosting the investment. If the French derive a special pleasurefrom hurting the British, they will be unable to do it selectivelywhen the British have invested in a minority position, becausetheir actions would mostly affect the other investors, who repre-sent the vast majority and are unlikely to be British.
This is a very demanding test, because the effect of trust onportfolio allocations is likely to be small for two reasons. First,most portfolio investments are in traded securities that are heav-ily monitored and regulated, where the risk of misappropriationis somewhat limited. Second, we have data only for portfolio allo-cations of mutual funds, which are run by sophisticated managersless likely to be subject to this type of bias.
VI.A. Data
Ideally, we would like to have data on the international di-versification of individual investors; however, these data are notavailable on a consistent basis. Hence, we resort to portfolio datafrom institutional investors.
The data we use are from Morningstar, which kindly providedus with the geographical breakdown of equity investment of Euro-pean mutual funds disaggregated by country of origin. We excludefunds located in Luxembourg and Ireland when they are affiliatedwith companies located in other European countries.
This data set includes all funds that report their positions toMorningstar (including balanced and flexible funds, for example).Note that bond investments are not included. Sample statisticsare reported in Panel E of Table III.
VI.B. Empirical Results
Table VI reports the empirical results. The dependent vari-able is the percentage of the equity portfolio of mutual funds lo-cated in country i that is invested in equity of country j, wherei �= j.
In a traditional portfolio model, the only explanatory vari-ables would be the inverse of the covariance of stock market
at National D
ong Hw
a University L
ibrary on April 5, 2014
http://qje.oxfordjournals.org/D
ownloaded from

CULTURAL BIASES IN ECONOMIC EXCHANGE? 1125
TABLE VIEFFECT OF TRUST ON PORTFOLIO INVESTMENT
OLS OLS OLS OLS OLS IVGMM(1) (2) (3) (4) (5) (6)
Mean trust toward 0.11∗∗∗ 0.14∗∗∗ 0.04 0.15∗∗∗ 0.09∗∗ 0.27∗∗
people in destination (0.04) (0.05) (0.03) (0.05) (0.05) (0.11)country
Inverse cov. of stock market 0.01 −0.00 −0.05 −0.01 −0.05 0.01returns of country of origin (0.03) (0.04) (0.04) (0.04) (0.06) (0.07)and destination
Common language 0.02 −0.02 −0.05∗ −0.02 −0.01 −0.04(0.02) (0.03) (0.03) (0.03) (0.03) (0.03)
Log (distance) −0.06∗∗ −0.04 −0.03 −0.03 −0.04 −0.03(0.03) (0.03) (0.02) (0.02) (0.03) (0.03)
Common border −0.01 −0.02 −0.03 −0.02 −0.05∗ −0.03(0.03) (0.03) (0.02) (0.03) (0.03) (0.03)
Press coverage 0.63∗∗ 0.30 0.67∗∗ 0.57∗∗ 0.90∗∗∗
(0.25) (0.20) (0.26) (0.26) (0.33)Same legal origin 0.08∗∗∗
(0.02)Distance in security law 0.42 0.86∗∗∗ 0.85∗∗∗
regulation∗100 (0.26) (0.26) (0.30)Linguistic common roots 0.14∗∗∗ 0.03
(0.05) (0.08)Observations 108 98 98 98 80 80R2 .371 .402 .519 .412 .407Hansen J-statistic 2.277χ2 p-value .131Test of excluded F(2,44) =
instruments in first stage 10.18
Notes. The dependent variable measures the percentage of net portfolio investment of a given country intoanother country. Specifically, the dependent variable is the stock of cross-border holdings of equities and long-and short-term debt securities valued at market prices prevailing at the end of 2001 (from Morningstar data)divided by the sum of all foreign equity holdings plus market capitalization of foreign liabilities. The sampleincludes all European Union countries. Independent variables are described in the notes to Table II. Allregressions include fixed effects for the country of origin and for the destination country. All columns, exceptcolumn (6), report OLS regressions where the standard errors are corrected for spatial correlation (Conley1999). The specification in column (6) is estimated using the generalized method of moments instrumentalvariables estimator (GMM-IV). The instruments are religious similarity and somatic distance. A test ofoveridentifying restrictions, Hansen’s (1982) J-statistic, is also reported for the IV regression. The test iscalculated from the first-stage residuals of the estimation procedure. We also report the F-test of the excludedinstruments. The first-stage regressions are reported in the Online Appendix of the paper.
Coefficient is statistically different from zero at the ∗∗∗1% , ∗∗5%, and ∗10% level.
returns and the weight of the country i’s stock market in theworld portfolio. Because we include country fixed effects (and thedata are just one cross section), this latter variable is absorbed bythem. The benchmark model would have only the inverse of thecovariance of stock market returns as explanatory variable.
To this benchmark, we add the standard proxies for infor-mation: a dummy for common borders, a dummy for common
at National D
ong Hw
a University L
ibrary on April 5, 2014
http://qje.oxfordjournals.org/D
ownloaded from

1126 QUARTERLY JOURNAL OF ECONOMICS
language, the logarithm of the distance between the two capitals,plus our trust variable.
As column (1) (Table VI) shows, of all the traditional proxiesfor information, only the distance is significant, with a negativesign. The degree of trust country i has toward country j has a pos-itive and statistically significant effect on the percentage of equityinvested by country i in country j. A one-standard-deviation in-crease in the trust of people in country i toward people of countryj increases the portfolio share of country i in country j by 3 per-centage points, which corresponds to an 88% increase in the meanshare. This result is robust to adding an interaction between theimporter- and exporter-country fixed effects and year dummies(not reported).
In column (2), we introduce Portes and Rey’s (2005) measureof press coverage, which represents a proxy for information.23 Asin Portes and Rey (2005), the effect of press coverage is posi-tive and statistically significant. Needless to say, this correlationcould reflect the incentives that national press has in reporting in-formation about countries where national investors invest more.Controlling for this additional variable does not reduce the effectof trust. In fact, the estimated coefficient is larger and remainsstatistically significant at the 5% level, despite the loss of obser-vations.
In column (4), we control also for common origin of the law.Not surprisingly, this variable has a positive and statistically sig-nificant effect on the portfolio investments. This effect is verystrong: on average, a country invests 8 percentage points more inthe equity of another country if they share the same legal origin.As for trade and FDI, the effect of commonality of legal origin cap-tures some of the effect of trust and the coefficient of trust dropsto a third. In this case, it also becomes statistically insignificant.
As previously discussed, the effect of commonality of law isat least in part a cultural effect. To separate the cultural aspectfrom the familiarity component, we follow Vlachos (2004) andconstruct an index of similarity in security law based on the workof La Porta, Lopez-de-Silanes, and Shleifer (2006). This measure iscomputed as the sum of the absolute difference between the score
23. We also try a specification with the other control variables present inPortes and Rey (2005): telephone traffic and foreign bank branches. Unfortunately,the overlap between the two samples is small (six countries) and even tryingto integrate it we end up with only 78 observations. In such a regression, thecoefficient of trust is quantitatively similar, but loses statistical significance.
at National D
ong Hw
a University L
ibrary on April 5, 2014
http://qje.oxfordjournals.org/D
ownloaded from

CULTURAL BIASES IN ECONOMIC EXCHANGE? 1127
in the 21 dimensions of the security law analyzed by La Porta,Lopez-de-Silanes, and Shleifer (2006). If common law capturesthe similarity of legislation, the effect should be captured by thedistance in security law.
As column (4) shows, distance in security law has a posi-tive (not negative as expected) effect on portfolio investment andthis effect is not statistically significant. When we control for thismeasure, the effect of trust returns significant and strong. Hence,commonality of law was in part capturing the effect culture hason trust.
This interpretation is further supported by the results in col-umn (5). When we introduce commonality of linguistic roots, theeffect is positive and statistically significant and the effect of trustis reduced by one-third, but still retains statistical significance.
In column (6), we instrument our measure of trust with com-monality of religion and somatic distance, and the coefficient oftrust more than doubles. As in the previous cases, this changecannot be attributed to weak instruments (the F-test on the co-efficients of the instruments in the first-stage regression is equalto F(2, 64) = 13.53) and the two instruments pass the Hansen J-test for overidentifying restrictions. Thus, either the true effect isobscured in the OLS regression by measurement errors or the in-struments are capturing some other cultural links that also affectportfolio investments. Either way, these results also point to theimportance of trust and cultural links as important and generallyomitted factors in portfolio investments.
Overall, these results suggest that an increase in trust hasan economically and statistically significant effect on the level oftrade, direct investments, and portfolio investments. In most ofour analysis, we have referred to these effects as cultural effectsbecause we could not distinguish among three explanations. Inother words, British expectations about French trustworthinessmay reflect a cultural bias of the British. Alternatively, they couldreflect a cultural idiosyncrasy of the French who enjoy treatingthe British in a different way. Finally, they could be the result of abad equilibrium where French misbehave more with the Britishbecause the British expect them to do so. The latter explanationfinds support in an experiment in which people are shown to beless likely to behave in a trustworthy way when they are toldthat their opponents have low expectations about their level oftrustworthiness (Reuben, Sapienza, and Zingales 2008). Hence,British mistrust may be self-fulfilling.
at National D
ong Hw
a University L
ibrary on April 5, 2014
http://qje.oxfordjournals.org/D
ownloaded from

1128 QUARTERLY JOURNAL OF ECONOMICS
When we talk about trade and FDI, all three explanationsare equally plausible. For portfolio investment, however, the lat-ter two explanations are implausible. French companies cannothurt British investors independently of German or Italian ones.Consequently, when we find that the level of mistrust leads theBritish to invest less in France, it is not because the French behavedifferently toward them but because the British have a biased per-ception of the trustworthiness of the French.
VII. CONCLUSIONS
In this paper we show that trust among European countriesdiffers in systematic ways, which are correlated to their differentcultural heritages. Even after controlling for a country’s institu-tional characteristics and for differences in the information sets,historical and cultural variables affect the propensity of the citi-zens of one country to trust the citizens of another country.
These differences in trust seem to have economically impor-tant effects on trade, portfolio investments, and FDI. These macroresults are confirmed in a micro study by Bottazzi, Da Rin, andHellmann (2006). They find that the trust of a venture capitalist’scountry toward another country positively affects his propensityto invest in a start-up of that country.
Note that both of these results are obtained within the bound-aries of the old European Union, which comprises fairly culturallyhomogeneous nations. Given that culture represents an importantbarrier to integration even inside the old European Union, its ef-fect might be much larger on world trade.
Cultural differences might also explain why Rose (2000) findsthat, historically, currency unions have boosted trade by 235%,whereas Baldwin (2006) finds that the euro currency union in-creased trade by only 9%. The unions studied by Rose (2000) areamong countries with very close cultural roots, such as Belgiumand Luxembourg. By contrast, as this paper documents, there arestill important cultural barriers within the European Union.
Although our results are suggestive that these effects can beeconomically important, they do not allow us to derive any welfareconclusion. First, we identify these effects by looking at within-country variations. As a result, our methodology cannot identifythe impact of the average level of trust on the total volume of tradeand, subsequently, the welfare implications of our results. If weassume that the effect estimated using within-country variationsapplies also between countries, then we have the effect that the
at National D
ong Hw
a University L
ibrary on April 5, 2014
http://qje.oxfordjournals.org/D
ownloaded from

CULTURAL BIASES IN ECONOMIC EXCHANGE? 1129
British perception of the trustworthiness of the Dutch and Frenchmakes the British trade 30% more with the former than with thelatter. Second, we document only effects on quantities, not onwelfare. If it is costless for the British to substitute for Frenchcheese with identical cheese coming from other countries theytrust more, then the utility loss they suffer could be minimal. Ifthat is not the case (and to our taste, you cannot easily substitutea French cheese with a Dutch one), then the welfare losses can besubstantial. Only future research will be able to tell.
EUROPEAN UNIVERSITY INSTITUTE, ENTE L. EINAUDI, AND CEPRNORTHWESTERN UNIVERSITY, NBER, AND CEPRUNIVERSITY OF CHICAGO, NBER, AND CEPR
REFERENCES
Alesina, Alberto, and Eliana La Ferrara, “Who Trusts Others?” Journal of PublicEconomics, 85 (2002), 207–234.
Ammerman, Albert J., and Luca L. Cavalli-Sforza, The Neolithic Transition andthe Genetics of Populations in Europe (Princeton, NJ: Princeton UniversityPress, 1985).
Anderson, James E., and Douglas Marcouiller, “Insecurity and the Pattern ofTrade: An Empirical Investigation,” The Review of Economics and Statistics,84 (2002), 342–352.
Anderson, James E., and Eric van Wincoop, “Gravity with Gravitas: A Solution tothe Border Puzzle,” American Economic Review, 93 (2003), 170–192.
Arrow, Kenneth, 1972, “Gifts and Exchanges,” Philosophy and Public Affairs, 1(1972), 343–362.
Baldwin, Richard, “The Euro’s Trade Effects,” European Central Bank WorkingPaper No. 594, 2006.
Barro, Robert J., and Rachel M. McCleary, “Religion and Economic Growth,” Amer-ican Sociological Review, 68 (2003), 760–781.
Berg, Joyce, John Dickhaut, and Kevin McCabe, “Trust, Reciprocity, and SocialHistory,” Games and Economic Behavior, 10 (1995), 122–142.
Berkowitz, Daniel, Johannes Moenius, and Katharina Pistor, “Trade, Law, andProduct Complexity,” Review of Economics and Statistics, 88 (2006), 363–373.
Bertrand, Marianne, Esther Duflo, and Sendhil Mullainathan, “How Much ShouldWe Trust Differences-in-Differences Estimates?” Quarterly Journal of Eco-nomics, 119 (2004), 249–275.
Biasutti, Renato, Le Razze e i Popoli Della Terra, Vol. 1 (Turin: UTET, 1954).Boisso, Dale, and Michael Ferrantino, “Economic Distance, Cultural Distance, and
Openness: Empirical Puzzles,” Journal of Economic Integration, 12 (1997),456–484.
Bottazzi, Laura, Marco Da Rin, and Thomas Hellmann, “The Importance of Trustfor Investment: Evidence from Venture Capital,” ECGI-Finance WorkingPaper No. 187/2007, 2007.
Burns, Paul, Andrew Myers, and Andy Bailey, “Cultural Stereotypes and Barriersto the Single Market,” 3i/Cranfield European Enterprise Centre, CranfieldSchool of Management Working Paper No. SWP 20/93, 1993.
Cavalli-Sforza, Luca L., Genes, People, and Languages (Berkeley: University ofCalifornia Press, 2000).
Cavalli-Sforza, Luca L., Paolo Menozzi, and Alberto Piazza, The History and Ge-ography of Human Genes (Princeton, NJ: Princeton University Press, 1996).
at National D
ong Hw
a University L
ibrary on April 5, 2014
http://qje.oxfordjournals.org/D
ownloaded from
1130 QUARTERLY JOURNAL OF ECONOMICS
Cohen, Lauren, “Loyalty-Based Portfolio Choice,” Review of Financial Studies, 22(2009), 1213–1245.
Conley, Timothy G., “GMM Estimation with Cross Sectional Dependence,” Journalof Econometrics, 92 (1999), 1–45.
DeBruine, Lisa M., “Facial Resemblance Enhances Trust,” Proceedings of the RoyalSociety of London B, 269 (2002), 1307–1312.
De Groot, Henri L. F., Gert-Jan Linders, Piet Rietveld, and Uma Subramanian,“The Institutional Determinants of Bilateral Trade Patterns,” Kyklos, 57(2004), 103–123.
Fearon, James D., and David D. Laitin, “Ethnicity, Insurgency, and Civil War,”American Political Science Review, 97 (2003), 75–90.
Fernandez, Raquel, and Alessandra Fogli, “Culture: An Empirical Investigation ofBeliefs, Work, and Fertility,” NBER Working Paper #W11268, 2007.
Fitzpatrick, Gary L., and Marilyn J. Modlin, Direct-Line Distances (Metuchen, NJ:Scarecrow Press, 1986).
Frankel, Jeffrey, Ernesto Stein, and Shang-jin Wei, “Trading Blocs and the Amer-icas: The Natural, the Unnatural, and the Super-natural,” Journal of Devel-opment Economics, 47 (1995), 61–95.
Friedman, Jonathan, “Myth, History, and Political Identity,” Cultural Anthropol-ogy, 7 (1992), 194–210.
Giuliano, Paola, “Living Arrangements in Western Europe: Does Cultural OriginMatter?” Journal of the European Economic Association, 5 (2007), 927–952.
Giuliano, Paola, Antonio Spilimbergo, and Giovanni Tonon, “Genetic, Cultural andGeographical Distances,” IZA Discussion Paper No. 2229, 2006.
Glaeser, Edward, David Laibson, Jose A. Scheinkman, and Christine L. Soutter,“Measuring Trust,” Quarterly Journal of Economics, 115 (2000), 811–846.
Greif, Avner, “Contract Enforceability and Economic Institutions in Early Trade:The Maghribi Traders’ Coalition,” American Economic Review, 83 (1993), 525–548.
Guiso, Luigi, Paola Sapienza, and Luigi Zingales, “People’s Opium? Religion andEconomic Attitudes,” Journal of Monetary Economics, 50 (2003), 225–282.
——, “Cultural Biases in Economic Exchange,” NBER Working Paper No. 1105,2004a.
——, “The Role of Social Capital in Financial Development,” American EconomicReview, 94 (2004b), 526–556.
——, “Does Culture Affect Economic Outcomes?” Journal of Economic Perspectives,20 (2006), 23–48.
——, “Long Term Persistence,” University of Chicago, Working Paper, 2008a.——, “Social Capital as Good Culture,” Journal of the European Economic Associ-
ation, 6 (2008b), 295–320.——, “Trusting the Stock Market,” Journal of Finance, 63 (2008c), 2557–2600.Hansen, Lars Peter, “Large Sample Properties of Generalized Method of Moments
Estimators,” Econometrica, 50 (1982), 1029–1054.Helpman, Elhanan, and Paul Krugman, Market Structure and Foreign Trade
(Cambridge, MA: MIT Press, 1985).La Porta, Rafael, Florencio Lopez-de-Silanes, and Andrei Shleifer, “What Works
in Securities Laws?” Journal of Finance, 61 (2006), 1–32.La Porta, Rafael, Florencio Lopez-de-Silanes, Andrei Shleifer, and Robert Vishny,
“Law and Finance,” Journal of Political Economy, 106 (1998), 1113–1155.Linders, Gert-Jan M., and Henri L. F. de Groot, “Estimation of the Gravity Equa-
tion in the Presence of Zero Flows,” Tinbergen Institute Discussion Paper,2006.
McEvily, Bill, Roberto A. Weber, Cristina Bicchieri, and Violet Ho, “Can GroupsBe Trusted? An Experimental Study of Collective Trust,” in The Handbook ofTrust Research, Reinhard Bachmann and Akbar Zaheer, eds. (Northampton,MA: Edward Elgar, 2006).
Menozzi, Paolo, Alberto Piazza, and Luca L. Cavalli-Sforza, “Synthetic Maps ofHuman Gene Frequencies in Europe,” Science, 201 (1978), 786–792.
Morse, Adair, and Sophie Shive, “Patriotism in Your Portfolio,” University of Michi-gan, Working Paper, 2006.
Nicita, Alessandro, and Marcelo Olarreaga, “Trade, Production, and ProtectionDatabase, 1976–2004,” World Bank Economic Review, 21 (2007), 165–171.
at National D
ong Hw
a University L
ibrary on April 5, 2014
http://qje.oxfordjournals.org/D
ownloaded from

CULTURAL BIASES IN ECONOMIC EXCHANGE? 1131
Nunn, Nathan, “Relationship-Specificity, Incomplete Contract, and the Pattern ofTrade,” Quarterly Journal of Economics, 122 (2007), 569–600.
Portes, Richard, and Helene Rey, “The Determinants of Cross Border EquityFlows,” Journal of International Economics, 65 (2005), 269–296.
Rauch, James, “Networks Versus Markets in International Trade,” Journal ofInternational Economics, 41 (1999), 7–35.
Rauch, James, and Vitor Trindade, “Ethnic Chinese Networks in InternationalTrade,” Review of Economics and Statistics, 84 (2002), 116–130.
Reuben, Ernesto, Paola Sapienza, and Luigi Zingales, “Is Mistrust Self-Fulfilling?”University of Chicago, Working Paper, 2008.
Reynolds, John, Bruce S. Weir, and C. Clark Cockerham, “Estimation of theCoancestry Coefficient: Basis for a Short-Term Genetic Distance,” Genetics,105 (1983), 767–779.
Rose, Andrew K., “One Money, One Market: Estimating the Effect of CommonCurrencies on Trade,” Economic Policy, 30 (2000), 9–45.
Rose, Andrew K., and Tom D. Stanley, “A Meta-Analysis of the Effect of CommonCurrencies on International Trade,” Journal of Economic Surveys, 19 (2005),347–365.
Sapienza, Paola, Anna Toldra, and Luigi Zingales, “Understanding Trust,” NBERWorking Paper No. 13387, 2007.
Spolaore, Enrico, and Romain Wacziarg, “The Diffusion of Development,” QuarterlyJournal of Economics, 124 (2009), 469–529.
Stock, James H., and Motohiro Yogo, “Testing for Weak Instruments in Linear IVRegression,” NBER Technical Working Paper No. 284, 2002.
Tabellini, Guido, “Culture and Institutions: Economic Development in the Regionsof Europe,” IGIER Working Paper No. 292, 2007.
——, “The Scope of Cooperation,” Quarterly Journal of Economics, 123 (2008),905–950.
Vlachos, Jonas, “Does Regulatory Harmonization Increase Bilateral Asset Hold-ings?” Stockholm University, Working Paper, 2004.
at National D
ong Hw
a University L
ibrary on April 5, 2014
http://qje.oxfordjournals.org/D
ownloaded from