crossflowfiltration methodhandbook · filtration. inthischapter...
TRANSCRIPT
Cross Flow FiltrationMethod Handbook
Page intentionally left blank
Table of Contents51 Introduction ..........................................................................................................61.1 What is cross flow filtration? ...........................................................................................................71.2 Key features of CFF ..............................................................................................................................81.3 CFF application areas .........................................................................................................................
92 Cross flow filtration systems .............................................................................102.1 System configuration ..........................................................................................................................122.2 Filters for cross flow filtration ..........................................................................................................142.3 System volumes and process capacity ......................................................................................152.4 Systems from GE Healthcare ..........................................................................................................
163 Process design and operation ...........................................................................173.1 Process considerations ......................................................................................................................193.2 Filter selection ........................................................................................................................................213.3 Filter preparation ..................................................................................................................................233.4 Operating parameters .......................................................................................................................263.5 Recovering product .............................................................................................................................283.6 Cleaning and testing filters ..............................................................................................................323.7 Scaling up processes ..........................................................................................................................
334 Optimizing CFF processes ..................................................................................344.1 Optimizing process parameters ....................................................................................................404.2 Optimizing yield .....................................................................................................................................
425 Cell harvesting ......................................................................................................435.1 Introduction .............................................................................................................................................445.2 Cell harvesting process ......................................................................................................................475.3 Membrane and cartridge selection ..............................................................................................495.4 Operating parameters .......................................................................................................................
526 Cell and lysate clarification ................................................................................536.1 Introduction .............................................................................................................................................566.2 Membrane and cartridge selection ..............................................................................................586.3 Operating parameters .......................................................................................................................596.4 Clarification strategy examples .....................................................................................................606.4.1 Mammalian cells ............................................................................................................................626.4.2 Bacterial cells ...................................................................................................................................646.4.3 Yeast ....................................................................................................................................................
667 Concentration and diafiltration ........................................................................677.1 Introduction .............................................................................................................................................697.2 Product and process considerations ...........................................................................................
Cross flow filtration Method Handbook 29-0850-76 AA 3
Table of Contents
727.3 Membrane selection ............................................................................................................................
73A Abbreviations and glossary ...............................................................................
79Index .......................................................................................................................
4 Cross flow filtration Method Handbook 29-0850-76 AA
Table of Contents
1 Introduction
About this handbookThe Cross Flow Filtration Method Handbook gives a general introduction to the principlesand applications of cross flow filtration using systems and filters from GE Healthcare.Detailed instructions for preparing, using, cleaning and storing particular filters areprovided with each filter.
About this chapterThis chapter introduces the principles, basic terminology and applications of cross flowfiltration.
In this chapterThis chapter contains the following sections:
See pageSection
61.1 What is cross flow filtration?
71.2 Key features of CFF
81.3 CFF application areas
Cross flow filtration Method Handbook 29-0850-76 AA 5
1 Introduction
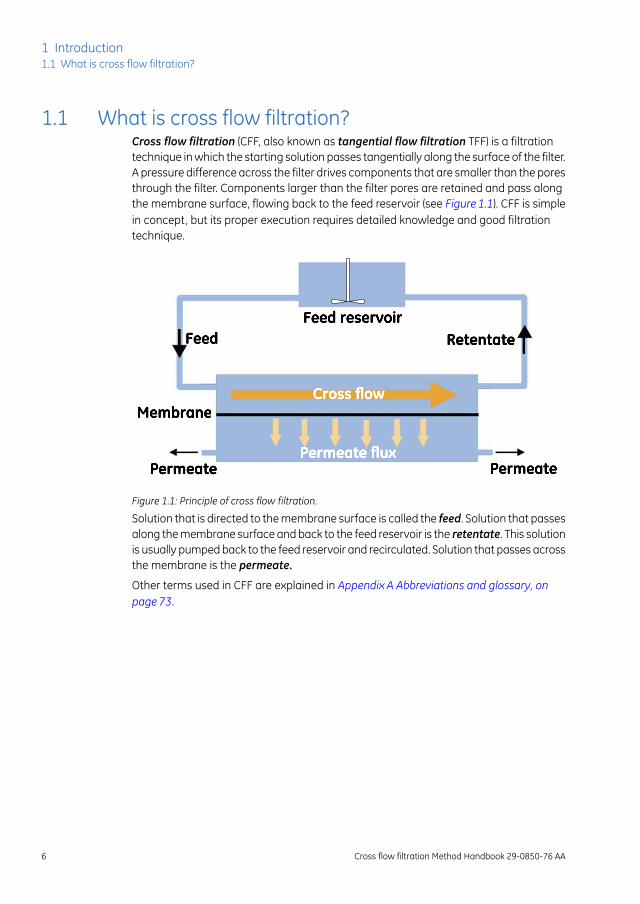
1.1 What is cross flow filtration?Cross flow filtration (CFF, also known as tangential flow filtration TFF) is a filtrationtechnique in which the starting solution passes tangentially along the surface of the filter.A pressure difference across the filter drives components that are smaller than the poresthrough the filter. Components larger than the filter pores are retained and pass alongthe membrane surface, flowing back to the feed reservoir (see Figure 1.1). CFF is simplein concept, but its proper execution requires detailed knowledge and good filtrationtechnique.
Figure 1.1: Principle of cross flow filtration.
Solution that is directed to the membrane surface is called the feed. Solution that passesalong the membrane surface and back to the feed reservoir is the retentate. This solutionis usually pumped back to the feed reservoir and recirculated. Solution that passes acrossthe membrane is the permeate.
Other terms used in CFF are explained in Appendix A Abbreviations and glossary, onpage 73.
6 Cross flow filtration Method Handbook 29-0850-76 AA
1 Introduction1.1 What is cross flow filtration?

1.2 Key features of CFF
FeaturesA key feature of CFF is the flow of fluid along the membrane surface that sweeps awaythe build up of material on the filter surface and reduces fouling of the filter. In addition,retentate solution can easily be recirculated, allowing thorough processing of large vol-umes of solution.
Differences between CFF andnormal flow filtration
CFF differs from normal flow filtration (where the starting material is simply passedthrough the filters, also known as dead-end filtration or direct flow filtration) in threemain ways:
• CFF filters use membranes exclusively, while conventional filtration may use mem-branes, paper, or other materials such as glass fiber to separate components in afeed stream.
• CFF supports recirculation of the retentate solution. In normal flow filtration, the feedusually passes once through the filter.
• In a CFF system, the retentate remains as a solution and may be recovered directly.Retentate recovery is relatively uncommon in normal flow filtration and requires re-suspension of material collected on the filter.
Cross flow filtration Method Handbook 29-0850-76 AA 7
1 Introduction1.2 Key features of CFF
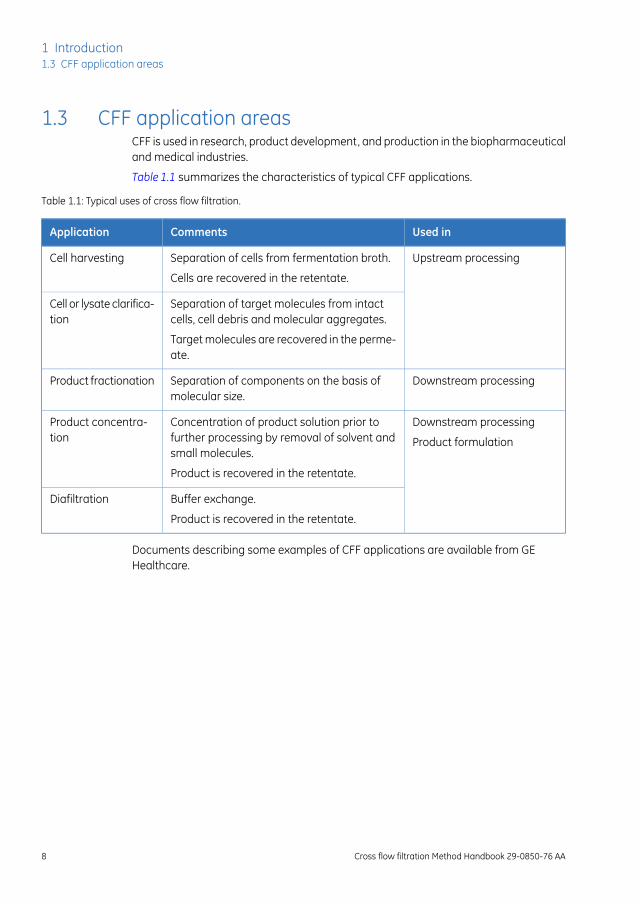
1.3 CFF application areasCFF is used in research, product development, and production in the biopharmaceuticaland medical industries.
Table 1.1 summarizes the characteristics of typical CFF applications.
Table 1.1: Typical uses of cross flow filtration.
Used inCommentsApplication
Upstream processingSeparation of cells from fermentation broth.Cell harvesting
Cells are recovered in the retentate.
Separation of target molecules from intactcells, cell debris and molecular aggregates.
Cell or lysate clarifica-tion
Target molecules are recovered in the perme-ate.
Downstream processingSeparation of components on the basis ofmolecular size.
Product fractionation
Downstream processingConcentration of product solution prior tofurther processing by removal of solvent andsmall molecules.
Product concentra-tion Product formulation
Product is recovered in the retentate.
Buffer exchange.Diafiltration
Product is recovered in the retentate.
Documents describing some examples of CFF applications are available from GEHealthcare.
8 Cross flow filtration Method Handbook 29-0850-76 AA
1 Introduction1.3 CFF application areas
2 Cross flow filtration systems
About this chapterThis chapter describes the essential components of CFF systems and introduces systemsfrom GE Healthcare.
In this chapterThis chapter contains the following sections:
See pageSection
102.1 System configuration
122.2 Filters for cross flow filtration
142.3 System volumes and process capacity
152.4 Systems from GE Healthcare
Cross flow filtration Method Handbook 29-0850-76 AA 9
2 Cross flow filtration systems
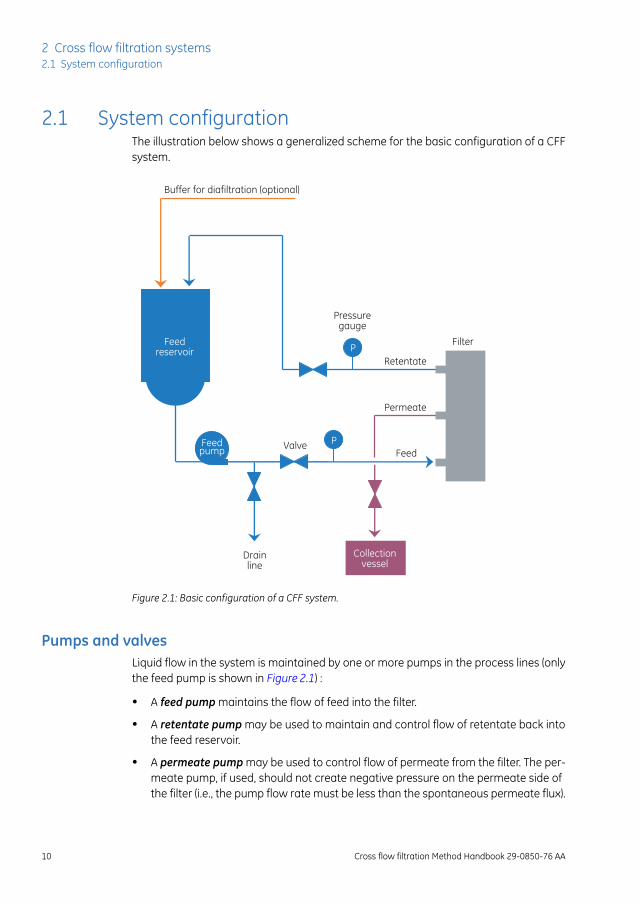
2.1 System configurationThe illustration below shows a generalized scheme for the basic configuration of a CFFsystem.
Feedreservoir
Feedpump
Drainline
Collectionvessel
ValveFeed
Permeate
Retentate
Buffer for diafiltration (optional)
Pressuregauge
FilterP
P
Figure 2.1: Basic configuration of a CFF system.
Pumps and valvesLiquid flow in the system is maintained by one or more pumps in the process lines (onlythe feed pump is shown in Figure 2.1) :
• A feed pump maintains the flow of feed into the filter.
• A retentate pump may be used to maintain and control flow of retentate back intothe feed reservoir.
• A permeate pump may be used to control flow of permeate from the filter. The per-meate pump, if used, should not create negative pressure on the permeate side ofthe filter (i.e., the pump flow rate must be less than the spontaneous permeate flux).
10 Cross flow filtration Method Handbook 29-0850-76 AA
2 Cross flow filtration systems2.1 System configuration

• A transfer pump may be used in washing and diafiltration applications to add liquid(usually buffer) to the feed reservoir at a controlled rate.
Flow in the various process lines may also be regulated by valves with flow restrictors.Together, the controlled pump rates and valve restriction create the pressure across themembrane that drives the filtration process.
Pressure sensorsPressure sensors in the feed and retentate lines are essential for monitoring and control-ling the process. A pressure sensor on the permeate side may also be used to monitorpermeate pressure.
Flow sensorsMeasurement of flow rates for feed solution, retentate and/or permeate and any additionof fluid to the feed reservoir is necessary for monitoring and controlling process conditionsduring filtration. Flow sensors are placed at strategic points in the system.
Reservoir level sensorsA level sensor in the feed reservoir monitors and controls the amount of liquid in thereservoir.
Air sensorsAn air sensor located in the feed stream allows continuous monitoring for air bubblesin the feed prevents the introduction of air into the filter. An air sensor can also be usedin the transfer line to detect when the transfer reservoir is empty.
Additional sensorsTemperature, pH, UV absorbance and conductivity sensors may be included in the systemaccording to the requirements of the specific process.
Cross flow filtration Method Handbook 29-0850-76 AA 11
2 Cross flow filtration systems2.1 System configuration
2.2 Filters for cross flow filtrationFilters for CFF may be classified according to filter configuration or filter pore size.
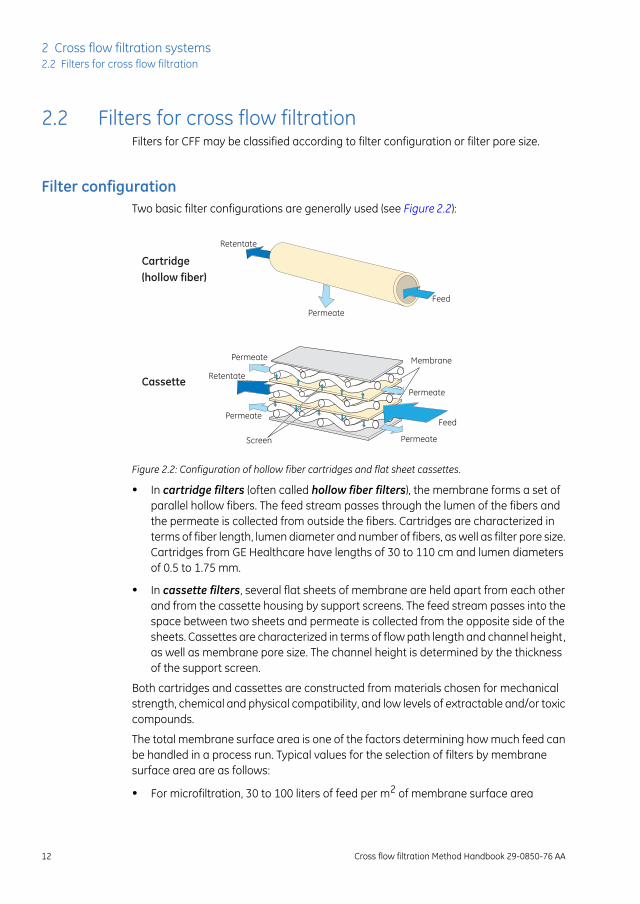
Filter configurationTwo basic filter configurations are generally used (see Figure 2.2):
Membrane
Membrane
Feed
Feed
Permeate
Permeate
Permeate
Permeate
Permeate
Screen
Cassette
Cartridge(hollow fiber)
Retentate
Retentate
Figure 2.2: Configuration of hollow fiber cartridges and flat sheet cassettes.
• In cartridge filters (often called hollow fiber filters), the membrane forms a set ofparallel hollow fibers. The feed stream passes through the lumen of the fibers andthe permeate is collected from outside the fibers. Cartridges are characterized interms of fiber length, lumen diameter and number of fibers, as well as filter pore size.Cartridges from GE Healthcare have lengths of 30 to 110 cm and lumen diametersof 0.5 to 1.75 mm.
• In cassette filters, several flat sheets of membrane are held apart from each otherand from the cassette housing by support screens. The feed stream passes into thespace between two sheets and permeate is collected from the opposite side of thesheets. Cassettes are characterized in terms of flow path length and channel height,as well as membrane pore size. The channel height is determined by the thicknessof the support screen.
Both cartridges and cassettes are constructed from materials chosen for mechanicalstrength, chemical and physical compatibility, and low levels of extractable and/or toxiccompounds.
The total membrane surface area is one of the factors determining how much feed canbe handled in a process run. Typical values for the selection of filters by membranesurface area are as follows:
• For microfiltration, 30 to 100 liters of feed per m2 of membrane surface area
12 Cross flow filtration Method Handbook 29-0850-76 AA
2 Cross flow filtration systems2.2 Filters for cross flow filtration
• For ultrafiltration, 100 to 200 liters of feed per m2 of membrane surface area
Filter pore sizeTwo classes of filters are distinguished on the basis of filter pore size, which also distin-guishes between application areas. In both cases, the pore size is expressed as an aver-age value. The range of actual pore sizes in a given filter determines the selectivity ofthe filter.
Microfiltration filtersFilters with pore sizes of 0.1 μm and larger are classified as microfilters. In CFF applicationsthe pore size is usually in the range 0.1 to 1 μm. These membranes are used for separationof cultured cells from the growth medium (broth), as well as for removal of particulatematerial in numerous biopharmaceutical processes.
Ultrafiltration filtersUltrafiltration membranes have pore sizes in the range 20 to 100 nm, and are generallycharacterized in terms of the nominal molecular weight cutoff (NMWC), which is themolecular weight of the largest globular protein that can pass through the membrane.NMWC values range from 1 to 100 kD (kiloDalton). These filters are used for concentratingand fractionating protein streams, virus concentration, desalting and buffer exchange.The objective of most ultrafiltration processes is to retain soluble macromolecules suchas proteins above a certain size, while allowing smaller molecules such as salts, aminoacids, and mono- or disaccharides to pass through the membrane.
Filters from GE HealthcareGE Healthcare supplies cartridges for both microfiltration and ultrafiltration, and cassettesfor ultrafiltration. The choice of filter type to use for a given application is made in thefirst place on the filtration requirements: thus cartridges may be used for all applications,while cassettes are suitable for handling proteins.
See Section 3.2 Filter selection, on page 19 for more detailed guidelines concerning filterselection. Additional information is available from GE Healthcare.
Cross flow filtration Method Handbook 29-0850-76 AA 13
2 Cross flow filtration systems2.2 Filters for cross flow filtration

2.3 System volumes and process capacity
Minimum working volumeThe minimum working volume of a CFF system represents the amount of feed/retentatefluid required to operate the system at the desired cross flow rate without drawing airinto the feed pump. The minimum working volume is determined by the design of thesystem (feed and retentate tubing volume, reservoir bottom design), the filter hold-upvolume, and the cross flow rate. It is important to consider the minimum working volumeof a system in the design of a CFF process and in particular to confirm that the finaltarget retentate volume is not less than the system's minimum working volume.
Hold-up volumeThe term hold-up volume refers to the volume of liquid in the filtration system. For somepurposes it is useful to distinguish between the filter hold-up volume (the volume in thefilter itself) and the systemhold-up volume (the volume in the system tubing and pumps).The filter and system should be chosen with the smallest hold-up volume that is compat-ible with other performance requirements in the process.
Process capacityThe system process capacity (the volume of starting material that can be processed inone run) should be chosen in relation to the planned volume of starting material. Processcapacity is partly a function of system size and design, but also varies according to thetendency of starting material to foul the filter. Using a high capacity system for a smallsample volume will lead to unnecessary loss of material in the system dead volume. Forprocesses that will be scaled up for production, it will be necessary to switch betweendifferent systems one or more times during process development (see Table 2.1). CFFprocesses using systems from GE Healthcare are scalable, making transitions betweensystems straightforward.
14 Cross flow filtration Method Handbook 29-0850-76 AA
2 Cross flow filtration systems2.3 System volumes and process capacity

2.4 Systems from GE HealthcareCFF systems from GE Healthcare cover a full range of filtration capacity from laboratoryresearch to production, and offer different levels of monitoring and control from manualto fully automated systems. Customized systems can also be provided.
Table2.1 summarizes the characteristics of the available systems. Additional informationincluding system application matrix and selection guides is available from GE Healthcare.
Table 2.1: Cross flow filtration systems from GE Healthcare.
ApplicationsScaleSystem
ResearchProcess development
LaboratoryÄKTACrossflow™
ResearchProcess developmentSmall-scale production
Laboratory to pilotÄKTA™ flux
ManufacturingPilot to productionUniFlux™
Cross flow filtration Method Handbook 29-0850-76 AA 15
2 Cross flow filtration systems2.4 Systems from GE Healthcare
3 Process design and operation
About this chapterThis chapter describes design and operation of a CFF process.
In this chapterThis chapter contains the following sections:
See pageSection
173.1 Process considerations
193.2 Filter selection
213.3 Filter preparation
233.4 Operating parameters
263.5 Recovering product
283.6 Cleaning and testing filters
323.7 Scaling up processes
16 Cross flow filtration Method Handbook 29-0850-76 AA
3 Process design and operation
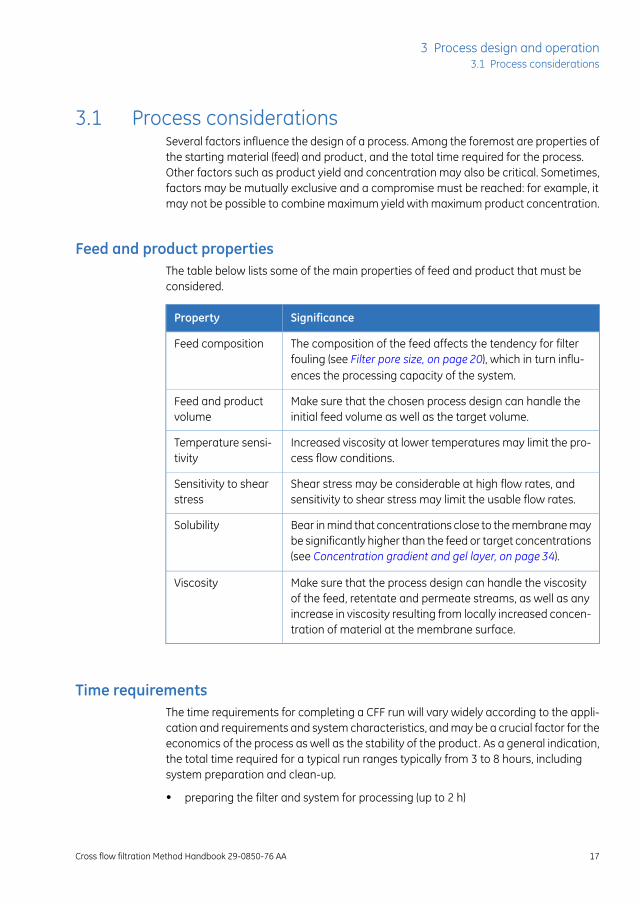
3.1 Process considerationsSeveral factors influence the design of a process. Among the foremost are properties ofthe starting material (feed) and product, and the total time required for the process.Other factors such as product yield and concentration may also be critical. Sometimes,factors may be mutually exclusive and a compromise must be reached: for example, itmay not be possible to combine maximum yield with maximum product concentration.
Feed and product propertiesThe table below lists some of the main properties of feed and product that must beconsidered.
SignificanceProperty
The composition of the feed affects the tendency for filterfouling (see Filter pore size, on page 20), which in turn influ-ences the processing capacity of the system.
Feed composition
Make sure that the chosen process design can handle theinitial feed volume as well as the target volume.
Feed and productvolume
Increased viscosity at lower temperatures may limit the pro-cess flow conditions.
Temperature sensi-tivity
Shear stress may be considerable at high flow rates, andsensitivity to shear stress may limit the usable flow rates.
Sensitivity to shearstress
Bear in mind that concentrations close to the membrane maybe significantly higher than the feed or target concentrations(see Concentration gradient and gel layer, on page 34).
Solubility
Make sure that the process design can handle the viscosityof the feed, retentate and permeate streams, as well as anyincrease in viscosity resulting from locally increased concen-tration of material at the membrane surface.
Viscosity
Time requirementsThe time requirements for completing a CFF run will vary widely according to the appli-cation and requirements and system characteristics, and may be a crucial factor for theeconomics of the process as well as the stability of the product. As a general indication,the total time required for a typical run ranges typically from 3 to 8 hours, includingsystem preparation and clean-up.
• preparing the filter and system for processing (up to 2 h)
Cross flow filtration Method Handbook 29-0850-76 AA 17
3 Process design and operation3.1 Process considerations
• conducting the filtration process (dependent on application)
• cleaning and flushing the system and filter for storage (up to 2 h)
Other considerationsOther important factors in designing a CFF process include:
• Product yield - how important is it to maximize yield of the product?
• Product concentration - how important is it to obtain product at a high concentration?
• Selectivity - how important is the purity of the product?
• Long-term filter stability - what is the working life of the filter under process condi-tions?
• Downstream processing - how will the product be used in the next processing step?
18 Cross flow filtration Method Handbook 29-0850-76 AA
3 Process design and operation3.1 Process considerations

3.2 Filter selectionThe choice of filter between microfiltration and ultrafiltration and between cartridgesand cassettes is governed by the nature of the application.
Technique andfilter
Separation principleApplication
Microfiltration(cartridge)
Cells are separated from solublemolecules.
Cell harvesting
Cells and cell debris are separated fromsoluble molecules.
Cell or lysate clarifica-tion
Ultrafiltration(cartridge orcassette)
Macromolecules are separated on thebasis of size.
Protein fractionation
Macromlecules are separated from lowmolecular weight buffer components.
Concentration and diafil-tration
Within that framework, filters are chosen from consideration of selectivity, filter poresize and protein binding.
Filter selectivityFilter selectivity describes the ability of a filter to separate particles or molecular specieson the basis of size. Filters with a narrow pore size distribution will be highly selective,while a broader pore size distribution will give a less selective filter.
Harvesting and cell clarification applications involve separation of relatively large particles(cells and/or cell debris) from macromolecules, so that high selectivity is generally notrequired. Lysate clarification on the other hand may make more stringent demands,since the lysate will contain a wide range of proteins and other macromolecules. Themost important factor is that the target protein can pass freely through the filter so thatyields are not compromised.
Filter selectivity is also not critical for diafiltration, where a macromolecular product isseparated from buffer components. The controlling factor here is that the target proteinis completely retained by the filter, so that product is not lost in the permeate. An ultra-filtration filter with a nominal molecular weight cut-off (NMWC) that is 3× to 5× less thanthe molecular weight of the target molecule is generally recommended.
Cross flow filtration Method Handbook 29-0850-76 AA 19
3 Process design and operation3.2 Filter selection

Filter pore sizeAll filters will tend to become fouled (blocked by particulate material accumulating inthe filter pores), especially during applications such as lysate clarification involving par-ticulate starting material. Fouling will shorten the time for which a filter can be usedbefore it must be cleaned, and therefore restrict the maximum processing capacity perrun. The choice of filter pore size is important for minimizing filter fouling. In general, filterswith smaller pores will show less tendency to fouling, because particulate materialcannot penetrate and block the pores.
Use the guidelines in the table below for selecting filters for harvesting and clarificationapplications:
Filter pore sizeApplication
0.2 to 0.65 µmMammalian cell harvesting
0.1 µmYeast and bacterial cell harvesting
NMWC about 10× target molecule sizeCell and lysate clarification
Protein bindingThe level of protein binding depends upon the material in the filter and the proteincharacteristics, and increases with increasing hydrophobicity. Protein binding is seenas a reduction in yield that is not accounted for by product remaining in the retentate.Normally, protein binding remains insignificant at the laboratory scale, but for low NMWCultrafiltration membranes it can be an indicator of a propensity towards filter fouling.
For both clarification and diafiltration applications, protein binding to the filter usuallybecomes an issue when attempting to process small amounts of protein. In such casesit is important to select a filter with low binding tendency for the target protein, and tochoose buffer conditions that minimize binding.
20 Cross flow filtration Method Handbook 29-0850-76 AA
3 Process design and operation3.2 Filter selection
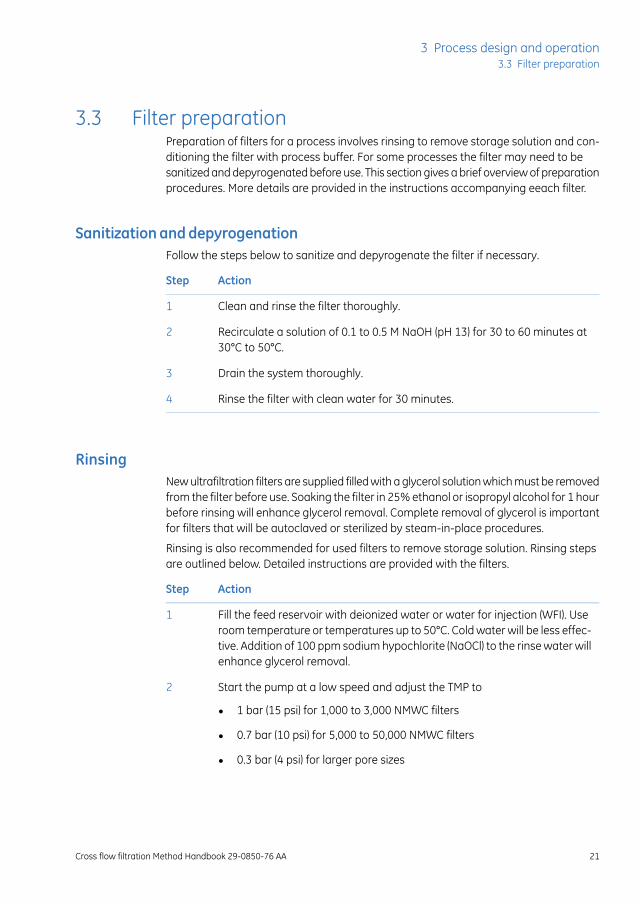
3.3 Filter preparationPreparation of filters for a process involves rinsing to remove storage solution and con-ditioning the filter with process buffer. For some processes the filter may need to besanitized and depyrogenated before use. This section gives a brief overview of preparationprocedures. More details are provided in the instructions accompanying eeach filter.
SanitizationanddepyrogenationFollow the steps below to sanitize and depyrogenate the filter if necessary.
ActionStep
Clean and rinse the filter thoroughly.1
Recirculate a solution of 0.1 to 0.5 M NaOH (pH 13) for 30 to 60 minutes at30°C to 50°C.
2
Drain the system thoroughly.3
Rinse the filter with clean water for 30 minutes.4
RinsingNew ultrafiltration filters are supplied filled with a glycerol solution which must be removedfrom the filter before use. Soaking the filter in 25% ethanol or isopropyl alcohol for 1 hourbefore rinsing will enhance glycerol removal. Complete removal of glycerol is importantfor filters that will be autoclaved or sterilized by steam-in-place procedures.
Rinsing is also recommended for used filters to remove storage solution. Rinsing stepsare outlined below. Detailed instructions are provided with the filters.
ActionStep
Fill the feed reservoir with deionized water or water for injection (WFI). Useroom temperature or temperatures up to 50°C. Cold water will be less effec-tive. Addition of 100 ppm sodium hypochlorite (NaOCl) to the rinse water willenhance glycerol removal.
1
Start the pump at a low speed and adjust the TMP to2
• 1 bar (15 psi) for 1,000 to 3,000 NMWC filters
• 0.7 bar (10 psi) for 5,000 to 50,000 NMWC filters
• 0.3 bar (4 psi) for larger pore sizes
Cross flow filtration Method Handbook 29-0850-76 AA 21
3 Process design and operation3.3 Filter preparation
ActionStep
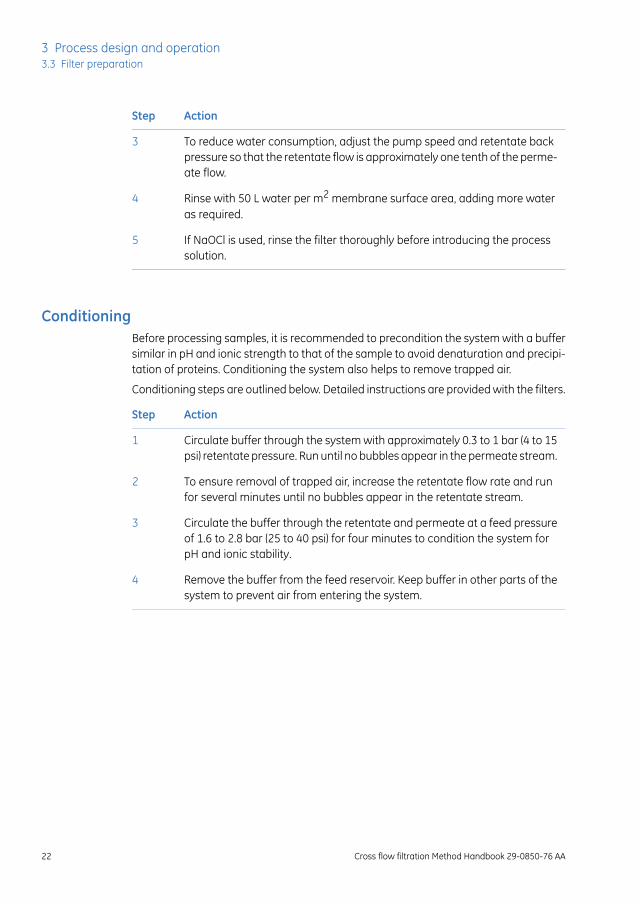
To reduce water consumption, adjust the pump speed and retentate backpressure so that the retentate flow is approximately one tenth of the perme-ate flow.
3
Rinse with 50 L water per m2 membrane surface area, adding more wateras required.
4
If NaOCl is used, rinse the filter thoroughly before introducing the processsolution.
5
ConditioningBefore processing samples, it is recommended to precondition the system with a buffersimilar in pH and ionic strength to that of the sample to avoid denaturation and precipi-tation of proteins. Conditioning the system also helps to remove trapped air.
Conditioning steps are outlined below. Detailed instructions are provided with the filters.
ActionStep
Circulate buffer through the system with approximately 0.3 to 1 bar (4 to 15psi) retentate pressure. Run until no bubbles appear in the permeate stream.
1
To ensure removal of trapped air, increase the retentate flow rate and runfor several minutes until no bubbles appear in the retentate stream.
2
Circulate the buffer through the retentate and permeate at a feed pressureof 1.6 to 2.8 bar (25 to 40 psi) for four minutes to condition the system forpH and ionic stability.
3
Remove the buffer from the feed reservoir. Keep buffer in other parts of thesystem to prevent air from entering the system.
4
22 Cross flow filtration Method Handbook 29-0850-76 AA
3 Process design and operation3.3 Filter preparation

3.4 Operating parametersA CFF process may be controlled by an interplay of several operating parameters accord-ing to the specific process requirements. The most important parameters are
• Pressure at various points in the system
• Flow rate at various points in the system
• Process time
Pressure and flow ratesLiquid pressure and flow rates are essential factors for controlling and monitoring a CFFprocess.
PressurePressure may be monitored in the feed stream, the retentate stream or the permeatestream. Two differential pressure measurements are generally used, ΔP and transmem-brane pressure (TMP).
• ΔP is the difference in pressure between the feed and retentate streams, and canbe used to control cross flow.
∆P = Feed pressure – Retentate pressure
TMP =
• TMP is the difference in pressure between the feed/retentate and permeate streams,and represents the driving force for transfer of material across the filter. TMP canbe used to control flux.
∆P = Feed pressure – Retentate pressure
TMP = Feed pressure – Retentate pressure2
– Permeate pressure
Flow ratesFlow rates may be monitored at various points. The sum of the flow rates out of the filteron the retentate and permeate sides is equal to the flow rate of feed into the filter. Theretentate flow rate is also known as the cross flow rate or recirculation rate. The per-meate flow rate (the rate of liquid flow through the filter membrane) is known as theflux.
Flux is commonly expressed in units of liters per m2 of membrane per hour (LMH). Thisvalue is scalable, meaning that it can be kept constant when the process is scaled up.
For hollow fiber filters, the cross flow rate through the fiber lumen is often expressed asthe shear rate1 in units of s-1, which is a function of the flow rate per fiber and the di-ameter of the fiber lumen.
1 Do not confuse shear rate with shear stress. Shear stress is the force that can disrupt cells ordenature proteins under conditions of rapid flow. Shear rate is a liquid flow rate that influencesbut is not equivalent to shear stress.
Cross flow filtration Method Handbook 29-0850-76 AA 23
3 Process design and operation3.4 Operating parameters
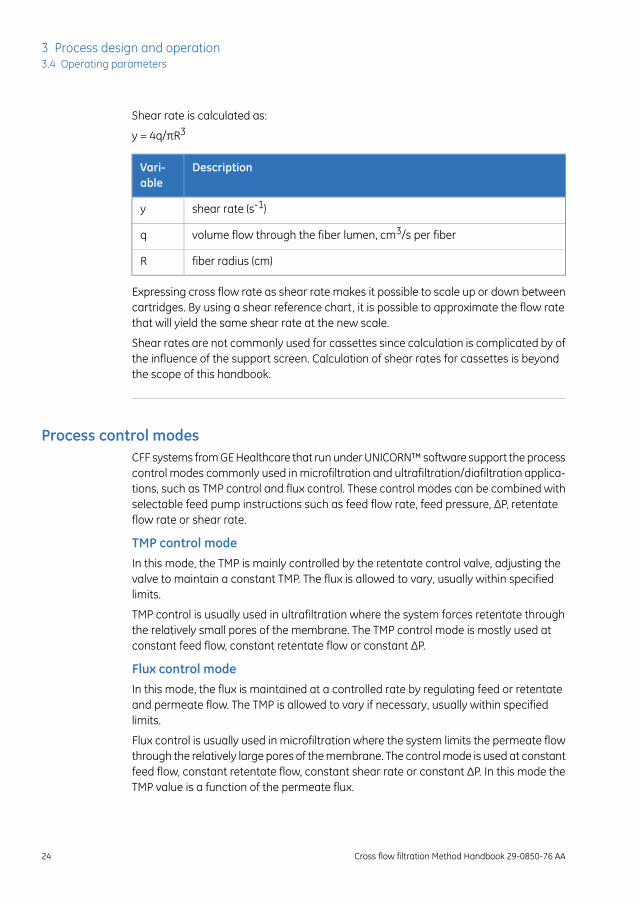
Shear rate is calculated as:
y = 4q/πR3
DescriptionVari-able
shear rate (s-1)y
volume flow through the fiber lumen, cm3/s per fiberq
fiber radius (cm)R
Expressing cross flow rate as shear rate makes it possible to scale up or down betweencartridges. By using a shear reference chart, it is possible to approximate the flow ratethat will yield the same shear rate at the new scale.
Shear rates are not commonly used for cassettes since calculation is complicated by ofthe influence of the support screen. Calculation of shear rates for cassettes is beyondthe scope of this handbook.
Process control modesCFF systems from GE Healthcare that run under UNICORN™ software support the processcontrol modes commonly used in microfiltration and ultrafiltration/diafiltration applica-tions, such as TMP control and flux control. These control modes can be combined withselectable feed pump instructions such as feed flow rate, feed pressure, ΔP, retentateflow rate or shear rate.
TMP control modeIn this mode, the TMP is mainly controlled by the retentate control valve, adjusting thevalve to maintain a constant TMP. The flux is allowed to vary, usually within specifiedlimits.
TMP control is usually used in ultrafiltration where the system forces retentate throughthe relatively small pores of the membrane. The TMP control mode is mostly used atconstant feed flow, constant retentate flow or constant ΔP.
Flux control modeIn this mode, the flux is maintained at a controlled rate by regulating feed or retentateand permeate flow. The TMP is allowed to vary if necessary, usually within specifiedlimits.
Flux control is usually used in microfiltration where the system limits the permeate flowthrough the relatively large pores of the membrane. The control mode is used at constantfeed flow, constant retentate flow, constant shear rate or constant ΔP. In this mode theTMP value is a function of the permeate flux.
24 Cross flow filtration Method Handbook 29-0850-76 AA
3 Process design and operation3.4 Operating parameters
During flux control it is common that the feed pressure is so low that the permeate pumpcreates a negative pressure in the permeate stream. An automated system should includecontrol procedures to handle this situation, for example by temporarily reducing the re-tentate flow to increase the retentate and permeate pressure.
Process timeProcess time from start to finish (including system preparation and clean-up) may be ofcrucial importance for the economics of a process, or for the quality of a product thatdisplays limited stability (for example, cell lysates often contain enzymes that may degradethe product, and it is important to work fast in the early separation stages). Practicalconsiderations, such as being able to complete the process in one working day, mayalso be relevant.
Process time requirements may influence the choice of control mode as well as thechoice of system and filter.
Cross flow filtration Method Handbook 29-0850-76 AA 25
3 Process design and operation3.4 Operating parameters
3.5 Recovering productProduct is recovered either from the retentate or the permeate according to the type ofapplication. Recovery in the permeate can be maximized at the expense of productconcentration by washing the retentate with buffer as a final step in the filtration. Recov-ery in the retentate is affected by accumulation of material (including product) in a highconcentration layer on the membrane surface and by liquid remaining on wetted surfacesof tubing and reservoirs.
Recovering product from themembrane surface
Product may be recovered from the membrane surface without adding buffer or permeateto the system. This enables the most highly concentrated product to be obtained at theexpense of some yield loss.
Typically, product recovery from the membrane surface involves the following steps:
ActionStep
At the end of the process of harvesting cells or concentrating a protein, closethe permeate valve or reduce the feed pressure to 0.3 bar (5 psi).
1
Reduce the cross flow rate to 1/10 of the recommended processing crossflow rate and reduce the mixer speed.
2
Circulate the feed for 15 minutes. This will help to recover product that hasaccumulated on the surface of the membrane.
3
Pump the product to the collection vessel.4
Flushing out product with bufferFlushing product out of the filtration system with buffer enables the highest yield to beobtained at the expense of concentration. In this technique, the product is first collectedfrom the system, then a small volume of buffer or permeate is added to the system toflush out the residual product from the feed retentate loop.
This approach can be combined with recovery of product from the membrane surface.
Typically, product flushing involves the following steps:
ActionStep
As the CFF process nears completion, decrease the pump speed and mixerspeed to minimize flow rate, vortexing in the feed tank, and the possibilityfor product foaming.
1
26 Cross flow filtration Method Handbook 29-0850-76 AA
3 Process design and operation3.5 Recovering product
ActionStep
When the slightly over concentrated volume is reached, pump the concen-trated product to the collection vessel.
2
Add an appropriate volume of buffer to the reservoir. The buffer should becirculated for two to three minutes with the permeate valve closed to helpbring the residual product into suspension.
3
Pump the buffer solution from the system into the collection vessel.4
Cross flow filtration Method Handbook 29-0850-76 AA 27
3 Process design and operation3.5 Recovering product
3.6 Cleaning and testing filters
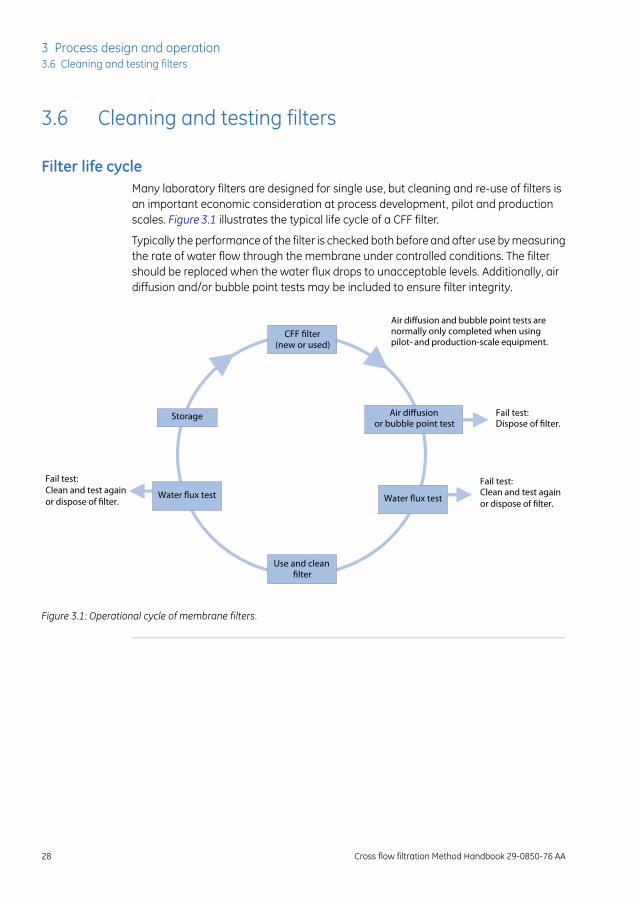
Filter life cycleMany laboratory filters are designed for single use, but cleaning and re-use of filters isan important economic consideration at process development, pilot and productionscales. Figure 3.1 illustrates the typical life cycle of a CFF filter.
Typically the performance of the filter is checked both before and after use by measuringthe rate of water flow through the membrane under controlled conditions. The filtershould be replaced when the water flux drops to unacceptable levels. Additionally, airdiffusion and/or bubble point tests may be included to ensure filter integrity.
CFF �lter(new or used)
Air di�usionor bubble point test
Water �ux test
Use and clean �lter
Water �ux test
Storage
Fail test: Fail test:Clean and test againor dispose of �lter.
Fail test:Dispose of �lter.
Air di�usion and bubble point tests are normally only completed when using pilot- and production-scale equipment.
Clean and test againor dispose of �lter.
Figure 3.1: Operational cycle of membrane filters.
28 Cross flow filtration Method Handbook 29-0850-76 AA
3 Process design and operation3.6 Cleaning and testing filters
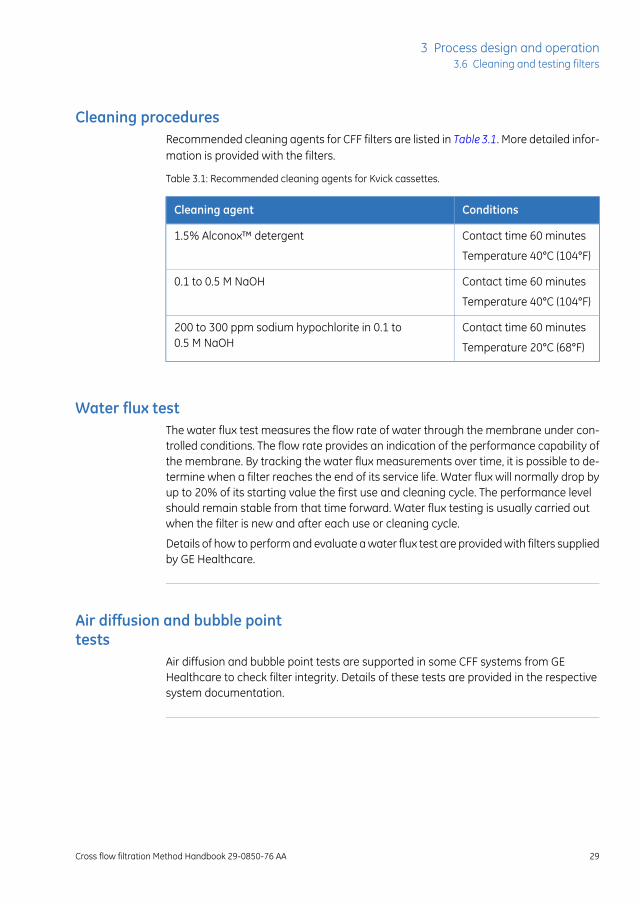
Cleaning proceduresRecommended cleaning agents for CFF filters are listed in Table3.1. More detailed infor-mation is provided with the filters.
Table 3.1: Recommended cleaning agents for Kvick cassettes.
ConditionsCleaning agent
Contact time 60 minutes1.5% Alconox™ detergent
Temperature 40°C (104°F)
Contact time 60 minutes0.1 to 0.5 M NaOH
Temperature 40°C (104°F)
Contact time 60 minutes200 to 300 ppm sodium hypochlorite in 0.1 to0.5 M NaOH Temperature 20°C (68°F)
Water flux testThe water flux test measures the flow rate of water through the membrane under con-trolled conditions. The flow rate provides an indication of the performance capability ofthe membrane. By tracking the water flux measurements over time, it is possible to de-termine when a filter reaches the end of its service life. Water flux will normally drop byup to 20% of its starting value the first use and cleaning cycle. The performance levelshould remain stable from that time forward. Water flux testing is usually carried outwhen the filter is new and after each use or cleaning cycle.
Details of how to perform and evaluate a water flux test are provided with filters suppliedby GE Healthcare.
Air diffusion and bubble pointtests
Air diffusion and bubble point tests are supported in some CFF systems from GEHealthcare to check filter integrity. Details of these tests are provided in the respectivesystem documentation.
Cross flow filtration Method Handbook 29-0850-76 AA 29
3 Process design and operation3.6 Cleaning and testing filters
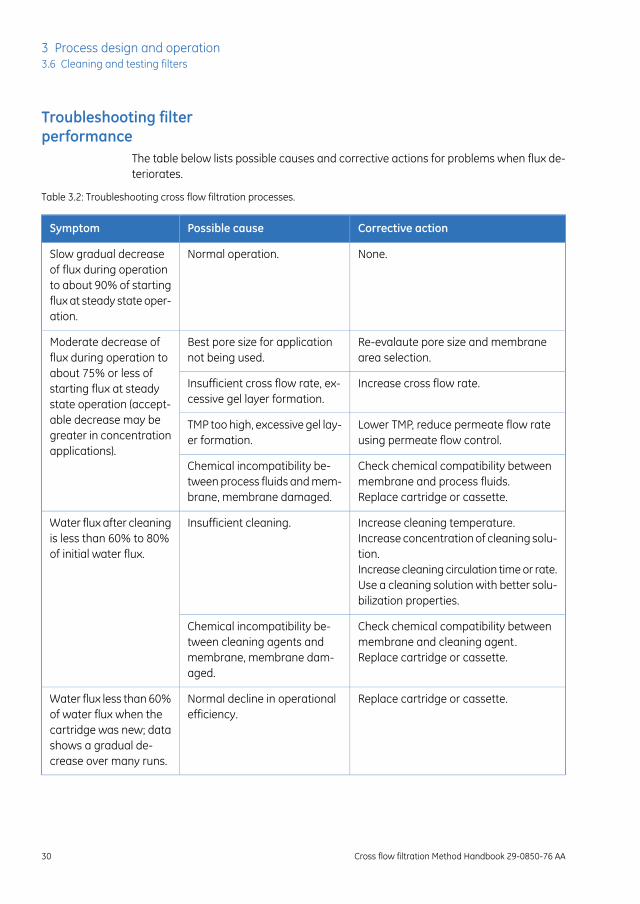
Troubleshooting filterperformance
The table below lists possible causes and corrective actions for problems when flux de-teriorates.
Table 3.2: Troubleshooting cross flow filtration processes.
Corrective actionPossible causeSymptom
None.Normal operation.Slow gradual decreaseof flux during operationto about 90% of startingflux at steady state oper-ation.
Re-evalaute pore size and membranearea selection.
Best pore size for applicationnot being used.
Moderate decrease offlux during operation toabout 75% or less ofstarting flux at steadystate operation (accept-able decrease may begreater in concentrationapplications).
Increase cross flow rate.Insufficient cross flow rate, ex-cessive gel layer formation.
Lower TMP, reduce permeate flow rateusing permeate flow control.
TMP too high, excessive gel lay-er formation.
Check chemical compatibility betweenmembrane and process fluids.Replace cartridge or cassette.
Chemical incompatibility be-tween process fluids and mem-brane, membrane damaged.
Increase cleaning temperature.Increase concentration of cleaning solu-tion.Increase cleaning circulation time or rate.Use a cleaning solution with better solu-bilization properties.
Insufficient cleaning.Water flux after cleaningis less than 60% to 80%of initial water flux.
Check chemical compatibility betweenmembrane and cleaning agent.Replace cartridge or cassette.
Chemical incompatibility be-tween cleaning agents andmembrane, membrane dam-aged.
Replace cartridge or cassette.Normal decline in operationalefficiency.
Water flux less than 60%of water flux when thecartridge was new; datashows a gradual de-crease over many runs.
30 Cross flow filtration Method Handbook 29-0850-76 AA
3 Process design and operation3.6 Cleaning and testing filters
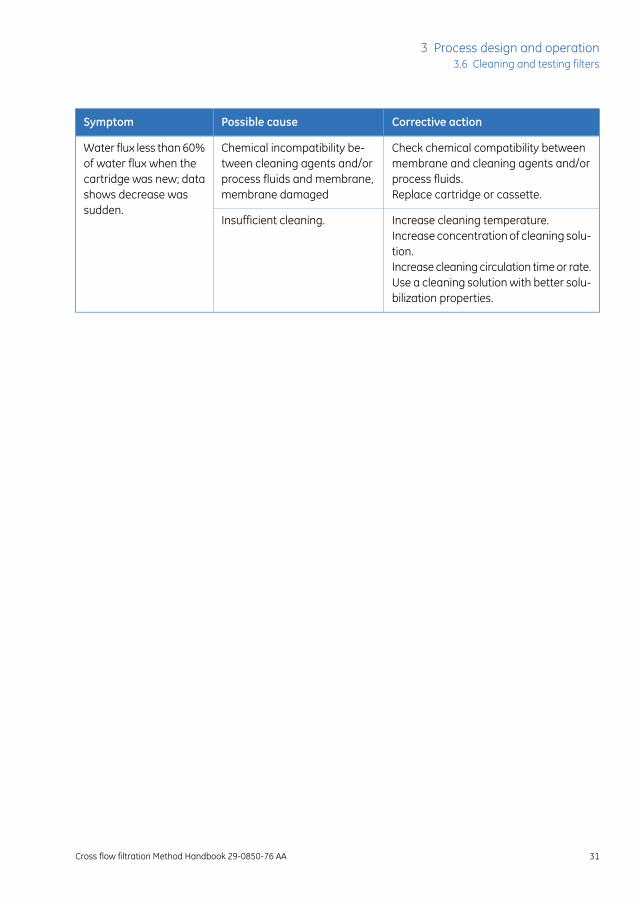
Corrective actionPossible causeSymptom
Check chemical compatibility betweenmembrane and cleaning agents and/orprocess fluids.Replace cartridge or cassette.
Chemical incompatibility be-tween cleaning agents and/orprocess fluids and membrane,membrane damaged
Water flux less than 60%of water flux when thecartridge was new; datashows decrease wassudden.
Increase cleaning temperature.Increase concentration of cleaning solu-tion.Increase cleaning circulation time or rate.Use a cleaning solution with better solu-bilization properties.
Insufficient cleaning.
Cross flow filtration Method Handbook 29-0850-76 AA 31
3 Process design and operation3.6 Cleaning and testing filters

3.7 Scaling up processesThe ability to scale a process from the laboratory to manufacturing is a key factor inprocess development. Normally, the scale-up sequence is completed in multiple steps:lab scale to pilot scale, and pilot scale to production scale. Reasonable scale-up incre-ments are typically 5 to 20 times.
Scaling up a process involves increasing the filter area in order to handle larger volumesof starting material without significantly changing process conditions. The followingparameters should be kept constant where possible:
• Ratio of filter area to feed volume
• Fiber or cassette path length
• Channel height (cassettes) or lumen size (hollow fiber cartridges)
• Membrane characteristics (pore size, selectivity, materials)
• Cross flow rate per unit filter area
• TMP
• Temperature
• Feed concentration
• Process steps and sequence
32 Cross flow filtration Method Handbook 29-0850-76 AA
3 Process design and operation3.7 Scaling up processes
4 Optimizing CFF processes
About this chapterThis chapter considers optimization of CFF processes.
In this chapterThis chapter contains the following sections:
See pageSection
344.1 Optimizing process parameters
404.2 Optimizing yield
Process parameters may be optimized with respect to several factors, such as capacity,total process time, product yield and purity and so on.
Cross flow filtration Method Handbook 29-0850-76 AA 33
4 Optimizing CFF processes

4.1 Optimizing process parametersRecommendations in this section apply mainly to concentration and diafiltration appli-cations. While similar principles apply to process optimization for other applications,details will differ depending on the starting material and on whether the product is re-covered in the permeate or retentate.
Concentration gradient and gellayer
One factor that influences the optimization of process parameters is the tendency toform a concentration gradient of material (and in extreme cases a compact gel-likelayer) on the surface of the filter membrane.
During filtration, molecules and particles that do not pass through the membrane accu-mulate to some extent at the membrane surface, forming a concentration gradient(Figure 4.1A). The concentration gradient layer reduces the flux compared to water orbuffer flux. Turbulent liquid flow across the membrane surface helps to wash the con-centrated material back into the retentate, reducing but not eliminating the accumulationeffect. Decreasing TMP can lower the concentration gradient layer and its effects onflux. Increasing the cross flow rate helps to redistribute concentrated solutes back intothe bulk feed stream and maintain flux.
As the concentration gradient becomes more pronounced, the highest concentrationof material at the surface of the membrane will tend to form a gel-like layer, markedlyimpeding permeate flow (Figure 4.1B). Formation of a gel layer is seen as a reduction inthe rate of increase of flux as the TMP is increased. The gel layer also has a considerableeffect on the filtration process, influencing both filter efficiency and selectivity. To controlthe filtration process, steps must be taken to minimize the formation of a gel layer.
The following operating conditions reduce the risk of gel layer formation:
• Low TMP
• High cross flow rate
• Low feed concentration
Optimization of a CFF process should include determination of the combination of TMPand cross flow rate that gives the highest flux rate without forming a gel layer.
34 Cross flow filtration Method Handbook 29-0850-76 AA
4 Optimizing CFF processes4.1 Optimizing process parameters

Feed FeedA B
Permeate Permeate
Figure 4.1: During processing, a gradient of increasing concentration of solutes forms between thebulk feed flow and the membrane surface (A). If the permeate flow is too high in relation to the crossflow, the concentration at the membrane surface may become high enough to form a gel-like layer(B).
Flux versus TMPIn CFF, the key optimization parameter is the flux rate as a function of TMP. For a givencross flow rate, TMP controls flux at the beginning of a run. If a gel layer forms, increasesin TMP will not result in increases in flux and will provide little if any performance gain.The optimal TMP range for efficient and economic operation is just before the gel layerstarts influencing the flux (Figure 4.2).
Gel layer control region
Optimal TMP range
1FCretaW
TMP
Perm
eate
flux
Figure 4.2: Optimal TMP range under a constant cross flow rate.
Cross flow filtration Method Handbook 29-0850-76 AA 35
4 Optimizing CFF processes4.1 Optimizing process parameters
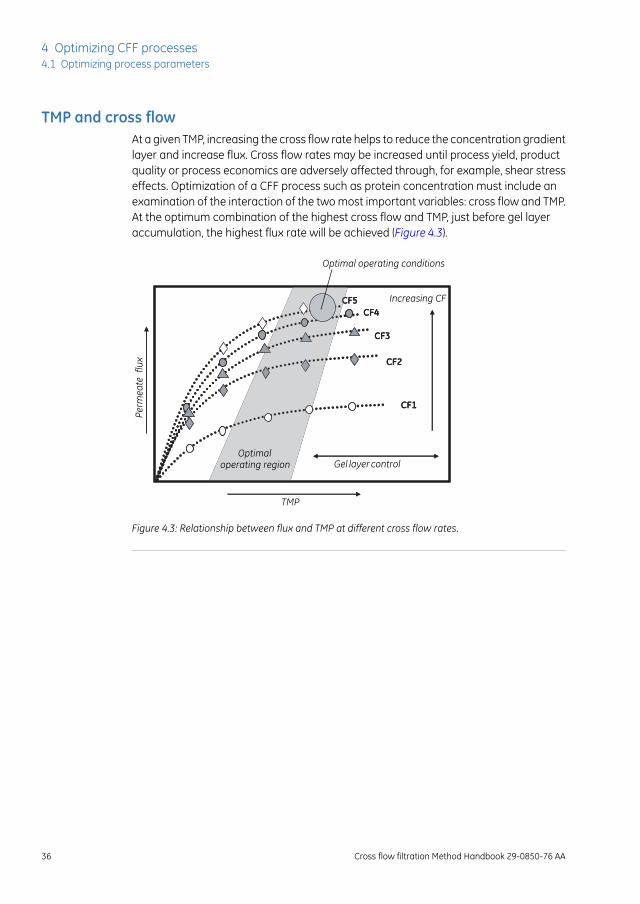
TMP and cross flowAt a given TMP, increasing the cross flow rate helps to reduce the concentration gradientlayer and increase flux. Cross flow rates may be increased until process yield, productquality or process economics are adversely affected through, for example, shear stresseffects. Optimization of a CFF process such as protein concentration must include anexamination of the interaction of the two most important variables: cross flow and TMP.At the optimum combination of the highest cross flow and TMP, just before gel layeraccumulation, the highest flux rate will be achieved (Figure 4.3).
CF2
CF1
CF5CF4
CF3
Optimal operating region
CF2
CF1
CF5CF4
CF3
Optimal operating conditions
Increasing CF
Gel layer control Optimal
operating region
TMP
Perm
eate
flu
x
Figure 4.3: Relationship between flux and TMP at different cross flow rates.
36 Cross flow filtration Method Handbook 29-0850-76 AA
4 Optimizing CFF processes4.1 Optimizing process parameters

TMP scoutingTMP scouting (sometimes known as TMP excursions) is an important part of processoptimization. Increasing TMP when ultrafiltering pure water results in a proportional in-crease in flux. With a process fluid that contains solutes the rate of increase in flux dropsas the TMP increases and the concentration gradient restricts passage of liquid throughthe filter. At high TMP values, formation of a gel layer effectively blocks the filter and nofurther increase in flux is seen. Higher cross flow rates help to prevent the formation ofa gel layer, allowing higher flux rates to be achieved before the flux becomes independentof TMP.
TMP scouting involves measuring the interdependence of cross flow rate, TMP and fluxin order to determine the optimum conditions for filtration, where flux is high but is stilldependent on TMP. The standard procedure is to perform a TMP scouting experimentin which a series of TMP setpoints is measured at different cross flow rates. From theseexperiments the effect on flux is evaluated, and optimal cross flow and TMP may beidentified.
As an example, Figure 4.4 shows the results of TMP scouting for a solution of BSA at aconcentration of 30 g/L and 150 g/L (representing the initial and target concentrationsrespectively). Flux is measured at 6 TMP points and 3 cross flow rates with permeaterecycled to the feed reservoir to maintain a steady state.
At the low protein concentration, flux increases with TMP at all cross flow rates and thereis no clear optimal setting. At the high protein concentration, however, the curves flattenout at high TMP values, indicating that the formation of a concentration gradient is be-ginning to restrict flux across the membrane. With this information, it is possible to designa process control scheme that maintains a high flux value for a reasonable process timeand stable process conditions.
75
100
125
150
175
200
225
250
0,75 1,00 1,25 1,50 1,75 2,00 2,25 2,50 2,75 3,00
TMP excursionsBSA 30 g/L
Flu
x [
LMH
]
TMP [ bar]
CF 42ml/min CF 33 ml/min CF 25 ml/min
30
40
50
60
70
80
90
0,75 1,00 1,25 1,50 1,75 2,00 2,25 2,50 2,75
TMP excursionsBSA 150g/L
Flu
x [
LM
H]
TMP [ bar]
CF 42 ml/min CF 33 ml/min CF 25 ml/min
optimal
Figure 4.4: TMP scouting results at two concentrations of BSA (left 30 g/L, right 150 g/L). Note thedifference in flux rate scale at the different protein concentrations.
Cross flow filtration Method Handbook 29-0850-76 AA 37
4 Optimizing CFF processes4.1 Optimizing process parameters
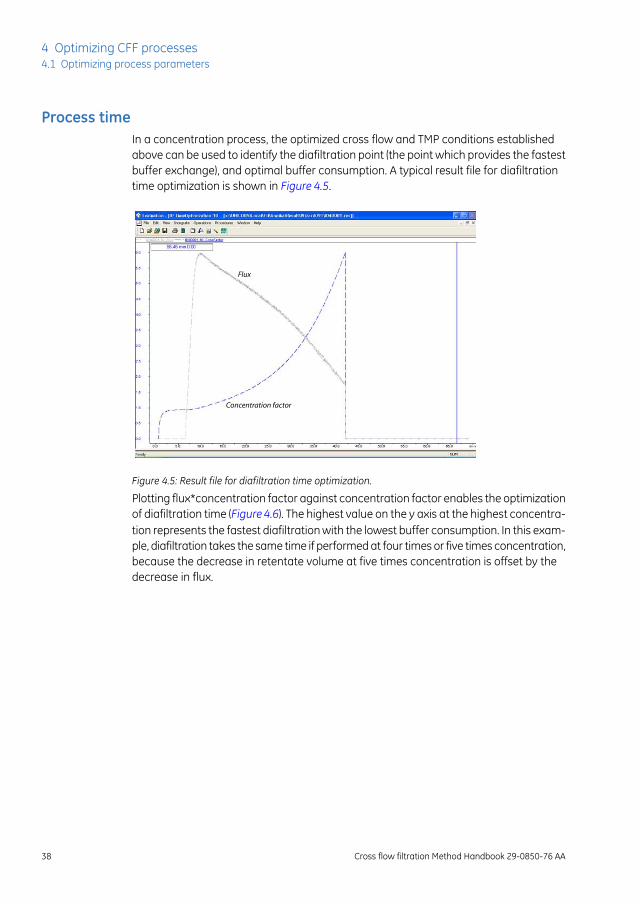
Process timeIn a concentration process, the optimized cross flow and TMP conditions establishedabove can be used to identify the diafiltration point (the point which provides the fastestbuffer exchange), and optimal buffer consumption. A typical result file for diafiltrationtime optimization is shown in Figure 4.5.
Concentration factor
Flux
Figure 4.5: Result file for diafiltration time optimization.
Plotting flux*concentration factor against concentration factor enables the optimizationof diafiltration time (Figure4.6). The highest value on the y axis at the highest concentra-tion represents the fastest diafiltration with the lowest buffer consumption. In this exam-ple, diafiltration takes the same time if performed at four times or five times concentration,because the decrease in retentate volume at five times concentration is offset by thedecrease in flux.
38 Cross flow filtration Method Handbook 29-0850-76 AA
4 Optimizing CFF processes4.1 Optimizing process parameters
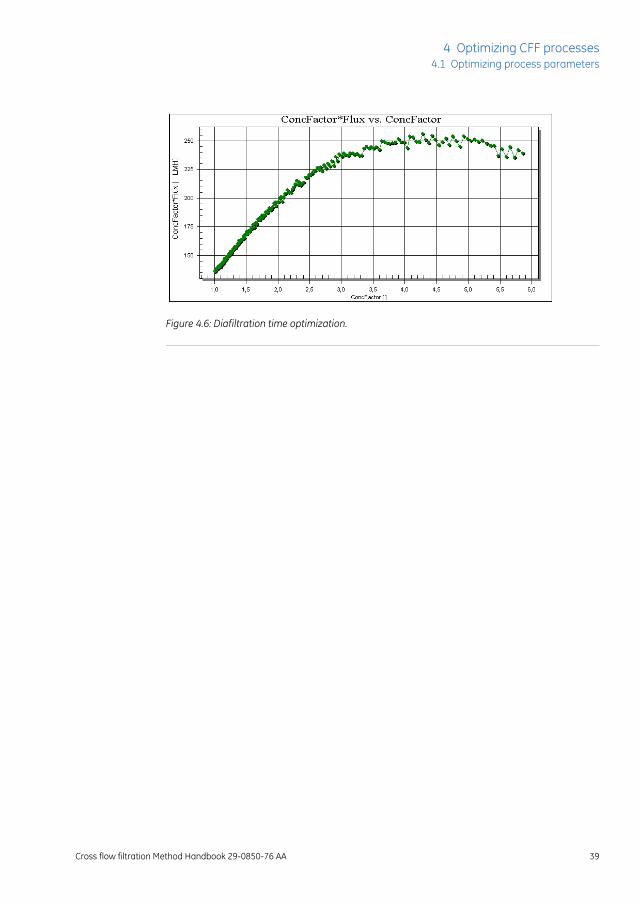
Figure 4.6: Diafiltration time optimization.
Cross flow filtration Method Handbook 29-0850-76 AA 39
4 Optimizing CFF processes4.1 Optimizing process parameters
4.2 Optimizing yieldOptimizing a laboratory filtration process for product yield ensures efficient use of labresources as well as accurate projections for scaling to pilot equipment. In productioncontexts, optimizing yield can have a major impact on process economics.
In addition to filter selection, the key factors that influence product yield are:
• Non-recoverable product
• Product losses through denaturation and degradation
Non-recoverable productThe system design can affect product yield if it impedes recovery of the product. Poorlydesigned systems include long tubing runs, unnecessarily wide tubing, poor tank drainage,and other non-recoverable volume such as poorly positioned drain valves. Even in well-designed systems, some retentate product remains on the wetted surfaces of the tubingand reservoir unless the system is flushed with buffer. The choice of recovery optiondepends on the relative importance of total yield and final product concentration:
• Draining the system without flushing leaves some process fluid in the system butrecovers product at the highest concentration.
• Flushing the retentate side of the system maximizes product recovery at the expenseof concentration.
Denaturation and degradationLoss of product through denaturation and/or degradation may occur as a result of ex-cessive shear stress, unsuitable temperature or enzymatic action during the filtrationand recovery process.
Shear stressThe sensitivity of biomolecules to shear stress generally increases with molecular size.Most proteins are relatively resistant to denaturation through shear stress. If the shearsensitivity of the product is not known, a quick feasibility study may be performed bycirculating the product through the feed-retentate path and monitoring the bioactivityas a function of process time. Where feasible, low pressures and low pump speeds shouldbe used to minimize shear stresses in the flow path.
TemperatureFor heat sensitive proteins the process solution temperature can be modified in a numberof ways during processing to optimize product yield:
• Precondition the system with cooled buffer before starting
• Lower the feed temperature before beginning the filtration process
40 Cross flow filtration Method Handbook 29-0850-76 AA
4 Optimizing CFF processes4.2 Optimizing yield

• Use chilled buffer during diafiltration
• Use low pressure and low pump speed to reduce heat generation in the flow path
• Use a low ratio of feed volume to filter surface area to shorten process time
• Place the system in a cold room
• Use a heat exchanger or tank jacket
Enzymatic actionProteolytic enzymes released during cell culture or lysis may follow the target proteinthrough the filtration process and cause degradation and loss of yield. The effect maybe more pronounced in ultrafiltration or diafiltration applications, where both enzymesand target proteins may be concentrated together in the concentration layer at the filtersurface or in the retentate.
Enzymatic activity may be reduced by:
• Including enzyme inhibitors in the sample
• Using a low ratio of feed volume to filter surface area to shorten process time
• Lowering the temperature of the process
• Adjusting buffer conditions (ionic strength, pH, metal ions, etc.) to minimize enzymeactivity
Cross flow filtration Method Handbook 29-0850-76 AA 41
4 Optimizing CFF processes4.2 Optimizing yield

5 Cell harvesting
About this chapterThis chapter considers the use of CFF for harvesting cultured cells.
In this chapterThis chapter contains the following sections:
See pageSection
435.1 Introduction
445.2 Cell harvesting process
475.3 Membrane and cartridge selection
495.4 Operating parameters
42 Cross flow filtration Method Handbook 29-0850-76 AA
5 Cell harvesting
5.1 IntroductionCell harvesting is the process of separating cells from the fermentation broth in whichthe cells are grown. Hollow fiber microfiltration or higher NMWC ultrafiltration cartridgesmay be used effectively for cell harvesting. The harvested cells are recovered in the re-tentate.
Successful cell harvesting relies on knowledge of parameters such as:
• Robustness of the cultured cells
• Starting volume and concentration of cells
• Desired finished concentration and volume
• Desired yield and integrity of the cells
Cross flow filtration Method Handbook 29-0850-76 AA 43
5 Cell harvesting5.1 Introduction
5.2 Cell harvesting processThe cell harvesting process involves both concentration and washing of the cells.
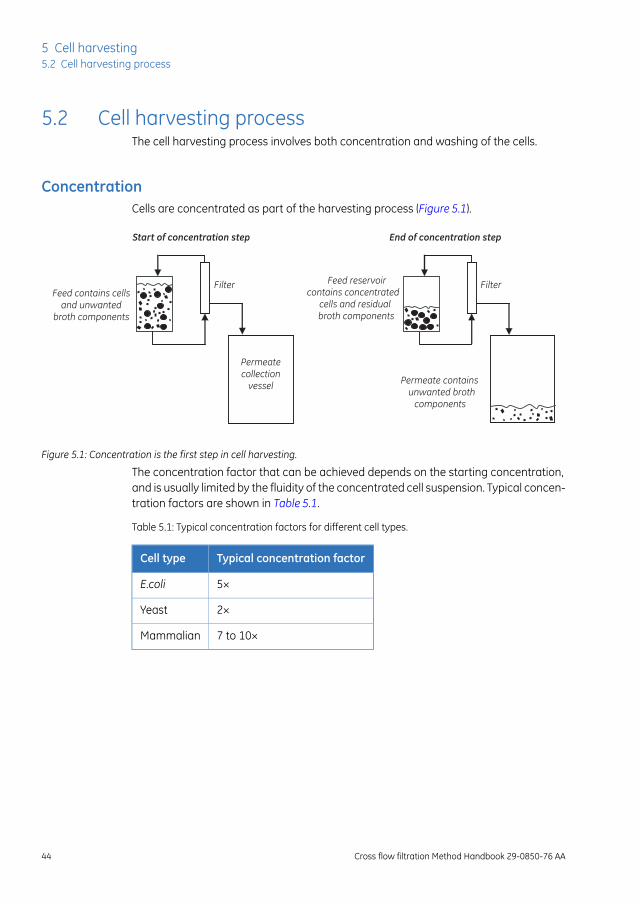
ConcentrationCells are concentrated as part of the harvesting process (Figure 5.1).
Feed contains cellsand unwanted
broth components
Filter
Permeate collection
vessel
Feed reservoir contains concentrated
cells and residual broth components
Filter
Permeate contains unwanted broth
components
Start of concentration step End of concentration step
Figure 5.1: Concentration is the first step in cell harvesting.
The concentration factor that can be achieved depends on the starting concentration,and is usually limited by the fluidity of the concentrated cell suspension. Typical concen-tration factors are shown in Table 5.1.
Table 5.1: Typical concentration factors for different cell types.
Typical concentration factorCell type
5×E.coli
2×Yeast
7 to 10×Mammalian
44 Cross flow filtration Method Handbook 29-0850-76 AA
5 Cell harvesting5.2 Cell harvesting process
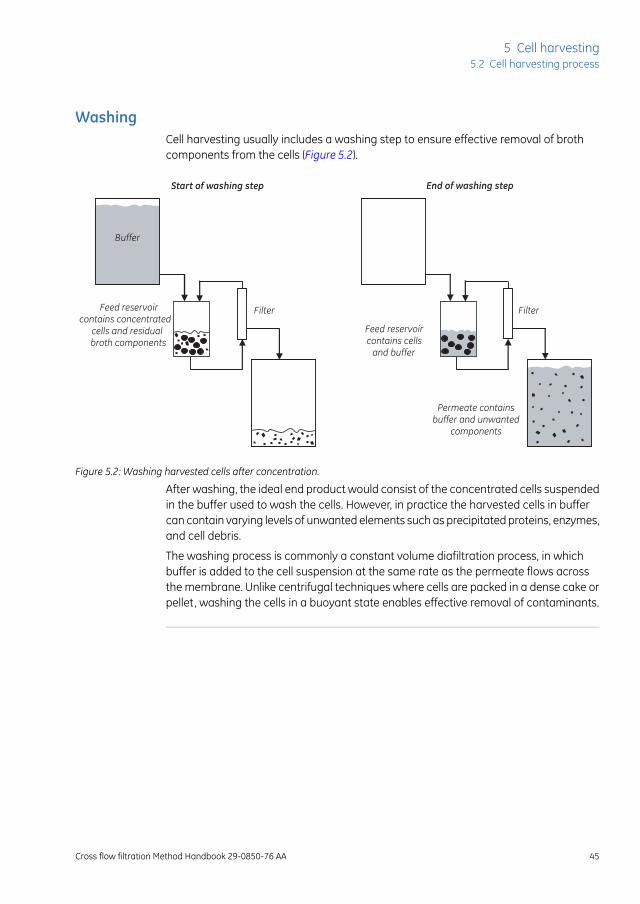
WashingCell harvesting usually includes a washing step to ensure effective removal of brothcomponents from the cells (Figure 5.2).
Buffer
Filter
Feed reservoir contains cells
and buffer
Filter
Permeate contains buffer and unwanted
components
Start of washing step End of washing step
Feed reservoir contains concentrated
cells and residual broth components
Figure 5.2: Washing harvested cells after concentration.
After washing, the ideal end product would consist of the concentrated cells suspendedin the buffer used to wash the cells. However, in practice the harvested cells in buffercan contain varying levels of unwanted elements such as precipitated proteins, enzymes,and cell debris.
The washing process is commonly a constant volume diafiltration process, in whichbuffer is added to the cell suspension at the same rate as the permeate flows acrossthe membrane. Unlike centrifugal techniques where cells are packed in a dense cake orpellet, washing the cells in a buoyant state enables effective removal of contaminants.
Cross flow filtration Method Handbook 29-0850-76 AA 45
5 Cell harvesting5.2 Cell harvesting process
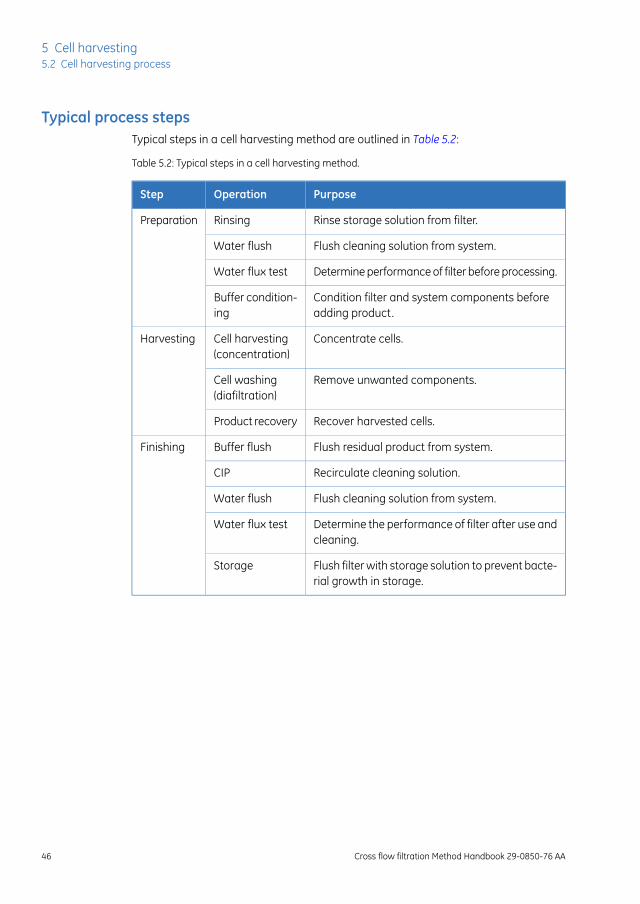
Typical process stepsTypical steps in a cell harvesting method are outlined in Table 5.2:
Table 5.2: Typical steps in a cell harvesting method.
PurposeOperationStep
Rinse storage solution from filter.RinsingPreparation
Flush cleaning solution from system.Water flush
Determine performance of filter before processing.Water flux test
Condition filter and system components beforeadding product.
Buffer condition-ing
Concentrate cells.Cell harvesting(concentration)
Harvesting
Remove unwanted components.Cell washing(diafiltration)
Recover harvested cells.Product recovery
Flush residual product from system.Buffer flushFinishing
Recirculate cleaning solution.CIP
Flush cleaning solution from system.Water flush
Determine the performance of filter after use andcleaning.
Water flux test
Flush filter with storage solution to prevent bacte-rial growth in storage.
Storage
46 Cross flow filtration Method Handbook 29-0850-76 AA
5 Cell harvesting5.2 Cell harvesting process
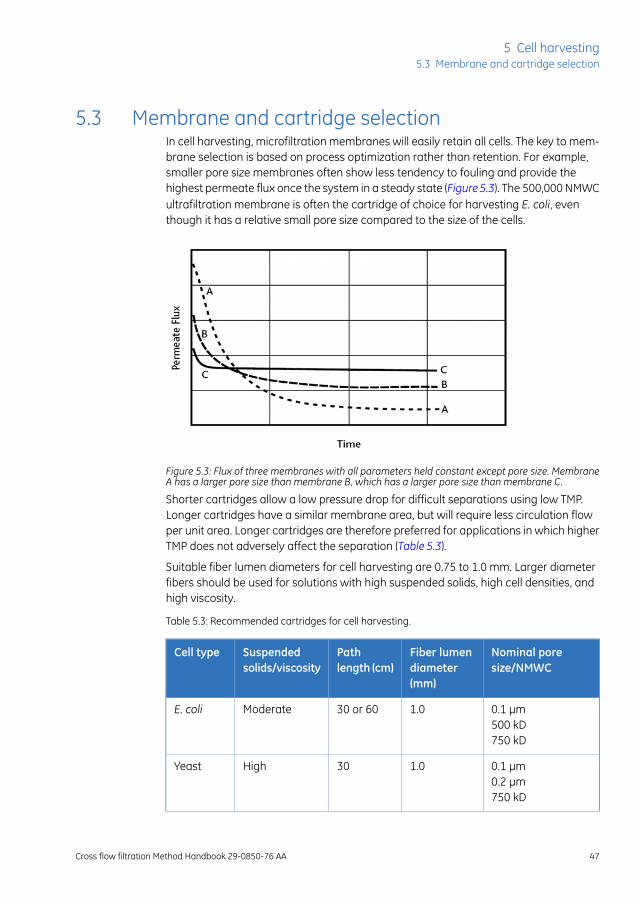
5.3 Membrane and cartridge selectionIn cell harvesting, microfiltration membranes will easily retain all cells. The key to mem-brane selection is based on process optimization rather than retention. For example,smaller pore size membranes often show less tendency to fouling and provide thehighest permeate flux once the system in a steady state (Figure5.3). The 500,000 NMWCultrafiltration membrane is often the cartridge of choice for harvesting E. coli, eventhough it has a relative small pore size compared to the size of the cells.
Figure 5.3: Flux of three membranes with all parameters held constant except pore size. MembraneA has a larger pore size than membrane B, which has a larger pore size than membrane C.
Shorter cartridges allow a low pressure drop for difficult separations using low TMP.Longer cartridges have a similar membrane area, but will require less circulation flowper unit area. Longer cartridges are therefore preferred for applications in which higherTMP does not adversely affect the separation (Table 5.3).
Suitable fiber lumen diameters for cell harvesting are 0.75 to 1.0 mm. Larger diameterfibers should be used for solutions with high suspended solids, high cell densities, andhigh viscosity.
Table 5.3: Recommended cartridges for cell harvesting.
Nominal poresize/NMWC
Fiber lumendiameter(mm)
Pathlength (cm)
Suspendedsolids/viscosity
Cell type
0.1 µm500 kD750 kD
1.030 or 60ModerateE. coli
0.1 µm0.2 µm750 kD
1.030HighYeast
Cross flow filtration Method Handbook 29-0850-76 AA 47
5 Cell harvesting5.3 Membrane and cartridge selection
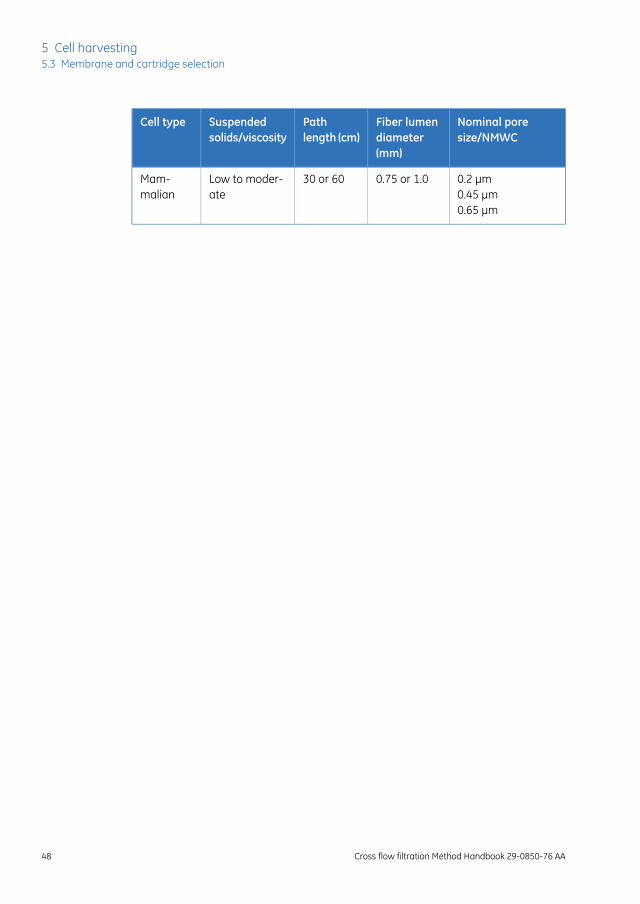
Nominal poresize/NMWC
Fiber lumendiameter(mm)
Pathlength (cm)
Suspendedsolids/viscosity
Cell type
0.2 µm0.45 µm0.65 µm
0.75 or 1.030 or 60Low to moder-ate
Mam-malian
48 Cross flow filtration Method Handbook 29-0850-76 AA
5 Cell harvesting5.3 Membrane and cartridge selection
5.4 Operating parameters
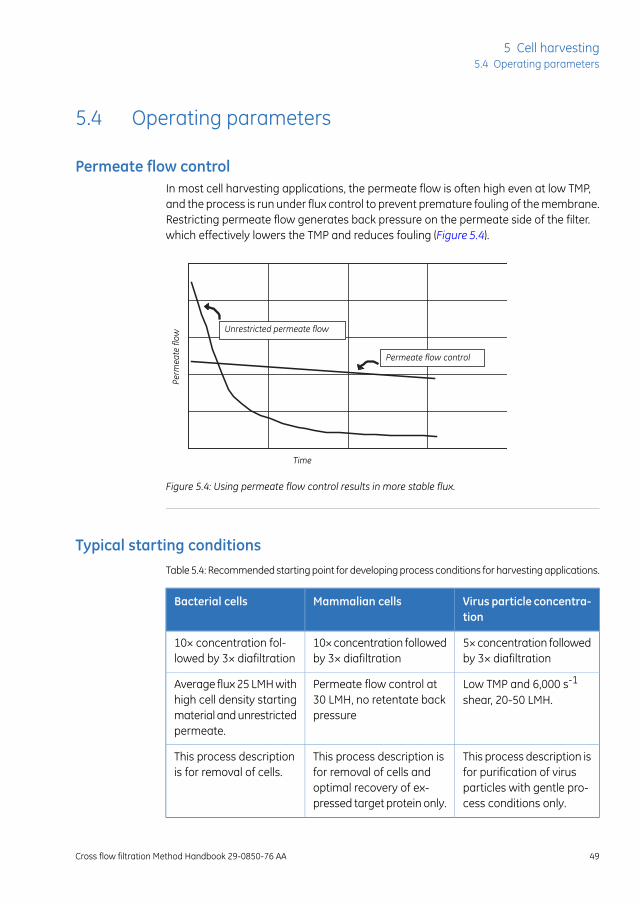
Permeate flow controlIn most cell harvesting applications, the permeate flow is often high even at low TMP,and the process is run under flux control to prevent premature fouling of the membrane.Restricting permeate flow generates back pressure on the permeate side of the filter.which effectively lowers the TMP and reduces fouling (Figure 5.4).
Unrestricted permeate flow
Permeate flow control
Time
Perm
eate
flow
Figure 5.4: Using permeate flow control results in more stable flux.
Typical starting conditionsTable 5.4: Recommended starting point for developing process conditions for harvesting applications.
Virus particle concentra-tion
Mammalian cellsBacterial cells
5× concentration followedby 3× diafiltration
10× concentration followedby 3× diafiltration
10× concentration fol-lowed by 3× diafiltration
Low TMP and 6,000 s-1
shear, 20-50 LMH.Permeate flow control at30 LMH, no retentate backpressure
Average flux 25 LMH withhigh cell density startingmaterial and unrestrictedpermeate.
This process description isfor purification of virusparticles with gentle pro-cess conditions only.
This process description isfor removal of cells andoptimal recovery of ex-pressed target protein only.
This process descriptionis for removal of cells.
Cross flow filtration Method Handbook 29-0850-76 AA 49
5 Cell harvesting5.4 Operating parameters
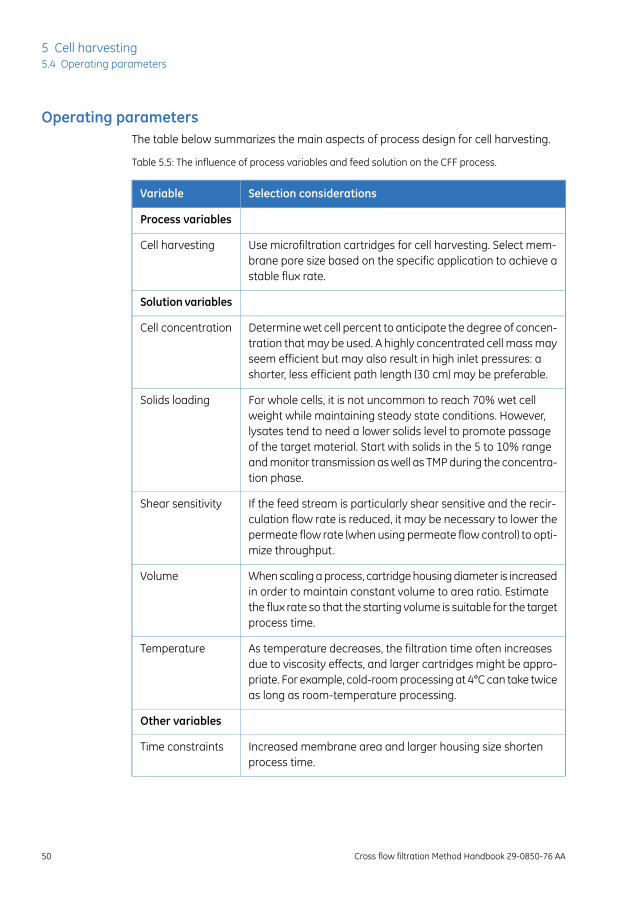
Operating parametersThe table below summarizes the main aspects of process design for cell harvesting.
Table 5.5: The influence of process variables and feed solution on the CFF process.
Selection considerationsVariable
Process variables
Use microfiltration cartridges for cell harvesting. Select mem-brane pore size based on the specific application to achieve astable flux rate.
Cell harvesting
Solution variables
Determine wet cell percent to anticipate the degree of concen-tration that may be used. A highly concentrated cell mass mayseem efficient but may also result in high inlet pressures: ashorter, less efficient path length (30 cm) may be preferable.
Cell concentration
For whole cells, it is not uncommon to reach 70% wet cellweight while maintaining steady state conditions. However,lysates tend to need a lower solids level to promote passageof the target material. Start with solids in the 5 to 10% rangeand monitor transmission as well as TMP during the concentra-tion phase.
Solids loading
If the feed stream is particularly shear sensitive and the recir-culation flow rate is reduced, it may be necessary to lower thepermeate flow rate (when using permeate flow control) to opti-mize throughput.
Shear sensitivity
When scaling a process, cartridge housing diameter is increasedin order to maintain constant volume to area ratio. Estimatethe flux rate so that the starting volume is suitable for the targetprocess time.
Volume
As temperature decreases, the filtration time often increasesdue to viscosity effects, and larger cartridges might be appro-priate. For example, cold-room processing at 4°C can take twiceas long as room-temperature processing.
Temperature
Other variables
Increased membrane area and larger housing size shortenprocess time.
Time constraints
50 Cross flow filtration Method Handbook 29-0850-76 AA
5 Cell harvesting5.4 Operating parameters
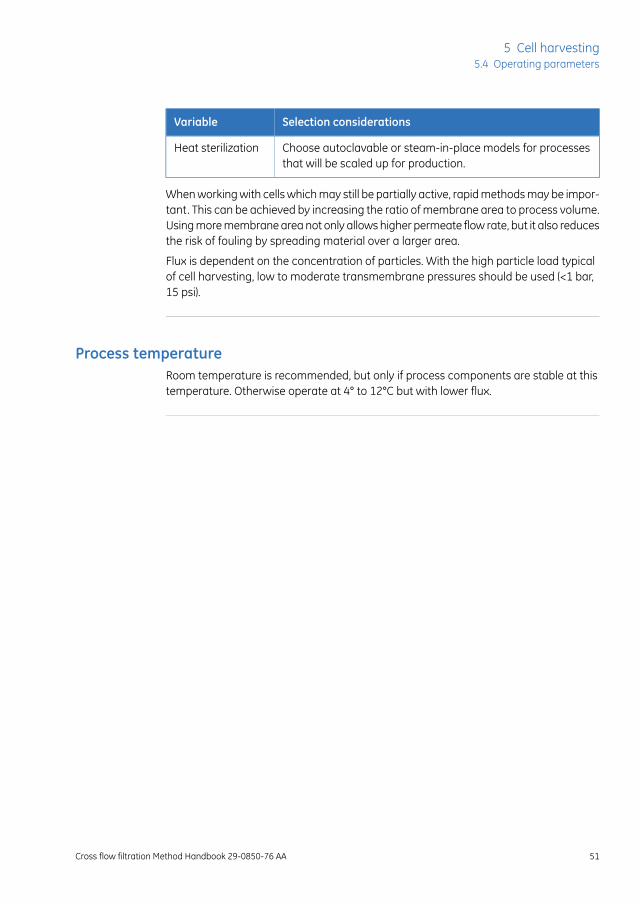
Selection considerationsVariable
Choose autoclavable or steam-in-place models for processesthat will be scaled up for production.
Heat sterilization
When working with cells which may still be partially active, rapid methods may be impor-tant. This can be achieved by increasing the ratio of membrane area to process volume.Using more membrane area not only allows higher permeate flow rate, but it also reducesthe risk of fouling by spreading material over a larger area.
Flux is dependent on the concentration of particles. With the high particle load typicalof cell harvesting, low to moderate transmembrane pressures should be used (<1 bar,15 psi).
Process temperatureRoom temperature is recommended, but only if process components are stable at thistemperature. Otherwise operate at 4° to 12°C but with lower flux.
Cross flow filtration Method Handbook 29-0850-76 AA 51
5 Cell harvesting5.4 Operating parameters
6 Cell and lysate clarification
About this chapterThis chapter considers the use of CFF for clarification of cell cultures and lysates.
In this chapterThis chapter contains the following sections:
See pageSection
536.1 Introduction
566.2 Membrane and cartridge selection
586.3 Operating parameters
596.4 Clarification strategy examples
52 Cross flow filtration Method Handbook 29-0850-76 AA
6 Cell and lysate clarification

6.1 IntroductionClarification processes are used in two contexts:
• Cell clarification
• Lysate clarification
In both cases the product is recovered in the permeate, while cell debris and largerparticles remain in the retentate and are discarded (Figure 6.1). A wash step followingthe initial clarification is commonly used to maximize product recovery (Figure 6.2). Thepermeate will usually include unwanted components from the culture medium or celllysate, and additional downstream steps are needed to purify the product.
Protein of interest with cells or cell debris and broth orlysate components
Permeate collection vessel
Permeate contains protein of interest and broth or clarified lysate components
Feed reservoir contains mostly cells or cell debris and some protein of interest
Start of initial clarification End of initial clarification
Filter Filter
Figure 6.1: The initial clarification step recovers most of the product in the permeate and leaves unwanted particulatematerial in the retentate.
Cross flow filtration Method Handbook 29-0850-76 AA 53
6 Cell and lysate clarification6.1 Introduction

Feed reservoir contains mostly cells or cell debrisand buffer
Permeate contains protein of interest and buffer
Filter FilterFeed reservoir contains mostly cells or cell debris and some proteinof interest
Start of washing step End of washing step
Figure 6.2: A washing step followng the initial clarification maximizes product recovery.
Successful clarification of feed streams to recover target proteins requires knowledgeof the starting product and the finished product specifications such as:
• Target molecule molecular weight, morphology, and robustness
• Starting volume and concentration of the target protein
• Desired finished protein concentration and volume
• Desired yield and quality (activity) of the protein
• Level of suspended solids
As with cell harvesting, rapid processing times may reduce the exposure of the targetprotein to shear forces, enzymatic action and elevated temperature.
54 Cross flow filtration Method Handbook 29-0850-76 AA
6 Cell and lysate clarification6.1 Introduction
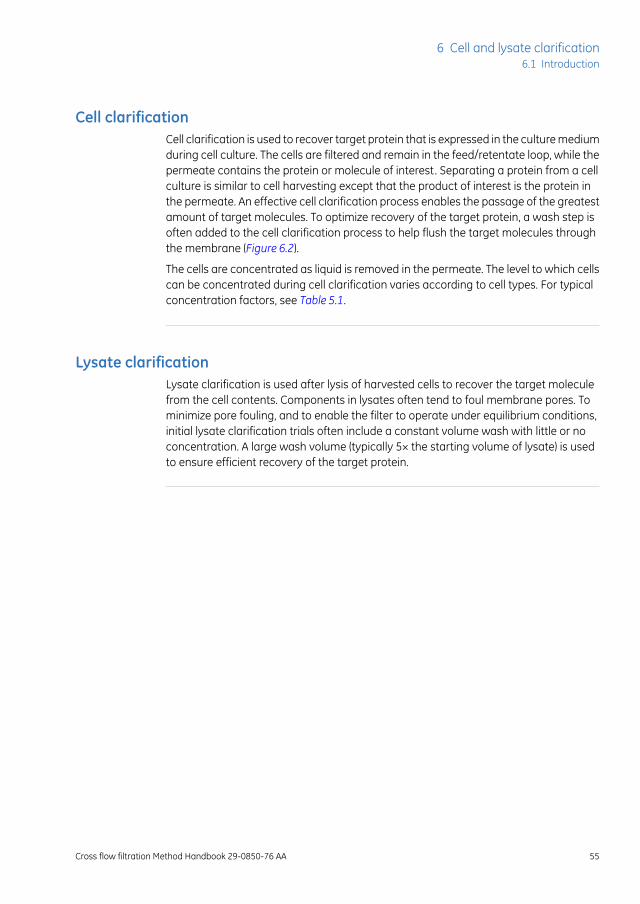
Cell clarificationCell clarification is used to recover target protein that is expressed in the culture mediumduring cell culture. The cells are filtered and remain in the feed/retentate loop, while thepermeate contains the protein or molecule of interest. Separating a protein from a cellculture is similar to cell harvesting except that the product of interest is the protein inthe permeate. An effective cell clarification process enables the passage of the greatestamount of target molecules. To optimize recovery of the target protein, a wash step isoften added to the cell clarification process to help flush the target molecules throughthe membrane (Figure 6.2).
The cells are concentrated as liquid is removed in the permeate. The level to which cellscan be concentrated during cell clarification varies according to cell types. For typicalconcentration factors, see Table 5.1.
Lysate clarificationLysate clarification is used after lysis of harvested cells to recover the target moleculefrom the cell contents. Components in lysates often tend to foul membrane pores. Tominimize pore fouling, and to enable the filter to operate under equilibrium conditions,initial lysate clarification trials often include a constant volume wash with little or noconcentration. A large wash volume (typically 5× the starting volume of lysate) is usedto ensure efficient recovery of the target protein.
Cross flow filtration Method Handbook 29-0850-76 AA 55
6 Cell and lysate clarification6.1 Introduction
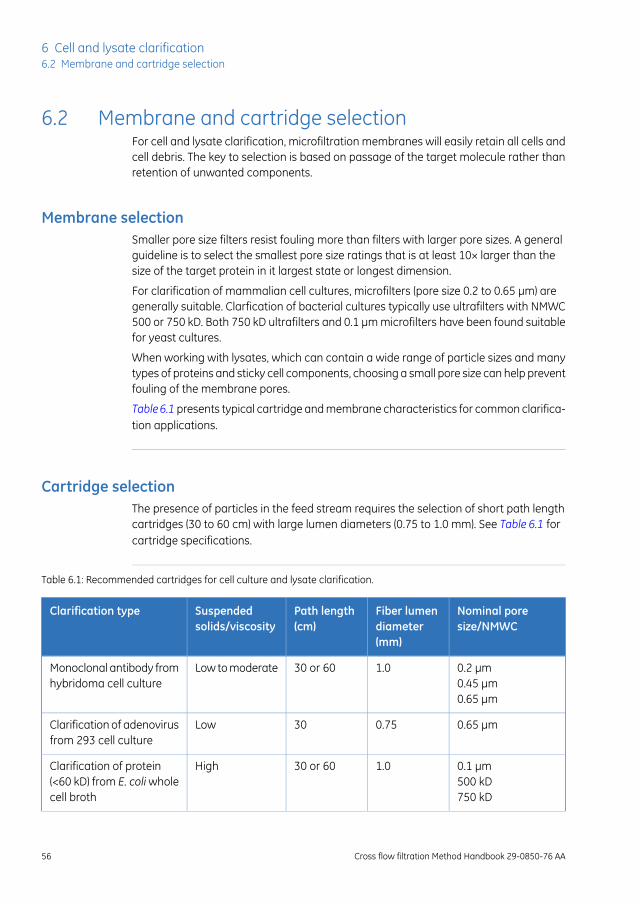
6.2 Membrane and cartridge selectionFor cell and lysate clarification, microfiltration membranes will easily retain all cells andcell debris. The key to selection is based on passage of the target molecule rather thanretention of unwanted components.
Membrane selectionSmaller pore size filters resist fouling more than filters with larger pore sizes. A generalguideline is to select the smallest pore size ratings that is at least 10× larger than thesize of the target protein in it largest state or longest dimension.
For clarification of mammalian cell cultures, microfilters (pore size 0.2 to 0.65 µm) aregenerally suitable. Clarfication of bacterial cultures typically use ultrafilters with NMWC500 or 750 kD. Both 750 kD ultrafilters and 0.1 µm microfilters have been found suitablefor yeast cultures.
When working with lysates, which can contain a wide range of particle sizes and manytypes of proteins and sticky cell components, choosing a small pore size can help preventfouling of the membrane pores.
Table6.1 presents typical cartridge and membrane characteristics for common clarifica-tion applications.
Cartridge selectionThe presence of particles in the feed stream requires the selection of short path lengthcartridges (30 to 60 cm) with large lumen diameters (0.75 to 1.0 mm). See Table 6.1 forcartridge specifications.
Table 6.1: Recommended cartridges for cell culture and lysate clarification.
Nominal poresize/NMWC
Fiber lumendiameter(mm)
Path length(cm)
Suspendedsolids/viscosity
Clarification type
0.2 µm0.45 µm0.65 µm
1.030 or 60Low to moderateMonoclonal antibody fromhybridoma cell culture
0.65 µm0.7530LowClarification of adenovirusfrom 293 cell culture
0.1 µm500 kD750 kD
1.030 or 60HighClarification of protein(<60 kD) from E. coli wholecell broth
56 Cross flow filtration Method Handbook 29-0850-76 AA
6 Cell and lysate clarification6.2 Membrane and cartridge selection
Nominal poresize/NMWC
Fiber lumendiameter(mm)
Path length(cm)
Suspendedsolids/viscosity
Clarification type
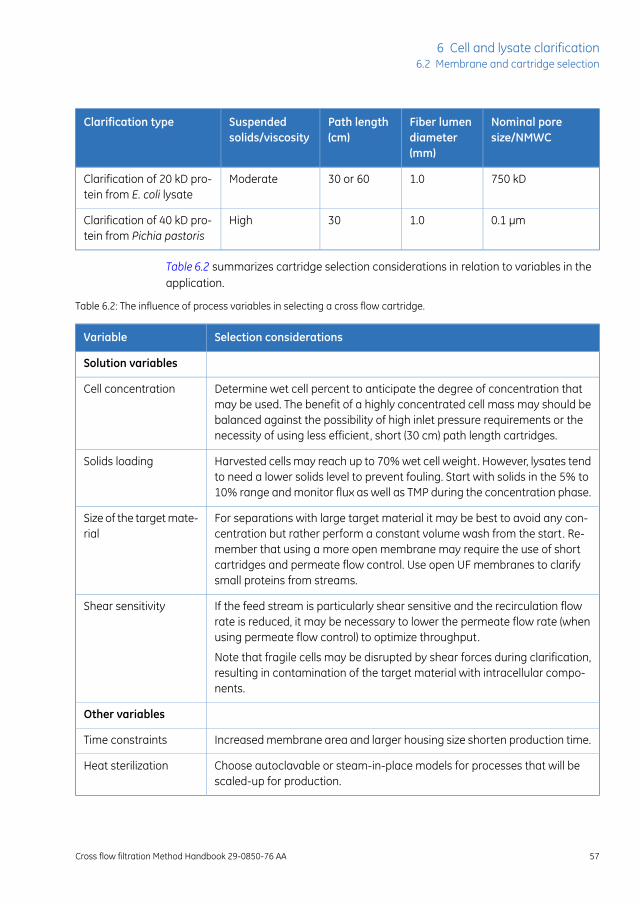
750 kD1.030 or 60ModerateClarification of 20 kD pro-tein from E. coli lysate
0.1 µm1.030HighClarification of 40 kD pro-tein from Pichia pastoris
Table 6.2 summarizes cartridge selection considerations in relation to variables in theapplication.
Table 6.2: The influence of process variables in selecting a cross flow cartridge.
Selection considerationsVariable
Solution variables
Determine wet cell percent to anticipate the degree of concentration thatmay be used. The benefit of a highly concentrated cell mass may should bebalanced against the possibility of high inlet pressure requirements or thenecessity of using less efficient, short (30 cm) path length cartridges.
Cell concentration
Harvested cells may reach up to 70% wet cell weight. However, lysates tendto need a lower solids level to prevent fouling. Start with solids in the 5% to10% range and monitor flux as well as TMP during the concentration phase.
Solids loading
For separations with large target material it may be best to avoid any con-centration but rather perform a constant volume wash from the start. Re-member that using a more open membrane may require the use of shortcartridges and permeate flow control. Use open UF membranes to clarifysmall proteins from streams.
Size of the target mate-rial
If the feed stream is particularly shear sensitive and the recirculation flowrate is reduced, it may be necessary to lower the permeate flow rate (whenusing permeate flow control) to optimize throughput.
Shear sensitivity
Note that fragile cells may be disrupted by shear forces during clarification,resulting in contamination of the target material with intracellular compo-nents.
Other variables
Increased membrane area and larger housing size shorten production time.Time constraints
Choose autoclavable or steam-in-place models for processes that will bescaled-up for production.
Heat sterilization
Cross flow filtration Method Handbook 29-0850-76 AA 57
6 Cell and lysate clarification6.2 Membrane and cartridge selection

6.3 Operating parametersThe key process variables during clarification are permeate flow rate (flux) and TMP. Inclarification processes, as in cell harvesting, the flux is often high even at low TMP valuesand steps should be taken to decrease the flux to prevent premature fouling of themembrane. Refer to Chapter 5 Cell harvesting, on page 42 for more details. Table 6.3describes typical starting conditions for the clarification of different cell types.
Table 6.3: Recommended starting point for developing process conditions for clarification.
Yeast lysate293 or HeLacell culture
Mammalian cellculture
Yeast fermentationBacterial fermenta-tion
Virus-like par-ticles (VLP) ex-pressed intra-cellularly
Adeno-associ-atedvirusclari-fication
Monoclonalanti-body expressedextracellularly
Target protein ex-pressed extracellu-larly
Target protein ex-pressedextracellular-ly
No concentra-tion, constantvolume washup to 5×.
5× concentra-tion followed by5× wash.
10× concentra-tion followed by3× diafiltration.
Partial concentra-tion 1.5 to 2× at bestfollowed by 3 to 5×diafiltration.
5× concentration fol-lowed by a 3 to 5× di-afiltration
Operate athigh shear ratewith permeateflow controlset at 20 LMH.
Operate at lowshear rate us-ing 0.65 µmembranesand permeateflow control setat 20 to30 LMH.
Use 0.2 or 0.45 µmicrofiltrationmembranes withpermeate flowcontrol set at30 LMH. No reten-tate back pres-sure.
Membranes rated at750 kD and 0.1 µhave worked wellwith unrestrictedpermeate flow.
If the cell density isquite high, closelymonitor the inletpressure to avoidover concentration.
For large target pro-teins, use microfiltra-tion membranes withpermeate flow controlset at 20 to 30 LMH.
For smaller molecules,use 750 or 500 kDmembraneswithunre-stricted permeateflow and TMP read-ings at 1 to 1.5 bar (15to 22 psi).
58 Cross flow filtration Method Handbook 29-0850-76 AA
6 Cell and lysate clarification6.3 Operating parameters

6.4 Clarification strategy examplesThe examples in this section illustrate the development of process conditions withmammalian cells, bacterial cells and yeast.
Cross flow filtration Method Handbook 29-0850-76 AA 59
6 Cell and lysate clarification6.4 Clarification strategy examples
6.4.1 Mammalian cells
IntroductionMany therapeutic proteins are derived from cell culture sources. These are most oftengrown with mammalian cell lines in highly purified media. Although there are a varietyof cells that are suitable and cell densities range from 106 to 107 cells per ml, the clarifi-cation process is similar for each type.
Membrane and cartridgeselection
If the protein of interest is an antibody, 0.2, 0.45, or 0.65 µm membranes can be used.Permeate turbidity will be slightly lower if 0.2 µm filters are used. The 0.65 µm ratingusually provides the best throughput. These cartridges can be tested with feed solutionto determine which rating provides the best overall performance. The above microfiltrationmembranes are available in only one fiber diameter, and the only remaining variable isthe cartridge path length, 30 or 60 cm. Initial testing should begin with the 30-cm pathlength to help maintain low TMP readings. When the appropriate membrane and oper-ating conditions have been chosen, additional testing using the 60-cm path length maybe used to determine if this design is suitable for scale up.
Process conditions andmonitoring
The circulation flow rate should be set to a amximum of 4000 s-1. If tests show damageto the cells, the circulation flow rate should be reduced. The permeate flow rate shouldbe set to 30 to 50 LMH. Using these conditions, the initial TMP will begin at approximately70 mbar (1 psi). Since the cells are completely retained, and the protein will initially passthrough the membrane quantitatively, the objective of testing should be to determinethe filtration capacity. As a general rule, once the TMP has increased by a factor of 4 to5 from the initial reading, the membrane is exhausted. In this example, working withpermeate flow control set at 30 LMH, if the TMP begins at 70 mbar (1 psi), when the TMPreaches 250 to 350 mbar (3.5 to 5 psi) the cartridge capacity has been reached.
Using the change in TMP as an indicator, it is possible to compare a variety of membraneratings and process controls. Once a set of standard conditions has been adopted, thefiltration efficiency can also be studied as a function of the cell culture process. For ex-ample, with low cell viability, membrane throughputs working with a 0.45 μm membranemight be as low as 50 L/m2. With healthy cells operating under the same conditions, thethroughput might be as high as 120 L/m2. Operating at a higher flux rate usually decreas-es throughput capacity.
60 Cross flow filtration Method Handbook 29-0850-76 AA
6 Cell and lysate clarification6.4 Clarification strategy examples6.4.1 Mammalian cells

For high yields working with monoclonal antibodies derived from CHO cells, it is normallypossible to concentrate the cells 10× and follow with a 3× to 5× wash.
Cross flow filtration Method Handbook 29-0850-76 AA 61
6 Cell and lysate clarification6.4 Clarification strategy examples
6.4.1 Mammalian cells
6.4.2 Bacterial cells
IntroductionE. coli and related bacteria have been used for many years for the expression of a widerange of recombinant proteins, vaccines, and enzymes. Fermentation times can rangefrom under a day to a week. Due to the short doubling time of these cells, prolongedfermentation can result in a significant cell mass. Moreover, the nutrient medium isusually much more complex and less purified than the medium used for mammaliancells. As a result, separating these cells from the target protein can be a more complexprocess.
Membrane and cartridgeselection
For relatively small proteins (<40 kD), the open ultrafiltration membranes rated at 500 kDand 750 kD should be tested first. These membranes will provide a stable flux rate andresist rapid fouling. For large proteins, microfiltration membranes rated at 0.1 or 0.2 μmshould be used, but only in conjunction with permeate flow control. In order to make acomparison of any of these selections without a significant contribution from a gel layer,uniform operating conditions with a relatively high shear rate in the circulation flow andlow TMP should be used. Initial testing should use the 1 mm lumen fiber design with a30 cm path length. When the membrane and operating conditions have been chosen,additional testing using the 60 cm path length may be used to determine if this designis suitable for scale up. Several full scale production processes have successfully utilizedthe 110 cm ultrafiltration cartridge design with E. coli fermentation processes.
Process conditions andmonitoring
Unlike fragile mammalian cells, bacterial cells can withstand significant shear forceswithout damage. Test results have shown that high circulation flows with 12,000 to16,000 s-1 shear rates provide better transmission of the target protein and more stableflux rates. Insufficient shear rate or excessive TMP will cause the formation of a gel layeron the membrane surface that acts as an additional filtration layer. Therefore, initialtesting will require a reliable assay to establish a stable process with good yields. Withfeed streams containing a high cell mass and a large target molecule, testing shouldbegin with the permeate flow control set as low as 10 to 20 LMH. When working withultrafiltration membranes, the TMP should be gradually increased to see if there is aproportionate and stable increase in flux. With microfiltration membranes, the flux rateshould be gradually increased while monitoring the TMP. If the TMP increases over time,
62 Cross flow filtration Method Handbook 29-0850-76 AA
6 Cell and lysate clarification6.4 Clarification strategy examples6.4.2 Bacterial cells
the flux rate should be adjusted to a lower setting until it remains stable. Even with arelatively high starting cell mass, it is often possible to perform a 5× concentrationwithout sustaining a significant increase in the pressure drop along the cartridge. If theinlet pressure begins to rise abruptly, it is normally not due to cartridge plugging but tothe increased viscosity of the feed, and additional concentration is not advised. Withinitial testing, a 2× increase in the pressure drop should be used as an upper limit. Theconstant volume wash should be initiated without interrupting the circulation flow. Ifthe flux rate has decreased by more than 4×, it is advised to temporarily open the backpressure valve and shut off the permeate flow. This technique may help to diminish theeffects of gel layer formation.
Cross flow filtration Method Handbook 29-0850-76 AA 63
6 Cell and lysate clarification6.4 Clarification strategy examples
6.4.2 Bacterial cells
6.4.3 Yeast
IntroductionPichia pastoris and other types of yeast have been extremely popular for expressingtarget proteins. Often a successful fermentation will result in a highly viscous materialwith as much as 50 percent cell mass. This represents a challenge for any of the candidateclarification technologies. However the target proteins are usually small. Moreover, thehollow fiber technology is linearly scalable and does not require pre-dilution in order toprovide good yields.
Membrane and cartridgeselection
The most popular membranes to ensure good passage of target proteins as large as70 kD molecular weight have been the 0.1 µm microfiltration and 750 kD ultrafiltrationmembranes. Larger proteins have been successfully processed at full scale with the0.2 µm microfiltration membranes. With such a high initial viscosity, there is even greaterneed to use the most dense membrane that will effectively pass the target protein. Moreopen membranes working with high inlet pressures will result in cells being trapped onthe membrane surface near the cartridge inlet. Inlet pressures will rise and the processwill fail. The 1 mm fibers with 30 cm path length are used exclusively with viscous yeastfeed streams. Moreover, the shear rate rarely exceeds 4,000 to 6,000 s-1 in order to keepthe inlet pressure readings less than 0.7 bar (10 psi). Due to the high viscosity of the feedstream, it is critical that all characterization testing be done in steady state (with permeaterecycled to the feed reservoir). Even a slight increase in the solids concentration will resultin a significant increase in the pressure drop.
Process conditions andmonitoring
When working with the 750 kD ultrafiltration membrane, the circulation flow rate shouldbe kept constant while gradually increasing the TMP to see if there is a proportionateand stable increase in flux. If the increased TMP only provides a partial increase in flux,the TMP should not be increased as this may result in a drop in protein transmission,which will necessitate extensive washing. With either the 0.1 or 0.2 μm microfiltrationmembranes, the flux rate should be gradually increased while monitoring the TMP. Asin the earlier example, if the TMP increases over time, the flux rate should be adjustedto a lower setting until it remains stable. The TMP readings with these microfiltrationmembranes will probably remain below 0.3 to 0.4 bar (4.5 to 6 psi) throughout the process.Unless the starting cell density is quite low (<35%), it is unlikely that the process will allow
64 Cross flow filtration Method Handbook 29-0850-76 AA
6 Cell and lysate clarification6.4 Clarification strategy examples6.4.3 Yeast

any initial concentration of the feed stock. Instead, it is best to operate under a constantvolume wash mode from the beginning. Since as much as 50% of the feed is actuallycells, the wash volumes double their effectiveness. High yields are possible using only2.5× wash volumes. Moreover, because the membrane is operating under equilibriumconditions, flow rates and pressure readings should remain constant.
Initial testing should be directed at selecting the membrane with the best passage ofthe target protein. This is usually the membrane that also provides the highest flux rate.Optimization of the operating conditions will involve minor adjustments to the pressurereadings and/or flux rates. Capacity will be a function of the protein transmission as thiswill lead to the determination of the required wash volumes. Effective processes will bebetween 2.5× and 5× wash volumes. Flux rates can range from 15 to 60 LMH. Whenworking with high cell density feed streams, it is possible to achieve throughputs of80 L/m2 based on the starting material.
Cross flow filtration Method Handbook 29-0850-76 AA 65
6 Cell and lysate clarification6.4 Clarification strategy examples
6.4.3 Yeast

7 Concentration and diafiltration
About this chapterThis chapter considers the use of CFF for product concentraton and diafiltration.
In this chapterThis chapter contains the following sections:
See pageSection
677.1 Introduction
697.2 Product and process considerations
727.3 Membrane selection
66 Cross flow filtration Method Handbook 29-0850-76 AA
7 Concentration and diafiltration
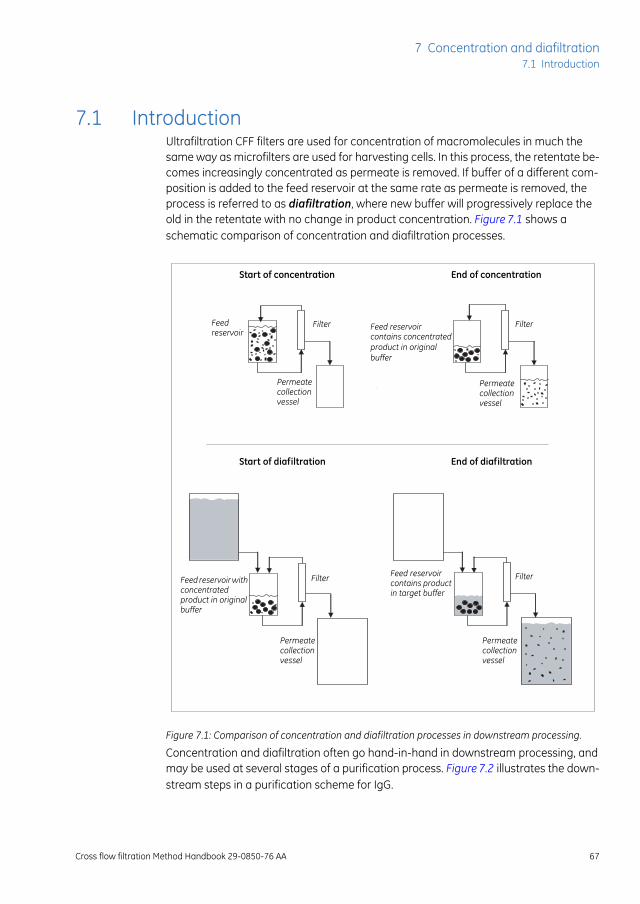
7.1 IntroductionUltrafiltration CFF filters are used for concentration of macromolecules in much thesame way as microfilters are used for harvesting cells. In this process, the retentate be-comes increasingly concentrated as permeate is removed. If buffer of a different com-position is added to the feed reservoir at the same rate as permeate is removed, theprocess is referred to as diafiltration, where new buffer will progressively replace theold in the retentate with no change in product concentration. Figure 7.1 shows aschematic comparison of concentration and diafiltration processes.
retliFretliF
Filter Filter
noitartnecnoc fo dnE noitartnecnoc fo tratS
noitartlifaid fo dnE noitartlifaid fo tratS
Feed reservoir
Permeate collection vessel
Feed reservoir with concentrated product in original buffer
Feed reservoir contains product in target buffer
Feed reservoir contains concentratedproduct in originalbuffer
Permeate collection vessel
Permeate collection vessel
Permeate collection vessel
Figure 7.1: Comparison of concentration and diafiltration processes in downstream processing.
Concentration and diafiltration often go hand-in-hand in downstream processing, andmay be used at several stages of a purification process. Figure 7.2 illustrates the down-stream steps in a purification scheme for IgG.
Cross flow filtration Method Handbook 29-0850-76 AA 67
7 Concentration and diafiltration7.1 Introduction
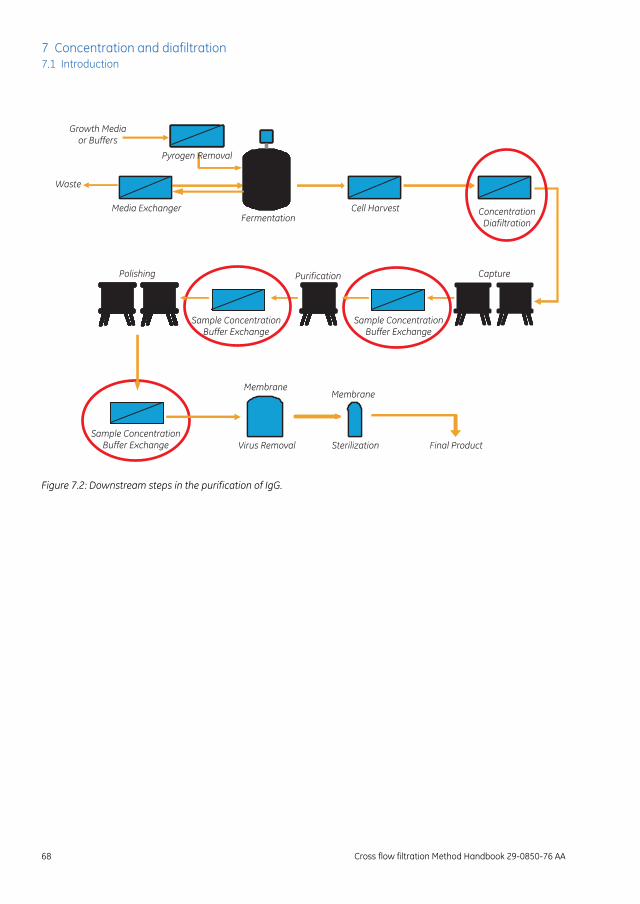
MembraneMembrane
Concentration Diafiltration
Sample Concentration Buffer Exchange
Sample Concentration Buffer Exchange
Sample Concentration Buffer Exchange
Cell HarvestFermentation
Media Exchanger
Waste
Polishing Purification Capture
Final ProductVirus Removal Sterilization
Pyrogen Removal
Growth Media or Buffers
Figure 7.2: Downstream steps in the purification of IgG.
68 Cross flow filtration Method Handbook 29-0850-76 AA
7 Concentration and diafiltration7.1 Introduction

7.2 Product and process considerationsSuccessful protein concentration and diafiltration using CFF relies on specifying the pre-and post-concentration product as follows:
• The characteristics of the target protein (size and shape, solubility, shear sensitivity,temperature sensitivity, ionic condition)
• The characteristics of the starting and target solutions (pH, ionic condition, solubility,compatibility with the next process step)
• The starting volume and concentration of the target protein
• The desired finishing concentration and volume, and the viscosity of the final solution
• Process time and cost
• Diafiltration volumes
• The desired yield and quality (stability) of the target protein
Design of concentrationprocesses
Concentration retains the product in the retentate while removing water and buffercomponents in the permeate. The choice of filter pore size is crucial for avoiding lossesof product in the permeate. The overall process may be limited by the solubility of theproduct or tendency to aggregate at high concentrations. Viscosity of the concentratedprotein solution may also be an important factor. Flux, cross flow rate and TMP need tobe adjusted to avoid the formation of a gel-like layer of highly concentrated product onthe membrane surface.
The concentration factor is the ratio between the final and initial product concentrations.The maximum available concentration factor is limited by the ratio between startingvolume and minimum working volume. In addition, over concentration of protein canlead to inefficient diafiltration due to membrane polarization effects and to protein pre-cipitation.
In a process that involves both concentration and dialfiltration, the concentration is oftenperformed in two steps separated by the diafiltration step. This allows diafiltration to bedone under optimal conditions of low volume and moderate concentration, while pro-cessing to the final target concentration is completed in the target buffer.
Cross flow filtration Method Handbook 29-0850-76 AA 69
7 Concentration and diafiltration7.2 Product and process considerations
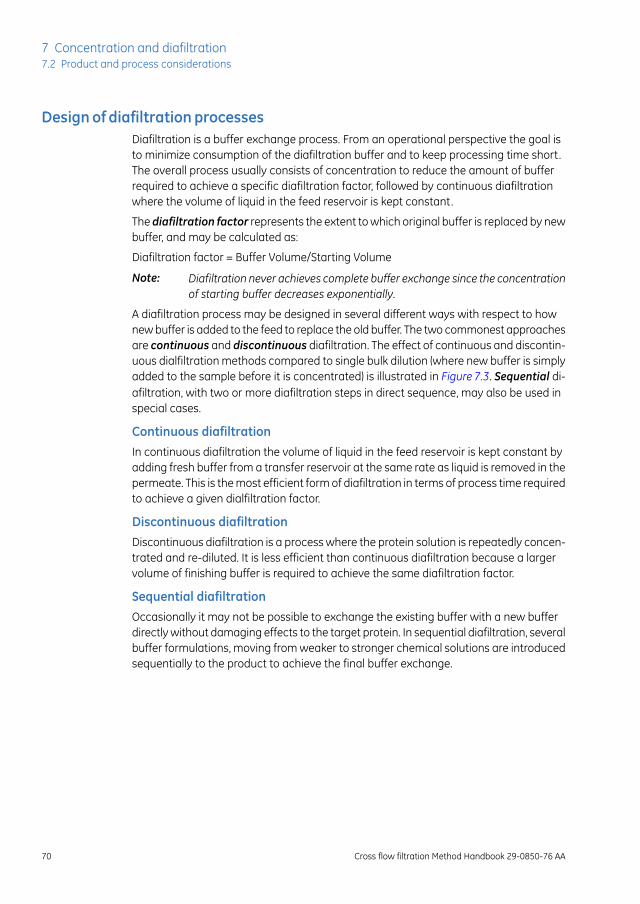
Design of diafiltration processesDiafiltration is a buffer exchange process. From an operational perspective the goal isto minimize consumption of the diafiltration buffer and to keep processing time short.The overall process usually consists of concentration to reduce the amount of bufferrequired to achieve a specific diafiltration factor, followed by continuous diafiltrationwhere the volume of liquid in the feed reservoir is kept constant.
The diafiltration factor represents the extent to which original buffer is replaced by newbuffer, and may be calculated as:
Diafiltration factor = Buffer Volume/Starting Volume
Diafiltration never achieves complete buffer exchange since the concentrationof starting buffer decreases exponentially.
Note:
A diafiltration process may be designed in several different ways with respect to hownew buffer is added to the feed to replace the old buffer. The two commonest approachesare continuous and discontinuous diafiltration. The effect of continuous and discontin-uous dialfiltration methods compared to single bulk dilution (where new buffer is simplyadded to the sample before it is concentrated) is illustrated in Figure 7.3. Sequential di-afiltration, with two or more diafiltration steps in direct sequence, may also be used inspecial cases.
Continuous diafiltrationIn continuous diafiltration the volume of liquid in the feed reservoir is kept constant byadding fresh buffer from a transfer reservoir at the same rate as liquid is removed in thepermeate. This is the most efficient form of diafiltration in terms of process time requiredto achieve a given dialfiltration factor.
Discontinuous diafiltrationDiscontinuous diafiltration is a process where the protein solution is repeatedly concen-trated and re-diluted. It is less efficient than continuous diafiltration because a largervolume of finishing buffer is required to achieve the same diafiltration factor.
Sequential diafiltrationOccasionally it may not be possible to exchange the existing buffer with a new bufferdirectly without damaging effects to the target protein. In sequential diafiltration, severalbuffer formulations, moving from weaker to stronger chemical solutions are introducedsequentially to the product to achieve the final buffer exchange.
70 Cross flow filtration Method Handbook 29-0850-76 AA
7 Concentration and diafiltration7.2 Product and process considerations
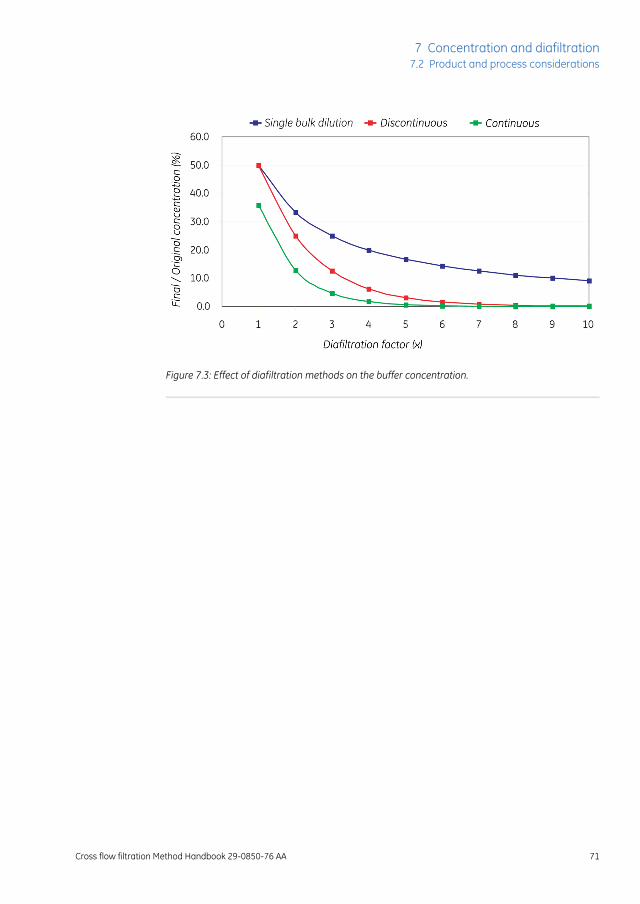
Figure 7.3: Effect of diafiltration methods on the buffer concentration.
Cross flow filtration Method Handbook 29-0850-76 AA 71
7 Concentration and diafiltration7.2 Product and process considerations
7.3 Membrane selectionSelection of the filter pore size is based on the size of the target molecule. A membranewith too large pores will allow the target molecule to pass through and significantly re-duce yields. Conversely a membrane with too small pores will reduce flux and lead tolonger processing times and oversized systems, with increased capital cost, plant spacerequirements, working volume and hold-up volume.
A general guideline for selecting a membrane for product concentration is to start witha NMWC that is 3 to 5× smaller than the target molecule. For example, a 50 kD or 30 kDmembrane would be a suitable choice to retain IgG (molecular weight 160 kD), and a30 kD or 10 kD membrane would be a suitable choice for albumin (molecular weight66 kD).
72 Cross flow filtration Method Handbook 29-0850-76 AA
7 Concentration and diafiltration7.3 Membrane selection

Appendix A Abbreviations and glossary
Abbreviations
MeaningAbbreviation
Cross flow filtrationCFF
Cleaning-in-placeCIP
Pressure differential between retentate and feedΔP
KiloDalton (=1000 Dalton)kD
Liter per square meter of membrane surface per hourLMH
Nominal molecular weight cut-offNMWC
Tangential flow filtrationTFF
Transmembrane pressureTMP
Water for injectionWFI
Glossary
MeaningTerm
The rate at which air diffuses through the wetted pores ofa membrane at a given differential pressure. Measuringthe air diffusion rate is a method used to check the integrityof a membrane filter.
Air diffusion rate
The minimum pressure required to overcome the capillaryforces and surface tension of a liquid in a fully wettedmembrane filter. This test checks the integrity of a filter.
Bubble point
The bubble point value is determined by observing whenbubbles first begin to emerge on the permeate (down-stream) side of a fully wetted membrane filter when pres-surized with a gas on the feed (upstream) side of themembrane filter. If bubbles appear at a lower pressurethan the acceptance criteria the filter integrity is impaired.
Cross flow filtration Method Handbook 29-0850-76 AA 73
A Abbreviations and glossary
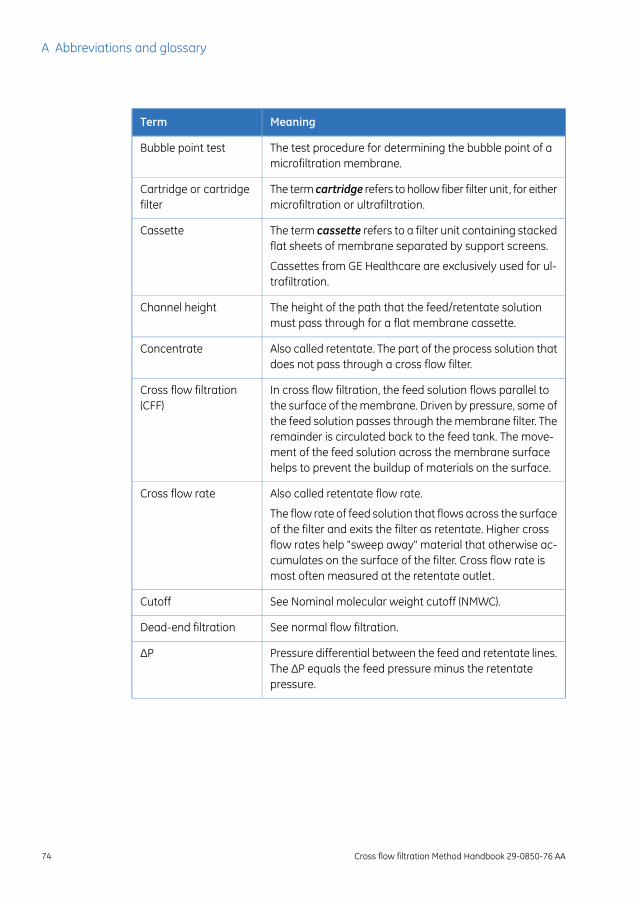
MeaningTerm
The test procedure for determining the bubble point of amicrofiltration membrane.
Bubble point test
The term cartridge refers to hollow fiber filter unit, for eithermicrofiltration or ultrafiltration.
Cartridge or cartridgefilter
The term cassette refers to a filter unit containing stackedflat sheets of membrane separated by support screens.
Cassette
Cassettes from GE Healthcare are exclusively used for ul-trafiltration.
The height of the path that the feed/retentate solutionmust pass through for a flat membrane cassette.
Channel height
Also called retentate. The part of the process solution thatdoes not pass through a cross flow filter.
Concentrate
In cross flow filtration, the feed solution flows parallel tothe surface of the membrane. Driven by pressure, some ofthe feed solution passes through the membrane filter. Theremainder is circulated back to the feed tank. The move-ment of the feed solution across the membrane surfacehelps to prevent the buildup of materials on the surface.
Cross flow filtration(CFF)
Also called retentate flow rate.Cross flow rate
The flow rate of feed solution that flows across the surfaceof the filter and exits the filter as retentate. Higher crossflow rates help "sweep away" material that otherwise ac-cumulates on the surface of the filter. Cross flow rate ismost often measured at the retentate outlet.
See Nominal molecular weight cutoff (NMWC).Cutoff
See normal flow filtration.Dead-end filtration
Pressure differential between the feed and retentate lines.The ΔP equals the feed pressure minus the retentatepressure.
ΔP
74 Cross flow filtration Method Handbook 29-0850-76 AA
A Abbreviations and glossary
MeaningTerm
An operation that uses ultrafiltration filters to remove saltsor other microsolutes from a solution. Small moleculespass into the permeate while larger molecules are retainedin the retentate.
Diafiltration
Microsolutes are generally so easily washed through thefilter that for a fully permeated species about three volumesof diafiltration solution will eliminate 95%-99% of the mi-crosolute.
Diafiltration exchange factor = Diafiltration buffer volume/ Sample volume
Diafiltration exchangefactor
See ΔP.Differential pressure
See normal flow filtration.Direct flow filtration
The active area of the membrane exposed to flow.Effective filtration area
Substances that may dissolve or leach from a membranefilter during filtration and contaminate the process solution.For example, these might include wetting agents in themembrane, membrane cleaning solutions or substancesfrom the materials used to encase the membrane.
Extractables
Material or solution that is fed into the filter.Feed
The pressure measured at the inlet port of a cartridge orcassette.
Feed pressure
The surface area of filter membrane inside a membranefilter.
Filter area
Filter efficiency represents the percentage of a given sizeparticle removed from the fluid by the filter.
Filter efficiency
The total length that a feed solution travels from inlet tooutlet. Flow path length is an important parameter toconsider when doing any process development, systemdesign or scale-up or scale-down experiments.
Flow path length, nom-inal flow path length
The flow path length and other fluid channel geometriessuch as lumen diameter or channel height can affect thefluid dynamics of the system and will directly affect pumprequirements and differential pressure of the filtration step.
Flux represents the volume of solution flowing through agiven membrane area during a given time. Expressed asLMH (liters per square meter per hour).
Flux
Cross flow filtration Method Handbook 29-0850-76 AA 75
A Abbreviations and glossary
MeaningTerm
A build up of material on the membrane surface that re-duces the filtration rate. Unlike the gel layer, this materialis not redispersed in the bulk stream by higher cross flowrates.
Fouling
During the filtration process, a thin layer of particles ormolecules may build up at the membrane surface. Underextreme circumstances this concentrated layer may forma gel, blocking flux across the membrane and potentiallyresulting in increased TMP.
Gel layer
Operating at a higher cross flow may reduce the thicknessof the gel layer.
Volume of fluid in the system tubing and filter.Hold-up volume
A tube of membrane, sealed inside a cross flow cartridge.The feed stream flows into the lumen of one end of thehollow fiber and the retentate (the material that does notpermeate through the walls of the hollow fiber) flows outof the other end. The material that passes through themembrane (walls of the hollow fiber) is called the permeate.
Hollow fiber
The mechanical structure that surrounds and supports themembrane or filter element. The housing normally hasfeed, retentate and permeate ports that direct the flow ofprocess fluids into and out of the filter assembly.
Housing
The pressure of a fluid at the feed port of a membrane filter.Inlet pressure
The volume of solution that will pass through a membranefilter before the permeate output drops to an unacceptablelevel.
Loading
The degree to which the original performance of a mem-brane can be restored by cleaning.
Membrane recovery
The process of removing particles from a liquid by passingit through a porous membrane under pressure. Microfiltra-tion usually refers to removing submicron-sized particles.
Microfiltration
A thin, porous film or hollow fiber having pores rangingfrom 0.1 to 10 μm. Cross flow microfilters typically havepores ranging from 0.1 to 1.0 μm.
Microporous mem-brane
Also called minimum operating volume. The least amountof fluid able to be handled effectively by a filtration system.
Minimum process vol-ume
76 Cross flow filtration Method Handbook 29-0850-76 AA
A Abbreviations and glossary
MeaningTerm
A rating that indicates the percentage of particles of aspecific size or molecules of a specific molecular weightthat will be removed by a filter. No industry standard exists;hence the ratings from different manufacturers are notalways comparable.
Nominal filter rating
The pore size designation, usually in kiloDaltons (kD), forultrafiltration membranes. No industry standard exists;hence the NMWC ratings of different manufacturers arenot always comparable.
Nominal molecularweight cut off (NMWC)
In normal flow filtration, liquid flows perpendicular to thefilter media. Material that does not pass through the filterremains on the filter surface.
Normal flow filtration
See Flow path length.Nominal flow pathlength
The water flux at 20°C divided by pressure. Common unitsLMH/psi, LMH/bar.
Normalized water per-meability (NWP)
Also called filtrate. Any components of the feed solutionthat passes through the membrane.
Permeate
A measurement of the open space in a membrane. Thehigher the membrane porosity, the more pores there are,and hence a higher flow rate is expected.
Porosity
The portion of the feed solution that does not pass throughthe filter. Any component that does not pass through themembrane flows out of the filter and back to the feedcontainer.
Retentate
The ability of a membrane filter to retain an entity of agiven size.
Retention
The ratio of velocity and distance expressed in units of s-1.The shear rate for a hollow fiber cartridge is based on theflow rate through the fiber lumen and is used to controlcross flow.
Shear rate
Disruptive force that arises in connection with a steep flowgradient. Shear stress can disrupt cells and denature pro-teins.
Shear stress
Cross flow filtration Method Handbook 29-0850-76 AA 77
A Abbreviations and glossary
MeaningTerm
The process of sterilizing a filter unit, such as a hollow fibercartridge, with steam without removing the unit from theseparation system.
Steam-in-place (SIP)
Mechanism for removing particles from a feed streambased strictly on the size of the particles. Retained particlesare held back because they are larger than the poreopening.
Size exclusion
See Cross flow filtration.Tangential flow filtra-tion
The pressure drop across the filtration membrane.Transmembrane pres-sure
The separation of macrosolutes based on their molecularweight or size.
Ultrafiltration
The feed side of a separation process.Upstream
Measurement of the amount of water that flows througha given membrane surface area in a set time. See also Flux.The water flux test is commonly used to assess cleaningefficacy.
Water flux
78 Cross flow filtration Method Handbook 29-0850-76 AA
A Abbreviations and glossary

IndexAabbreviations, 73air diffusion test, 29air sensors, 11ÄKTACrossflow system, 15ÄKTA flux system, 15application areas, 8
Bbasic configuration, 10bubble point test, 29
Ccartridge filters, 12cassette filters, 12cell clarification, 55cell harvesting, 43
cartridge selection, 47concentration, 44membrane selection, 47method, 46typical starting condi-tions, 49washing, 45
clarification, 52cartridge selection, 56membrane selection, 56
clarification examplesbacterial cells, 62mammalian cells, 60yeast, 64
clarifying cells and lysates, 53cleaning agents, 29concentrating cells, 44concentration factor, 69concentration gradient, 34conditioning, 22continuous diafiltration, 70control modes, 24cross flow filtration, 6cross flow rate, 23
influence on flux andTMP, 36
customized systems, 15
Ddead-end filtration, 7degradation, 40denaturation, 40depyrogenation, 21diafiltration, 67
membrane selection, 72process design, 70
diafiltration factor, 70diafiltration methods, 70direct flow filtration, 7discontinuous diafiltration, 70
Ffeed, 6feed properties, 17feed pump, 10filter configuration, 12filter hold-up volume, 14filter life cycle, 28filter performance
checking, 28troubleshooting, 30
filter selectionfor concentration and diafil-tration, 72
flow sensors, 11flushing out product, 26flux, 23
as function of TMP, 35flux control, 24fouling, 20
Ggel layer, 34glossary, 78
Hharvesting cells, 43hold-up volume, 14hollow fiber filters, 12
Kkey features, 7
Cross flow filtration Method Handbook 29-0850-76 AA 79
Index

Llevel sensors, 11lysate clarification, 55
Mmicrofiltration, 13minimum working volume, 14
NNMWC, 13nominal molecular weight cut-off, 13non-recoverable product, 40normal flow filtration, 7
Ooptimization, 33optimizing yield, 40
Ppermeate, 6permeate pump, 10pore size, 13, 20preparing filters, 21pressure, 23pressure sensors, 11process capacity, 14process control modes, 24process design, 16process optimization, 33process scale-up, 32process time, 17process time optimization, 38product concentration, 67
process design, 69product loss, 40product properties, 17product recovery, 26protein binding to filters, 20proteolytic enzymes, 41pumps, 10
Rrecirculation rate, 23recovering product, 26retentate, 6
retentate pump, 10rinsing, 21
Ssanitization, 21scale-up, 32selecting a filter, 19selecting filters
for cell harvesting, 47, 56selectivity, 19sensors, 11sequential diafiltration, 70shear rate, 23shear stress, 17, 23, 40single bulk dilution, 70solubility, 17system configuration, 10system hold-up volume, 14
Ttangential flow filtration, 6time requirements, 17TMP control, 24TMP excursions, 37TMP scouting, 37transfer pump, 11transmembrane pressure(TMP), 23
Uultrafiltration, 13UniFlux system, 15
Vvalves, 11viscosity, 17
Wwashing cells, 45water flux test, 29
Yyield, 40
ΔΔP, 23
80 Cross flow filtration Method Handbook 29-0850-76 AA
Index
Page intentionally left blank
GE, imagination at work and GE monogram are trademarks of General ElectricCompany.
ÄKTA, ÄKTAcrossflow, UniFlux and UNICORN are trademarks of GE Healthcarecompanies.
Alconox is a trademark of Alconox Inc.
© 2014 General Electric Company – All rights reserved.First published Jan. 2014
All goods and services are sold subject to the terms and conditions of sale ofthe company within GE Healthcare which supplies them. A copy of these termsand conditions is available on request. Contact your local GE Healthcare repre-sentative for the most current information.
GE Healthcare Europe GmbHMunzinger Strasse 5, D-79111 Freiburg, Germany
GE Healthcare UK LimitedAmersham Place, Little Chalfont, Buckinghamshire, HP7 9NA, UK
GE Healthcare Bio-Sciences Corp.800 Centennial Avenue, P.O. Box 1327, Piscataway, NJ 08855-1327, USA
GE Healthcare Japan CorporationSanken Bldg. 3-25-1, Hyakunincho Shinjuku-ku, Tokyo 169-0073, Japan
For local office contact information, visitwww.gelifesciences.com/contact
GE Healthcare Bio-Sciences ABBjörkgatan 30751 84 UppsalaSweden
www.gelifesciences.com/AKTA
29-0850-76 AA 01/2014
imagination at work