cross-linking reactions between phenols and … archive/files...cross-linking reactions between...
TRANSCRIPT

CROSS-LINKING REACTIONS BETWEEN PHENOLS AND BENZOIC ACID: THE ROLE OF ARYL ESTERS
Phillip F. Britt, A. C. Buchanan, III,
Michelle K. Kidder, and J. Todd Skeen
Chemical Sciences Division, Oak Ridge National Laboratory, P. O. Box 2008, Oak Ridge, TN 37831-6197
Introduction
It has been proposed that oxygen functional groups (i.e., carboxylic acids and their salts, phenols, and ethers), prevalent in low rank coals, are responsible for cross-linking reactions that inhibit the efficient conversion of low-rank coals to liquid fuels and chemicals.1,2 In the pyrolysis and liquefaction of low-rank coals, cross-linking has been correlated with evolution of CO2 and H2O.1 To determine if decarboxylation leads to cross-linking, the thermal decomposition of aromatic carboxylic acids was investigated.3 It was determined that carboxylic acids predominately undergo decarboxylation by an acid promoted ionic pathway at 400 °C, but depending on the reaction conditions, small amounts (<5 mol%) of cross-linked products (i.e., arylated products) could be formed by formation and radical induced decomposition of anhydrides. Anhydride formation and cross-linking reactions were enhanced by incorporating the aromatic carboxylic acids in a polymer (poly(m-xylylene)-co-(5-carboxy-m-xylylene) at concentrations similar to those found in low rank coal (ca. 2.4 carboxyls per 100 carbons).4 Since these condensation reactions readily occur at temperatures found in the thermal processing of coal (350-425 °C), additional types of cross-linking reactions, such as the condensation of carboxylic acids and phenols to make aryl esters, might be possible. Since phenols are 2-5 times more concentrated than carboxylic acids in low rank coal, aryl esters could form from condensation reactions. Aryl esters are predicted to be thermally stable up to temperatures of 650 °C based on the Arrhenius parameters reported for the C-O homolysis of phenyl acetate (log k (s-1) = 15.3 – 72.3 kcal mol-1 / 2.303RT).5 Pyrolysis of phenyl benzoate at 700 °C produced 90% conversion, and produced phenol, biphenyl, benzene, and dibenzofuran as the major products, but the mass balance was poor (<60%).6 Thus, aryl esters could act as low temperature cross-links in low rank coal. However, there is little data on the formation and pyrolysis of aryl esters at temperatures relevant to those found in the thermal processing of coal (350-425 °C). In this study, we have investigated the pyrolysis benzoic acid in the presence of excess m-phenylphenol to study the formation and decomposition of aryl esters, and we have investigated the pyrolysis of phenyl benzoate at 400 °C to determine if aryl esters act as a thermally stable low-temperature cross-link. Experimental
m-Phenylphenol, which contained 10% p-phenylphenol, was recrystallized from benzene/hexanes and dried in a vacuum desiccator over P2O5. Benzoic acid was purchased from Mallinckrodt, and no further purification was needed. Phenyl benzoate was purified by recrystallization from hexane/ethyl acetate (1:1) and dried in a vacuum desiccator over P2O5. Naphthalene was purified by sublimation. Cumene was fractionally distilled (2x). 2,5-Dimethylphenol was recrystallized in EtOH/ether. Acetone (Omni-Solv) was used with no further purification. Benzyl phenyl ether was purchased from Aldrich and used as received.
Pyrolysis of the compounds was performed in heavy walled Pyrex tubes (8 mm o.d x 12.5 cm) that were thoroughly cleaned, oven dried and cooled under argon. The desired amount of substrate (typically 20-100 mg) was weighed into the tube, and three freeze-
pump-thaw cycles were performed prior to sealing the tube at ca 10-5 Torr. Tube volumes were kept to a minimum with the solid filling roughly one-half of the sealed pyrolysis tube. The pyrolyses were performed in a Carbolite tube furnace, which maintained the temperature to ± 1 °C. All samples were run in duplicate. After the pyrolysis, the samples were removed from the furnace and cooled in liquid N2. The tubes were opened, and the solid products were dissolved in high purity acetone. Internal standards, 2,5-dimethylphenol, benzyl phenyl ether and cumene, were added. The products were analyzed by gas chromatography using a Hewlett-Packard 5890 Series II gas chromtograph equipped with a J&W Scientific 30 m x 0.25mm id, 0.25 µm film thickness DB-5 column and a flame ionization detector. Mass spectra were obtained at 70 eV on a Hewlett-Packard 5972 GC-MS equipped with a capillary column identical with that used for GC analysis. The products were quantitated by injection onto the GC using a HP 7673 autosampler, and the data was averaged using the GC-FID output relative to the internal standards. Response factors were measured with authentic samples or estimated from measured response factors for structurally related compounds or based on carbon number relative to the internal standards. Mass balances were calculated by comparing the recovered starting material and product equivalents to the initial charge of starting material. Results and Discussion
The formation of aryl esters was investigated by the pyrolysis of mixtures of m-phenylphenol and benzoic acid. The phenyl substituted phenol was chosen instead of phenol to reduce the pressure inside the pyrolysis tubes, since pyrolysis of mixtures of phenol and benzoic acid tended to break the heavy walled glass tubes. The meta-isomer was chosen to reduce any substituent effect in the reaction, but the purified meta-isomer contained 10% of the para-isomer. Pyrolysis of a 3.1:1 mixture of m-phenylphenol and benzoic acid at 400 °C for 60 min produced a 69.7 ± 1.3 % yield of m-phenylphenyl benzoate. When the ratio of m-phenylphenol to benzoic acid was reduced to 1.9:1, the yield
OH
OOH
3.1 equiv1.0 equiv
+-H2O
+H2OO
O
of m-phenylphenyl benzoate decreased to 53.6% showing that the concentration of phenol impacts the rate of condensation. The high efficiency of aryl ester formation in the sealed tube pyrolysis was surprising. It was initially thought that hydrolysis would be competitive with condensation and only a small quantity of aryl ester would be formed.
To determine the effect of temperature on aryl ester formation, a 3:1 mixture of m-phenylphenol and benzoic acid was heated for 60 min at 200, 250, and 300 °C. At 200 °C, only a small amount of ester (0.65%) was observed with no additional products. As the temperature was increased to 250 and 300 °C, the yield of m-phenylphenyl benzoate increased to 6.3% and 32.3%, respectively, but no other products were observed. At 400 °C, m-phenylphenyl benzoate was found in 69.7 % yield along with a small amount of other products (see Figure 1). As the reaction time increased from one to four hours, the yield of m-phenylphenyl benzoate decreased while the yield of the other products increased. The majority of the products appear to arise from the decomposition of benzoic acid. For example, benzene could arise from the acid catalyzed decarboxylation of benzoic acid, while the arylated products, such as diphenylphenol, terphenyl, and diphenylphenyl benzoate, suggest that benzoic acid might be decomposing by a radical pathway to
Prepr. Pap.-Am. Chem. Soc., Div. Fuel Chem. 2003, 48(2), 563

form aryl radicals.3 The phenol coupling products could also be formed by a radical pathway.7
OH
O
O OH
mol% 31.7 %
1.5 %7.9 %
400 ¡C, 4h59.0 % Conversion of
Benzoic acid
OH
3.1 equiv1.0 equiv
O
O
45.0 %
OH
O
OO
3.1 %2.5 %
5.5 % m/z 320
O
1.9 % m/z 322
0.31 %m/z 350
+
Figure 1. Products from the 400 °C pyrolysis m-phenylphenol and benzoic acid.
Pyrolysis of m-phenylphenol and benzoic acid in a 10-fold
excess of naphthalene (relative to benzoic acid) at 400 °C produced the aryl ester as the dominant product. However, 1- and 2-phenylnaphthalene were the dominant arylated products rather than diphenylphenol, terphenyl, and diphenylphenyl benzoate. These results indicate that aryl radicals are possibly forming from the decomposition of benzoic acid and not from the decomposition of the phenol since no biphenylated naphthalene was observed. Aryl radicals could be formed from the formation and decomposition of benzoic anhydride as previously discussed.3 However, benzoic anhydride was not found as a product. Thus, the formation pathways for the arylated products are still under investigation.
OH
O
O OH
Naphthalene (10x)
mol%
27.7 % 1.0%4.0 % 4.0 %
400 ¡C, 4h57.7 % Conversion
0.8 %
OH
3.1 equiv1.0 equiv
O
O
61.7 %
Figure 2. Products from the 400 °C pyrolysis m-phenylphenol and benzoic acid in naphthalene.
The pyrolysis of phenyl benzoate was studied at 400 °C to
determine the thermal stability of the aryl ester. The major products (shown in Figure 3) are similar to those found in the pyrolysis of benzoic acid and m-phenylphenol. Surprisingly, significant amounts of phenol and benzoic acid were observed at short reaction times. As the reaction time increased, the yield of benzoic acid decreased and the yield of benzene increased. This is most likely due to the ionic decarboxylation of the benzoic acid. The formation of phenol and benzoic acid could arise from the simple hydrolysis of the phenyl benzoate by residual water in the reagents or reaction vessel, although this was thought to be unlikely since the reagents were
stored over P2O5 before use, the reaction tubes were oven dried, and the samples were sealed under vacuum. However, since the reactions were typically run with 35 mg phenyl benzoate (177 µmol), one microliter of water (55 µmol) in the reaction tube could cause 31 % conversion to phenol and benzoic acid. Thus, residual water could be responsible for most of the conversion followed by benzoic acid chemistry, but the mechanistic details of product formation are currently under investigation.
O
OOH
HO O
O
O
O
O OH
O O
O
400 ¡C, 4h
7.6 ± 1.0%
mol% 21.1 ± 2.0 48.5 ± 1.2 4.2 ± 1.5
1.4 ±Ê0.2 5.5 ±1.7
6.7 ± 1.5
3.5 ± 0.7
3.0 ± 1.2
Average of 4 runs
Figure 3. Products from the pyrolysis of phenyl benzoate.
Conclusions
The pyrolysis of mixtures of m-phenylphenol and benzoic acid were investigated at 400 °C to determine if condensation reactions could occur to form aryl esters, which could be low temperature cross-links. It was determined that aryl esters could slowly form at temperatures as low as 200 °C, but the efficiency of the reaction increased with temperature. Only m-phenylphenyl benzoate was found at temperatures up to 300 °C, but at 400 °C, other pyrolysis products were found which appear to arise from benzoic acid decomposition. The thermal stability of aryl esters was investigated through the pyrolysis of phenyl benzoate at 400 °C. As predicted, the aryl ester appeared to be thermally stable but hydrolytically unstable. In general, formation of aryl esters could be a low temperature pathway for the cross-linking of low rank coals. The reaction pathways for the formation of the arylated products found in the pyrolysis mixture at 400 °C are currently under investigation.
Acknowledgement. This research was sponsored by the Division of Chemical Sciences, Geosciences, and Biosciences, Office of Basic Energy Sciences, U.S. Department of Energy under contract DE-AC05-00OR22725 with Oak Ridge National Laboratory, managed and operated by UT-Battelle, LLC. References (1) (a) Suuberg, E. M.; Unger, P. E.; Larsen, J. W. Energy Fuels 1987, 1, 305.
(b) Solomon, P. R.; Serio, M. A.; Despande, G. V.; Kroo, E. Energy Fuels 1990, 4, 42.
(2) Eskay, T. P; Britt, P. F.; Buchanan, A. C. III Energy Fuels 1996, 10, 1257. (3) Eskay, T. P.; Britt, P. F.; Buchanan, A. C. III Energy Fuels 1997, 11,
1279. (4) Britt, P. F.; Mungall, W. S.; Buchanan, A. C. III Energy Fuels 1998, 12,
660. (5) Ghibaudi, E.; Colussi, A. J. J. Chem. Soc., Chem. Comm. 1984, 433. (6) Patterson, J. M.; Shiue, C. Y.; Smith, W. T., Jr. J. Org. Chem. 1973, 38,
387. (7) Poutsma, M. L., Dyer, C. W. J. Org. Chem. 1982, 47, 3367.
Prepr. Pap.-Am. Chem. Soc., Div. Fuel Chem. 2003, 48(2), 564

PYROLYSIS OF AROMATIC CARBOXYLIC ACID SALTS: DOES DECARBOXYLATION PLAY A ROLE
IN CROSS-LINKING REACTIONS?
Reza Dabestani,* Phillip F. Britt, and A. C. Buchanan III
Chemical Sciences Division, Oak Ridge National Laboratory, P. O. Box 2008, MS-6197, Oak Ridge, TN 37831-06197
Introduction
Oxygen functional groups (i.e. carboxylic acids and their salts, phenols, and ethers) present in low-rank coals have been implicated as major contributors to retrograde reactions that inhibit efficient thermochemical conversion of low-rank coals to liquid fuels. Although low temperature (T < 400 oC) cross-linking reactions have been correlated with the loss of carboxyl groups and the evolution of CO2 and water, 1, 2a-c, 3 the role of decarboxylation leading to cross-linked products has been questioned.4 Thus, we have undertaken a systematic study to determine whether or not decarboxylation leads to cross-linking.5 Our initial studies on the pyrolysis of free carboxylic acids have revealed that decarboxylation proceeds primarily by an acid-promoted cationic pathway.5a However, under certain reaction conditions, anhydrides, which are low temperature cross-links, can be formed by condensation of aromatic carboxylic acids.5b,5c Anhydrides can also decompose by a radical induced decomposition pathway to produce aryl radicals, which can lead to additional cross-linked products. Since many of the carboxylic acids in coal are ion-exchanged as alkali and alkaline earth metal salts, we recently investigated the pyrolysis of the salts of aromatic carboxylic acids by thermogravimetric analysis coupled with mass spectrometric analysis of the evolved gases (TG-MS). These studies have shown that the salts decompose at higher temperature than the corresponding acids and that the products are different.6 Furthermore, our results indicate that divalent salts (e.g. calcium) decompose by a different pathway than the monovalent salts such as sodium and potassium. Hites and Biemann7 have reported that pyrolysis of calcium benzoate at 500oC proceeds by a free radical mechanism to produce mainly benzene and benzophenone (in equal amounts) and small amounts of biphenyl and 9-fluorenone. Artok and Schobert 8 have reported that sodium benzoate undergoes an inefficient decomposition reaction at 450 oC to produce benzene, toluene, benzaldehyde, and biphenyl but no mechanistic details were provided for product formation. Thus, we have undertaken a systematic study of the pyrolysis of alkali and alkaline earth metal salts of benzoic acid in an attempt to provide mechanistic insights into the pathways of product formation to determine if decarboxylation leads to cross-linking. Experimental
Sodium benzoate (Aldrich, 99%), benzene (EM Science), acetone (EMD, spectral grade), ethyl acetate (Fisher), methylene chloride (EM Science), and D2O (99.8%, MSD Isotopes) were all used as received. Biphenyl (Aldrich, 99%), diphenylmethane (Aldrich, 99%), benzophenone (Aldrich, 99%), triphenylmethane (Aldrich, 99%), diphenylmethanol (Aldrich, 99%), triphenylmethanol (Aldrich, 98%), fluorenone (Aldrich, 99%), benzoic acid (Mallinckrodt), phthalic acid (Aldrich, 99%), 4-phenylbenzoic acid (Aldrich, 95%), 2-methylnaphthalene (Aldrich, 99%), and p-toluic acid (Aldrich, 98%) were all recrystallized at least once before use. Gas chromatography analysis was performed on a Hewlett-Packard 5890 Series II gas chromatograph equipped with a J&W Scientific 30 m x 0.25 mm i.d., 0.25 um film thickness DB-5 column and a flame ionization detector. Mass spectra were obtained
at 70 eV on a Hewlett-Packard 5972 GC/MS equipped with a capillary column identical to that employed for GC analysis.
Pyrolysis of the compounds was carried out by loading small Pyrex tubes with the 20-50 mg of substrate and performing five freeze-pump-thaw cycles prior to flame sealing the tube at ca. 10-5 Torr. Tube volumes were kept to a minimum (total volume < 1 mL). The pyrolyses were conducted in a Carbolite tube furnace maintained at a temperature of 450 + 1 oC. After the pyrolysis, the tubes were immediately removed from the furnace, cooled to room temperature and then immersed in liquid nitrogen. The tubes were cracked open and the products were removed by washing the tube with acetone (< 1 mL). The internal standard (2-methylnaphthalene) was then added to the acetone wash, and the mixture was analyzed by GC and GC-MS. The solid residue was weighed first and then acidified with HCl to convert the salts to the corresponding acid(s). The organics were extracted with ethyl acetate, an internal standard (p-toluic acid) was added, and the mixture was analyzed by GC and GC-MS, and quantitated by GC.
Results and Discussion
The pyrolysis of sodium benzoate under deaerated conditions at 450 oC produced benzene, biphenyl, benzophenone, diphenylmethane, triphenylmethane, and 9-phenylfluorene (Scheme I) in good agreement with our earlier data obtained by TG-MS.6
COONa
450 oC
CH2
CO
( ) 3CH
+ +
+ + +
Φ
75% 4% 2%
1% 14%4%
Scheme I Phthalic acid (major) and phenylbenzoic acid (minor) have also
been identified from acidification of the solid residue (see experimental). It has been difficult to quantitate the phthalate as a consequence of its poor solubility in the extraction solvent and direct silylation of the salts (to the trimethylsilyl ester) has not been quantitative. Currently, good mass balances (> 90%) have been obtained based on the weight of the acetone insoluble solids and the GC yields of the acetone soluble products (i.e., hydrocarbons).
The fact that we observe benzene and phthalic acid in the reaction products suggests that they are most likely formed by a uncatalyzed Henckel type reaction where initial decarboxylation of sodium benzoate leads to the formation of the benzene anion which can abstract a hydrogen from another molecule of sodium benzoate to form benzene and an aryl anion that can react with the carbon dioxide to form sodium phthalate (Scheme II).
COONa
+-CO2
+CO2
- Na+
1
+1
-1
COONa
- Na+
H+CO2
-CO2
COONa
COONa
Scheme II The remaining products could also be formed by an anionic
reaction involving the benzene anion. Since the reaction tubes are sealed under vacuum, the reaction of the benzene anion with CO2 will be slow. Thus, the anion could react with a sodium benzoate to
Prepr. Pap.-Am. Chem. Soc., Div. Fuel Chem. 2003, 48(2), 565
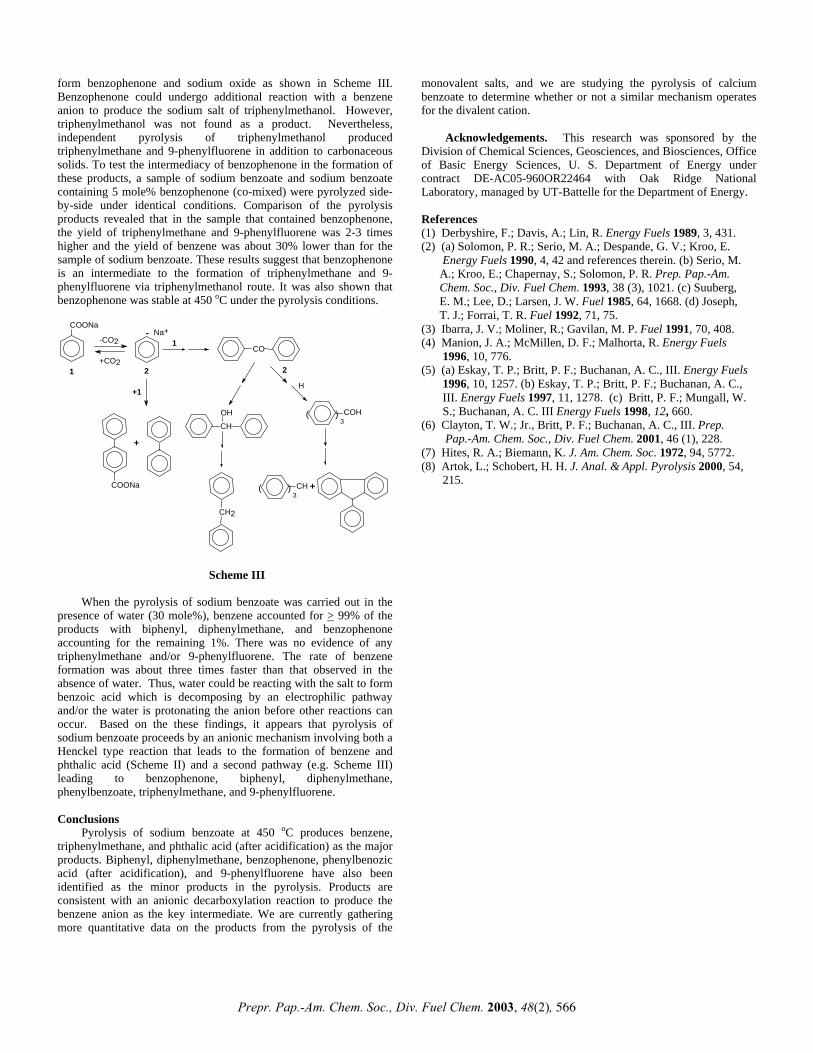
form benzophenone and sodium oxide as shown in Scheme III. Benzophenone could undergo additional reaction with a benzene anion to produce the sodium salt of triphenylmethanol. However, triphenylmethanol was not found as a product. Nevertheless, independent pyrolysis of triphenylmethanol produced triphenylmethane and 9-phenylfluorene in addition to carbonaceous solids. To test the intermediacy of benzophenone in the formation of these products, a sample of sodium benzoate and sodium benzoate containing 5 mole% benzophenone (co-mixed) were pyrolyzed side-by-side under identical conditions. Comparison of the pyrolysis products revealed that in the sample that contained benzophenone, the yield of triphenylmethane and 9-phenylfluorene was 2-3 times higher and the yield of benzene was about 30% lower than for the sample of sodium benzoate. These results suggest that benzophenone is an intermediate to the formation of triphenylmethane and 9-phenylfluorene via triphenylmethanol route. It was also shown that benzophenone was stable at 450 oC under the pyrolysis conditions.
COONa
CO
( ) 3COH
+
-
1
1
2 2
H
CH3
( )
Na+-CO2
+CO2
COONa
+1
+
CH2
OHCH
Scheme III
When the pyrolysis of sodium benzoate was carried out in the presence of water (30 mole%), benzene accounted for > 99% of the products with biphenyl, diphenylmethane, and benzophenone accounting for the remaining 1%. There was no evidence of any triphenylmethane and/or 9-phenylfluorene. The rate of benzene formation was about three times faster than that observed in the absence of water. Thus, water could be reacting with the salt to form benzoic acid which is decomposing by an electrophilic pathway and/or the water is protonating the anion before other reactions can occur. Based on the these findings, it appears that pyrolysis of sodium benzoate proceeds by an anionic mechanism involving both a Henckel type reaction that leads to the formation of benzene and phthalic acid (Scheme II) and a second pathway (e.g. Scheme III) leading to benzophenone, biphenyl, diphenylmethane, phenylbenzoate, triphenylmethane, and 9-phenylfluorene.
Conclusions
Pyrolysis of sodium benzoate at 450 oC produces benzene, triphenylmethane, and phthalic acid (after acidification) as the major products. Biphenyl, diphenylmethane, benzophenone, phenylbenozic acid (after acidification), and 9-phenylfluorene have also been identified as the minor products in the pyrolysis. Products are consistent with an anionic decarboxylation reaction to produce the benzene anion as the key intermediate. We are currently gathering more quantitative data on the products from the pyrolysis of the
monovalent salts, and we are studying the pyrolysis of calcium benzoate to determine whether or not a similar mechanism operates for the divalent cation.
Acknowledgements. This research was sponsored by the
Division of Chemical Sciences, Geosciences, and Biosciences, Office of Basic Energy Sciences, U. S. Department of Energy under contract DE-AC05-960OR22464 with Oak Ridge National Laboratory, managed by UT-Battelle for the Department of Energy.
References (1) Derbyshire, F.; Davis, A.; Lin, R. Energy Fuels 1989, 3, 431. (2) (a) Solomon, P. R.; Serio, M. A.; Despande, G. V.; Kroo, E. Energy Fuels 1990, 4, 42 and references therein. (b) Serio, M. A.; Kroo, E.; Chapernay, S.; Solomon, P. R. Prep. Pap.-Am. Chem. Soc., Div. Fuel Chem. 1993, 38 (3), 1021. (c) Suuberg, E. M.; Lee, D.; Larsen, J. W. Fuel 1985, 64, 1668. (d) Joseph, T. J.; Forrai, T. R. Fuel 1992, 71, 75. (3) Ibarra, J. V.; Moliner, R.; Gavilan, M. P. Fuel 1991, 70, 408. (4) Manion, J. A.; McMillen, D. F.; Malhorta, R. Energy Fuels 1996, 10, 776. (5) (a) Eskay, T. P.; Britt, P. F.; Buchanan, A. C., III. Energy Fuels 1996, 10, 1257. (b) Eskay, T. P.; Britt, P. F.; Buchanan, A. C., III. Energy Fuels 1997, 11, 1278. (c) Britt, P. F.; Mungall, W. S.; Buchanan, A. C. III Energy Fuels 1998, 12, 660. (6) Clayton, T. W.; Jr., Britt, P. F.; Buchanan, A. C., III. Prep.
Pap.-Am. Chem. Soc., Div. Fuel Chem. 2001, 46 (1), 228. (7) Hites, R. A.; Biemann, K. J. Am. Chem. Soc. 1972, 94, 5772. (8) Artok, L.; Schobert, H. H. J. Anal. & Appl. Pyrolysis 2000, 54, 215.
Prepr. Pap.-Am. Chem. Soc., Div. Fuel Chem. 2003, 48(2), 566
Overall Product Distribution. The pyrolysis of proline/glucose mixture was particularly interesting since proline does not form any char at 300 oC or above and the predominant condensable product is a diketopiperazine, with pyrrole and pyrroline being the minor components of the tar.6 The overall product distributions obtained from the co-pyrolysis of proline/glucose mixture are presented in Table 1. The various yields were compared to the calculated values (not shown). It was found that the yields of LTC and HTC were nearly twice the yields calculated from the separate pyrolysis of proline and glucose. The yield of LTT was about half the calculated value. The results from the tryptophan/glucose mixture were similar although the difference between the observed and calculated yields of LTC was relatively smaller. However, for the asparagine/glucose mixture, the observed and calculated yields of the chars were essentially similar, indicating that the interactions between asparagine and glucose were comparatively small.
CO-PYROLYSIS OF α-AMINO ACIDS WITH GLUCOSE
Ramesh K. Sharma, W. Geoffrey Chan and Mohammad R. Hajaligol
Philip Morris USA, Research Center P. O. Box 26583
Richmond, VA 23261 Introduction
The amino acid/sugar reactions have been studied extensively in the literature due to their importance to the food industry.1-
5According to Hodge1, amino acid and sugar undergo a reversible condensation in aqueous mixtures. The condensation involves opening of the ring form of the sugar and addition of the amine to the carbonyl group to form the N-substituted glycosylamine. The latter may undergo condensation to form pyrazines. Spingarn et al.2 observed that the amino acid/sugar reactions led to many products belonging to a wide variety of chemical classes. While the literature provides an insight into the reactions of amino acids with sugars, it does not give any information on the products formed in an inert environment and at conditions typical of those in a lit cigarette, i.e. high temperatures and short residence times. In this work, binary mixtures of proline, tryptophan, asparagine, aspartic acid, glutamic acid and glutamine with glucose were pyrolyzed in an inert atmosphere at different temperatures and amino acid/glucose ratios. The product tars were also pyrolyzed further in a two-zone reactor to study their secondary reactions. The extent of interaction between amino acid and glucose was determined by comparing the yields and compositions of chars and tars from the co-pyrolysis to those calculated from the separate pyrolyses of the corresponding amino acid and glucose, reported elsewhere.6
Table 1. Overall Product Yields from the Co-Pyrolysis of Amino Acid/Glucose Mixtures (wt.% of Mixture)
25-300 oC 300-625 oC Substrate LTC
LTT
Gaseous product
HTC HTT
Gaseous product
Proline 27.9 24.9 47.2 8.7 4 15.2
Tryptophan 43.9 6.6 49.5 24 4.8 15.1 Asparagine 43.3 4.8 51.9 19.2 3.2 20.9
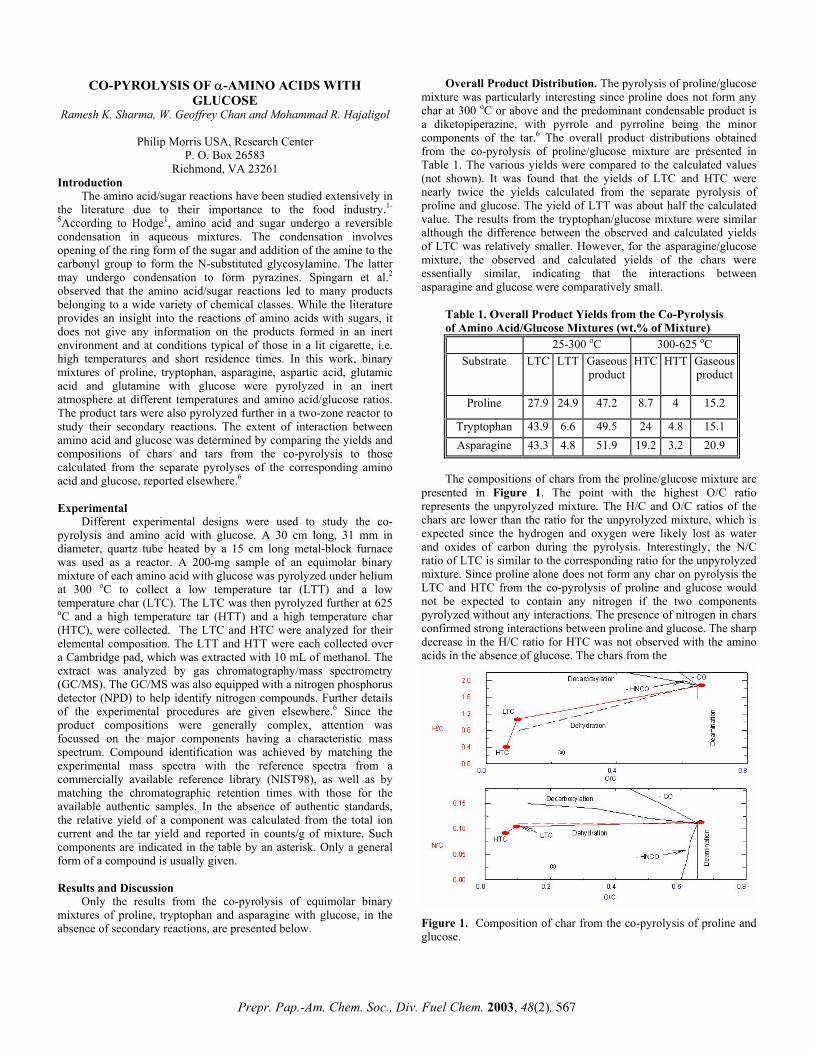
The compositions of chars from the proline/glucose mixture are
presented in Figure 1. The point with the highest O/C ratio represents the unpyrolyzed mixture. The H/C and O/C ratios of the chars are lower than the ratio for the unpyrolyzed mixture, which is expected since the hydrogen and oxygen were likely lost as water and oxides of carbon during the pyrolysis. Interestingly, the N/C ratio of LTC is similar to the corresponding ratio for the unpyrolyzed mixture. Since proline alone does not form any char on pyrolysis the LTC and HTC from the co-pyrolysis of proline and glucose would not be expected to contain any nitrogen if the two components pyrolyzed without any interactions. The presence of nitrogen in chars confirmed strong interactions between proline and glucose. The sharp decrease in the H/C ratio for HTC was not observed with the amino acids in the absence of glucose. The chars from the
Experimental
Different experimental designs were used to study the co-pyrolysis and amino acid with glucose. A 30 cm long, 31 mm in diameter, quartz tube heated by a 15 cm long metal-block furnace was used as a reactor. A 200-mg sample of an equimolar binary mixture of each amino acid with glucose was pyrolyzed under helium at 300 oC to collect a low temperature tar (LTT) and a low temperature char (LTC). The LTC was then pyrolyzed further at 625 oC and a high temperature tar (HTT) and a high temperature char (HTC), were collected. The LTC and HTC were analyzed for their elemental composition. The LTT and HTT were each collected over a Cambridge pad, which was extracted with 10 mL of methanol. The extract was analyzed by gas chromatography/mass spectrometry (GC/MS). The GC/MS was also equipped with a nitrogen phosphorus detector (NPD) to help identify nitrogen compounds. Further details of the experimental procedures are given elsewhere.6 Since the product compositions were generally complex, attention was focussed on the major components having a characteristic mass spectrum. Compound identification was achieved by matching the experimental mass spectra with the reference spectra from a commercially available reference library (NIST98), as well as by matching the chromatographic retention times with those for the available authentic samples. In the absence of authentic standards, the relative yield of a component was calculated from the total ion current and the tar yield and reported in counts/g of mixture. Such components are indicated in the table by an asterisk. Only a general form of a compound is usually given.
Results and Discussion
Only the results from the co-pyrolysis of equimolar binary mixtures of proline, tryptophan and asparagine with glucose, in the absence of secondary reactions, are presented below. Figure 1. Composition of char from the co-pyrolysis of proline and
glucose.
Prepr. Pap.-Am. Chem. Soc., Div. Fuel Chem. 2003, 48(2), 567

Table 2. Major Components of LTT and HTT from the Co-
tryptophan/glucose mixture showed similar results. The H/C and O/C ratios decreased dramatically but the N/C ratio decreased only slightly above 300 oC. The results from asparagine/glucose mixture were somewhat different. All the three elemental ratios showed a gradual decrease as the mixture was pyrolyzed to LTC and HTC. Thus, only small interactions between the two components were indicated for the asparagine/glucose mixture. It should also be noted that the HTC from the co-pyrolysis of asparagine and glucose was as aromatic as the HTC from proline/glucose or tryptophan/glucose mixtures although asparagine and glucose have aliphatic structures.
Compositions of LTT and HTT. The compositions of LTT and HTT from the proline/glucose pyrolysis are presented in Table 2. The LTT consisted mainly of diketopiperazine, ethyldimethyl pyrazine, acetylpyrrolidine, methanolpyrrolidine and spartein. Other pyrrolidine and piperidine derivatives were also observed. Among the products, the yield of diketopiperazine was highest. The pyrazines might have been formed by self-condensation of glucosamine and fructosamine, as suggested by Hodge.1 The HTT consisted of indole, methylindole, dimethylindole and diketopiperazine. Substituted pyrrole, imidazole and indolizines were observed in relatively low yields. The components of LTT are different than those from the pyrolysis of proline which was mainly diketopiperazine. Proline did not form any HTT. Thus, most of the nitrogenous products in co-pyrolysis were formed by interactions between proline and glucose or their decomposition products. A few of these compounds have also been reported earlier in the amino acid/sugar reactions.3-5
Pyrolysis of Proline/ Glucose Mixture (mg/g of mixture).
COMPOUND LTT HTT
Ethyldimethylpyrazine 11.4 2,5-diketopiperazine 126 2.2
Indole 1.5 Me le thylindo 4.6
D imethylindole 4.7 A 7.2 cetylpyrrolidine*
M 5 ethanolpyrrolidine* Py e* 3.7 rrolidinecarboxaldehyd
Cyclohexenylpiperidine* 5.2 Hex ne* 6.7 ahydrobenzocyclohepteno
Spartein* 16.7 *identification based on spectral matching only, yields
The LTT and HTT from the pyrolysis of tryptophan/glucose mixt
e co-pyrolysis of asparagine/glucose mixture consisted mainly of succinimide, maleimide,
amin
utamic acid and glutamine. The
Strong interactions between the components were observed in sis of amino acids with glucose. The magnitude of
inter
for the support of this research and to Dr. Jeffr
(1) Hodge, J.E. J. Agric. Food Chem. 1953, 1(15), 928. N.E.; Garvie-Gould, C. T.; Slocum, L.A. J. Agric. Food Chem.
(4) .; Yaylayan, V.A.; Keyhani, A. J. Agric. Food Chem.
(6) an, W.G.; Seeman, J.I.; Hajaligol, M.R. J. Anal. Appl.
in counts/g of mixture.
ure consisted only of nitrogen-containing compounds, many of which were polycyclic aromatic compounds (N-PACs). The major components of LTT were indole, methylindole, norharman, harman, acetylnorharman and trimethylbenzonitrile. The HTT contained mainly diketopiperazine, norharman, harman, carbazole, methylcarbazole and dimethylcarbazole. Ethylpyridylindole, dimethylphenanthroline, dimethyl β–carboline, and aminocarbazole were also observed. Some of the above components were not observed in the pyrolysis of tryptophan in the absence of glucose. Since all the above components are nitrogenous, glucose and its decomposition products either reacted completely with the nitrogenous intermediates from tryptophan or were lost to char and the gaseous product.
The LTT from th
ohydroxypyrimidine and indole, with yields of 20.2,14.9, 1.2 and 1.1 mg/g of mixture. Dihydrodihydroxymethylpyranone aminomethyl pyrimidinone and hydroxymethyldihydrofuranone were also observed. Succinimide was also the largest component of HTT, with a yield of 23 mg/g, followed by maleimide and indole. Derivatives of indole and succinimide, such as isoindoledione and ethylendienesuccinimide, were also found in HTT. Pyrolysis of asparagine alone, in the absence of glucose, gave a negligible yield of LTT at 300 oC and the HTT consisted of succinimide, maleimide and succinimidosuccinimide, in yields of 48, 8, and 40 mg/g of asparagine.6 Thus, the addition of glucose resulted in the formation of new products that were not observed from asparagine. For the components that were observed from both the mixture and asparagine alone, the yields from the mixture were lower. The non-nitrogenous components of the product likely originated from glucose. Substituted indoles and dihydromethylfuranone have also been observed by Coleman and Chung3 in the pyrolysis of asparagine/sugar Amadori compounds.
The above results were also compared to those from the other aliphatic amino acids, aspartic acid, gl
results from the aspartic acid/glucose co-pyrolysis were essentially similar to those from asparagine/glucose and indicated a relatively small extent of interaction. On the other hand, the results from glutamine/glucose and glutamic acid/glucose pyrolysis suggested strong interactions, as in the case of proline. It should be added that asparagine and aspartic acid, when pyrolyzed without glucose, yielded negligible tar at 300 oC whereas the other amino acids gave significant yields of tars. In addition, unlike other amino acids and glucose, asparagine and aspartic acid do not undergo melting at 300 oC. These results suggest that the product distributions from the co-pyrolysis are determined by both the physical and chemical interactions between the amino acid and glucose as well as by their decomposition products. Conclusions
the co-pyrolyaction was dependent on the amino acid and the pyrolysis
conditions, i.e. temperature, amino acid/glucose ratio. The co-pyrolysis generally increased the char yield at the expense of tar yield, particularly at high temperatures. Significant yield of nitrogenous char was obtained from proline co-pyrolysis although, in the absence of glucose, proline was completely converted to volatile products at and above 300 oC. Many new products were formed in co-pyrolysis that were not observed from the separate pyrolyses of amino acids and glucose.
Acknowledgements. The authors are grateful to the Philip Morris USA management
ey Seeman, SaddlePoint Frontiers, for providing insights into the reaction chemistry.
References
(2) Spingarn,1983, 31, 301.
(3) Coleman, III, W,M.; Chung, H.L. J. Anal. Appl. Pyrol. 2002, 63, 349. Despointes, A.H1994, 42, 2519.
(5) Shibamoto, T.; Bernhard, R.A. J. Agric. Biol. Chem. 1977, 41, 143. Sharma, R.K.; ChPyrol. 2003, 66, 97.
Prepr. Pap.-Am. Chem. Soc., Div. Fuel Chem. 2003, 48(2), 568
FORMATION MECHANISMS OF Results and Discussion When a biomass such as peanut shell or tobacco is slowly heated
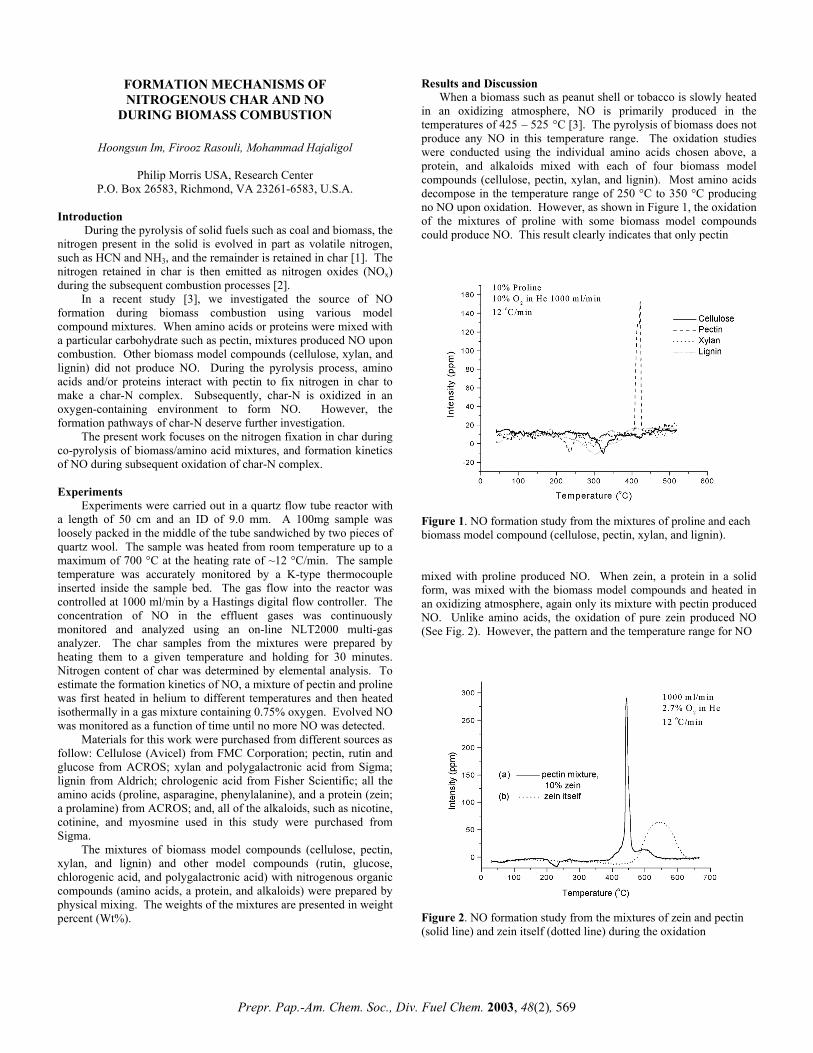
in an oxidizing atmosphere, NO is primarily produced in the temperatures of 425 – 525 °C [3]. The pyrolysis of biomass does not produce any NO in this temperature range. The oxidation studies were conducted using the individual amino acids chosen above, a protein, and alkaloids mixed with each of four biomass model compounds (cellulose, pectin, xylan, and lignin). Most amino acids decompose in the temperature range of 250 °C to 350 °C producing no NO upon oxidation. However, as shown in Figure 1, the oxidation of the mixtures of proline with some biomass model compounds could produce NO. This result clearly indicates that only pectin
NITROGENOUS CHAR AND NO DURING BIOMASS COMBUSTION
Hoongsun Im, Firooz Rasouli, Mohammad Hajaligol
Philip Morris USA, Research Center P.O. Box 26583, Richmond, VA 23261-6583, U.S.A.
Introduction
During the pyrolysis of solid fuels such as coal and biomass, the nitrogen present in the solid is evolved in part as volatile nitrogen, such as HCN and NH3, and the remainder is retained in char [1]. The nitrogen retained in char is then emitted as nitrogen oxides (NOx) during the subsequent combustion processes [2].
Figure 1. NO formation study from the mixtures of proline and each biomass model compound (cellulose, pectin, xylan, and lignin).
In a recent study [3], we investigated the source of NO formation during biomass combustion using various model compound mixtures. When amino acids or proteins were mixed with a particular carbohydrate such as pectin, mixtures produced NO upon combustion. Other biomass model compounds (cellulose, xylan, and lignin) did not produce NO. During the pyrolysis process, amino acids and/or proteins interact with pectin to fix nitrogen in char to make a char-N complex. Subsequently, char-N is oxidized in an oxygen-containing environment to form NO. However, the formation pathways of char-N deserve further investigation.
The present work focuses on the nitrogen fixation in char during co-pyrolysis of biomass/amino acid mixtures, and formation kinetics of NO during subsequent oxidation of char-N complex. Experiments
Experiments were carried out in a quartz flow tube reactor with a length of 50 cm and an ID of 9.0 mm. A 100mg sample was loosely packed in the middle of the tube sandwiched by two pieces of quartz wool. The sample was heated from room temperature up to a maximum of 700 °C at the heating rate of ~12 °C/min. The sample temperature was accurately monitored by a K-type thermocouple inserted inside the sample bed. The gas flow into the reactor was controlled at 1000 ml/min by a Hastings digital flow controller. The concentration of NO in the effluent gases was continuously monitored and analyzed using an on-line NLT2000 multi-gas analyzer. The char samples from the mixtures were prepared by heating them to a given temperature and holding for 30 minutes. Nitrogen content of char was determined by elemental analysis. To estimate the formation kinetics of NO, a mixture of pectin and proline was first heated in helium to different temperatures and then heated isothermally in a gas mixture containing 0.75% oxygen. Evolved NO was monitored as a function of time until no more NO was detected.
mixed with proline produced NO. When zein, a protein in a solid form, was mixed with the biomass model compounds and heated in an oxidizing atmosphere, again only its mixture with pectin produced NO. Unlike amino acids, the oxidation of pure zein produced NO (See Fig. 2). However, the pattern and the temperature range for NO
Figure 2. NO formation study from the mixtures of zein and pectin (solid line) and zein itself (dotted line) during the oxidation
Materials for this work were purchased from different sources as follow: Cellulose (Avicel) from FMC Corporation; pectin, rutin and glucose from ACROS; xylan and polygalactronic acid from Sigma; lignin from Aldrich; chrologenic acid from Fisher Scientific; all the amino acids (proline, asparagine, phenylalanine), and a protein (zein; a prolamine) from ACROS; and, all of the alkaloids, such as nicotine, cotinine, and myosmine used in this study were purchased from Sigma.
The mixtures of biomass model compounds (cellulose, pectin, xylan, and lignin) and other model compounds (rutin, glucose, chlorogenic acid, and polygalactronic acid) with nitrogenous organic compounds (amino acids, a protein, and alkaloids) were prepared by physical mixing. The weights of the mixtures are presented in weight percent (Wt%).
Prepr. Pap.-Am. Chem. Soc., Div. Fuel Chem. 2003, 48(2), 569

A simple chemical reaction for the NO formation from char-N can be written as follows:
formation of pure zein was quite different from its mixture with pectin. This observation indicates that proteins could also interact with pectin to produce NO. On the other hand, the mixtures of alkaloids with the biomass model compounds did not produce NO. This is expected, because the alkaloids evaporate before an interaction between them and the biomass compounds take place.
Char-N + O2 → NO When the concentration of oxygen is kept constant during the
reaction, the above reaction can be treated as a first order reaction with respect to the yield to be produced NO. The product yield, based on a first order reaction model for NO formation, can be expressed as:
When amino acids are mixed with pectin, the mixtures produce char between 250 °C and 350 °C, and this char gives NO upon oxidation [3]. Therefore, the study of char is important to shed light on the mechanism of NO formation during biomass combustion. Two char samples of pectin and 10% proline were prepared by heating the mixture in a flow tube reactor to 350 °C where the temperature was held for 30 min. One char was produced under pyrolysis conditions while the other one was produced under a partially oxidative condition (3% oxygen). NO formation has been observed from both types of char during oxidation at the high temperature range. This observation indicated that the oxygen is not essential for preparing char-N from the biomass mixture. The chars prepared from the mixtures with cellulose under a similar condition did not produce NO. As shown in Table 1, the nitrogen content in the char from the pectin mixture is much higher than that from the cellulose mixture. This result clearly indicates that pectin and amino acids strongly interact and retain nitrogen in the char structure.
ln ([NO]/[NO]∞) = kt; where k is Arrhenius rate constant Under steady state conditions, the instantaneous amount of NO, [NO]t and ultimate yields of NO, [NO]∞ can be calculated from the data collected for NO at any given temperature. The [NO]t/[NO]∞ is calculated for a few temperature reactions. Then, the activation energy and pre-exponential coefficient can be derived from the plot of ln([NO]t/[NO]∞) versus the inverse of temperature (1/T). Table 2 summarizes the results based on the yields measured for NO at different temperatures.
Table 2. NO yields with respect to the reaction temperatures T (°K)
k = [NO]t/[NO] ∞ (min-1)
1/T (1000 °K-1)
ln k
762 0.048 1.312 -3.034 783 0.065 1.277 -2.734 804 0.085 1.244 -2.462 825 0.110 1.212 -2.208
Table 1. Nitrogen contents in char from the pectin and cellulose
mixtures. (unit : wt%) Biomass Room Temp. 250 °C 300 °C 350 °C Pectin 1.49 0.73 0.52 0.46 Cellulose 1.13 0.09 0.10 0.08
From the Arrhenius plot (Fig. 4), the activation energy for NO formation reaction was estimated to be 16.3 kcal/mol with a pre-exponential coefficient of 2.39 x 10³ min-1.
Comparing the structures of the biomass model compounds
tested in this work, only pectin contains carboxylic acid functional groups in the structure. (See Figure 3) Others have either aliphatic (sugar, cellulose, xylan) or aromatic (lignin) hydroxyl groups. Amino acids have amine functional groups in the structure. It is conceivable from these facts to assume that the amine functional groups in amino acid and the carboxylate functional groups in pectin interact to fix nitrogen in the char.
Figure 3. The structure of Pectin
Figure 4 Arrhenius plot of NO formation from Char-N To further verify this thought, a few compounds with known
molecular weights and structures were chosen; ploygalactronic acid, a polymer with the subunit of pectin; chlorogenic acid, a phenolic compound with a sacharide unit; and, rutin, a phenolic compound with no sacharide unit. The first two compounds have the carboxylic acid functional group but rutin does not contain any acid group. The mixture of each acid and 10% proline produced NO at the high temperature range during the oxidation; but the mixture of rutin and 10% proline produced no NO at all. These results would further confirm our hypothesis that the condensation reaction between the carboxylic acid functional groups in biomass and the amine functional groups in amino acids would lead to the fixation of nitrogen in char.
Acknowledgment
The authors thank Dr. Robert Fenner and Dr. Donald Miser for helpful discussions. The authors also acknowledge Philip Morris USA management for their support and encouragement of basic research. References 1. Chen, J.C., Castagnoli, C., Niksa, S., Energy Fuels, 1992, 6, 264. 2. Wojtowicz, M.A., Pels, J.R., Moulijin, J.A., Fuel Process Technol, 1993,
34, 1. 3. Im, H.S., Rasouli, F., Hajaligol, M. preparing for publication. 4. Sakuma, H., Matsushima, S., Munakata, S., Agric. Biol. Chem., 1982,
46(5), 1311.
Prepr. Pap.-Am. Chem. Soc., Div. Fuel Chem. 2003, 48(2), 570
BEHAVIOUR OF MODEL SUBSTRATES IN CATALYTIC HYDROPYROLYSIS TO INVESTIGATE
PRESERVATION OF BIOMARKERS RELEASED FROM KEROGENS AND ASPHALTENES
Will Meredith1, Colin E. Snape1, Gordon D. Love2, Allan McGinn3
and Okan Sirkecioglu4
1Nottingham Fuel & Energy Centre, School of Chemical, Environmental and Mining Engineering
(SChEME), University of Nottingham, University Park, Nottingham NG7 2RD, United Kingdom, [email protected]
2School of Civil Engineering and Geosciences, University of
Newcastle, Drummond Building, Newcastle upon Tyne, NE1 7RU, United Kingdom
3University of Strathclyde, Dept. of Pure & Applied Chemistry,
Thomas Graham Building, 295 Cathedral St., Glasgow G1 1XL, United Kingdom
4Dept. of Chemistry, Istanbul Technical University, 80626, Istanbul,
Turkey Introduction
The use of hydropyrolysis (commonly abbreviated to hypy), which refers to pyrolysis assisted by high hydrogen gas pressures (>10 MPa) in the presence of a dispersed catalyst, as an analytical pyrolysis method for liberating covalently-bound biomarker hydrocarbon structures from kerogen was first reported by Love et al.(1). This and other subsequent studies have demonstrated the unique capability of the fixed-bed catalytic hydropyrolysis procedure to release much higher yields of aliphatic biomarker hydrocarbons (including n-hydrocarbons, hopanes and steranes) from immature kerogens compared to mild catalytic hydrogenation and traditional pyrolysis methods(1-5). .A combination of slow heating (<20oC min-
1), high hydrogen pressure (15 MPa) and use of a dispersed sulphided molybdenum catalyst represents the most effective regime for achieving high conversions to DCM-soluble products whilst minimising the structural rearrangement of biomarker species (3).
Kerogen-bound hopanes and steranes undergo the same epimerization reaction pathways as their free counterparts in the bitumen, but they are generally considerably less mature in terms of isomerisation at both ring and side-chain chiral centres. As a consequence, the biomarker profiles can be used to assess the maturity of source rocks with greater precision than using the free hydrocarbons and the successful application of hydropyrolysis to a contaminated core has been demonstrated(5). Further, hydropyrolysis tests on asphaltenes isolated from a biodegraded oil seep have shown that biomarker structures sequestered in heavy oil fractions are exceptionally well preserved against microbial alteration and that interpretable biomarker profiles can be generated(6).
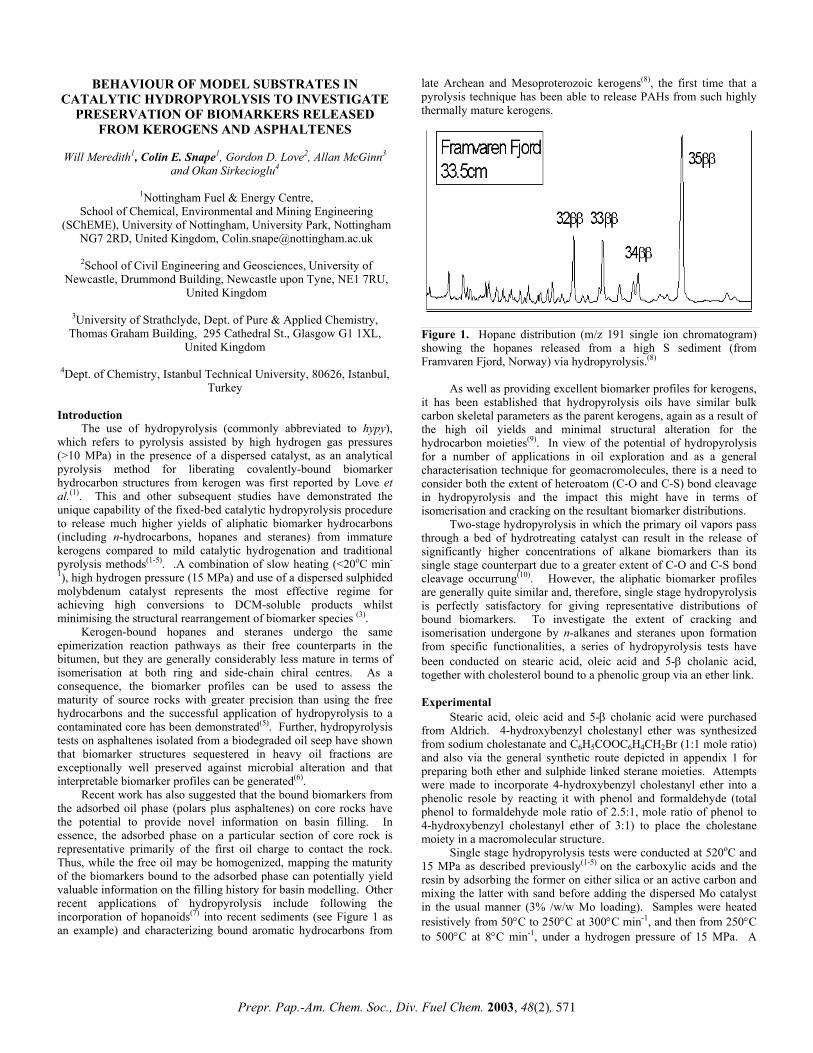
Recent work has also suggested that the bound biomarkers from the adsorbed oil phase (polars plus asphaltenes) on core rocks have the potential to provide novel information on basin filling. In essence, the adsorbed phase on a particular section of core rock is representative primarily of the first oil charge to contact the rock. Thus, while the free oil may be homogenized, mapping the maturity of the biomarkers bound to the adsorbed phase can potentially yield valuable information on the filling history for basin modelling. Other recent applications of hydropyrolysis include following the incorporation of hopanoids(7) into recent sediments (see Figure 1 as an example) and characterizing bound aromatic hydrocarbons from
late Archean and Mesoproterozoic kerogens(8), the first time that a pyrolysis technique has been able to release PAHs from such highly thermally mature kerogens.
Figure 1. Hopane distribution (m/z 191 single ion chromatogram) showing the hopanes released from a high S sediment (from Framvaren Fjord, Norway) via hydropyrolysis.(8)
As well as providing excellent biomarker profiles for kerogens, it has been established that hydropyrolysis oils have similar bulk carbon skeletal parameters as the parent kerogens, again as a result of the high oil yields and minimal structural alteration for the hydrocarbon moieties(9). In view of the potential of hydropyrolysis for a number of applications in oil exploration and as a general characterisation technique for geomacromolecules, there is a need to consider both the extent of heteroatom (C-O and C-S) bond cleavage in hydropyrolysis and the impact this might have in terms of isomerisation and cracking on the resultant biomarker distributions.
Two-stage hydropyrolysis in which the primary oil vapors pass through a bed of hydrotreating catalyst can result in the release of significantly higher concentrations of alkane biomarkers than its single stage counterpart due to a greater extent of C-O and C-S bond cleavage occurrung(10). However, the aliphatic biomarker profiles are generally quite similar and, therefore, single stage hydropyrolysis is perfectly satisfactory for giving representative distributions of bound biomarkers. To investigate the extent of cracking and isomerisation undergone by n-alkanes and steranes upon formation from specific functionalities, a series of hydropyrolysis tests have been conducted on stearic acid, oleic acid and 5-β cholanic acid, together with cholesterol bound to a phenolic group via an ether link. Experimental
Stearic acid, oleic acid and 5-β cholanic acid were purchased from Aldrich. 4-hydroxybenzyl cholestanyl ether was synthesized from sodium cholestanate and C6H5COOC6H4CH2Br (1:1 mole ratio) and also via the general synthetic route depicted in appendix 1 for preparing both ether and sulphide linked sterane moieties. Attempts were made to incorporate 4-hydroxybenzyl cholestanyl ether into a phenolic resole by reacting it with phenol and formaldehyde (total phenol to formaldehyde mole ratio of 2.5:1, mole ratio of phenol to 4-hydroxybenzyl cholestanyl ether of 3:1) to place the cholestane moiety in a macromolecular structure.
Single stage hydropyrolysis tests were conducted at 520oC and 15 MPa as described previously(1-5) on the carboxylic acids and the resin by adsorbing the former on either silica or an active carbon and mixing the latter with sand before adding the dispersed Mo catalyst in the usual manner (3% /w/w Mo loading). Samples were heated resistively from 50°C to 250°C at 300°C min-1, and then from 250°C to 500°C at 8°C min-1, under a hydrogen pressure of 15 MPa. A
Prepr. Pap.-Am. Chem. Soc., Div. Fuel Chem. 2003, 48(2), 571
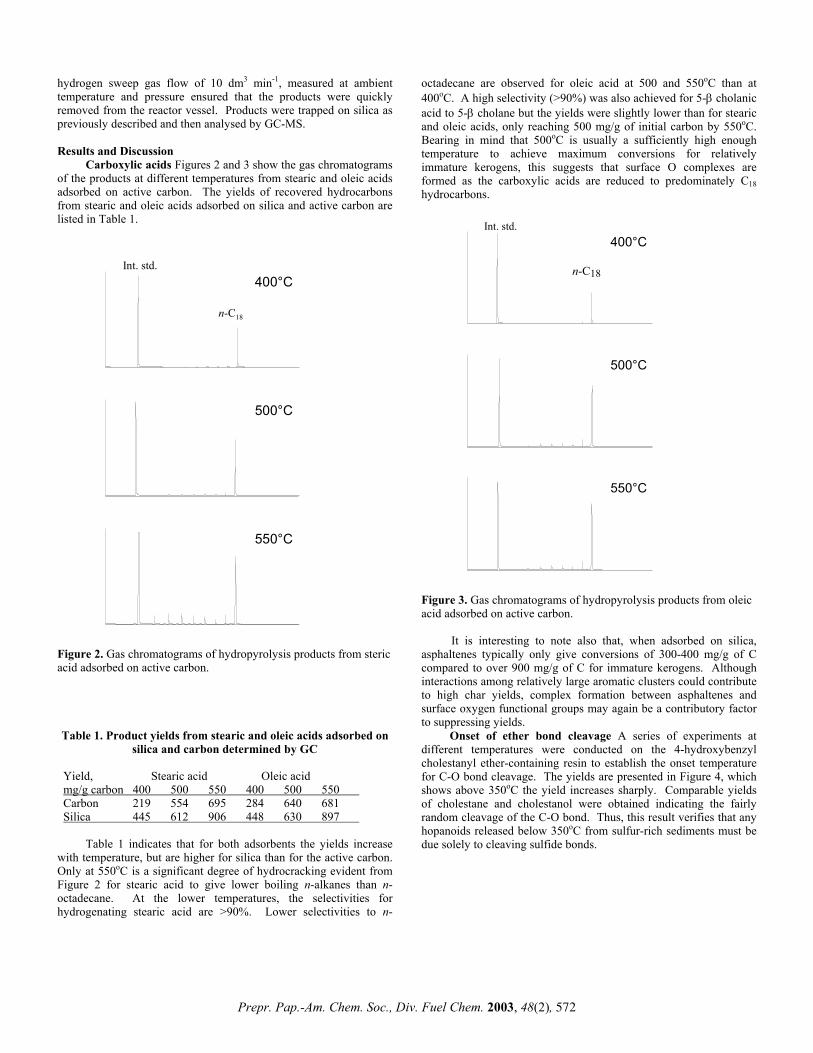
hydrogen sweep gas flow of 10 dm3 min-1, measured at ambient temperature and pressure ensured that the products were quickly removed from the reactor vessel. Products were trapped on silica as previously described and then analysed by GC-MS. Results and Discussion Carboxylic acids Figures 2 and 3 show the gas chromatograms of the products at different temperatures from stearic and oleic acids adsorbed on active carbon. The yields of recovered hydrocarbons from stearic and oleic acids adsorbed on silica and active carbon are listed in Table 1.
400°C
500°C
550°C
Int. std.
n-C18
Figure 2. Gas chromatograms of hydropyrolysis products from steric acid adsorbed on active carbon. Table 1. Product yields from stearic and oleic acids adsorbed on
silica and carbon determined by GC Yield, Stearic acid Oleic acid mg/g carbon 400 500 550 400 500 550 Carbon 219 554 695 284 640 681 Silica 445 612 906 448 630 897
Table 1 indicates that for both adsorbents the yields increase
with temperature, but are higher for silica than for the active carbon. Only at 550oC is a significant degree of hydrocracking evident from Figure 2 for stearic acid to give lower boiling n-alkanes than n-octadecane. At the lower temperatures, the selectivities for hydrogenating stearic acid are >90%. Lower selectivities to n-
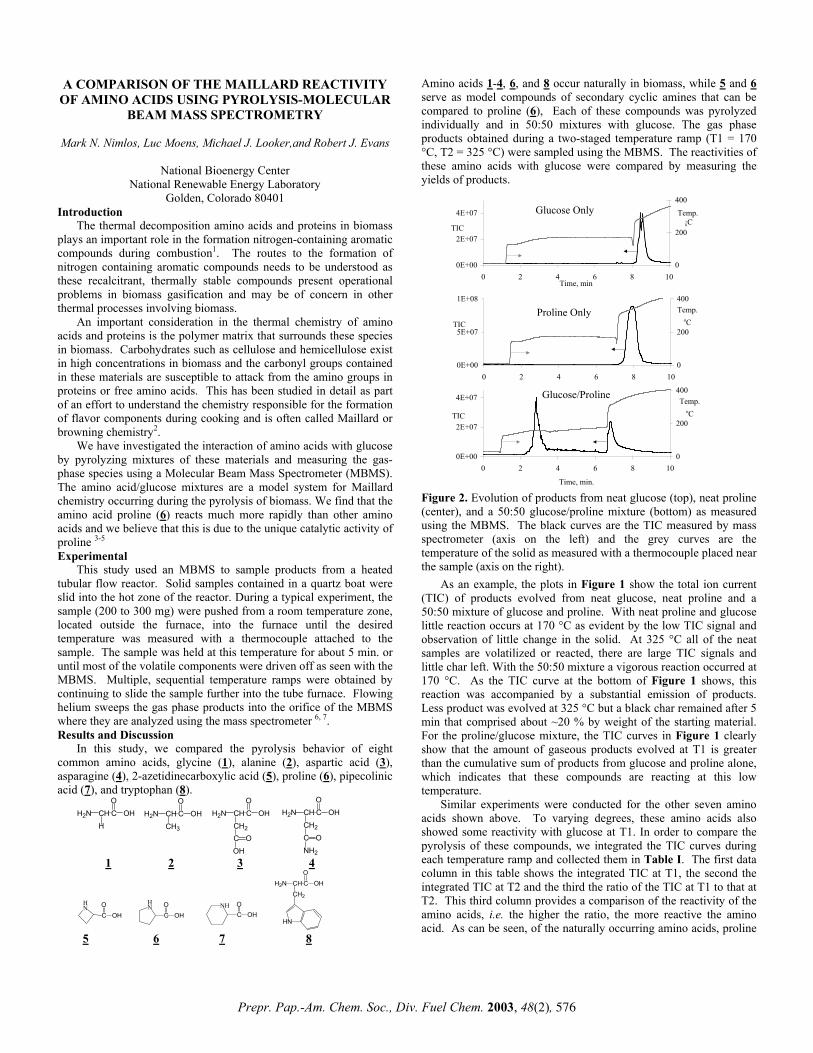
octadecane are observed for oleic acid at 500 and 550oC than at 400oC. A high selectivity (>90%) was also achieved for 5-β cholanic acid to 5-β cholane but the yields were slightly lower than for stearic and oleic acids, only reaching 500 mg/g of initial carbon by 550oC. Bearing in mind that 500oC is usually a sufficiently high enough temperature to achieve maximum conversions for relatively immature kerogens, this suggests that surface O complexes are formed as the carboxylic acids are reduced to predominately C18 hydrocarbons.
400°C
500°C
550°C
Int. std.
n-C18
Figure 3. Gas chromatograms of hydropyrolysis products from oleic acid adsorbed on active carbon.
It is interesting to note also that, when adsorbed on silica, asphaltenes typically only give conversions of 300-400 mg/g of C compared to over 900 mg/g of C for immature kerogens. Although interactions among relatively large aromatic clusters could contribute to high char yields, complex formation between asphaltenes and surface oxygen functional groups may again be a contributory factor to suppressing yields.
Onset of ether bond cleavage A series of experiments at different temperatures were conducted on the 4-hydroxybenzyl cholestanyl ether-containing resin to establish the onset temperature for C-O bond cleavage. The yields are presented in Figure 4, which shows above 350oC the yield increases sharply. Comparable yields of cholestane and cholestanol were obtained indicating the fairly random cleavage of the C-O bond. Thus, this result verifies that any hopanoids released below 350oC from sulfur-rich sediments must be due solely to cleaving sulfide bonds.
Prepr. Pap.-Am. Chem. Soc., Div. Fuel Chem. 2003, 48(2), 572

Figure 4. Yield of cholestane as a function of hydropyrolysis temperature from the 4-hydroxybenzyl cholestanyl ether co-resole.
Hopanoids – side chain cleavage Figure 1 shows the hopane profile (m/z 191 single ion chromatogram) for the recent high S sediment where the profile is dominated by the biologically-inherited C35 β,β hopane which is a reflection of the hopanoid skeleton being bound into the kerogen predominately via weak sulphided bonds (average of 5 bonds per chain). Indeed, hydropyrolysis at 350oC (see above) of the Framvaren sediment shows that 70%+ of the total hopanes released are still linked by one or more C-O covalent bonds. Since the strengths of C-O (ether) and C-C bonds are comparable, more cracking of the hopane side chain should accompany increasing proportions of C-O bonding for the hopanes. Further, C-C bond cleavage will also result as higher temperatures (>400oC) are experienced by the hopanoid moieties before they exit the reactor. The C32 β,β hopane and lighter hopanes could be diagenetic products and, consequently, the ratio of the C33-C34 β,β hopanes to C35 β,β hopane is probably the best indicator of the proportion of hopanoid side chain (C-C) cracking that occurs in hydropyrolysis. This ratio is ca. 0.6:1.0 for the high S sediment and this is probably a reflection of the fact that one or more C-O bonds still have to be cleaved to released the majority of the hopanes. Although side chain cleavage does occur to an appreciable extent, the ring stereochemistry is not markedly affected with the β,β epimers dominating. As found previously for Göynük oil shale(1), normal pyrolysis results in virtually complete cracking of the hopane side chain with no hopanes beyond C32 being evident. Conclusions
Selectivities for hydrogenating aliphatic carboxylic acids to the corresponding alkanes are extremely high with >90% being achieved for stearic acid 5-β cholanic acid. No isomerisation was evident for the cholestane-containing resin. Hydrocracking and isomerisation would thus appear to be negligible for single functionalised steranes. However, complex formation with surface oxygen functional groups for both the carboxylic acids and asphaltenes is a contributory factor to not achieving higher conversions until temperatures in excess of 500 oC. Ether bonds do not start to cleave until 350 oC indicating that biomarkers released at lower temperatures from S-rich kerogens arise from cleaving sulphides only.
Acknowledgement. The authors thank the National Environmental Research Council (NERC) for financial support (Ocean Margins LINK grants, nos. NER/T/S/2000/01366 and 2001/01153).
Catalytic HyPy Cholestane Yields.
0
5
10
15
20
290 310 330 350 370 390
Catalytic HyPy Temperature / °C
Yie
ld o
f Cho
lest
ane
(mg
/ g in
itial
co-
resi
te)
References (1) Love, G.D., Snape, C.E., Carr, A.D., Houghton, R.C., 1995.
Organic Geochemistry, 1995, 23, 981. (2) Love, G.D., Snape, C.E., Carr, A.D., Houghton, R.C., Energy & Fuels, 1996, 10, 149.
(3) Love, G.D., McAulay, A., Snape, C.E., Bishop, A.N., Energy & Fuels, 1997, 11, 522.
(4) Bishop, A.N., Love, G.D., Snape, C.E., Farrimond, P., Organic Geochemistry, 1998, 29, 989.
(5) Murray, I.P., Love, G.D., Snape, C.E., Bailey, N.J.L., Organic Geochemistry, 1998, 29, 1487.
(6) Murray, I.P.; Snape, C.E.; Love, G.D.; and Bailey, N.J.L. Abs. for 19th Int. Meeting on Organic Geochemistry, Istanbul, 6-10 September 1999, Part 1, No. PB10, pp 341-342.
(7) Farrimond, P., Bishop, A.N., Innes, H.E., Watson, D.F., Love G.D. and Snape, C.E., Geochim Cosmochim Acta, 2003, 67, 1383.
(8) Brocks, J.J., Love, G.D., Snape, C.E., Logan, G.A., Summons R.E. and Buick, R., Geochim Cosmochim Acta, 2003, 67, 1521.
(9) Maroto-Valer, M.M.; Love, G.D.; and Snape, C.E. Energy Fuels 1997, 11, 539.
(10) Snape, C.E, Love, G.D. and Murray, I.P., Prepr. Am. Chem. Soc. Div. Fuel Chem., 2001, 46(1), 204.
(11) Snape, C.E., Meredith, W., Russell, C.A., Cooper, M., Love, G.D. and Fabbri, D., Prepr. Am. Chem. Soc. Div. Fuel Chem., 2003, 48(1), 16.
ROH, NaHTHF
RSH, NaHTHF
OCH2CH=CH2
CH2SR
R = cholesteryl 6
OCH2CH=CH2
CH2Cl
OCH2CH=CH2
CH2OR
R = cholesteryl 4 R' = cholestanyl 5
Pd(PPh3)4NaBH4
Pd(PPh3)4NaBH4
OH
CH2SR
OH
CH2OR
R = cholesteryl 6a R = cholesteryl 4a R' = cholestanyl 5a
Appendix 1 General synthetic route for ether and sulphide liked steranes
Prepr. Pap.-Am. Chem. Soc., Div. Fuel Chem. 2003, 48(2), 573

PETROLEOMICS: ESI FT-ICR MS IDENTIFICATION OF HYDROTREATMENT - RESISTANT NEUTRAL AND ACIDIC NITROGEN SPECIES IN CRUDE OIL
Ryan P. Rodgers2, Geoffrey C. Klein1, Vince Nowlan3,
and Alan G. Marshall2
1. Department of Chemistry and Biochemistry, Florida State University, Tallahassee, Florida 32306.
2. Ion Cyclotron Resonance Program, National High Magnetic Field Laboratory, Florida State University, 1800 E Paul Dirac Drive,
Tallahassee, Florida 32310. 3. Syncrude Canada Ltd., Edmonton, Alberta, T6N 1H4
Introduction
ESI FT-ICR MS analysis of complex mixtures, such as crude oil, achieves high mass resolving power (m/∆m50% > 300,000, in which ∆m50% denotes mass spectral peak full width at half height) and high mass accuracy (< 1 ppm).1 Selective ionization of polar NSO compounds by ESI FT-ICR MS is of great interest in the refining of crude oils, because the nitrogen-containing compounds are known to play a key role in catalyst deactivation through coke formation on the catalyst surface. The removal of nitrogen compounds from refined fuels is also necessary to prevent the formation of gums and solid precipitates during storage. Here we apply ESI FT-ICR MS to two narrow distillation cuts that have undergone hydrotreatment for the removal of nitrogen species in crude oil. Compositional analyses of both samples before and after hydrotreatment identify species resistant to the chosen reaction conditions and helps establish removal efficiencies / reactivity of all identified species.
Experimental
Crude Oil Samples. Two narrow distillation cuts, 483-504 ˚C and 504-524 ˚C, of a crude oil were subjected to hydrotreatment for the removal of nitrogen compounds. Retention chromatography was performed to produce nitrogen concentrates for ESI FT-ICR MS analysis. 20 mg of each sample was dissolved in 10 mL of toluene and then diluted with 10 mL of methanol to a final volume of 20 mL. The samples were further diluted to a final concentration of 0.1 mg of crude/mL of solvent. One mL of the final solution was spiked with 30 µL of ammonium hydroxide to facilitate deprotonation for the ESI FT-ICR mass spectral analysis.
Mass Analysis. The crude oils were analyzed at the National High Magnetic Field Laboratory (NHMFL) with a homebuilt 9.4 Tesla Fourier transform mass spectrometer. Ions were generated externally by a micro-electrospray source and samples were delivered by a syringe pump at a rate of 300 nL/min. Approximately 2.2 kV was applied between the capillary needle and ion entrance (heated metal capillary). The externally generated ions were accumulated in a short (15 cm) rf-only octopole for 10-30 s and then transferred via a 200 cm rf-only octopole ion guide to a Penning trap. Ions were excited by frequency-sweep (100-725 kHz @ 150 Hz/µs at an amplitude of 200 Vp-p across a 10-cm diameter open cylindrical cell). The time-domain ICR signal was sampled at 1.28 Msample/s for 3.27 s to yield 4 Mword time-domain data. Ten to two hundred data sets were co-added, zero-filled once, Hanning apodized, and fast Fourier transformed with magnitude computation. A continuous wave 40 W CO2 laser (Synrad E48-2-115, Bothell, WA) was used to investigate the presence / dissociate non-covalent ion complexes. Mass spectra were internally calibrated with respect to the most abundant heteroatom containing series over the full mass range.
Homologous series were separated and grouped by nominal Kendrick mass and Kendrick mass defect to facilitate rapid identification, as described elsewhere.2
Results and Discussion
Variations in heteroaromatic content of two distillation cuts of a heavy crude oil both before and after hydrotreatment were first investigated by comparison of the negative ion ESI FT-ICR mass spectra of crude oil nitrogen concentrates. Figure 1 shows the broadband mass spectrum of the unprocessed nitrogen oil concentrate that represents the 483-504 ºC distillation cut. The mass spectrum is composed of ~8,000 peaks with as many as 20 peaks at a single nominal mass. Mass resolving power exceeds 300,000 for all spectra presented. Figure 2 shows a similar broadband mass spectrum of the same distillation cut after hyrdotreatment. The processed oil mass spectrum is markedly less complex with fewer peaks over a similar mass range. As evident from the comparison of Figures 1 and 2, the hydrotreatment process had little effect on the molecular weight distribution of the nitrogen concentrate analyzed.
(483-504 ºC) Distillation Cut of Unhydrotreated Crude Oil
m/z700650600550500450400350300250
(483-504 ºC) Distillation Cut of Unhydrotreated Crude Oil
m/z700650600550500450400350300250
Figure 1. Broadband mass spectrum of a nitrogen concentrate isolated from narrow distillation cut of unprocessed crude oil.
m/z700650600550500450400350300250
(483-504 ºC) Distillation Cut of Hydrotreated Crude Oil
m/z700650600550500450400350300250
(483-504 ºC) Distillation Cut of Hydrotreated Crude Oil
Figure 2. Broadband mass spectrum of a nitrogen concentrate isolated from narrow distillation cut of hydrotreated crude oil.
Prepr. Pap.-Am. Chem. Soc., Div. Fuel Chem. 2003, 48(2), 574

Detailed compositional differences are visually provided by comparison of the two broadband mass spectra at a single nominal mass. Figure 3 shows such a comparison at m/z = 414. Note, detailed compositional information is also provided at every other nominal mass over the entire mass range.
Figure 5 shows a similar bar graph for the hydrotreated oil nitrogen concentrate. Comparison of the two bar graphs identifies persistent species under the chosen hydrotreatment conditions.
(483-504 ºC) Distillation Cutof Hydrotreated Crude Oil
0
10
20
30
40
50
60
70
80
90
N O2
NS
NO
S
NO
N O
2
N O
3
N2
N2
O
O OS
Un
ID
N S
2
N3
O2
S
O3
S
O3
O4
N2
S
O S
2
% R
elat
ive
Abu
ndan
ce
(483-504 ºC) Distillation Cutof Hydrotreated Crude Oil
0
10
20
30
40
50
60
70
80
90
N O2
NS
NO
S
NO
N O
2
N O
3
N2
N2
O
O OS
Un
ID
N S
2
N3
O2
S
O3
S
O3
O4
N2
S
O S
2
% R
elat
ive
Abu
ndan
cem/z
414.350414.325414.300414.275414.250414.225414.200414.175
(483-504 ºC) Distillation Cut of Hydrotreated Crude Oil
(483-504 ºC) Distillation Cut of Unhydrotreated Crude Oil
m/z414.350414.325414.300414.275414.250414.225414.200414.175
(483-504 ºC) Distillation Cut of Hydrotreated Crude Oil
(483-504 ºC) Distillation Cut of Unhydrotreated Crude Oil
Figure 5. Bar graph that lists the most abundant classes identified in the hydrotreated oil nitrogen concentrate.
Figure 3. Zoom mass inset of both the unprocessed (top) and hydrotreated (bottom) mass spectra at m/z = 414. As with the broadband mass spectra, the hydrotreated nitrogen concentrate is far less complex than the unprocessed with fewer peaks per nominal mass.
The hydrotreatment clearly has an effect on the classes of
compounds observed in the ESI FT-ICR mass spectrum. However, many nitrogen species are present after hydrotreatment and appear to have relatively low reactivity under the chosen conditions. This provides insight into the reactivity of these classes under hydrotreatment conditions. Data for another distillation cut of the same oil, under the same hydrotreatment conditions show similar results. Future work will concentrate on various hydrotreating conditions in an attempt to better understand the reactivity of the N-containing heteroaromatic species present in crude oil.
Exact mass measurement (less than 1ppm) provided by FT-ICR
allows for the assignment of elemental compositions for all observed peaks in the mass spectrum. This compositional information allows for direct comparisons of the difference classes of compounds identified in each of the crudes both before and after hydrotreatment. The comparison allows for the determination of persistent or unreactive species in the hydrotreatment process. Figure 4 shows a bar graph that lists the most abundant classes identified in the unprocessed oil nitrogen concentrate.
Acknowledgment
This work was supported by NSF CHE-99-09502, Florida State University, and the National High Magnetic Field Laboratory in Tallahassee, FL.
(483-504 ºC) Distillation Cutof Unhydrotreated Crude Oil
0
5
10
15
20
25
30
35
N O2
NS
NO
S
NO
N O
2
N O
3N
2
N2
O
O OS
Un
ID
N S
2
N3
O2
S
O3
S
O3
O4
N2
S
O S
2
% R
elat
ive
Abu
ndan
ce
(483-504 ºC) Distillation Cutof Unhydrotreated Crude Oil
0
5
10
15
20
25
30
35
N O2
NS
NO
S
NO
N O
2
N O
3N
2
N2
O
O OS
Un
ID
N S
2
N3
O2
S
O3
S
O3
O4
N2
S
O S
2
% R
elat
ive
Abu
ndan
ce
References 1. Qian, K; Robbins, W. K.; Hughey, C. A.; Cooper, H. J.; Rodgers, R. P.; Marshall, A. G., Energy and Fuels, 2001, 1505-1511 2. Hsu, C. S.; Qian, K.; Chen, Y. C., Analytica Chimica Acta, 1992,
79-89.
Figure 4. Bar graph that lists the most abundant classes identified in the unprocessed oil nitrogen concentrate.
Prepr. Pap.-Am. Chem. Soc., Div. Fuel Chem. 2003, 48(2), 575
Amino acids 1-4, 6, and 8 occur naturally in biomass, while 5 and 6 serve as model compounds of secondary cyclic amines that can be compared to proline (6), Each of these compounds was pyrolyzed individually and in 50:50 mixtures with glucose. The gas phase products obtained during a two-staged temperature ramp (T1 = 170 °C, T2 = 325 °C) were sampled using the MBMS. The reactivities of these amino acids with glucose were compared by measuring the yields of products.
A COMPARISON OF THE MAILLARD REACTIVITY OF AMINO ACIDS USING PYROLYSIS-MOLECULAR
BEAM MASS SPECTROMETRY Mark N. Nimlos, Luc Moens, Michael J. Looker,and Robert J. Evans
National Bioenergy Center
National Renewable Energy Laboratory Golden, Colorado 80401
0E+00
5E+07
1E+08
0 2 4 6 8 10
Time min.
TIC
0
200
400Temp.
oCProline Only
0E+00
2E+07
4E+07
0 2 4 6 8 10
Time, min.
TIC
0
200
400Temp.
oC
Glucose/Proline
0E+00
2E+07
4E+07
0 2 4 6 8 10Time, min
TIC
0
200
400Temp.
¡CGlucose OnlyIntroduction
The thermal decomposition amino acids and proteins in biomass plays an important role in the formation nitrogen-containing aromatic compounds during combustion1. The routes to the formation of nitrogen containing aromatic compounds needs to be understood as these recalcitrant, thermally stable compounds present operational problems in biomass gasification and may be of concern in other thermal processes involving biomass.
An important consideration in the thermal chemistry of amino acids and proteins is the polymer matrix that surrounds these species in biomass. Carbohydrates such as cellulose and hemicellulose exist in high concentrations in biomass and the carbonyl groups contained in these materials are susceptible to attack from the amino groups in proteins or free amino acids. This has been studied in detail as part of an effort to understand the chemistry responsible for the formation of flavor components during cooking and is often called Maillard or browning chemistry2.
We have investigated the interaction of amino acids with glucose by pyrolyzing mixtures of these materials and measuring the gas-phase species using a Molecular Beam Mass Spectrometer (MBMS). The amino acid/glucose mixtures are a model system for Maillard chemistry occurring during the pyrolysis of biomass. We find that the amino acid proline (6) reacts much more rapidly than other amino acids and we believe that this is due to the unique catalytic activity of proline 3-5
Figure 2. Evolution of products from neat glucose (top), neat proline (center), and a 50:50 glucose/proline mixture (bottom) as measured using the MBMS. The black curves are the TIC measured by mass spectrometer (axis on the left) and the grey curves are the temperature of the solid as measured with a thermocouple placed near the sample (axis on the right).
Experimental This study used an MBMS to sample products from a heated
tubular flow reactor. Solid samples contained in a quartz boat were slid into the hot zone of the reactor. During a typical experiment, the sample (200 to 300 mg) were pushed from a room temperature zone, located outside the furnace, into the furnace until the desired temperature was measured with a thermocouple attached to the sample. The sample was held at this temperature for about 5 min. or until most of the volatile components were driven off as seen with the MBMS. Multiple, sequential temperature ramps were obtained by continuing to slide the sample further into the tube furnace. Flowing helium sweeps the gas phase products into the orifice of the MBMS where they are analyzed using the mass spectrometer 6, 7.
As an example, the plots in Figure 1 show the total ion current (TIC) of products evolved from neat glucose, neat proline and a 50:50 mixture of glucose and proline. With neat proline and glucose little reaction occurs at 170 °C as evident by the low TIC signal and observation of little change in the solid. At 325 °C all of the neat samples are volatilized or reacted, there are large TIC signals and little char left. With the 50:50 mixture a vigorous reaction occurred at 170 °C. As the TIC curve at the bottom of Figure 1 shows, this reaction was accompanied by a substantial emission of products. Less product was evolved at 325 °C but a black char remained after 5 min that comprised about ~20 % by weight of the starting material. For the proline/glucose mixture, the TIC curves in Figure 1 clearly show that the amount of gaseous products evolved at T1 is greater than the cumulative sum of products from glucose and proline alone, which indicates that these compounds are reacting at this low temperature.
Results and Discussion In this study, we compared the pyrolysis behavior of eight
common amino acids, glycine (1), alanine (2), aspartic acid (3), asparagine (4), 2-azetidinecarboxylic acid (5), proline (6), pipecolinic acid (7), and tryptophan (8).
H2N CH CH
OHO
H2N CHCCH3
OHO
H2N CH CCH2
OHO
COH
O
H2N CH CCH2
OHO
CNH2
O
Similar experiments were conducted for the other seven amino acids shown above. To varying degrees, these amino acids also showed some reactivity with glucose at T1. In order to compare the pyrolysis of these compounds, we integrated the TIC curves during each temperature ramp and collected them in Table I. The first data column in this table shows the integrated TIC at T1, the second the integrated TIC at T2 and the third the ratio of the TIC at T1 to that at T2. This third column provides a comparison of the reactivity of the amino acids, i.e. the higher the ratio, the more reactive the amino acid. As can be seen, of the naturally occurring amino acids, proline
1 2 3 4
HN
C OHO NH
C OHO
H2N CHCCH2
OHO
HN
HN
C OHO
5 6 7 8
Prepr. Pap.-Am. Chem. Soc., Div. Fuel Chem. 2003, 48(2), 576

has the largest ratio and the greatest reactivity towards carbohydrates. This is consistent with the known catalytic properties of proline 3-5, 8.
Table I Integrated Total Ion Current [(TIC)a × 104 cnts ] for amino acids mixed with glucose (50:50 mixtures)
Temperature ramp species T1
170 °C T2 325 °C
T1/T2
Naturally Occurring Amino Acids
proline (6) 4.2 2.9 1.4 Alanine (2) 1.1 2.8 0.39 aspartic acid (3) 1.2 1.8 0.71 asparagine (4) 0.51 1.1 0.48 glycine (1) 0.77 2.6 0.29 Tryptophan (8) 0.86 5.9 0.15
Other Secondary Amino Acids
pipecolinic acid (7) 2.0 4.5 0.44 2-azetidinecarboxylic acid (5) 1.3 1.2 1.10 aAreas are normalized to mass (mg) of starting material
Typical mass spectra obtained during these temperature ramps are shown in Figures 2. At T1 the neat glucose spectrum is dominated by fragmentation (both thermal and ionization), dehydration products (144 and 126) and cracking. The neat proline spectrum is dominated by fragmentation of proline and the diketopiperazine (m/z = 194 and 70), a common product of amino acid pyrolysis9.
The mass spectrum of the 50:50 mixture at 170 °C contains some of the same peaks from the neat compounds (with greater intensity) as well as other peaks indicative of Maillard chemistry. The two prominent peaks are m/z =44 and 84 are likely due to carbon dioxide and fragment ions from 9 (1-(1'-pyrrolidinyl)-2-propanone) and 10 (2-hydroxy-1-(1’-pyrrolidinyl)-1-buten-3-one 10, 11.
N
O
N
O
O
9 10 In addition to these peaks, there are a large number of weak
features that are collected in groups spaced roughly 14 amu apart. These features become more pronounced at 325 °C as is shown in the spectrum at the bottom of Figure 2. The spacing of these peaks is suggestive of a homologous series of compounds with increasing numbers of methyl groups. These compounds likely result from thermal cracking of the primary Maillard chemistry products such as 9 and 10. Many of these products are probably similar to the secondary products identified elsewhere 10, 11. In this complex suite of compounds there are nitrogen containing ring compounds including aromatic compounds.
The enhanced reactivity of proline towards glucose as indicated by Table I is most likely due to properties which proline a good catalyst for aldol reactions 3-5, 12. Proline is known to be a more effective catalyst compared to primary amino acids, noncyclic secondary amino acids and cyclic amino acids with 6-membered rings 4, 5. Interestingly, 4-membered ring amino acids were shown to have catalytic activity similar to proline. As mentioned above, we compared the reactivity of cyclic amino acids with a 4-membered ring (5) and a 6-membered ring (7) to proline. The 6-membered ring amino acid (7) was not as reactive as proline, while the 4-membered ring amino acid (5) was. This suggests that the molecular structure of proline enhances the catalytic activity for aldol reactions for the same reason that it enhances its reactivity in Maillard chemistry. The
similarity of Maillar chemistry and aldol catalysis is also found in the proposed mechanisms.
43
3118 60
14412673
0.0.E+00
6.0.E+03
1.2.E+04
0 50 100 150 200
Intensity
Glucose Only 170 ¡C
17 99 194
41
70
0.E+00
3.E+03
6.E+03
0 50 100 150 200
Intensity
Proline Only 170 oC
110 1442984
70
19418
44
0.E+00
1.E+06
2.E+06
0 50 100 150 200
m/z
IntensityGlucose/Proline 170 oC
43
70
84 96 110 194
0.E+00
1.E+06
0 50 100 150 200
m/z
Intensity
Glucose/Proline 325 oC
Figure 2. Averaged mass spectra of products from T1 in Figure 1 and T2 for the glucose/proline mixture. Notice that many of the peaks in the mixture correspond to the peaks in the individual components. However, there are peaks that are unique to the mixture, most prominently at m/z = 84 and 44.
Acknowledgment The authors gratefully acknowledge the financial support from
Phillip Morris, USA Inc. and stimulating discussions with Geoffrey Chan and Mohammad R. Hajaligol. References 1. Brink, A., P. Kilpinen, and M. Hupa, Energy Fuels, 2001. 15(5): 1094. 2. T. P. Labuza, G.A.R., V. M. Monnier, J. O'Brien, J. W. Baynes, ed.
Maillard Reactions in Chemistry, Food and Health. 1994, Royal Society of Chemistry: Cambridge.
3. Movassaghi, M. and E.N. Jacobsen, Science, 2002. 298(5600): 1904. 4. Sakthivel, K., W. Notz, T. Bui, and C.F. Barbas, J. Am. Chem. Soc., 2001.
123(22):5260. 5. List, B., R.A. Lerner, and C.F. Barbas, J. Am. Chem. Soc., 2000. 122(10):
2395. 6. Evans, R.J. and T.A. Milne, Energy Fuels, 1987. 1(2): p. 123-137. 7. Shin, E.J., M.R. Nimlos, and R.J. Evans, Fuel, 2001. 80(12): 1697. 8. List, B., Tetrahedron, 2002. 58(28): 5573. 9. Ratcliff, M.A., E.E. Medley, and P.G. Simmonds, J. Org. Chem., 1974.
39(11): 1481. 10.Tressl, R., B. Helak, E. Kersten, and D. Rewicki, J. Agric. Food Chem.,
1993. 41(4): 547. 11.HuyghuesDespointes, A. and V.A. Yaylayan, J. Agric. Food Chem., 1996.
44(3): 672 12.Rankin, K.N., J.W. Gauld, and R.J. Boyd, J. Phys. Chem. A, 2002.
106(20): 5155.
Prepr. Pap.-Am. Chem. Soc., Div. Fuel Chem. 2003, 48(2), 577
Co-Treatment for Chlorinated Organic Waste Solvents and Volatile Organic Compounds in a Laboratory Scale
Spouted Bed Incineration System
Chieh Lin,Yi Hung Tseng, Ming Kuei Hsieh, Ming Da Chen and Yen Fen Li
Environmental Engineering and Science Department
National Ping-Tung University of Science and Technology (NPUST) Nei Pu,Ping-Tung,,91201,Taiwan,R.O.C.
Introduction
Chlorinated organic waste solvents and volatile organic compounds are the by-products from most of the industrial processes for examples petroleum, chemistry, medical, electric and so on. These chlorinated compounds in the waste stream may cause some adverse effects on human health and environmental impact. One of the major treatment technology applied for these waste is incineration. In order to avoid the secondary pollution comes from incineration, evaluating the products of incomplete combustion (PICs) out of the incineration system will help to identify the better combination of the combustor and APCD operation parameters. Based on the capacity, efficiency and safety issues of treatment, incineration is recognized as one of the most popular ways to deal with the waste stream. In order to avoid the emissions of the hazardous air pollutants (HAPs) from an incinerator, it is essential to continuously monitor the operating conditions and the composition of the exhaust gas. Graham et al.,[1] conducted thermal decomposition laboratory study for a mixture of chlorinated organic compounds and found the number and complexity of thermal reaction products increased with decreasing oxygen concentration. The PICs ranged from simple chlorinated aliphatics to complex polynuclear aromatics. Staley et al., [2] and Dellinger et al.,[3] showed later there is no direct relationship between the combustion efficiency and the PICs while measurements are conducted on full-scale hazardous waste incinerator. The results suggested chemical reaction kinetics controlled the relative emission rates of the surrogate compounds during incineration tests. Taylor et al.,[4] used a detailed reaction mechanism to present molecular growth up to the formation of C8Cl6(cy) and C8Cl8(cy) under the pyrolysis of trichloroethene and conclude the important radical-molecule addition reactions leading to molecular growth.. Senkan et al.,[5,7] and Huang et al.,[6] estimated the reaction rate coefficient for the abstraction of hydrogen atoms from organic compounds by chlorine radical attack and observe trace byproducts including PAHs in the chlorinated hydrocarbon and methane flames. Lemieux et. al,[8] also indicated that combustion of dichloromethane (CH2Cl2) produces higher levels of PICs than combustion of carbon tetrachloride (CCl4). Wheatley et al.,[9] investigated the effects of both the flame and the postflame conditions on the PAH emission levels for burning plastic polymers. A clear trend in the emissions of unburned hydrocarbons is found and destruction of organic compounds is enhanced with increasing postflame residence time and temperature. Kanters et al., [10] observed with an (up to 8-fold) increase of the PVC load in the MSW , only a slight increase of chlorophenol emission level by using a micromodel combustion reactor. Van Dell et al.,[11] obtained data from burning dichlorobenzene and developed a global kinetic model to describe the fromation and destruction of PICs. Their results showed that reformation might be a dominant pathway to cause the appearance and subsequent disappearance of the same PICs as temperature and/or spatial location is varied. A laboratory scale incineration system has the ability to create the reproducible and stable experimental conditions under the designed operating criteria. These advantages stimulate the application of a laboratory scale
combustor to investigate the key operating parameters related to the treatment performance in terms of the CE, the DRE of POHCs as well as the PICs. Tia et al., [12,13] studied the devolatilization and volatile combustion of a single coal particle and a batch of carbon particles in a laboratory scale spouted bed combustor. Comparison of the model prediction and the experimental data showed heat transfer controls the devolatilization rate. Wongvicha et al., [14] further developed a simulation model to predict continuous lignite char combustion in a spouted bed. In a spouted bed, about 60-65% of combustion of fuel takes place in the annulus region. Formation of the aromatic hydrocarbon products for combustion of chlorinated organic compounds in a laboratory scale spouted bed incinerator will be reported in this contribution. The goal is to identify trends in PICs emission levels with combustion parameters. Experimental Section
A laboratory scale spouted bed incineration system is employed to simulate the hazardous air pollutants behaviors in the post-combustion region. By inducing the secondary auxiliary air after the flame, the effect on PICs formation is reported. The purpose of the post-combustion chamber is to have more space and residence time for unburned waste or fuel to proceed the complete reaction. Those hydrodynamic phenomenon and the reaction kinetic parameters will affect directly or indirectly to the chemical formation and destruction. The significant impact was introduced by the temperature quench and the particulate matter surface catalysis. Some pyrolysis pockets in the combustion zone may both inhibit the reaction and enhance the PICs formation. Toluene and heptane were chosen as the primary fuel mixing with some chlorinated aromatics hydrocarbons for combustion. The vortex auxiliary air is introduced from the radial direction alone the wall of the reactor. Temperature, flowrate and the oxygen content of the secondary auxiliary air can be controlled. Chlorinated aromatic PICs (i.e. CBz, CPz, PCB, PCN, PCDD/F) are monitored. The spouted bed is characterized as a special type of fluidized bed. Since the circulating bed medium can act as a mobile heat exchanger between the reactants and products, the spouted bed combustor is especially attractive for the incineration of low heat value fuel. The preliminary studies show the influence of the bed medium types and the packed bed high on the destruction efficiency in the spouted bed. The heterogeneous effect is also reported by applying a chemical kinetic model. The final goal of this study is to develop a numerical model to simulate the spouted bed reactor. The discrepancy between the experimental results and the model predictions will be discussed further.
The experimental system for this study basically consists of three sections: air/fuel preheater and mixer, spouted bed combustor and sampling train. The primary aspects of this study is to investigate the flue gas quenching effect and the oxygen contents on PICs formation in the downstream of flame regime. Spouted bed is characterized as a special type of fluidized bed. Since circulating bed medium can act as a mobile heat exchanger between products and reactants, the spouted bed combustor is especially attractive for the incineration of low heat value fuel in laboratory research. The combustor employed in this study is a cone-shape all quartz 60 cm length spouted bed reactor, with a 1 mm inlet diameter and 5.5 cm column diameter. The reactor was uninsulated so as to facilitate visual observation of flame stability and particle circulation. Under Combustion condition the bed height was always kept at 70mm. The bed medium is a nature silica sand with ~1.0 mm diameter. A mixing fluid of air and gasified model fuel (i.e. n-heptane and toluene) was injected through the single inlet aperture from the conical base of the spouted bed combustor. While the velocity of fluid beyond a certain minimum value, a stream of bed particles were raised rapidly in a hollowed central core (the “spout”) forming a fountain of variable
Prepr. Pap.-Am. Chem. Soc., Div. Fuel Chem. 2003, 48(2), 578
height above the bed level. The particles rain back onto the annular region between the spout and the wall and thereafter travel slowly downward in a particle dense phase with countercurrent percolation of fluid. In order to take samples from combustor and measure temperature inside bed region, three sampling probes were built at the side of the reactor. Two sampling cross, consisting of four ball joint ports which enable the insertion of probes and simultaneously sampling from different radial locations, were constructed in the freeboard region of the spouted bed reactor. All temperature reading was continuously monitored through a data acquisition on-line system. PICs, normally trace amount, were sampled by using a semivolatile/volatile organic compounds sampling train. The sampling train consists a fiber filter (1.6 m mean cut size), an impinger, a flow meter and a vacuum pump. Recovery solvent was placed in the impinger to trap organic compounds. The collected sample including the filter and the trap was subjected to Soxhlet extraction with dichloromethane. Analyses for DRE and PICs are performed on a HP 5890 gas chromatograph coupled to a HP 5972 mass selective detector (GC/MSD). To avoid the variation of hydrodynamic aspects in the spouted bed, the oxidizing air flow rate is fixed at the constant flow rate. The fuel lean regime is conducted to simulate the normal incineration cases. The sampling probes C, D, E are located above the bed surface 15cm, 35cm, and 55cm, respectively. The same volume of bed medium is packed in the spouted bed reactor for each experimental run. After the auxiliary fuel was ignited and the flame steady located at the bed surface, the sampling train was attached to the designed position to collect the flue gas sample. Normally, the sampling flow rate was adjusted to meet the isokinetic sampling condition and the sample was taken for hours to get enough volume for analysis. Results and Discussion
The bed temperature is a function of the equivalence ratio as no separate temperature control is provided to the bed. Temperature contour profile in the spouted bed combustor was shown in Figure 1. The temperature difference between the center and the wall of the reactor was enlarged between Cc and Cw. This result presents the combustion reaction is still active in the post combustion region. The effluent gas was channeled to the sampling train continuously measure emission of the residues of model fuel, subsequently these values were converted to the DRE.
-25 -20 -15 -10 -5 0 5 10 15 20 25Furnace Bed Diameter (mm)
0
5
10
15
20
25
30
35
40
45
50
55
60
Furn
ace
Hig
h (c
m)
Figure 1. Temperature contour profile in the spouted bed combustor.
Figure 2 and Table 1 show the proposed pathways and the key reactions about toluene and n-heptane combustion. Since the DRE
values were determined based on the residual model fuel in this study for comparison, the results only demonstrated the passive resistance of fuel decomposition during the effluent passing through the post combustion region.
(a) n-Heptane
(b) Toluene
Figure 2. Reaction pathways of toluene and n-heptane.
Table 1. Mechanism sensitivity analysis for toluene and n-heptane.
Chemical Reaction Mechanism Coefficient n-Heptane C7H16+O2=HO2+C3H6+C2H4+C2H5 -8.34E-02 C7H16+O2=HO2+1-C4H8+C2H4+CH3 -6.67E-02 C7H16+O2=HO2+1-C5H10+C2H5 -3.48E-02 C7H16+O2=HO2+1-C6H12+CH3 -1.41E-02 C7H16+OH=H2O+1-C4H8+C2H4+CH3 -1.83E-06 Toluene C6H5CH2+H = C6H5CH3 -1.19E-02 C6H5CH3+OH = C6H5CH2+H2O -3.75E-04 C6H5CH3+C6H5 = C6H6+C6H5CH2 -1.96E-05 C6H5CH3+H = C6H5CH2+H2 -2.63E-07
Prepr. Pap.-Am. Chem. Soc., Div. Fuel Chem. 2003, 48(2), 579
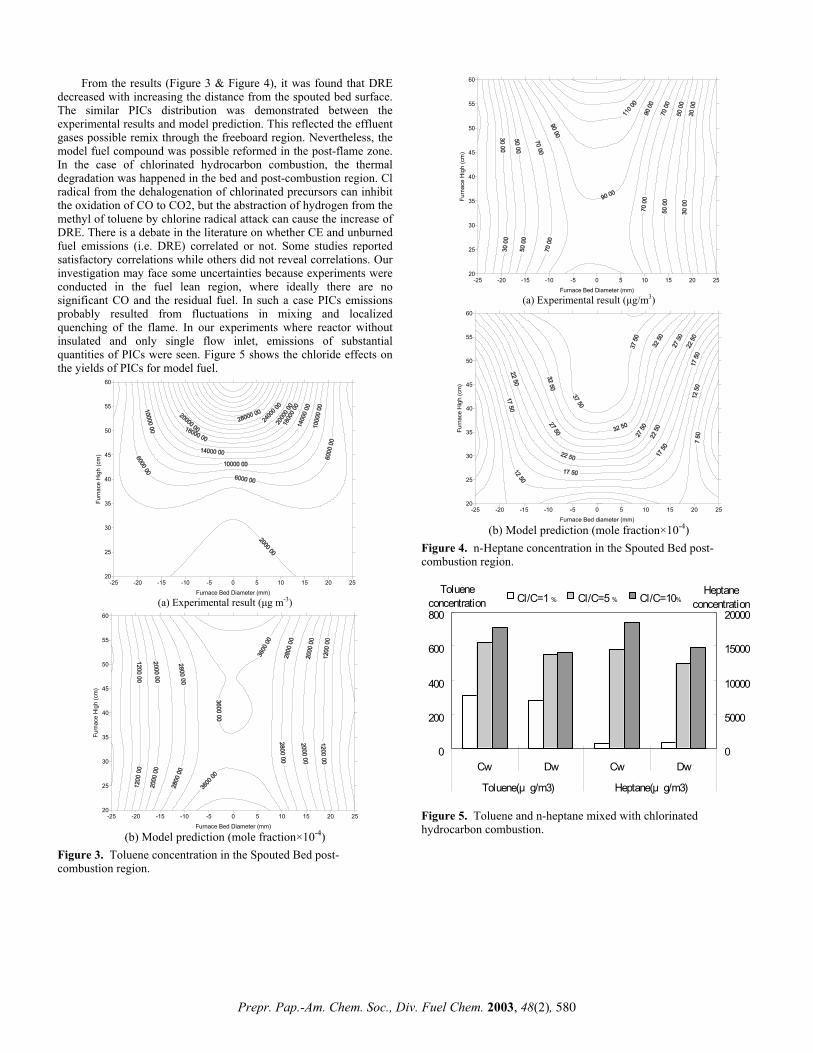
From the results (Figure 3 & Figure 4), it was found that DRE decreased with increasing the distance from the spouted bed surface. The similar PICs distribution was demonstrated between the experimental results and model prediction. This reflected the effluent gases possible remix through the freeboard region. Nevertheless, the model fuel compound was possible reformed in the post-flame zone. In the case of chlorinated hydrocarbon combustion, the thermal degradation was happened in the bed and post-combustion region. Cl radical from the dehalogenation of chlorinated precursors can inhibit the oxidation of CO to CO2, but the abstraction of hydrogen from the methyl of toluene by chlorine radical attack can cause the increase of DRE. There is a debate in the literature on whether CE and unburned fuel emissions (i.e. DRE) correlated or not. Some studies reported satisfactory correlations while others did not reveal correlations. Our investigation may face some uncertainties because experiments were conducted in the fuel lean region, where ideally there are no significant CO and the residual fuel. In such a case PICs emissions probably resulted from fluctuations in mixing and localized quenching of the flame. In our experiments where reactor without insulated and only single flow inlet, emissions of substantial quantities of PICs were seen. Figure 5 shows the chloride effects on the yields of PICs for model fuel.
-25 -20 -15 -10 -5 0 5 10 15 20Furnace Bed Diameter (mm)
2520
25
30
35
40
45
50
55
60
Furn
ace
Hig
h (c
m)
(a) Experimental result (µg/m3)
-25 -20 -15 -10 -5 0 5 10 15 20 25Furnace Bed diameter (mm)
20
25
30
35
40
45
50
55
60
Furn
ace
Hig
h (c
m)
-25 -20 -15 -10 -5 0 5 10 15 20Furnace Bed Diameter (mm)
2520
25
30
35
40
45
50
55
60
Furn
ace
Hig
h (c
m)
(b) Model prediction (mole fraction×10-4) Figure 4. n-Heptane concentration in the Spouted Bed post-combustion region.
Cl/C=1 ﹪ Cl/C=5 ﹪ Cl/C=10﹪
0
200
400
600
800
Cw Dw Cw Dw
Toluene(μ g/m3) Heptane(μ g/m3)
Tolueneconcentration
0
5000
10000
15000
20000
Heptaneconcentration
(a) Experimental result (µg m-3)
-25 -20 -15 -10 -5 0 5 10 15 20 25Furnace Bed Diameter (mm)
20
25
30
35
40
45
50
55
60
Furn
ace
Hig
h (c
m)
Figure 5. Toluene and n-heptane mixed with chlorinated hydrocarbon combustion. (b) Model prediction (mole fraction×10-4)
Figure 3. Toluene concentration in the Spouted Bed post-combustion region.
Prepr. Pap.-Am. Chem. Soc., Div. Fuel Chem. 2003, 48(2), 580

Acknowledgement. The authors would like to thank the National Science Council of Taiwan for their financial support in this project. References (1) Graham, J. L., Hall, D. L., & Dellinger, B., Environ. Sci.
Technol., 1986, Vol. 20, pp703-710. (2) Staley, L. J.; Richards, M. K.; & Huffman, G. L.; JAPCA, 1989,
Vol. 39, pp321-327. (3) Dellinger, B.; Taylor, P. H.; & Lee, C. C.; J. Air Waste Manage.
Assoc., 1993, Vol. 43, pp203-207. (4) Taylor, P. H.; Tirey, D. A.; Rubey, W. A.; & Dellinger, B.;
Combust. Sci. and Tech., 1994, Vol.101, pp75-102. (5) Senkan, S. M.; & Quam, D.; J. Phys. Chem., 1992, Vol. 96,
pp10837-10842. (6) Hung, J.; Onal, I.; & Senkan, S. M.; Environ. Sci. Technol.,
1997, Vol. 31, pp1372-1381. (7) Senkan S. M.; & Castldi, M.; Combustion and Flame, 1996,
Vol. 107, pp141-150. (8) Lemieux, P. M.; Ryan, J. V.; Bass, C.; & Barat, R.; J. Air &
Waste Manage. Assoc., 1996, Vol: 46, pp309-316. (9) Wheatley, L.; Levendls, Y. A.; & Vouros P.; Environ. Sci.
Technol., 1993, Vol.27, pp2885-2895. (10) Kanters, M. J.; Nispen, V.; Louw, R.; & Mulder, P.; Environ.
Sci. Technol., 1996, Vol. 30, pp2121-2126. (11) Vandell, R. D.; & Smith, J. D.; Combust. Sci. and Tech., 1994,
Vol. 100, pp225-243. (12) Tia, S.; Bhattacharya, S. C.; & Wibulswas P.; International
Journal of Energy Research, 1991, Vol. 15, pp185-201. (13) Tia, S.; Bhattacharya, S. C.; & Wibulswas P.; International
Journal of Energy Research, 1991, Vol. 15, pp203-221. (14) Bhattacharya, S. C.; & Wibulswas P.; International Journal of
Energy Research, 1994, Vol. 18, pp21-47.
Prepr. Pap.-Am. Chem. Soc., Div. Fuel Chem. 2003, 48(2), 581

THERMAL REACTION OF CATECHOL OVER NANO-PARTICLE IRON OXIDE AND QUARTZ
Eun-Jae Shin, Mohammad Hajaligol and Firooz Rasouli
Philip Morris USA, P.O.Box 26583, Richmond VA 23261-6583,
Tel: 804-274-6112, Fax: 803-274-1994 E-mail: [email protected]
Introduction
The phenolic compounds in the tars derived from coal liquid and/or coal and biomass pyrolysis and gasification have been recognized to cause operational and health related problems [1]. Substituted phenols have also been identified in cigarette smoke [2]. We selected catechol (C6H4(OH)2) as a phenolic model compound because it is a representative structure in coal as well as in lignin, a major biomass constituent, and also an abundant phenolic compound in cigarette smoke.
The cracking of catechol vapor over nano-particle iron oxide/quartz mixture and quartz under partially to fully oxidative conditions is presented in this work. Conversion of catechol and product distribution over the iron oxide and quartz were compared. Temperature dependence of the reaction was presented in terms of an activation energy. The effects of catechol concentration and oxygen were also considered. Experimental
The details of experimental set up and procedure are given elsewhere [3, 4]; only a brief description is given here. All reactions were carried out under atmospheric pressure and partially to fully oxidative conditions in a quartz tube reactor. The quartz reactor consists of inner and outer tubes, with reactions occurring in the inner tube, coupled to a Molecular Beam Mass Spectrometer (MBMS) for product detection. An electric furnace was set with two temperature zones.
The first zone was varied in the range from 180°C to 220°C for slow volatilization of the starting material so that steady state could be obtained. The vapor concentration of catechol was varied in the range of 6x10⁻³ to 18x10-3 mmol/min by varying the temperature in 10°C intervals. The second zone was varied in the range from 260°C to 480°C with 20°C intervals to study its effect on iron oxide versus quartz performance. The bed of the iron oxide (2.5mg)/quartz (1g) mixtures or quartz (1g) was preheated to a given reaction temperature before any reactant is passed through the bed. 10 ml/min of argon was used as an internal standard to get semi-quantitative data. 3% of oxygen was added in helium as a typical oxygen concentration and its effect on the reaction was evaluated by varying it in the range of 3-21% in He. A bed of nano-particle iron-oxide/quartz mixture, or of quartz was placed at the rear end of the inner tube between two pieces of clean quartz wool.
Catechol was purchased from Acros (>99% pure) and used as received. A sample of catechol was loaded in a quartz holder called “boat” which is inserted into the first heated zone with a preheated flowing helium carrier gas. The vapors formed in this zone pass through the bed of the iron oxide and the final products exiting the reactor (inner tube) are diluted with the neat carrier gas in the outer tube and, before condensing, sampled into the orifice of the MBMS. Finally, factor analysis was used to deconvolute the complex chemistry of the catechol conversion. Results and Discussion
The total conversion of catechol over the nano-particle iron oxide and quartz beds is shown in Fig. 1. In this work, the conversion
is defined as the difference between the total amount of catechol fed to the system (measured under the conditions with no significant conversion) and the amount that exited the system, divided by the total amount fed. The estimate of un-reacted catechol is done by monitoring a single ion (m/z 110) as a function of evolution time by MBMS. The monitoring is done in such a way that the integrated area of the steady-state evolution of the single ion resulting from various reaction conditions was subtracted from that resulting from controlled condition where no reaction was observed.
Fig. 1: Total conversion from catechol cracking over nano-particle iron oxide/quartz mixture (●) and quartz (■) as a function of temperature with 6x10⁻³ mmol catechol/min and 3% of oxygen.
Each data point in Fig. 1 represents the averaged result of more than two experiments under the same conditions and a fresh catalyst was used for each new experiment. The presence of nano-particle iron oxide lowered the temperature for a given conversion by about 180°C. About 50 % of catechol converted at a temperature as low as 260°C over iron oxide, whereas comparable conversion of catechol was observed at a temperature above 400°C over quartz. Comparison in product distribution over nano-particle iron oxide/quartz mixture and quartz was done with 3% of oxygen and a catechol concentration of 18x10-3 mmol/min at reaction temperatures that resulted in a comparable conversion of catechol for both cases. Fig. 2 shows the average spectra of the products obtained from two cases for about 50% catechol conversion.
Fig. 2: Average spectra of products (with background correction) detected by MBMS resulting from catechol cracking over (a) iron oxide/quartz mixture at 260°C and (b) quartz at 450°C with 3% oxygen. For the cracking reaction over the iron oxide as shown in Fig. 2 (a), the peak at m/z 110 and its fragment ions at m/z 54, 64, 82, and 92, that are too small to be seen, belong to catechol. The major products from catalytic cracking of catechol were found at m/z 52 (C4H4, i.e., vinyl acetylene), m/z 80 (C5H4O, i.e., cyclopentadienone) and m/z 108 (C7H8O, i.e., cresols or C6H4O2, i.e., o-benzoquinone). The cracking of catechol over nano-particle iron oxide is a complete cracking at temperatures above 380°C. At 430°C temperature,
Prepr. Pap.-Am. Chem. Soc., Div. Fuel Chem. 2003, 48(2), 616
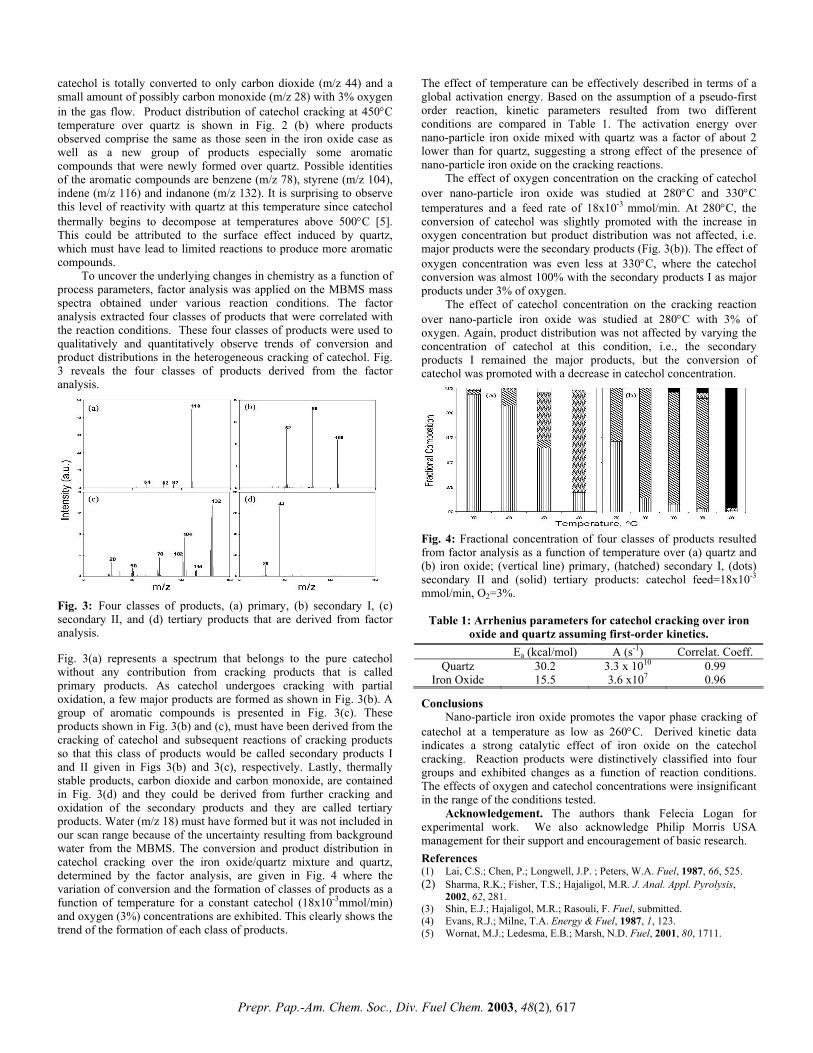
The effect of temperature can be effectively described in terms of a global activation energy. Based on the assumption of a pseudo-first order reaction, kinetic parameters resulted from two different conditions are compared in Table 1. The activation energy over nano-particle iron oxide mixed with quartz was a factor of about 2 lower than for quartz, suggesting a strong effect of the presence of nano-particle iron oxide on the cracking reactions.
catechol is totally converted to only carbon dioxide (m/z 44) and a small amount of possibly carbon monoxide (m/z 28) with 3% oxygen in the gas flow. Product distribution of catechol cracking at 450°C temperature over quartz is shown in Fig. 2 (b) where products observed comprise the same as those seen in the iron oxide case as well as a new group of products especially some aromatic compounds that were newly formed over quartz. Possible identities of the aromatic compounds are benzene (m/z 78), styrene (m/z 104), indene (m/z 116) and indanone (m/z 132). It is surprising to observe this level of reactivity with quartz at this temperature since catechol thermally begins to decompose at temperatures above 500°C [5]. This could be attributed to the surface effect induced by quartz, which must have lead to limited reactions to produce more aromatic compounds.
The effect of oxygen concentration on the cracking of catechol over nano-particle iron oxide was studied at 280°C and 330°C temperatures and a feed rate of 18x10-3 mmol/min. At 280°C, the conversion of catechol was slightly promoted with the increase in oxygen concentration but product distribution was not affected, i.e. major products were the secondary products (Fig. 3(b)). The effect of oxygen concentration was even less at 330°C, where the catechol conversion was almost 100% with the secondary products I as major products under 3% of oxygen.
To uncover the underlying changes in chemistry as a function of process parameters, factor analysis was applied on the MBMS mass spectra obtained under various reaction conditions. The factor analysis extracted four classes of products that were correlated with the reaction conditions. These four classes of products were used to qualitatively and quantitatively observe trends of conversion and product distributions in the heterogeneous cracking of catechol. Fig. 3 reveals the four classes of products derived from the factor analysis.
The effect of catechol concentration on the cracking reaction over nano-particle iron oxide was studied at 280°C with 3% of oxygen. Again, product distribution was not affected by varying the concentration of catechol at this condition, i.e., the secondary products I remained the major products, but the conversion of catechol was promoted with a decrease in catechol concentration.
Fig. 4: Fractional concentration of four classes of products resulted from factor analysis as a function of temperature over (a) quartz and (b) iron oxide; (vertical line) primary, (hatched) secondary I, (dots) secondary II and (solid) tertiary products: catechol feed=18x10-3
mmol/min, O2=3%. Fig. 3: Four classes of products, (a) primary, (b) secondary I, (c) secondary II, and (d) tertiary products that are derived from factor analysis.
Table 1: Arrhenius parameters for catechol cracking over iron
oxide and quartz assuming first-order kinetics. Ea (kcal/mol) A (s-1) Correlat. Coeff.
Quartz 30.2 3.3 x 10¹⁰ 0.99 Iron Oxide 15.5 3.6 x10⁷ 0.96
Fig. 3(a) represents a spectrum that belongs to the pure catechol without any contribution from cracking products that is called primary products. As catechol undergoes cracking with partial oxidation, a few major products are formed as shown in Fig. 3(b). A group of aromatic compounds is presented in Fig. 3(c). These products shown in Fig. 3(b) and (c), must have been derived from the cracking of catechol and subsequent reactions of cracking products so that this class of products would be called secondary products I and II given in Figs 3(b) and 3(c), respectively. Lastly, thermally stable products, carbon dioxide and carbon monoxide, are contained in Fig. 3(d) and they could be derived from further cracking and oxidation of the secondary products and they are called tertiary products. Water (m/z 18) must have formed but it was not included in our scan range because of the uncertainty resulting from background water from the MBMS. The conversion and product distribution in catechol cracking over the iron oxide/quartz mixture and quartz, determined by the factor analysis, are given in Fig. 4 where the variation of conversion and the formation of classes of products as a function of temperature for a constant catechol (18x10-3mmol/min) and oxygen (3%) concentrations are exhibited. This clearly shows the trend of the formation of each class of products.
Conclusions Nano-particle iron oxide promotes the vapor phase cracking of
catechol at a temperature as low as 260°C. Derived kinetic data indicates a strong catalytic effect of iron oxide on the catechol cracking. Reaction products were distinctively classified into four groups and exhibited changes as a function of reaction conditions. The effects of oxygen and catechol concentrations were insignificant in the range of the conditions tested.
Acknowledgement. The authors thank Felecia Logan for experimental work. We also acknowledge Philip Morris USA management for their support and encouragement of basic research. References (1) Lai, C.S.; Chen, P.; Longwell, J.P. ; Peters, W.A. Fuel, 1987, 66, 525. (2) Sharma, R.K.; Fisher, T.S.; Hajaligol, M.R. J. Anal. Appl. Pyrolysis,
2002, 62, 281. (3) Shin, E.J.; Hajaligol, M.R.; Rasouli, F. Fuel, submitted. (4) Evans, R.J.; Milne, T.A. Energy & Fuel, 1987, 1, 123. (5) Wornat, M.J.; Ledesma, E.B.; Marsh, N.D. Fuel, 2001, 80, 1711.
Prepr. Pap.-Am. Chem. Soc., Div. Fuel Chem. 2003, 48(2), 617
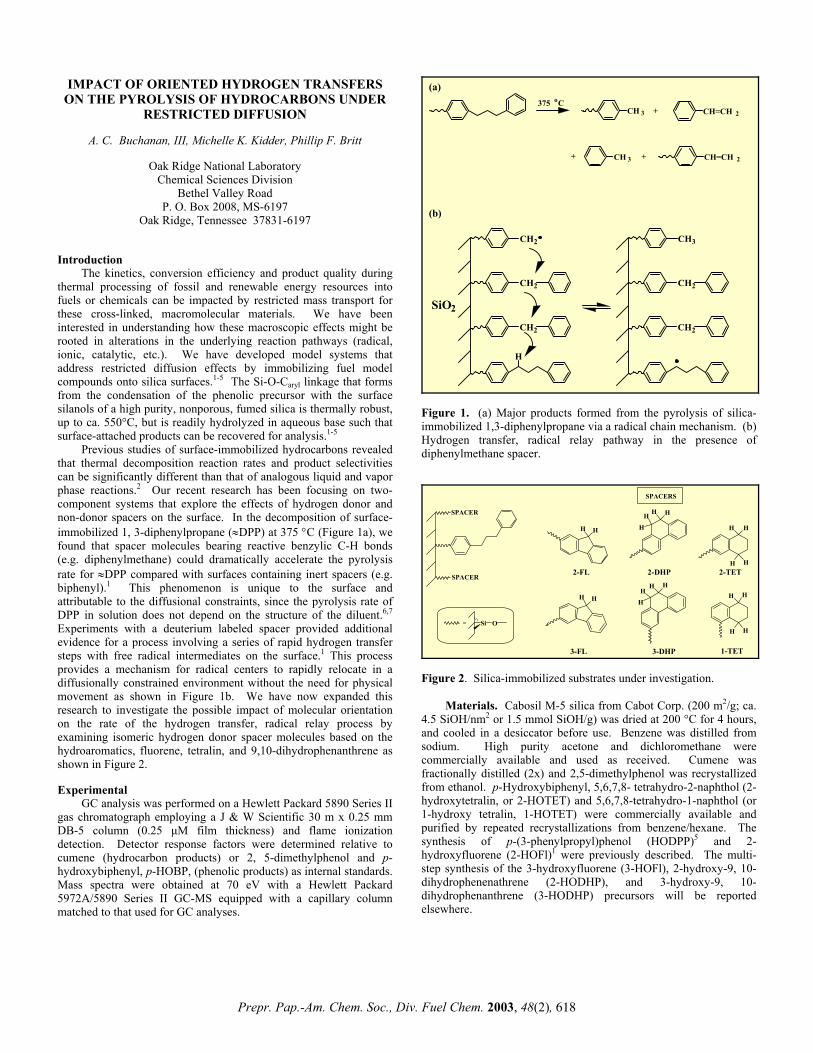
IMPACT OF ORIENTED HYDROGEN TRANSFERS ON THE PYROLYSIS OF HYDROCARBONS UNDER
RESTRICTED DIFFUSION
CH3
CH2
CH2
SiO2
H
CH2
CH2
CH2
375 oCCH 3 + CH=CH 2
+ CH 3 CH=CH 2+
(a)
(b)
A. C. Buchanan, III, Michelle K. Kidder, Phillip F. Britt
Oak Ridge National Laboratory
Chemical Sciences Division Bethel Valley Road
P. O. Box 2008, MS-6197 Oak Ridge, Tennessee 37831-6197
Introduction
The kinetics, conversion efficiency and product quality during thermal processing of fossil and renewable energy resources into fuels or chemicals can be impacted by restricted mass transport for these cross-linked, macromolecular materials. We have been interested in understanding how these macroscopic effects might be rooted in alterations in the underlying reaction pathways (radical, ionic, catalytic, etc.). We have developed model systems that address restricted diffusion effects by immobilizing fuel model compounds onto silica surfaces.1-5 The Si-O-Caryl linkage that forms from the condensation of the phenolic precursor with the surface silanols of a high purity, nonporous, fumed silica is thermally robust, up to ca. 550°C, but is readily hydrolyzed in aqueous base such that surface-attached products can be recovered for analysis.1-5
Figure 1. (a) Major products formed from the pyrolysis of silica-immobilized 1,3-diphenylpropane via a radical chain mechanism. (b) Hydrogen transfer, radical relay pathway in the presence of diphenylmethane spacer. Previous studies of surface-immobilized hydrocarbons revealed
that thermal decomposition reaction rates and product selectivities can be significantly different than that of analogous liquid and vapor phase reactions.2 Our recent research has been focusing on two-component systems that explore the effects of hydrogen donor and non-donor spacers on the surface. In the decomposition of surface-immobilized 1, 3-diphenylpropane (≈DPP) at 375 °C (Figure 1a), we found that spacer molecules bearing reactive benzylic C-H bonds (e.g. diphenylmethane) could dramatically accelerate the pyrolysis rate for ≈DPP compared with surfaces containing inert spacers (e.g. biphenyl).1 This phenomenon is unique to the surface and attributable to the diffusional constraints, since the pyrolysis rate of DPP in solution does not depend on the structure of the diluent.6,7 Experiments with a deuterium labeled spacer provided additional evidence for a process involving a series of rapid hydrogen transfer steps with free radical intermediates on the surface.1 This process provides a mechanism for radical centers to rapidly relocate in a diffusionally constrained environment without the need for physical movement as shown in Figure 1b. We have now expanded this research to investigate the possible impact of molecular orientation on the rate of the hydrogen transfer, radical relay process by examining isomeric hydrogen donor spacer molecules based on the hydroaromatics, fluorene, tetralin, and 9,10-dihydrophenanthrene as shown in Figure 2.
SPACER
SPACER
SPACERS
HH
HH
H
H
HH
HH
H H
H
HH
H
H
HH
H
Si=
2-FL 2-DHP 2-TET
3-FL 3-DHP 1-TET
O
Figure 2. Silica-immobilized substrates under investigation.
Materials. Cabosil M-5 silica from Cabot Corp. (200 m2/g; ca. 4.5 SiOH/nm2 or 1.5 mmol SiOH/g) was dried at 200 °C for 4 hours, and cooled in a desiccator before use. Benzene was distilled from sodium. High purity acetone and dichloromethane were commercially available and used as received. Cumene was fractionally distilled (2x) and 2,5-dimethylphenol was recrystallized from ethanol. p-Hydroxybiphenyl, 5,6,7,8- tetrahydro-2-naphthol (2-hydroxytetralin, or 2-HOTET) and 5,6,7,8-tetrahydro-1-naphthol (or 1-hydroxy tetralin, 1-HOTET) were commercially available and purified by repeated recrystallizations from benzene/hexane. The synthesis of p-(3-phenylpropyl)phenol (HODPP)5 and 2-hydroxyfluorene (2-HOFl)1 were previously described. The multi-step synthesis of the 3-hydroxyfluorene (3-HOFl), 2-hydroxy-9, 10-dihydrophenenathrene (2-HODHP), and 3-hydroxy-9, 10-dihydrophenanthrene (3-HODHP) precursors will be reported elsewhere.
Experimental
GC analysis was performed on a Hewlett Packard 5890 Series II gas chromatograph employing a J & W Scientific 30 m x 0.25 mm DB-5 column (0.25 µM film thickness) and flame ionization detection. Detector response factors were determined relative to cumene (hydrocarbon products) or 2, 5-dimethylphenol and p-hydroxybiphenyl, p-HOBP, (phenolic products) as internal standards. Mass spectra were obtained at 70 eV with a Hewlett Packard 5972A/5890 Series II GC-MS equipped with a capillary column matched to that used for GC analyses.
Prepr. Pap.-Am. Chem. Soc., Div. Fuel Chem. 2003, 48(2), 618
Preparation of Surface-Attached Materials. Procedures for the preparation of the two component surfaces have been described previously.1 In general, HODPP and the desired spacer phenol were dissolved in benzene in the appropriate mol ratios, and then were added to a benzene slurry containing Cabosil. The benzene was evaporated and the phenolic material was attached to the surface through heating at 225 °C for 1 h in an evacuated (2 x 10⁻⁶ torr) sealed Pyrex tube. Unattached phenols where removed via sublimation at 225-275 °C for 1 h under dynamic vacuum (5 x 10⁻³ torr). Surface coverage analysis was performed as described previously1 using p-HOBP as the internal standard.
Pyrolysis Procedure. The pyrolysis apparatus and procedure have been described.1-5 In brief, a weighed amount of sample was placed in a T-shaped Pyrex tube, evacuated and sealed at ca. 2 x 10⁻⁶ torr. The sample was pyrolyzed in a pre-heated calibrated Carbolite three-zone tube furnace, and the gas phase products were trapped in the tube arm placed in a liquid nitrogen bath. The volatile products collected in the trap were dissolved in acetone (50-150 µL) containing the internal standards, and the solution was analyzed via GC and GC-MS. Surface-attached pyrolysis products were hydrolyzed from the silica with 1N NaOH. The internal standards, 2, 5-dimethylphenol and p-HOBP were prepared in NaOH and added to the solution. The solution was acidified and extracted with CH2Cl2, evaporated, then silylated with a mixture of N, O-bis(trimethylsilyl)-trifluoroacetamide (BSTFA)/pyridine 1:2 (ca. 300 µL) and analyzed via GC and GC-MS. Results and Discussion
The two-component surfaces under investigation are shown in Figure 2. Two-component surfaces involving the fluorene (FL) and tetralin (TET) spacers have been prepared to date by the co-condensation of the phenolic spacer with HODPP in a single step as described above. The initial stoichiometries were adjusted to prepare surfaces at saturation coverage with similar spacer:DPP mol ratios (approximately 3:1).
Thermolyses were conducted at 375 °C in vacuum sealed Pyrex tubes. The major products (ca. 98 % at low ≈DPP conversions) formed from the free-radical induced chain decomposition are gas-phase and surface-attached toluene and styrene as shown above in Figure 1a. These products are formed in similar amounts at low conversions indicating that there is little regioselectivity in the pyrolysis reaction as found previously for ≈DPP in other two-component surfaces.1 Small amounts of surface-attached PhCH2CH3 (0.1-3.0 mol %) are also observed, as well as trace amounts of gas-phase PhCH2CH3 (0.05-0.1 mol %). In the case of the fluorene spacers, addition of surface-attached fluorenyl radical to the surface-attached styrene is also detected and can account for several mol % of the products. Mass balances are typically 99.6 ± 2.5 % indicating that all significant products are accounted for.
The free radical chain mechanism for the decomposition of DPP on the surface or in fluid phases has been discussed in detail elsewhere.1, 5-9 For surface-attached DPP, initiation by a small amount of C-C homolysis (74 kcal/mol) forms chain carrying gas-phase and surface-attached benzyl radicals. The reaction is then propagated through hydrogen abstraction at the two regiochemically distinct benzylic carbons of ≈DPP to form the gas-phase and surface-attached toluene products, as well as benzylic radicals that undergo β-scission to produce the surface-attached and gas-phase styrene products. Termination occurs through coupling of the benzyl radical. The overall rate of decomposition of ≈DPP is governed by the rates of hydrogen transfer steps, which are particularly sensitive to the surface coverage and the structure of intervening spacer molecules. As noted above, in the presence of spacer molecules possessing
benzylic C-H bonds, a hydrogen transfer, radical relay process provides an effective means for overcoming the impact of the restricted translational diffusion on the surface (Figure 1).
The initial reaction rates for ≈DPP at 375 °C in the presence of the hydroaromatic spacer molecules were obtained from the slopes of linear regressions of ≈DPP conversion versus reaction times as shown in Figure 3 for the two isomeric fluorene spacers. The measured ≈DPP pyrolysis rates are presented in Table 1. As expected, the ≈DPP decomposition rates increased dramatically in
Figure 3. Comparison of rate of ≈DPP conversion at 375°C in the presence of the 2-fluorene and 3-fluorene spacers. the presence of the hydrogen donor spacers relative to surfaces of -≈DPP at similar surface coverages without hydrogen donating spacers (ca. 0.4 %/h). However, it is clear that the rates are sensitive to the orientation of the spacer molecule on the surface. For example, the rate of ≈DPP pyrolysis with the 2-FL spacer is 2.4-times faster than that with the 3-FL. Furthermore, the ≈DPP conversion rate for the 2-TET spacer is 3-times faster than for 1-TET (Table 1). Table 1. Impact of Hydroaromatic Spacer Orientation on ≈DPP
Pyrolysis Rate at 375 °C. Surface Coverage
(mmol/g) Rate (%/h)
≈DPP/≈2-FL 0.16 / 0.43 72.2 ≈DPP/≈3-FL 0.12 / 0.33 29.6 ≈DPP/≈2-TET 0.11 / 0.45 15.1 ≈DPP/≈1-TET 0.085 / 0.28 5.0
The results suggest that a meta-orientation for the surface linkage, with respect to the reactive benzylic hydrogens, is the most efficient geometry for promoting the hydrogen transfer, radical relay process on the surface. This will be tested further with the two dihydrophenanthrene spacer molecules shown in Figure 2. Based on the results presented above, the prediction would be that the 2-DHP spacer will produce a faster ≈DPP pyrolysis rate than the 3-DHP isomer. Additional studies will probe the generality of this orientation effect at higher ≈DPP surface dilution (ca. 7:1 mol ratio
Prepr. Pap.-Am. Chem. Soc., Div. Fuel Chem. 2003, 48(2), 619
of spacer: ≈DPP). Molecular modeling studies will also be employed to understand the origin of these orientation effects. Conclusions
These pyrolysis studies clearly show that geometric constraints can play a large role in the rates of hydrogen transfer steps for high temperature, free-radical reactions under restricted diffusion. These new insights suggest that the local structure of hydrocarbon resources may play a role in the efficient utilization of native hydrogen during thermochemical processing.
Acknowledgment. This research was sponsored by the Division of Chemical Sciences, Geosciences, and Biosciences, Office of Basic Energy Sciences, U.S. Department of Energy under contract DE-AC05-00OR22725 with Oak Ridge National Laboratory, managed and operated by UT-Battelle, LLC.
References (1) Buchanan, A. C., III; Britt, P. F.; Thomas, K. B.; Biggs, C. A.
J. Am. Chem. Soc. 1996, 118, 2182. (2) Buchanan, A. C., III; Britt, P. F. J. Anal. Appl. Pyrolysis 2000,
54, 127. (3) Britt, P. F.; Buchanan, A. C., III; Malcolm, E. A. Energy Fuels
2000, 14, 1314. (4) Buchanan, A. C., III; Britt, P.F.; Skeen, J. T.; Struss, J. A.;
Elam, C. L. J. Org. Chem. 1998, 63, 9895. (5) Buchanan, A. C., III; Biggs, C. A. J. Org. Chem. 1989, 54, 517. (6) Poutsma, M. L.; Dyer, C. W. J. Org. Chem. 1982, 47, 4903. (7) Gilbert, K. E. ;Gajewski, J. J. J. Org. Chem. 1982, 47, 4899. (8) Sweeting, J. W.; Wilshire, J. F. Aust. J. Chem. 1962, 15, 9. (9) King, H.-H.; Stock, L. M. Fuel 1982, 61, 1172.
Prepr. Pap.-Am. Chem. Soc., Div. Fuel Chem. 2003, 48(2), 620

A DENSITY FUNCTIONAL THEORETICAL STUDY OF S-H BOND STRENGTHS IN ORGANIC THIOLS
AND A MODEL MoS CLUSTER
Results and Discussion
Direct calculations of bond dissociation enthalpies (eq 2) typically underestimate bond strengths, at modest levels of theory, with improvement with basis set. This trend is shown for thiols examined here, for which the calculate BDEs have increased to within 0.5 kcal/mol of experiment with the use of the extended basis set on C, H, and S atoms. Under favorable circumstances, isodesmic calculations (eq. 3) converge to experimental values at more modest levels of theory than required for eq. 2. In cases examined here, use of increasingly larger basis sets leads to convergence from values of BDE higher in all cases than experiment to within 0.5 kcal/mol of experiment for CH3SH, PhSH, and Nap-2-SH. Taking the values of eq. 3 (isodesmic) values, bond strengths for CH3SH, PhSH, and Nap-2-SH are predicted to be 87.7, 79.3, and 78.1 kcal/mol, compared to experiment, 87.3, 78.9, and 77.9 kcal/mol, respectively. The calculations predict (by eq. 3) an S-H bond strength of 73.2 kcal/mol for the MoS model cluster, 1(eq 4).
James A. Franz, Michel Dupuis, and Donald M. Camaioni and
Jerome Birnbaum Pacific Northwest National Laboratory, 902 Battelle Boulevard, MS
K2-57, Richland, WA 99352 Introduction
Hydrosulfurization (HDS) is carried out by exposure of a substrate fuel source to a regime of hydrogen pressure and high temperatures in the presence of Co/MoS or Ni/MoS catalysts on γ-Al2O3 supports [Topsoe et al., 1996]. At temperatures of HDS, and in the presence of organosulfur structures, thermal free radical chemistry will accompany or even dominate many pathways of organic structure transformation. Hydrogenation and dehydrogenation of organic structure will be particularly sensitive to the nature of organosulfur intermediates. A major pathway of hydrogenolysis and hydrogenation is initiated by the transfer of hydrogen atom from a closed shell molecule to an acceptor [Rüchardt et al. 1997]. This reaction is the starting point for hydrogenation of unsaturated organic structure. The reaction is the reverse of the disproportionation reaction of two free radicals, and depends on the enthalpy change of the forward reaction. To predict the rate of reaction in eq 1, key information required is the bond strength of
CpMoS
MoCpSS
S
H
H
CpMoS
MoCpSS
S
H
+ H73 kcal/mole
1
(4)
Thus, the µ2-SH bond, a functional group suggested to be present in heterogeneous MoS catalysts, is much more reactive than conventional thiols in radical-forming reactions. Thus, for example the key radical initiating step leading to hydrogenation/ dehydrogenation of olefinic structure, hydrogen transfer to an olefin, which is controlled by the S-H bond strength, will occur several orders of magnitude faster than with simple organic thiols (eqs 5,6):
RH + RHC=CH2 R + RCH-CH3
∆Ho ~ ∆H(1)
the participating organic or catalyst function (R-H, eq 1). In this paper, we present results of a density functional theory investigation of bond strengths of a series of thiols, and of the HDS prototype model, CpMo[(µ-S)2(µ-SH)2]MoCp, 1, Cp = η5-C5H5 [Rakowski DuBois, 1998]. This system is representative of a class of MoS cluster systems that are models of exfoliated MoS2 catalysts [Curtiss, et al. 1996]. The level of theory for prediction of accurate (ca. 1-2 kcal/mol error) S-H bonds is explored. The reactivity of the prototype MoSH functionality in initiating homolytic hydrogenation steps is provided by the computational predictions.
Mo2SH + CH2=CH2 Mo2S• + CH3-CH2• (5) CH3-CH2• + Mo2SH CH3CH3 (6)
Conclusions Density functional theory calculations suggest that the SH
functional group in MoS clusters should exhibit substantially enhanced homolytic reactivity compared to conventional thiols, leading to enhanced rates of hydrogenation and other radical pathways. The accuracy of the prediction of the S-H bond strength of 1 awaits experimental determination of the S-H bond strength.
Electronic Structure Calculations
Acknowledgement. This work was supported by the Office of Science, Office of Basic Energy Sciences, U.S. Department of Energy under contract DE-ACO6-76RLO 1830.
Electronic structure calculations were carried out using the Gaussian 98 [Frisch, M.J., et al.] set of programs. Geometries were optimized using the LANL2DZ basis set {Hay et al. 1985] and effective core potentials within the B3LYP hybrid DFT formalism [Lee et al, 1998, Becke, et al 1993]. Vibrational calculations were carried out to verify ground states and to identify low frequency internal torsional modes for correction of electronic energies to enthalpies at 298 K. Vibrational frequencies were scaled by 0.9806 for zero point energy corrections and by 0.9989 for internal energy corrections. [see DiLabio et al. 1999] The electronic energy of H atom was set to -0.5 hartree. Bond strengths were calculated by two methods, direct dissociation (eq 2), and using isodesmic calculations (eq 3), with the bond strength of H2S, 91.2 kcal/mol, as a reference. The substrates examined were H2S,PhSH,
References (1) Topsoe, H.; Clausen, B.S.;Massoth, F.E. Hydrotreating Catalysis.
Science and Technology. Springer-Verlag, Berlin, 1996, 310pp. (2) Rüchardt, C.; Gerst, M.; Ebenhoch, J. Angew. Chem. Intl. Ed. Engl.
1997, 36, 1406. (3) Rakowski DuBois, M. Catalysis by Sulfido Bridged Dimolybdenum
Complexes, in Catalysis by Di-and Polynuclear Metal Cluster Complexes, Richard D. Adams and F. Albert Cotton Eds., Wiley-VCH Inc., New York, 1998, p. 127-143, and references therein.
(4) Curtis, M. D. Hydrodesulfurization Catalysis and Catalyst Models Based on Mo-Co-S Clusters and Exfoliated MoS2, in Transition Metal-Sulfur Chemistry ACS Symposium Series 653, Stiefel, E. I.; Matsumoto, K. Eds. 1996, p. 154-175, and references therein. RS-H RS• + H• (2)
RS-H + HS• RS• + H2S (3) (5) Frisch, M.J. et al. Gaussian 98, Gaussian, Inc., Pittsburgh PA, 2001 2-mercaptonaphthalene (Nap-2-SH), and methyl mercaptan. Using B3LYP/LANL2DZ geometries, three basis sets were examined for single point energy calculations, LANL2DZ, LANL2DZdp, and a basis set using the LANL2DZ basis set for Mo and the 6-311++G(2d,2p) basis set for C, S, and H, denoted LANLMo63.
(6) Hay, P.J. and Wadt, W.R. J. Chem. Phys. 1985, 82, 270,284, 299. (7) (a) Lee, C.; Yang, W.; Parr, R.G. Phys. Rev. B 1988, 37, 785. (b) Becke,
A.D. J. Chem. Phys. 1993, 98, 5648. (8) DiLabio, G.A.; Pratt, D.A.; LoFaro, A.D.; and Wright, J.S. J. Phys.
Chem A 1999, 103, 1653-1661.
Prepr. Pap.-Am. Chem. Soc., Div. Fuel Chem. 2003, 48(2), 621

Table 1. S-H Bond Dissociation Enthalpies (kcal/mol, 298K) for CpMo[(µ-S)2(µSH)2]MoCp (1), H2S, CH3SH, PhSH, and
Naphthalene-2-thiol
Level of Theory H S (expt 91.2) 2 1 PhSH (expt 79.1) Nap-2-SH (expt 77.9) CH SH (expt 87.3)
3
Eq 2 Eq 2 Eq. 3 Eq2 Eq 3 Eq 2 Eq 3 Eq 2 eq 3 LANL2DZ 78.7 63.3 76.6 67.8 81.1 66.9 80.3 75.3 88.7 LANL2DZdp 88.0 70.6 74.7 76.6 80.6 75.5 79.6 84.3 88.4 LANLMo63 90.4 72.5 73.2 78.5 79.3 77.4 78.1 86.9 87.7
Prepr. Pap.-Am. Chem. Soc., Div. Fuel Chem. 2003, 48(2), 622
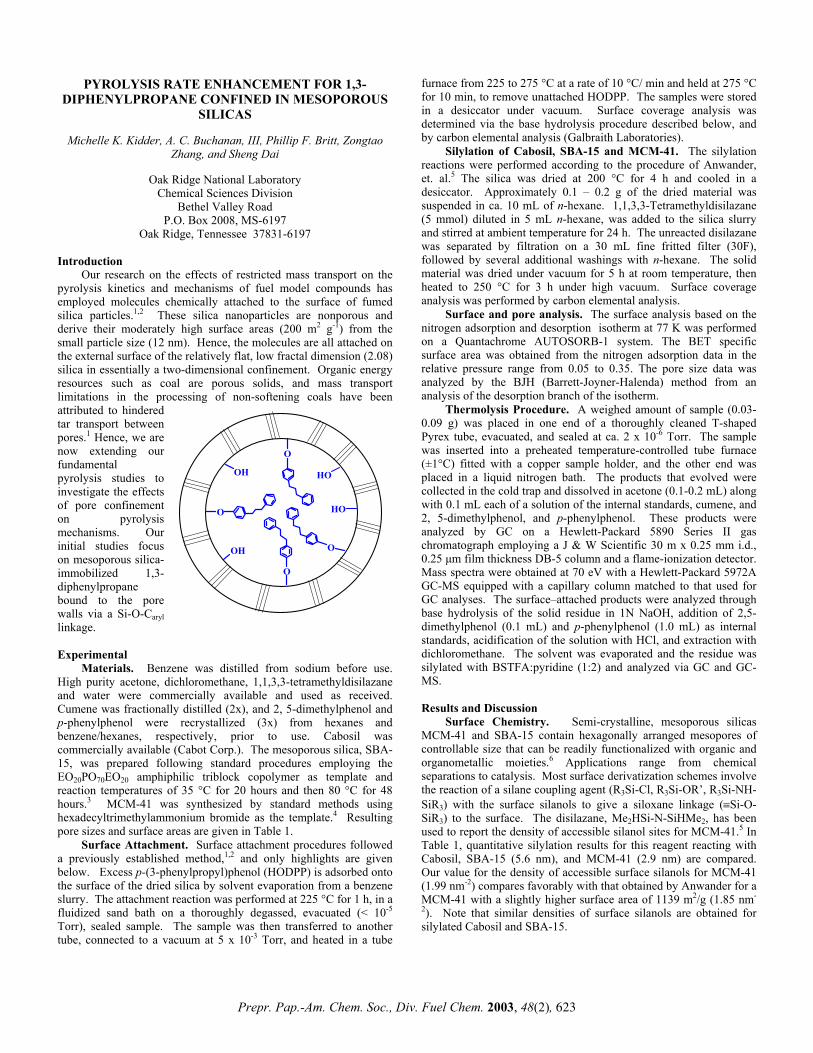
PYROLYSIS RATE ENHANCEMENT FOR 1,3-DIPHENYLPROPANE CONFINED IN MESOPOROUS
SILICAS
Michelle K. Kidder, A. C. Buchanan, III, Phillip F. Britt, Zongtao Zhang, and Sheng Dai
Oak Ridge National Laboratory
Chemical Sciences Division Bethel Valley Road
P.O. Box 2008, MS-6197 Oak Ridge, Tennessee 37831-6197
Introduction Our research on the effects of restricted mass transport on the pyrolysis kinetics and mechanisms of fuel model compounds has employed molecules chemically attached to the surface of fumed silica particles.1,2 These silica nanoparticles are nonporous and derive their moderately high surface areas (200 m2 g-1) from the small particle size (12 nm). Hence, the molecules are all attached on the external surface of the relatively flat, low fractal dimension (2.08) silica in essentially a two-dimensional confinement. Organic energy resources such as coal are porous solids, and mass transport limitations in the processing of non-softening coals have been attributed to hindered tar transport between pores.1 Hence, we are now extending our fundamental pyrolysis studies to investigate the effects of pore confinement on pyrolysis mechanisms. Our initial studies focus on mesoporous silica-immobilized 1,3-diphenylpropane bound to the pore walls via a Si-O-Caryl linkage. Experimental Materials. Benzene was distilled from sodium before use. High purity acetone, dichloromethane, 1,1,3,3-tetramethyldisilazane and water were commercially available and used as received. Cumene was fractionally distilled (2x), and 2, 5-dimethylphenol and p-phenylphenol were recrystallized (3x) from hexanes and benzene/hexanes, respectively, prior to use. Cabosil was commercially available (Cabot Corp.). The mesoporous silica, SBA-15, was prepared following standard procedures employing the EO20PO70EO20 amphiphilic triblock copolymer as template and reaction temperatures of 35 °C for 20 hours and then 80 °C for 48 hours.3 MCM-41 was synthesized by standard methods using hexadecyltrimethylammonium bromide as the template.4 Resulting pore sizes and surface areas are given in Table 1. Surface Attachment. Surface attachment procedures followed a previously established method,1,2 and only highlights are given below. Excess p-(3-phenylpropyl)phenol (HODPP) is adsorbed onto the surface of the dried silica by solvent evaporation from a benzene slurry. The attachment reaction was performed at 225 °C for 1 h, in a fluidized sand bath on a thoroughly degassed, evacuated (< 10-5 Torr), sealed sample. The sample was then transferred to another tube, connected to a vacuum at 5 x 10⁻³ Torr, and heated in a tube
furnace from 225 to 275 °C at a rate of 10 °C/ min and held at 275 °C for 10 min, to remove unattached HODPP. The samples were stored in a desiccator under vacuum. Surface coverage analysis was determined via the base hydrolysis procedure described below, and by carbon elemental analysis (Galbraith Laboratories). Silylation of Cabosil, SBA-15 and MCM-41. The silylation reactions were performed according to the procedure of Anwander, et. al.5 The silica was dried at 200 °C for 4 h and cooled in a desiccator. Approximately 0.1 – 0.2 g of the dried material was suspended in ca. 10 mL of n-hexane. 1,1,3,3-Tetramethyldisilazane (5 mmol) diluted in 5 mL n-hexane, was added to the silica slurry and stirred at ambient temperature for 24 h. The unreacted disilazane was separated by filtration on a 30 mL fine fritted filter (30F), followed by several additional washings with n-hexane. The solid material was dried under vacuum for 5 h at room temperature, then heated to 250 °C for 3 h under high vacuum. Surface coverage analysis was performed by carbon elemental analysis. Surface and pore analysis. The surface analysis based on the nitrogen adsorption and desorption isotherm at 77 K was performed on a Quantachrome AUTOSORB-1 system. The BET specific surface area was obtained from the nitrogen adsorption data in the relative pressure range from 0.05 to 0.35. The pore size data was analyzed by the BJH (Barrett-Joyner-Halenda) method from an analysis of the desorption branch of the isotherm. Thermolysis Procedure. A weighed amount of sample (0.03-0.09 g) was placed in one end of a thoroughly cleaned T-shaped Pyrex tube, evacuated, and sealed at ca. 2 x 10⁻⁶ Torr. The sample was inserted into a preheated temperature-controlled tube furnace (±1°C) fitted with a copper sample holder, and the other end was placed in a liquid nitrogen bath. The products that evolved were collected in the cold trap and dissolved in acetone (0.1-0.2 mL) along with 0.1 mL each of a solution of the internal standards, cumene, and 2, 5-dimethylphenol, and p-phenylphenol. These products were analyzed by GC on a Hewlett-Packard 5890 Series II gas chromatograph employing a J & W Scientific 30 m x 0.25 mm i.d., 0.25 µm film thickness DB-5 column and a flame-ionization detector. Mass spectra were obtained at 70 eV with a Hewlett-Packard 5972A GC-MS equipped with a capillary column matched to that used for GC analyses. The surface–attached products were analyzed through base hydrolysis of the solid residue in 1N NaOH, addition of 2,5-dimethylphenol (0.1 mL) and p-phenylphenol (1.0 mL) as internal standards, acidification of the solution with HCl, and extraction with dichloromethane. The solvent was evaporated and the residue was silylated with BSTFA:pyridine (1:2) and analyzed via GC and GC-MS.
O
O
HO
O
OH HO
OH O
Results and Discussion Surface Chemistry. Semi-crystalline, mesoporous silicas MCM-41 and SBA-15 contain hexagonally arranged mesopores of controllable size that can be readily functionalized with organic and organometallic moieties.6 Applications range from chemical separations to catalysis. Most surface derivatization schemes involve the reaction of a silane coupling agent (R3Si-Cl, R3Si-OR’, R3Si-NH-SiR3) with the surface silanols to give a siloxane linkage (≡Si-O-SiR3) to the surface. The disilazane, Me2HSi-N-SiHMe2, has been used to report the density of accessible silanol sites for MCM-41.5 In Table 1, quantitative silylation results for this reagent reacting with Cabosil, SBA-15 (5.6 nm), and MCM-41 (2.9 nm) are compared. Our value for the density of accessible surface silanols for MCM-41 (1.99 nm-2) compares favorably with that obtained by Anwander for a MCM-41 with a slightly higher surface area of 1139 m2/g (1.85 nm-
2). Note that similar densities of surface silanols are obtained for silylated Cabosil and SBA-15.
Prepr. Pap.-Am. Chem. Soc., Div. Fuel Chem. 2003, 48(2), 623

In our studies of the pyrolysis of immobilized fuel model compounds on the surface of Cabosil, we have employed a different surface derivatization method that does not employ silane coupling reagents.1 The reaction of the surface silanols with a phenolic precursor results in a Si-O-Caryl linkage to the surface. We have found this linkage to be thermally robust to ca. 550 °C, which permits the study of pyrolysis reactions under surface confinement. However, the linkage is easily cleaved with aqueous base permitting the recovery of reaction products from the surface. It is anticipated that the maximum surface densities of the larger DPP moieties will be less than for the smaller silane derivative. The three silicas were reacted with excess p-HOPh(CH2)3Ph and analyzed by both chemical analysis (vide supra) and carbon elemental analysis (combustion). The surface coverages for these two methods (Table 1) are in agreement for all three silicas within ± 5% indicating that the DPP molecules can be completely recovered from the mesoporous silicas by the chemical method. As expected, the DPP surface densities are lower than the SiHMe2 densities. However, it is interesting that the magnitude of this effect is larger for the mesoporous solids suggesting a more crowded environment than on the exterior surface of the nonporous Cabosil particles. These hybrid materials are being further characterized by BET surface analysis, FTIR, and NMR relaxation measurements. Table 1. Surface Derivatization of Silicas with (Me2HSi)2NH and
p-HOPh(CH2)3Ph
Surface Analysis Cabosil (200 m2/g)
SBA-15 (543 m2/g; 5.6 nm pore)
MCM-41 (1088 m2/g; 2.9 nm pore)
---SiH(CH3)2 Coverage (mmol/g)a Density (nm-2)c
0.68 2.12
1.45 1.77
2.97 1.99
---Ph(CH2)3Ph Coverage (mmol/g)a Coverage (mmol/g)b Density (nm-2)c
0.55 0.53 1.78
0.94 0.99 1.37
1.62 1.71 1.43
a From elemental analysis (carbon) on a per g of derivatized silica basis. b From chemical analysis on a per g of derivatized silica basis. c Surface density calculated on a per g of silica basis. Pyrolysis Results. Surface-attached 1,3-diphenylpropane (≈DPP) undergoes a free radical chain decomposition reaction at 375°C to produce surface-attached toluene and gas-phase styrene plus the complementary product pair, gas-phase toluene and surface-attached styrene.2,7 The free radical chain mechanism (chain length in excess of 200) involves hydrogen abstraction by surface-attached
375 oCCH 3 + CH=CH 2
+ CH 3 CH=CH 2+
Figure 1. Products from pyrolysis of mesoporous silica-attached DPP. The jagged line represents position of attachment. and gas-phase benzyl radicals from the benzylic positions of ≈DPP to give regiochemically distinct benzylic radicals, which undergo facile β-scission to produce the surface-attached and gas-phase styrene products, as well as regenerating the chain carrying benzyl radicals.
Reaction rates and selectivity in product formation are highly dependent on surface coverage (proximity of neighboring molecules and radicals involved in hydrogen transfer propagation steps). The ≈DPP pyrolysis rate at saturation surface coverages is comparable to that for DPP in fluid phases, but the rate decreases dramatically with decreasing surface coverage. As can be seen from the data in Table 2, ≈DPP pyrolysis rates at saturation surface coverage for the mesoporous silicas, despite the lower density of derivatized sites, are somewhat faster than that for the Cabosil and appear to be faster for the smaller pore size. This suggests that there is a pore-size dependence for the pyrolysis rate, which likely arises from faster hydrogen atom transfer steps on the surface, for the smaller, more highly curved pores. Additional studies of smaller pore size MCM-41 materials (1.7-2.4 nm) are in progress. Since the size of a DPP molecule is approximately 1.2 nm, these pores could become quite crowded and lead to interesting pyrolysis behavior. Selectivity in product formation, measured by the ratio of styrene to toluene yields in the gas phase also appears to be slightly larger for pore-confined DPP compared with the Cabosil suggesting an unexpected selectivity in the rates of hydrogen abstraction at the two benzylic carbons.7 This phenomenon is also under current investigation.
Table 2. Pyrolysis Rates for Surface-Immobilized 1,3-Diphenylpropane (≈DPP) at Saturation Surface Coverage.
Silica Pore Size (nm)
≈DPP Surface Coverage (mmol/g)
≈DPP Density (nm-2)
≈DPP Rate at 375°Ca (%/h)
Cabosil NA 0.53 1.8 8.4 SBA-15 5.6 0.99 1.4 11.3 MCM-41 2.9 1.71 1.4 14.4
a Rates are obtained from the slopes of plots of ≈DPP conversion versus time, and have a typical accuracy of ± 10%. Conclusions Mesoporous silicas, SBA-15 and MCM-41, can be derivatized with phenols to give novel hybrid materials possessing thermally robust Si-O-Caryl linkages. Initial pyrolysis results for the surface-attached DPP probe molecule suggest that pore confinement can lead to larger reaction rates and alterations in product selectivity that may correlate with pore size. Additional experiments with smaller pore size MCM-41 silicas are in progress. Acknowledgment. This research was sponsored by the Division of Chemical Sciences, Geosciences, and Biosciences, Office of Basic Energy Sciences, U.S. Department of Energy under contract DE-AC05-00OR22725 with Oak Ridge National Laboratory, managed and operated by UT-Battelle, LLC. References (1) Buchanan, A. C., III; Britt, P. F. J. Anal. Appl. Pyrolysis 2000,
54, 129; and references therein. (2) Buchanan, A. C., III; Britt, P. F.; Thomas, K. B.; Biggs, C. A.
J. Am. Chem. Soc. 1996, 118, 2182. (3) Zhao, D.; Feng, J.; Huo, Q.; Melosh, N.; Fredrickson, G. H.;
Chmelka, B. F.; Stucky, G. D. Science 1998, 279, 548. (4) Beck, J. S.; Vartuli, J. C.; Roth, W. J.; Leonowicz, M. E.;
Kresge, C. T.; Schmitt, K. D.; Chu, C. T-W.; Olson, D. H.; Sheppard, E. W.; McCullen, S. B.; Higgins, J. B.; Schlenker, J. L. J. Am. Chem. Soc. 1992, 114, 10834.
(5) Anwander, R.; Nagl, I.; Widenmeyer, M.; Engelhardt, G.; Groeger, O.; Palm, C.; Roser, T. J. Phys. Chem. B 2000, 104, 3532.
(6) Anwander, A. Chem. Mater. 2001, 13, 4419. (7) Buchanan, A. C., III; Biggs, C. A. J. Org. Chem. 1989, 54, 517.
Prepr. Pap.-Am. Chem. Soc., Div. Fuel Chem. 2003, 48(2), 624
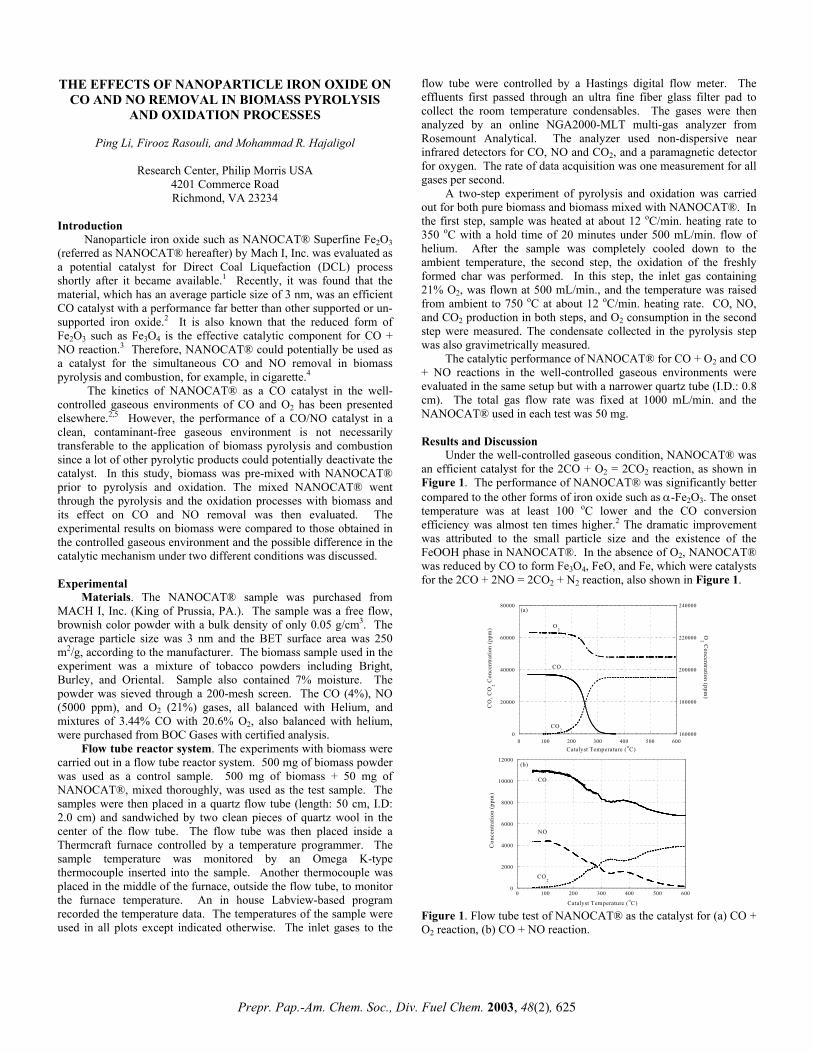
THE EFFECTS OF NANOPARTICLE IRON OXIDE ON CO AND NO REMOVAL IN BIOMASS PYROLYSIS
AND OXIDATION PROCESSES
Ping Li, Firooz Rasouli, and Mohammad R. Hajaligol
Research Center, Philip Morris USA 4201 Commerce Road Richmond, VA 23234
Introduction
Nanoparticle iron oxide such as NANOCAT® Superfine Fe2O3 (referred as NANOCAT® hereafter) by Mach I, Inc. was evaluated as a potential catalyst for Direct Coal Liquefaction (DCL) process shortly after it became available.1 Recently, it was found that the material, which has an average particle size of 3 nm, was an efficient CO catalyst with a performance far better than other supported or un-supported iron oxide.2 It is also known that the reduced form of Fe2O3 such as Fe3O4 is the effective catalytic component for CO + NO reaction.3 Therefore, NANOCAT® could potentially be used as a catalyst for the simultaneous CO and NO removal in biomass pyrolysis and combustion, for example, in cigarette.4
The kinetics of NANOCAT® as a CO catalyst in the well-controlled gaseous environments of CO and O2 has been presented elsewhere.2,5 However, the performance of a CO/NO catalyst in a clean, contaminant-free gaseous environment is not necessarily transferable to the application of biomass pyrolysis and combustion since a lot of other pyrolytic products could potentially deactivate the catalyst. In this study, biomass was pre-mixed with NANOCAT® prior to pyrolysis and oxidation. The mixed NANOCAT® went through the pyrolysis and the oxidation processes with biomass and its effect on CO and NO removal was then evaluated. The experimental results on biomass were compared to those obtained in the controlled gaseous environment and the possible difference in the catalytic mechanism under two different conditions was discussed.
Under the well-controlled gaseous condition, NANOCAT® was an efficient catalyst for the 2CO + O2 = 2CO2 reaction, as shown in Figure 1. The performance of NANOCAT® was significantly better compared to the other forms of iron oxide such as α-Fe2O3. The onset temperature was at least 100 oC lower and the CO conversion efficiency was almost ten times higher.2 The dramatic improvement was attributed to the small particle size and the existence of the FeOOH phase in NANOCAT®. In the absence of O2, NANOCAT® was reduced by CO to form Fe3O4, FeO, and Fe, which were catalysts for the 2CO + 2NO = 2CO2 + N2 reaction, also shown in Figure 1.
Experimental
Materials. The NANOCAT® sample was purchased from MACH I, Inc. (King of Prussia, PA.). The sample was a free flow, brownish color powder with a bulk density of only 0.05 g/cm3. The average particle size was 3 nm and the BET surface area was 250 m2/g, according to the manufacturer. The biomass sample used in the experiment was a mixture of tobacco powders including Bright, Burley, and Oriental. Sample also contained 7% moisture. The powder was sieved through a 200-mesh screen. The CO (4%), NO (5000 ppm), and O2 (21%) gases, all balanced with Helium, and mixtures of 3.44% CO with 20.6% O2, also balanced with helium, were purchased from BOC Gases with certified analysis.
Flow tube reactor system. The experiments with biomass were carried out in a flow tube reactor system. 500 mg of biomass powder was used as a control sample. 500 mg of biomass + 50 mg of NANOCAT®, mixed thoroughly, was used as the test sample. The samples were then placed in a quartz flow tube (length: 50 cm, I.D: 2.0 cm) and sandwiched by two clean pieces of quartz wool in the center of the flow tube. The flow tube was then placed inside a Thermcraft furnace controlled by a temperature programmer. The sample temperature was monitored by an Omega K-type thermocouple inserted into the sample. Another thermocouple was placed in the middle of the furnace, outside the flow tube, to monitor the furnace temperature. An in house Labview-based program recorded the temperature data. The temperatures of the sample were used in all plots except indicated otherwise. The inlet gases to the
flow tube were controlled by a Hastings digital flow meter. The effluents first passed through an ultra fine fiber glass filter pad to collect the room temperature condensables. The gases were then analyzed by an online NGA2000-MLT multi-gas analyzer from Rosemount Analytical. The analyzer used non-dispersive near infrared detectors for CO, NO and CO2, and a paramagnetic detector for oxygen. The rate of data acquisition was one measurement for all gases per second.
A two-step experiment of pyrolysis and oxidation was carried out for both pure biomass and biomass mixed with NANOCAT®. In the first step, sample was heated at about 12 oC/min. heating rate to 350 oC with a hold time of 20 minutes under 500 mL/min. flow of helium. After the sample was completely cooled down to the ambient temperature, the second step, the oxidation of the freshly formed char was performed. In this step, the inlet gas containing 21% O2, was flown at 500 mL/min., and the temperature was raised from ambient to 750 oC at about 12 oC/min. heating rate. CO, NO, and CO2 production in both steps, and O2 consumption in the second step were measured. The condensate collected in the pyrolysis step was also gravimetrically measured.
The catalytic performance of NANOCAT® for CO + O2 and CO + NO reactions in the well-controlled gaseous environments were evaluated in the same setup but with a narrower quartz tube (I.D.: 0.8 cm). The total gas flow rate was fixed at 1000 mL/min. and the NANOCAT® used in each test was 50 mg.
Results and Discussion
0
2000
4000
6000
8000
10000
12000
0 100 200 300 400 500 600
Con
cent
ratio
n (p
pm)
Catalyst Temperature (oC)
(b)
CO
CO2
NO
0
20000
40000
60000
80000
160000
180000
200000
220000
240000
0 100 200 300 400 500 600
CO
, CO
2 Con
cent
ratio
n (p
pm)
O2 C
oncentration (ppm)
Catalyst Temperature (oC)
CO
CO2
O2
(a)
Figure 1. Flow tube test of NANOCAT® as the catalyst for (a) CO + O2 reaction, (b) CO + NO reaction.
Prepr. Pap.-Am. Chem. Soc., Div. Fuel Chem. 2003, 48(2), 625

Figure 2. Temperature profile and CO, CO2, and NO production during pyrolysis ((a) – (d)) and oxidation ((e) – (h)) processes. Solid line: test sample with biomass powder and NANOCAT®. Dashed line: control sample with biomass powder only.
The pyrolysis and oxidation of mixture of biomass and NANOCAT® constitute a much more difficult chemical environment for CO and NO catalysts to be effective. Many products evolved during the pyrolysis of biomass could potentially deactivate the catalysts. Thus, it is important to investigate the performance of NANOCAT® in an environment controlled by the biomass pyrolysis and oxidation processes. The tests were carried out by mixing biomass and NANOCAT® together and the mixtures then underwent the pyrolysis and the subsequent char oxidation process, as the control biomass sample. The results are shown in Figure 2 and the integrated data are summarized in Table 1. It can be clearly seen that the effects of NANOCAT® on CO, CO2, and NO evolution during the pyrolysis were minimal. The only notable change was that with NANOCAT®, NO evolved at lower temperature. However, significant changes were observed in the subsequent char oxidation process of the sample with NANOCAT®. CO production was reduced by 67%, from 1.89 to 0.63 mmol, and NO was also reduced by 57%, from 0.060 to 0.026 mmol. Since the CO oxidation is highly exothermic, a bigger temperature rise was observed for the sample with NANOCAT®, as shown in Figure 2 (e). One interesting observation was that the increase of CO2 (8.37 - 5.93 = 2.44 mmol) was more than the decrease of CO (1.89 – 0.63 = 1.26 mmol), suggesting that the oxidation of other compounds also contributed to the total CO2 production. A lower amount of condensate was
collected in the filter pad for the biomass sample mixed with NANOCAT®, 50.6 mg versus 64.3 mg for the control biomass sample because some of the condensable components were adsorbed by NANOCAT® during the pyrolysis step. These adsorbed components were then catalytically oxidized to CO2 during the oxidation step. Higher O2 consumption for the char sample with NANOCAT® (8.96 vs. 7.02 mmol) also confirmed this mechanism.
0
50
100
150
200
250
300
350
Sam
ple
Tem
pera
ture
(o C)
Sample Temperature (a)
0
100
200
300
400
500Sample Temperature
(e)
0
500
1000
1500
Con
cent
ratio
n (p
pm)
CO
(b)
0
10000
20000
30000
40000
50000
CO
(f)
0
1000
2000
3000
4000
5000
Con
cent
ratio
n (p
pm)
CO2
(c)
0
50000
100000
150000CO2
(g)
0
100
200
300
400
500
600
700
0 500 1000 1500 2000 2500 3000Oxidation Time (second)
NO
(h)
0
100
200
300
400
500
600
700
0 500 1000 1500 2000 2500
Con
cent
ratio
n (p
pm)
Pyrolysis Time (second)
NO
(d)
Table 1. Summary of the Pyrolysis and Oxidation Results (mmol)
CO CO2 NO O2 Control 0.18 1.11 0.049 Pyrolysis
Test 0.21 1.17 0.047 Control 1.89 5.93 0.060 7.02 Char
Oxidation Test 0.63 8.37 0.026 8.96
In addition to the CO + NO reaction, NO + char reaction could also contribute to the total removal of NO.6 This is clearly another possible mechanism to explain the decrease of NO production in the oxidation step of the biomass mixed with NANOCAT®. Additional tests were carried out to verify if the existence of NANOCAT® would promote the NO + char reaction. The experiments were done by simply switching 21 % O2 to 1500 ppm of NO in the oxidation steps. As shown in Figure 3, the onset temperature of NO + char reaction was reduced in the biomass char sample with NANOCAT® and the complete NO removal was achieved at a temperature less than 400 oC, which was more than 200 oC lower compared to the control sample.
0
500
1000
1500
2000
0 100 200 300 400 500 600 700 800
Control With NANOCAT
NO
Con
cent
ratio
n (p
pm)
Sample Temperature ( oC)
Figure 3. The effect of NANOCAT® on NO + char reaction. Acknowledgment
The support of Philip Morris USA management on fundamental science research is gratefully acknowledged. References 1. Huffman, G. P., Ganguly, B., Zhao, J., Rao, K. R. P. M., Shah,
N., Feng, Z., Huggins, F. E., Taghiei, M. M., Lu, F., Wender, I., Pradhan, V. R., Tierney, J. W., Seehra, M. M., Ibrahim, M. M., Shabtai, J., Eyring, E. M., Energy Fuels, 1993, 7, 285.
2. Li, P., Miser, D. E., Rabiei, S., Yadav, R. T., Hajaligol, M. R., Appl. Catal. B, 2003, in press.
3. Randall, H., Doepper, R., Renken, A., Appl. Catal. B, 1998, 17, 357.
4. Li, P., Rasouli, F., Hajaligol, M. R., Beiträge zur Tabakforschung International, 2003, submitted.
5. Li, P., Shin, E., Miser, D. E., Rasouli, F., Hajaligol, M. R., to be published in Nanotechnology in Catalysis; Zhou, B., Hermans, S., Somorjai, G. A., Ed., Kluwer Academic/Plenum, 2003.
6. Aarna, I., Suuberg, E. M., Fuel, 1997, 76, 475.
Prepr. Pap.-Am. Chem. Soc., Div. Fuel Chem. 2003, 48(2), 626

STUDIES ON CHEMICAL MECHANISM OF 1-HEPTENE ACID-CATALYZED REACTIONS
Results and Discussion
Cracking Products of 1-Heptene. According to the β-scission mechanism, the primary cracking products, butene, of 1-heptene should be linear. However, experimental data showed that product was skeletally isomerized to a large degree (Seen in Table 1). For instance, in the cracking products of 1-heptene over USY and HZSM-5 at 500 ºC, the iso/normal ratios of butene were 0.561 and 0.822 respectively, which are higher than thermodynamic equilibrium value (0.46[2]). Although the possibility of skeletal isomerization of primary products after cracking can not be taken out of consideration, it is obviously unreasonable that the degree of isomerization always exceeds the thermodynamic equilibrium value. The same result had been shown by 1-heptene’s cracking over HZSM-5 at 510 ºC in Buchanan’s research[3], in which the iso/normal ratio of butene was 0.742, whereas the equilibrium ratio under that condition is 0.458[2]. It proves that at least some of the isobutene is primary product of the cracking and not a result of post-isomerization. Thus, the excess isobutene in 1-heptene cracking may be understood if skeletal isomerization of carbenium ions is a prerequisite for cracking.
Zheng Li, Jian-Fang Zhang, Chao-He Yang, Hong-Hong Shan
State Key Laboratory of Heavy Oil Processing, University of
Petroleum, Dongying, Shandong, 257061, P. R. China Introduction
There have been a few disputes about the mechanisms of alkenes reactions on solid acidic catalysts for over half a century since Greensfelder and Thomas proposed their carbenium ion theory in 1949. It is generally accepted that the active centers in those reactions are protic acidic centers (Brønsted Acid Centers) on the catalyst surface and that the reactive intermediates are carbenium ions. Most researchers agreed that the cracking of carbenium ions happens via the β-C-C-bond scission mechanism. That theory is still being quoted in most literatures on catalytic cracking for it did explain some features of catalytic cracking and forecast the product distribution of some reactions successfully. Nevertheless, large quantities of experimental data have shown that its simple description of catalytic cracking process was not accurate enough. The carbenium ions also undergo skeletal isomerization via the protonated cyclopropane mechanism[1]. That course is demonstrated
by Fig 1. Reactions of alkenes over acidic catalysts are often accompanied by the formation of alkanes. However, such reactions are not yet known in detail.
Table 1. Cracking Products of 1-Heptene at 500 ºC Yield wt%
Catalyst Conv. wt% C3
= i-C4= t-2-C4
= c-2-C4= 1-C4
= i-C4
=/ C4
= USY 97.36 19.568 15.286 5.809 5.038 1.115 0.561
HZSM-5 96.57 13.024 14.653 1.394 1.080 0.703 0.822 ][ 3223
2
CHRCHCHRCHCHHCCH
CHH
−−→−−− +
+
RCHCHCCHHRCCHCHCH
RCHCCHCHRCHCHHCCH
23333
32333
)()(
)()(
−−→−−
−−→−−++
++
Fig 1. Protonated Cyclopropane Mechanism
Saturated Products of 1-Heptene. Notable amounts of dimethyl-substituted alkanes with the same carbon number as the substrate were found in catalytic conversion products of 1-heptene (Seen in Table 2). For examples, over USY and HZSM-5 at 500 ºC, the yields of 2,3-dimethyl pentane are 2.808 wt% and 2.887 wt% respectively in the products. According to traditional carbenium ion mechanisms, those iso-alkanes must be secondary products. They are produced through substrate’s isomerization and then hydrogen transfer (Route A) or hydrogen transfer then isomerization (Route B). It is a fact that hydrogen transfer reactions are reversible reactions and their reaction rates are fairly low under common catalytic cracking temperature. If those iso-alkanes are produced through Route A, there must be some corresponding iso-alkenes in the products. Unfortunately, those corresponding iso-alkenes are totally absent in the products (Seen in Table 3). If those iso-alkanes are produced through Route B, the iso/normal ratios must be less than the thermodynamic equilibrium value of isomerization reactions. However, the experimental data are 3.7 and 0.45, and the equilibrium value is 0.21[4]. Consequently, traditional carbenium ion mechanism cannot rationalize those excess iso-alkanes. At least some of the iso-alkanes are primary products and it is reasonable that extensive skeletal isomerization of the carbenium ions may precede hydrogen transfer.
Experiment
In this paper, pulsating reaction system (Fig 2) and a mini reactor with 1.5 mm i.d. were employed to investigate the fast reactions of alkenes. 1-heptene was chosen as substrate due to its limited number of reaction pathways and products. The most commonly used types of zeolite on FCC unit, USY and HZSM-5, were introduced to the experiments.
Fig 2. Flowchart of Pulsating Reaction System
Table 2. Saturated C7 Products of 1-Heptene at 500 ºC
Catalyst Type Yield wt% USY HZSM-5
n-C70 0.758 6.401
2,4-DM-C50 0.122 -
3,3-DM-C50 0.151 0.906
2-M-C60 3.050 4.027
2,3-DM-C50 2.808 2.887
3-M-C60 1.413 1.418
3-E-C50 1.877 3.226
Prepr. Pap.-Am. Chem. Soc., Div. Fuel Chem. 2003, 48(2), 627

Those excess branching of cracking products and hydrogen transfer products are therefore intrinsic features rather than incidental occurrences, and traditional carbenium ion mechanisms cannot explain them.
In addition, observable quantities of ethyl-substituted alkanes and alkenes with the same carbon number as the substrate were detected in the products. Moreover, those ethyl-substituted products bore some characteristics of primary products for they stood out when the substrate conversion was fairly low. Obviously, those phenomena can not be rationalized by protonated cyclopropane mechanism.
Table 3. Isomerized C7 Alkenes of 1-Heptene at 500 ºC
Catalyst Type Yield wt% USY HZSM-5
2-C7= 6.468 8.856
3-C7= 7.437 14.424
2,4-DM-2-C5
= 0.551 0.612
2-M-2-C6= 1.833 2.386
3,4-DM-2-C5= 1.305 1.400
3-M-2-C6= 8.255 9.529
3-M-3-C6= 2.130 3.071
3-E-2-C5= 2.206 1.158
Proposition of CTS Mechanism. On the basis of the above analysis, we put forward a new mechanism to explain the catalytic transformation of 1-heptene, in which the Cyclo-Transition State (CTS) postulated earlier for isomerization of carbenium ions were applied as a starting point for the carbenium ions fission and hydrogen transfer steps. The CTS mechanism introduced protonated dialkylcyclopropane and dialkylcyclobutane, which are thermodynamically favorable in its formation by quantum-mechanical calculations[5][6][7], as transition states. Then, rings on those three-membered or four-membered ringed ions opened at different position, which lead to the formation of branched carbenium ions. Finally, those branched carbenium ions proceeded β-C-C-bond scission, hydrogen transfer and desorption (isomerization), if possible. The CTS mechanism could be represented as Fig 3.
H −
It can be inferred from Fig 3 that the overall reaction depicted by CTS mechanism is the transformation of a secondary carbenium ion to a tertiary one or a secondary one. From the viewpoint of energy, there is a positive driving force for the reaction. Thus, the
proposed mechanism is practicable since the reaction pathway doesn’t involve a high energy barrier.
Product Predictions of CTS Mechanism. According to CTS mechanism, there are five types of intermediate carbenium ions produced with different skeleton altogether. Those intermediate carbenium ions and their following reactions are shown in Fig 4. In order to simplify the analysis, we only discuss the reactions of the most thermodynamically stable carbenium ions of each type, that is, tertiary or secondary carbenium ions, for those reactions happen more easily than others.
Some assumptions are soundly made in the design of reaction pathways of those intermediate carbenium ions. Two kinds of β-scission reactions, which will lead to the formation of methyl carbenium ion or ethyl carbenium ion, will not happen. The reason is that the formations of those primary carbenium ions are strong endothermic reactions and they are highly energetically unfavorable under common FCC temperature. During the course of desorption of carbenium ions from catalyst surface, an H atom will be donated by a carbenium ion to the acid center. The abstraction of H atom from methyl groups is considered as an impossible reaction because such abstraction from other kind of carbon atoms proceeds more facilely [1].
3-M-2-C6=
D D
H 32223
3CHCHCHCCHCH
CH−−−−−
+
32223
3CHCHCHCHCCH
CH−−−−−
+
3423 )( CHCHHCCH −−− +
323
33CHCHCCHCH
CHCH−−−−
+
3223
2
3
CHCHCCHCHCHCH
−−−−+
3-M-3-C6= (1)
3-M-C60
i-C4= + C3
=
D β
H
(2) 2-M-2-C6
= 2-M-C6
0
C4= + C3
=
D β
H D
2-C7=
(3) 3-C7
= n-C7
0
3-E-2-C5= D
H (4) 3-E-C5
0
3,4-DM-2-C5=
H D
(5) 2,3-DM-C5
0
Fig 4. Reaction Pathways of Intermediate Carbenium Ions NOTE: D, H and β in Fig 4 mean desorption, hydrogen transfer and β-Scission respectively,
RCHCHCHCCH −−−− +2223
][ 23
2RCHCHCHCH
CHH−−−−
+
][ 3
22RCHCHCH
CHCHH−−−
−+
RCHCHCHHCCH −−−−− +2223
RCHCCHCHCH
−−−−+
223
3
RCHCCHCHCH
−−−−+
223
3
RCHCHCCHCH
−−−−+
223
3
3223 CHCHCCHCHR
−−−−+
RCCHCHCHCH−−−
+3
33
Fig 3. CTS Mechanism
β-Scission, and/or
Hydrogen Transfer and/or
Desorption
Primary Products Intermediate Carbenium Ions Cyclo-Transition State Original Carbenium Ion
There is one point should be noted in Fig 4. It seems that 2,3-dimethylpentene would be produced through carbenium ions’ desorption in reaction (5). However, that reaction doesn’t happen at all since the electron donating effect of methyl groups strengthen the C-H bond on the tertiary C atom. Conclusions
Generally speaking, the predictive primary products of cracking, isomerization and hydrogen transfer of 1-heptene by this new mechanism are perfectly consistent with the experimental results shown in Table 1, 2 and 3. Furthermore, with this new mechanism, the excess iso-hydrocarbons in the products of 1-heptene over solid acid catalyst could be well understood.
In a word, the CTS mechanism not only inherits all the advantages of β-scission mechanism and isomerization mechanism, but also it is capable of providing a logical explanation for experimental facts which can not be explained by those traditional mechanisms in a satisfactory way. This new mechanism casts a new
Prepr. Pap.-Am. Chem. Soc., Div. Fuel Chem. 2003, 48(2), 628

light on the relation among catalytic cracking, isomerization and hydrogen transfer of alkenes.
Acknowledgement. We greatly appreciate the financial support given by the Ministry of Education, PetroChina, and SINOPEC to the research of this subject. References (1) Yury V. Kissin; Catalysis Review, 2001, 43(1&2), 85-146. (2) Chen Junwu; Cao Hanchang; Catalytic Cracking Technology and
Engineering; Sinopec Press: Beijing, 1995; pp. 112-155 (3) J. S. Buchanan; J. G. Santiesteban; W. O. Haag; Journal of Catalysis,
1996, 158, 279–287. (4) Huang Guoxiong; Li Chenglie; Liu Fan; Hydrocarbon Isomerization;
Sinopec Press: Beijing, 1992; pp.15-25. (5) S. Tiong Sie; Ind. Eng. Chem. Res. 1992; 31, 1881-1889. (6) Wu Feng; Erik Vynckier; Gilbert F. Froment; Ind. Eng. Chem. Res. 1993,
32, 2997-3005. (7) Zhao Liuzhou; Zhou Han; Shi Zhicheng; Acta Petrolei Sinica
(Petroleum Processing Section), 2002, 18 (4), 90-94.
Prepr. Pap.-Am. Chem. Soc., Div. Fuel Chem. 2003, 48(2), 629

CONVERSION CO2 TO FORMATE BY FORMATE DEHYDROGENASE IMMOBILIZED IN SILICATE
MATRIX
Hong Wu , Zhong-yi Jiang* , Song-wei Xu
School of Chemical Engineering and Technology, Tianjin University ,Tianjin 300072, China.
Introduction
The efficient utilization of CO2 will not only help to alleviate greenhouse effect, but also to obtain useful chemicals and materials as well. Unlike traditional CO2 conversion reaction such as heterogeneous catalysis, photocatalysis and electrocatalysis, a novel bio-pathway has been explored, by which CO2 is converted to formate, an important organic compound and a clean fuel. Herein, formate dehydrogenaes (FateDH) was employed as the biocatalyst while reduced nicotinamide adenine dinucleotide (NADH) as a terminal electron donor. Sol-gel technology was introduced to encapsulate FateDH . NaHCO3 was used as reactant instead of CO2 as substrate since the whole reaction was conducted in aqueous solution and HCO3
- is the main form of CO2 dissolved in water. In addition, liquid-solid two-phase reaction system is much easier to manipulate than gas-liquid-solid three-phase reaction system. The FateDH-containing silicate matrix was characterized by UV spectrum and TEM. Base on the ordered reaction mechanism, kinetic parameters of both the free and immobilized enzymatic reactions were determined. Enzyme immobilization by sol-gel process
The initial sol was prepared by mixing 2.60g of tetraethyl orthosilane (TEOS), the precursor, and 0.55g of 1.5% HCl, the acid catalyst. The mixture was oscillated for 3 min to form homogeneous solution, and then 1.05 g of 1% NaOH was dropwised to adjust the pH to 7.0. FateDH solution (0.2 µ M phosphate buffer at pH 7.0) was added in the sol. Enzyme-contained silicate gel was formed within 50~60sec and then was aged for 7days at 4 . C° Characterization of the gel
No leakage of FateDH from the gel after long time soaking in the buffer was detected by UV-3010 Spectrometer (Hicathi, Japan), and the maximum absorption of the free FateDH and immobilized FateDH was both at 280nm. TEM (100CX-II, JEOL) picture showed that enzyme dispersed uniformly in the gel.
Bioconversion reaction and kinetic parameters
NaHCO3 can be catalyzed to formate by FateDH when NADH acts as an electron donor. The initial-rates of free and immobilized FateDH catalytic reaction at 25 and pH7.0 were determined by the decrease of NADH concentraton which was measured by a UV spectrometer at 340nm. The concentration of F
C°
ateDH was fixed at 0.2 µ M, while NADH concentration (denoted by A) varied from 0.05 to 0.5mM and that of NaHCO3 (denoted by B) varied from 0.8 to 5.0mM.
According to the ordered enzymatic reaction mechanism proposed by Dalziel (Equation 1)[1,2], kinetic parameters were fitted out. A series of initial rate measurements having been made under a constant initial concentration of A and different concentrations of B,
a plot of 0
0 ][vE
versus ][
1
0B gave a straight line, with both slope
and intercept as the linear functions of ][
1
0A. Varying the
concentration of A, the slopes and intercepts of the primary plots may be plotted against
][1
0A, and the 4 kinetic parameters
( ABBA φφφφ ,,,0 ) can be determined as the function of slopes and intercepts.
[ ] [ ] [ ][ ]00000
0
0 ][BABAv
E ABBA φφφφ +++= (1)
Kinetic parameters of both free enzyme reaction and immobilized enzyme reaction are listed in Table 1.
Table 1. Kinetic parameters of both free and immobilized
FateDH catalyzed reactions Freed FateDH Immobilized FateDH
0φ s3854 s3928
Aφ mMs ⋅213 mMs ⋅243
Bφ mMs ⋅5699 mMs ⋅10301
ABφ ( ) smM ⋅2329 ( ) smM ⋅21011
mAK Mµ55 Mµ63
mBK mM5.1
mM6.2
SAK Mµ58 Mµ98
Experimental results showed that both the free and immobilized
FateDH enzymatic reactions obey the ordered mechanism. The larger Michaelis-Menten kinetic constants of immobilized FateDH compared with free FateDH reaction indicate that the binding force between the substrate and the immobilized enzyme is weaker. This may be due to the diffusion hindrance of the substrate from bulk solution to the gel and the accessibility hindrance of the immobilized enzyme in the three-dimensional silicate network. Conclusions
The conversion of CO2 to formate by formate dehydrogenase was explored using NaHCO3 as reactant instead of CO2 itself. Kinetic parameters of both free and immobilized enzymatic reactions were determined based on the ordered mechanism.
Acknowledgement. The financial support from the National Natural Science Foundation of China (No.20176039) was greatly acknowledged. References
(1) Dalziel, K. Nature, 1963,197 (2), 462. (2) Dalziel K. The Journal of Biological Chemistry, 1963, 238 (8), 2850.
Prepr. Pap.-Am. Chem. Soc., Div. Fuel Chem. 2003, 48(2), 630
CRACKING AND CRACKING SELECTIVITY OF ALKANE AND ALKYL AROMATICS: EFFECTS OF
DISPERSED CATALYSTS AND HYDROGEN DONORS
Bin Shi * GuoHe Que
State key laboratory of heavy oil processing, University of Petroleum, Dongying, ShanDong, 257061, China
Introduction
The synergism between dispersed catalysts and hydrogen donors were important for the systems of the traditional coal catalytic liquefaction and hydrocracking processing of heavy oil (1~3). Some studies show the synergism was helpful to effective inhibition the regression reaction in the liquefaction of coal and the formation of coke and asphaltene in heavy oil hydrocracking(1~3). However, the effects of dispersed catalysts and hydrogen donors on the selectivity of cracking reaction of coal and heavy oil molecular were unclear.
It is known that there are some long-chain hydrocarbons in the paraffin of residue oil. Meanwhile, there exist some poly-ring aromatic in the aromatics, resin and asphaltene of residue oil, which have alkyl side-chain"•" or alkyl bridge-chain"••". This work aimed to investigate the effects of dispersed catalyst and hydrogen donor on the cracking and cracking selectivity of these characteristic structures in heavy oil. Some model compounds have been chosen to simulate the cracking of residue oil. Normal eicosane, as model compound for paraffin, butyl benzene and 1,6-diphenylheptane, as model compounds for aromatics, resin and asphaltene in residue oil, were introduced to investigate the effects of dispersed catalyst and hydrogen donor on the cracking and cracking selectivity of these model compounds in the systems of thermal-, hydrothermal and catalytic hydrocracking of the model compounds in high temperature 440oC. Experimental
About 0.1000~0.2000g reactant including 0.1000g normal eicosane (Aldrich purity is 99%), butyl benzene (Aldrich purity is 99%) and 1,6-diphenylheptane, (self-made, purity is about 90%, impurity mainly is ph-CO-(CH2)5-ph) and some additives including H-donor tetralin (THN, purity is 99.3%) or aromatic solvent 1-methylnaphthelene(MN, purity is 97%), whose amount generally is 100%wt of model compound, or oil-soluble dispersed catalysts MoDTC, metal of whose amount generally is 1%wt of model compound, was charged into a quartz tube and placed in a 40ml non-stirred high pressure micro- reactor, washed with nitrogen or hydrogen, pressurized nitrogen or hydrogen to 7.0Mpa. Then the micro- reactor was preheated in 300oC liquid tin bath for 15 minutes, and inserted into another tin bath whose reaction temperature was desired. During the reaction, the pressure was about 15.5Mpa. The micro-reactor was cooled with ice water quickly when defined reaction time was achieved. Recovered with about 25mL chloroform or dichrolmathane, the cracking products were analyzed by GC-MS and GC. Some conversion was emphasized as follows:
Cracking of model compound = a certain recovered cracking product wt%×100/ recovered model compound wt%;
Conversion of THN = the recovered naphthalene wt%×100/(the recovered naphthalene wt% + recovered THN wt%).
Conversion of MN = the recovered Methyl tetralin wt%×100/(the recovered Methyl tetralin wt% + recovered MN wt%)
Results and Discussion
Normal Eicosane. It is known that long chain hydrocarbons are rich in the paraffin of residue oil (4). N-eicosane was chosen by
reason of the same structure as paraffin of residue oil. Thermal, hydrothermal, catalytic hydrocracking of n-C20 could be performed, while thermal, hydrothermal, catalytic hydrocracking of the binary system of n-C20/tetralin and the binary system of n-C20/MN were also carried out, respectively. The detailed studies have been reported in literature (5,6). It seems that distribution in carbonic number of the products in the four cracking reaction has not changed and the catalytic hydrocracking of n-C yielded more cracking products than hydro thermal and thermal cracking of n-C20 did. On the other hand, it is clear that H-donor or aromatic solvent, especially H- donor, inhibited cracking of n-C20 in hydrogen donor or aromatic solvent. What is different was that the ratio of n-alkanes to α–olefins in thermal cracking and thermal-cracking with aromatic solvent was about 1:1, and that in thermal–cracking in H-donor decreased to about 1:0.5. The proportion of α–olefins in hydrothermal of n-C20 remained about 15~10% and hydrothermal of n-C20 with H-donor hardly gave α–olefins. It is obvious that hydrogen-in-gas and hydrogen provided from H-donor could have hydrogenated the olefins resulted from cracking of n-C20 and the former could enhance cracking of n-C20 and the latter could inhibit cracking. Based on the fact that there were no clear iso-alkanes and iso-alkenes in the cracking products of n-C20, it is obvious that the cracking reaction of n-C20 manifests the character of radical reaction pathway in the thermal, hydrothermal, catalytic hydrocracking system of n-C20 and in the thermal, hydrothermal, catalytic hydrocracking system of the binary system of n-C20 and tetralin.
Butyl Benzene. It is known that there are some poly-ring aromatic hydrocarbons, which have alkyl side-chain"•", in the aromatics, resin and asphaltene in residue oil (7). Butyl benzene was chosen because of the same structure as the aromatic of residue oil. Thermal, hydrothermal, catalytic hydrocracking of butyl benzene have been performed, while thermal, hydrothermal, catalytic hydrocracking of the binary system of butyl benzene / tetralin or the binary system of butyl benzene/MN were also carried out as comparison. Different products from different process gave out as listed in Table 1:
No benzene was produced in the thermal cracking. The thermal-cracking products of butyl benzene were mainly composed of ethyl benzene and toluene and the former was more than the latter. It is resulted from that butyl benzene in the system of thermal-cracking mainly were γ- bond scission and β- bond scission, in which α- bond scissions did not happen.
Molecular hydrogen enhanced the cracking of butyl benzene. In the hydro cracking, the cracking products of butyl benzene were mainly composed of benzene and toluene, but the amount of benzene was more than that of toluene. It is clear that butyl benzene in the system of hydrothermal mainly is α-bond scission and β- bond scission, in which little γ-bond scissions experience.
The effect of THN or MN was inhibition of cracking reaction in the non-catalyzed systems, however the effect of the former was more outstanding than that of the latter. Compared with the degree of inhibition of β- bond scission, more γ-bond scissions could be inhibited by hydrogen donor according to the distribution of cracking products.
Dispersed catalysts enhanced α-bond scission and β- bond scission of butyl benzene in the catalytic hydrocracking, especially α-bond scission. It is clear that molecular hydrogen activated by catalysts mainly attacked the α-bond in Ar-CH2-CH2-CH2-CH3 and subsequently experience α-bond scissions.
The effect of THN was not clear to the catalytic cracking selectivity of butyl benzene, although the catalytic cracking of butyl benzene was decreased by THN. Compared with the effect of H-
Prepr. Pap.-Am. Chem. Soc., Div. Fuel Chem. 2003, 48(2), 631

(2) Molecular hydrogen enhanced the cracking of model compounds, while H-donor decreased the cracking of model compounds. On the other hand, dispersed catalyst greatly enhanced the cracking of model compounds.
donor on the catalytic cracking selectivity, the effect of dispersed catalysts was dominant in the catalytic cracking of butyl benzene.
In the catalytic hydro cracking of 1,6-diphenylheptane, solvent 1-methyl naphthalene can be hydrogenated into methyl tetralin and then could play similar part in the system as tetralin. However, the effect of mixture of 1-methyl naphthalene and methyl tetralin was weaker than that of tetralin.
(3) For cracking selectivity of the three compounds, thermal and hydrothermal cracking were the basis of other processes, dispersed catalysts affected the cracking selectivity of alkyl aromatics on a relatively clear extent, and hydrogen donor had influence on a certain extent on the cracking selectivity on the basis of the thermal, hydrothermal and catalytic hydrocracking systems.
1,6-Diphenylheptane. There are some poly ring aromatics hydrocarbons, which have alkyl bridge-chain"••", in the aromatics, resin and asphaltene in residue oil (7). The similar cracking experiments of 1,6-diphenylheptane as butyl benzene have been done. From Table 2 and Table 3, the cracking character of 1, 6-diphenylheptane in different systems could be found:
References
(1) ShuChai.Guo. Chemistry and Chemical Engineering of Coal
[M] Chemistry Industry Press(China) 1991, 274-285. Thermal-cracking products of 1, 6-diphenylheptane were mainly
composed of toluene, benzene and propyl benzene, since ethyl benzene and styrene were not main products in the thermal cracking. It is clear that of 1,6-diphenylheptane in thermal cracking underwent four kinds of cracking ways, which were α-,β-, γ-bond scission and homolysis.
(2) Bin Shi, D.L.Lin,L.Q.Wang, G.H.Que. Synergism between Hydrogen Donors and Dispersed Catalysts in LHVR Hydrocracking Preprints, American Chemistry Society, Petroleum Chemistry Division. 2001,46(4), 325-328.
(3) Bin Shi, Guohe Que Effects of H-Donors and dispersed catalysts on Catalytic hydrocracking of residue Preprints American Chemistry Society Petroleum Chemistry Division. 2002, 47(2), 113-116.
In the hydrothermal cracking, molecular hydrogen enhanced the four cracking ways of 1,6-diphenylheptane and the products of 1,6-diphenylheptane were mainly composed of benzene and toluene, however, the amount of benzene was more than that of toluene. It is deduced that butyl benzene in the system of hydrothermal mainly were α-bond scission and β- bond scission, in which little γ-bond scissions and homolysis underwent.
(4) WenJie Liang. Petroleum Chemistry [M]. Press of University of Petroleum (China), 1993.
(5) Bin Shi, Guohe Que Thermal-cracking and catalytic hydrocracking reaction of tetralin and normal eicosane with steady isotope. Preprints, Div. Fuel Chem., ACS, 2002, 47(1), 251-254.
In the catalytic hydrocracking system, dispersed catalysts enhanced the α-bond scission and β- bond-scission in the four cracking ways of 1,6-diphenylheptane, especially α-bond scission. It is concluded that polar catalyst was absorbed by aromatic ring and hydrogen activated by catalysts preferentially and mainly attacked the α-bond in phCH2CH2CH2CH2CH2CH2ph and subsequently experienced α-bond scissions. On the other hand, the primary products such as phenyl pentane and phenyl butane also underwent similar α-bond scissions and β- bond scission into secondary products benzene and toluene as butyl benzene in catalytic hydrocracking system.
(6) Bin Shi, L.Q.Wang, D.L.Lin, G.H.Que.Hydrogen-transfer between hydrogen donors and model compounds with steady isotope Preprints American Chemistry Society Petroleum Division. 2001, 46(4), 325-329.
(7) Wang Zi Jun. Study on molecular structure of vacuum residue by ruthenium ions catalyzed oxidation [Doctoral Dissertation] University of Petroleum, China, 1996.
For cracking selectivity, thermal and hydrothermal cracking were the basis of other processes, dispersed catalysts affected the cracking selectivity of alkyl aromatics on a relatively clear extent, while hydrogen donor had influence on a certain extent on the cracking selectivity on the basis of the thermal, hydrothermal and catalytic hydrocracking systems of 1,6-diphenyl heptane, although the cracking was decreased by THN.
Compared with the effect of H-donor on the catalytic cracking selectivity, the effect of dispersed catalysts was dominant in the catalytic cracking of 1,6-diphenyl heptane.
Since iso-products did not be found in the thermal cracking, hydrothermal and catalytic hydro cracking of 1,6-diphenylheptane, it seems that the compound experienced the radical reaction in the systems.
In the catalytic hydro cracking system, 1-methyl naphthalene can be hydrogenated into methyl tetralin and then could play similar part in the system as tetralin. However, the effect of mixture of 1-methyl naphthalene and methyl tetralin was weaker than that of tetralin. Conclusions
(1) Model compounds including n-eicosane, butyl benzene and 1,6-diphenylheptane experienced the radical reaction in the single system of model compound and the binary system of model compound and tetralin in thermal, hydrothermal, catalytic hydrocracking system.
Prepr. Pap.-Am. Chem. Soc., Div. Fuel Chem. 2003, 48(2), 632

Table1 Effect of dispersed catalysts, H-donor and aromatic solvent on the cracking of butyl benzene in different systems. N2 H2 H2 Additives (100%wt) -- THN MN -- THN MN -- THN MN Catalyst (1%wt) -- -- -- -- -- -- Mo Mo Mo
Benzene 0 0 0 14.9 8.2 10.1 30.0 13.0 22.0 Toluene 7.8 3.6 5.6 27.9 18.6 23.7 32.9 15.1 25.5
Cracking products
Ethyl Benzene 15.7 2.3 11.8 2.1 0.50 1.1 0.9 0.23 0.51 Conversion of additive (%) -- 10.7 -- -- -- -- 14.1 34.9
Table2 Effect of catalysts , H-donor and aromatic solvent on the cracking of 1,6-diphenylheptane in different systems. N2 H2 H2 Additives(100%wt) -- THN MN -- THN MN -- THN MN Catalyst (1%wt) -- -- -- -- -- -- Mo Mo Mo
Benzene 67.4 33.5 46.3 96.2 61.7 85.3 223.3 121.7 157.2 Toluene 60.0 27.5 48.3 82.8 54.3 73.2 154.7 82.9 99.1 Ethyl benzene * 15.6 4.8 7.5 20.0 11.1 23.1 30.9 11.4 26.5 Propyl benzene 24.5 13.1 17.6 39.5 36.7 35.2 73.2 50.3 60.2 Butyl benzene 4.9 4.1 4.0 26.2 14.6 22.6 34.8 13.8 26.5 Pentyl benzene 3.1 3.5 5.2 12.6 1.9 10.3 34.8 11.3 20.6
Cracking products
Hexyls benzene 5.5 2.1 4.8 3.6 3.3 4.0 5.5 1.3 4.9 Conversion of additive (%) -- 10.3 -- -- 22.6 -- -- 12.9 29.1
Table3 Effect of catalysts and H-donor on the cracking selectivity of 1,6-diphenylheptane in different systems. N2 H2 H2 Additives(100%wt) -- THN MN -- THN MN -- THN MN Catalyst (1%wt) -- -- -- -- -- -- Mo Mo Mo
α-bond scissions 100 100 95.5 100 100 100 100 100 100 β- bond scission 86.6 87.1 100 95.6 86.5 93.5 82.8 76.6 73.8 γ- bond scission 28.1 25.0 21.3 46.3 39.5 51.2 28.7 20.5 80.7 homolysis. 33.6 36.8 32.9 39.6 56.5 39.4 32.0 68.7 82.2
Prepr. Pap.-Am. Chem. Soc., Div. Fuel Chem. 2003, 48(2), 633

CONSIDERATION ON CHEMICAL STRUCTURES AND THERMAL PROPERTIES OF COKING COAL (1) STRUCTURAL FACTORS FOR COAL PLASTICITY
Masakatsu Nomura, Masataka Hiro, Misa Katsuyama,
Koh Kidena, and Satoru Murata
Department of Applied Chemistry, Faculty of Engineering, Osaka University, Suita, Osaka 565-0871, JAPAN
Introduction
Thermoplastic properties of coal are necessary for making a high quality metallurgical coke. In order to develop the effective procedure for coke-making, factors and mechanisms for coal plasticity had been investigated so far[1]. However, the plastic properties were so complicated that clear explanation was not established yet. In this paper, two coals, a strongly coking coal and a slightly coking coal were analyzed in a chemical view in detail to discuss differences in chemical structure and thermal properties concerning coal plasticity. Experimental
Goonyella (GNY) and Witbank (WIT) coals were provided by the Iron and Steel Institute of Japan. Table 1 summarized the analytical results of these coals. GNY is a strongly coking coal, while WIT is a slightly coking coal. All 13C NMR spectra were recorded on a Chemagnetics CMX-300 spectrometer with a 13C frequency of 75.55 MHz. The measurement conditions and the method for treatments of spectra were described elsewhere[2]. Ruthenium ion catalyzed oxidation (RICO) reaction of the coal samples was performed under the reaction conditions reported previously[3]. Heat treatment of the coals was conducted using a tubular electric furnace. Three grams of coal were placed at the center of a quartz tube, this tube being set up on the furnace. After being purged with nitrogen flow, the tube was heated up to the determined temperature at 3 K/min of heating rate. When reaching the determined temperature, the coal sample was cooled down under nitrogen at ambient temperature. The yields of char, tar, gaseous products were determined by their weights, the remaining portion being assigned as light fraction that are escaped from the system during the procedure for recovering gases.
Table 1. Properties of the sample coals Gieseler temperatures (oC)
coal C content (wt%, daf.)
MF (log(ddpm)) ST MFT RT
GNY 87.3 2.99 397 456 498 WIT 82.5 0.60 412 432 446
MF=Gieseler maximum fluidity, ST=softening temperature, MFT=maximum fluidity temperature, RT=resolidification temperature Results and Discussion
Structural features of the two coals. Carbon distribution in the coals was evaluated from the NMR data. GNY coal could be characterized by greater amount of aromatic carbon and larger size of aromatic rings compared with WIT coal. On the other hand, oxygen-substituted aromatic carbon was richer in WIT coal than in GNY coal. As for the size of aromatic rings, the average number of aromatic carbons per a cluster was 15 for WIT and 18 for GNY. RICO reaction can give information concerning aliphatic moieties in coal according to the formation of carboxylic acids. Figure 1 shows the distribution of aliphatic monocarboxylic acids, which are derived from alkyl side chains in coal. GNY and WIT coals have rather
similar distribution of alkyl side chains ranging from C1 to C7. However, as the carbon number increases, WIT coal has a tendency to have longer alkyl side chains than GNY coal. The distribution of dicarboxylic acids, which correspond to the alkylene bridge structure, also indicated similar results. These structural differences should lead to the differences in themoplastic properties of the coals.
-5
-4
-3
-2
-1
0
1
0 5 10 15 20 25Carbon number of alkyl group in RCOOH
Figure 1. The distribution of aliphatic monocarboxylic acid (RCOOH) obtained from RICO reaction products of GNY and WIT coals.
Heat treatment of the coals. In order to observe thermal behavior of the coals concerning the formation of volatile materials, the coal samples were heat treated under inert atmosphere. The target temperatures for the heat treatments were softening temperature and resolidification temperature, which are shown in Table 1. Table 2 summarized the yields of tar fraction during the heat treatment. The results strongly indicated that WIT coal tended to be pyrolyzed earlier than GNY coal. The fact that WIT coal is rich in aliphatic structure would lead to this tendency. GNY keeps a greater amount of tar in the plastic range (the temperature range between ST and RT), the tar acting as metaplast at the plastic state. It can be concluded that an appropriate size of aromatic rings and the presence of metaplast materials promote the plasticity of coal.
Table 2. The yields of tar after heat treatment of the coals tar yield (wt%) in the heat treatment at coal softening temp. resolidification temp.
GNY 1.6 6.0 WIT 6.0 8.0
softening and resolidification temperatures were shown in Table 1. Conclusions
Based on the chemical structural data, the differences between a strongly coking coal and a slightly coking coal were estimated. Clear structural differences, the distribution of aliphatic chains and bridges and the size of aromatic rings, were observed.
Acknowledgement. This work was partially supported by a Grant-in-aid provided by the Iron and Steel Institute of Japan. References (1) For example, Fitzgerald, D. Fuel, 1956, 35, 178. (2) Nomura,M.; Kidena,K.; Hiro,M.; Murata,S. Energy
Fuels,2000,14,904. (3) Artok,L.; Murata,S.; Nomura,M.; Satoh,T. Energy Fuels, 1998,
12, 391.
Prepr. Pap.-Am. Chem. Soc., Div. Fuel Chem. 2003, 48(2), 670
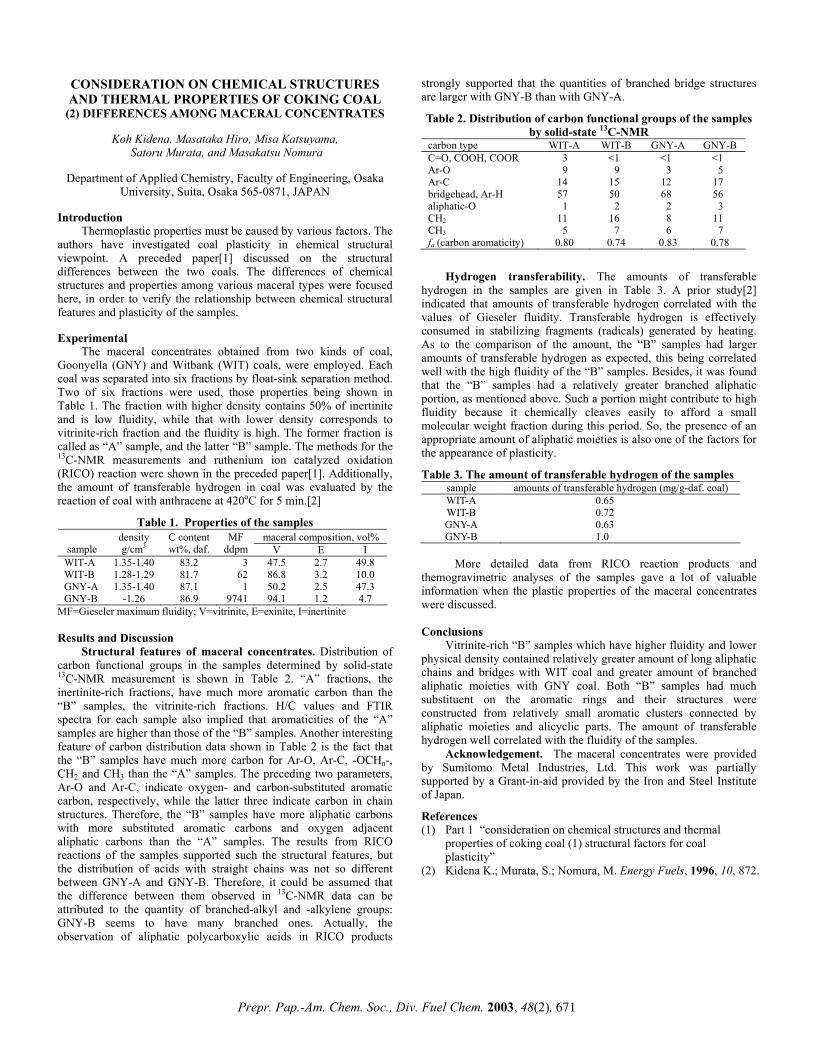
CONSIDERATION ON CHEMICAL STRUCTURES AND THERMAL PROPERTIES OF COKING COAL
(2) DIFFERENCES AMONG MACERAL CONCENTRATES
Koh Kidena, Masataka Hiro, Misa Katsuyama, Satoru Murata, and Masakatsu Nomura
Department of Applied Chemistry, Faculty of Engineering, Osaka
University, Suita, Osaka 565-0871, JAPAN Introduction
Thermoplastic properties must be caused by various factors. The authors have investigated coal plasticity in chemical structural viewpoint. A preceded paper[1] discussed on the structural differences between the two coals. The differences of chemical structures and properties among various maceral types were focused here, in order to verify the relationship between chemical structural features and plasticity of the samples. Experimental
The maceral concentrates obtained from two kinds of coal, Goonyella (GNY) and Witbank (WIT) coals, were employed. Each coal was separated into six fractions by float-sink separation method. Two of six fractions were used, those properties being shown in Table 1. The fraction with higher density contains 50% of inertinite and is low fluidity, while that with lower density corresponds to vitrinite-rich fraction and the fluidity is high. The former fraction is called as “A” sample, and the latter “B” sample. The methods for the 13C-NMR measurements and ruthenium ion catalyzed oxidation (RICO) reaction were shown in the preceded paper[1]. Additionally, the amount of transferable hydrogen in coal was evaluated by the reaction of coal with anthracene at 420oC for 5 min.[2]
Table 1. Properties of the samples maceral composition, vol%
sample density g/cm3
C content wt%, daf.
MF ddpm V E I
WIT-A 1.35-1.40 83.2 3 47.5 2.7 49.8 WIT-B 1.28-1.29 81.7 62 86.8 3.2 10.0 GNY-A 1.35-1.40 87.1 1 50.2 2.5 47.3 GNY-B -1.26 86.9 9741 94.1 1.2 4.7
MF=Gieseler maximum fluidity; V=vitrinite, E=exinite, I=inertinite Results and Discussion
Structural features of maceral concentrates. Distribution of carbon functional groups in the samples determined by solid-state 13C-NMR measurement is shown in Table 2. “A” fractions, the inertinite-rich fractions, have much more aromatic carbon than the “B” samples, the vitrinite-rich fractions. H/C values and FTIR spectra for each sample also implied that aromaticities of the “A” samples are higher than those of the “B” samples. Another interesting feature of carbon distribution data shown in Table 2 is the fact that the “B” samples have much more carbon for Ar-O, Ar-C, -OCHn-, CH2 and CH3 than the “A” samples. The preceding two parameters, Ar-O and Ar-C, indicate oxygen- and carbon-substituted aromatic carbon, respectively, while the latter three indicate carbon in chain structures. Therefore, the “B” samples have more aliphatic carbons with more substituted aromatic carbons and oxygen adjacent aliphatic carbons than the “A” samples. The results from RICO reactions of the samples supported such the structural features, but the distribution of acids with straight chains was not so different between GNY-A and GNY-B. Therefore, it could be assumed that the difference between them observed in 13C-NMR data can be attributed to the quantity of branched-alkyl and -alkylene groups: GNY-B seems to have many branched ones. Actually, the observation of aliphatic polycarboxylic acids in RICO products
strongly supported that the quantities of branched bridge structures are larger with GNY-B than with GNY-A.
Table 2. Distribution of carbon functional groups of the samples by solid-state 13C-NMR
carbon type WIT-A WIT-B GNY-A GNY-B C=O, COOH, COOR 3 <1 <1 <1 Ar-O 9 9 3 5 Ar-C 14 15 12 17 bridgehead, Ar-H 57 50 68 56 aliphatic-O 1 2 2 3 CH2 11 16 8 11 CH3 5 7 6 7 fa (carbon aromaticity) 0.80 0.74 0.83 0.78
Hydrogen transferability. The amounts of transferable
hydrogen in the samples are given in Table 3. A prior study[2] indicated that amounts of transferable hydrogen correlated with the values of Gieseler fluidity. Transferable hydrogen is effectively consumed in stabilizing fragments (radicals) generated by heating. As to the comparison of the amount, the “B” samples had larger amounts of transferable hydrogen as expected, this being correlated well with the high fluidity of the “B” samples. Besides, it was found that the “B” samples had a relatively greater branched aliphatic portion, as mentioned above. Such a portion might contribute to high fluidity because it chemically cleaves easily to afford a small molecular weight fraction during this period. So, the presence of an appropriate amount of aliphatic moieties is also one of the factors for the appearance of plasticity.
Table 3. The amount of transferable hydrogen of the samples sample amounts of transferable hydrogen (mg/g-daf. coal) WIT-A 0.65 WIT-B 0.72 GNY-A 0.63 GNY-B 1.0
More detailed data from RICO reaction products and themogravimetric analyses of the samples gave a lot of valuable information when the plastic properties of the maceral concentrates were discussed. Conclusions
Vitrinite-rich “B” samples which have higher fluidity and lower physical density contained relatively greater amount of long aliphatic chains and bridges with WIT coal and greater amount of branched aliphatic moieties with GNY coal. Both “B” samples had much substituent on the aromatic rings and their structures were constructed from relatively small aromatic clusters connected by aliphatic moieties and alicyclic parts. The amount of transferable hydrogen well correlated with the fluidity of the samples.
Acknowledgement. The maceral concentrates were provided by Sumitomo Metal Industries, Ltd. This work was partially supported by a Grant-in-aid provided by the Iron and Steel Institute of Japan.
References (1) Part 1 “consideration on chemical structures and thermal
properties of coking coal (1) structural factors for coal plasticity”
(2) Kidena K.; Murata, S.; Nomura, M. Energy Fuels, 1996, 10, 872.
Prepr. Pap.-Am. Chem. Soc., Div. Fuel Chem. 2003, 48(2), 671

PROMOTING EFFECT OF WATER ON COAL HYDROGENATION USING AMMONIUM
TETRATHIOMOLYBDATE AS A DISPERSED CATALYST
Table 1. Elemental Analysis of Coals (%, daf)
Yoshiharu Yoneyama, Kazuaki Tanaka, Noritatsu Tsubaki
Department of Material Science and Life Science, Faculty of
Engimeering, Toyama University, 3190 Gofuku, Toyama 930-8555, Japan
Chunshan Song
Fuel Science, Department of Energy & Geo-Enviromental
Engineering, The Pennsylvania State University a By difference b wt% dry base
Coal C H N Oa Ashb Beulah-Zap 72.9 4.8 1.1 21.2 9.7 Wandoan 73.4 6.4 1.2 14.9 9.9 Taiheiyo 73.4 7.1 1.6 18.1 10.1 Wyodak 75.0 5.4 1.1 18.5 8.8 Illinois #6 77.6 5.0 1.4 16.0 15.4 Pittsburgh #8 83.2 5.3 1.6 9.8 9.3 Yubari 84.0 5.9 2.1 7.9 3.4 Upper Freeport 85.5 4.7 1.6 8.2 13.1
206 Hosler Building, University Park, PA 16802-5000 Results and Discussion
Figure 1 shows the effect of water addition on the conversion of various coals at 350, 375, 400 oC. At 350 oC, the effect of water addition was significant: the conversions of coals except for Yubari and Upper Freeport coal increased dramatically. For example, the conversion of Illinois #6 coal increased from 29.6 to 61 wt%. However, at 375 oC, the promoting effect of water addition was dependent on coal types. For some coals such as
Introduction Water has a promoting effect on hydrogenation of Wyodak coal
using ammonium tetrathiomolybdate (ATTM) as a dispersed MoS2 catalyst.1 The conversion of Wyodak coal increased from 29.5 to 66.5 wt% under hydrogenation conditions using ATTM with water addition at 350 oC. In order to clarify this effect we conducted hydrogenation of model compounds such as 2,2’-dinaphthyl ether or 4-(1-naphthylmethyl)bibenzyl using ATTM with and without water addition.2,3 It was found that the promoting effect of water on coal conversion is principally due to the formation of highly active MoS2 catalyst from ATTM with water addition. However it was also found that water addition promotes the formation of CO2,1 and the conversion of coals and model compounds were the largest at 375 oC. 2,4
0
20
40
60
80
100
71 73 75 77 79 81 83 85 87
ATTM
ATTM+H2O
0
20
40
60
80
100
71 73 75 77 79 81 83 85 87
ATTM
ATTM+H2O
0
20
40
60
80
100
71 73 75 77 79 81 83 85 87
ATTM
ATTM+H2O
Carbon % of coals / wt%
400 oC
375 o C
350 o C
Con
vers
ion
/ wt%
Con
vers
ion
/ wt%
Con
vers
ion
/ wt%
In the present study, in order to clarify the effect of water on coal hydrogenation using ATTM, the hydrogenation of various coals from low rank and high rank coal was carried out. Usually it is considered that coal structures are changed with increasing coal rank: aromatic moieties become larger and the strength of the linkages connecting aromatic moieties becomes stronger. We have already found that water addition promote the cleavage of C-O and C-C linkages under hydrogenation conditions using ATTM.2,3 It is interesting to determine the effectiveness of water addition for the hydrogenation of various rank coals using ATTM. Experimental
Basic properties of coals are listed in Table 1. The coals were dried under vacuum over 24 h before use. ATTM was dispersed as a catalyst precursor onto coal (1 wt% Mo on dmmf basis) by incipient wetness impregnation from its aqueous solution. The impregnated or the raw coal samples were freeze-dried for 6h, and then dried in a vacuum oven at 60 oC for 24 h before use.
For the experiments with added water, the weight ratio of water was kept at 0.46. Hydrogenation was carried out using 2 g of the coal samples with or without added water in a 25 ml tube bomb reactor at 350, 375 and 400 oC for 30 min under an initial hydrogen pressure of 6.9 MPa. All the reactions were carried out without any organic solvents. The products were separated into gases, oil (hexane soluble), asphaltene (toluene soluble), and preasphaltene (tetrahydrofuan soluble). The conversions were calculated by the sum of gases, oil, asphaltene, and preasphaltene yields. The gaseous products were analyzed by GC.
Figure 1. Effect of water addition on catalytic hydrogenation of various coals at 350, 375 and 400 oC for 30 min.
Prepr. Pap.-Am. Chem. Soc., Div. Fuel Chem. 2003, 48(2), 672
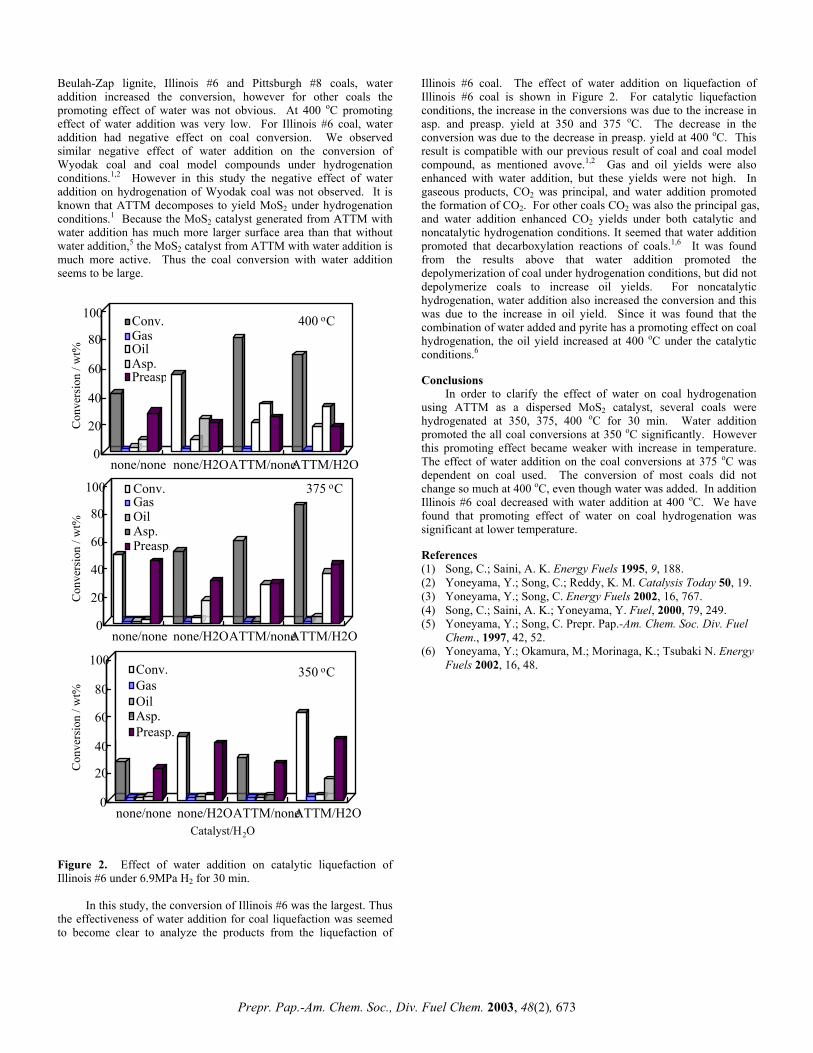
Beulah-Zap lignite, Illinois #6 and Pittsburgh #8 coals, water addition increased the conversion, however for other coals the promoting effect of water was not obvious. At 400 oC promoting effect of water addition was very low. For Illinois #6 coal, water addition had negative effect on coal conversion. We observed similar negative effect of water addition on the conversion of Wyodak coal and coal model compounds under hydrogenation conditions.1,2 However in this study the negative effect of water addition on hydrogenation of Wyodak coal was not observed. It is known that ATTM decomposes to yield MoS2 under hydrogenation conditions.1 Because the MoS2 catalyst generated from ATTM with water addition has much more larger surface area than that without water addition,5 the MoS2 catalyst from ATTM with water addition is much more active. Thus the coal conversion with water addition seems to be large.
Figure 2. Effect of water addition on catalytic liquefaction of Illinois #6 under 6.9MPa H2 for 30 min.
In this study, the conversion of Illinois #6 was the largest. Thus the effectiveness of water addition for coal liquefaction was seemed to become clear to analyze the products from the liquefaction of
Illinois #6 coal. The effect of water addition on liquefaction of Illinois #6 coal is shown in Figure 2. For catalytic liquefaction conditions, the increase in the conversions was due to the increase in asp. and preasp. yield at 350 and 375 oC. The decrease in the conversion was due to the decrease in preasp. yield at 400 oC. This result is compatible with our previous result of coal and coal model compound, as mentioned avove.1,2 Gas and oil yields were also enhanced with water addition, but these yields were not high. In gaseous products, CO2 was principal, and water addition promoted the formation of CO2. For other coals CO2 was also the principal gas, and water addition enhanced CO2 yields under both catalytic and noncatalytic hydrogenation conditions. It seemed that water addition promoted that decarboxylation reactions of coals.1,6 It was found from the results above that water addition promoted the depolymerization of coal under hydrogenation conditions, but did not depolymerize coals to increase oil yields. For noncatalytic hydrogenation, water addition also increased the conversion and this was due to the increase in oil yield. Since it was found that the combination of water added and pyrite has a promoting effect on coal hydrogenation, the oil yield increased at 400 oC under the catalytic conditions.6
0
20
40
60
80
100
none/none none/H2OATTM/noneATTM/H2O
Conv.GasOilAsp.Preasp.
0
20
40
60
80
100
none/none none/H2OATTM/noneATTM/H2O
Conv.GasOilAsp.Preasp.
0
20
40
60
80
100
none/none none/H2OATTM/noneATTM/H2O
Conv.GasOilAsp.Preasp
Catalyst/H2O
400 oC
375 oC
350 oC
Con
vers
ion
/ wt%
Con
vers
ion
/ wt%
Con
vers
ion
/ wt%
Conclusions
In order to clarify the effect of water on coal hydrogenation using ATTM as a dispersed MoS2 catalyst, several coals were hydrogenated at 350, 375, 400 oC for 30 min. Water addition promoted the all coal conversions at 350 oC significantly. However this promoting effect became weaker with increase in temperature. The effect of water addition on the coal conversions at 375 oC was dependent on coal used. The conversion of most coals did not change so much at 400 oC, even though water was added. In addition Illinois #6 coal decreased with water addition at 400 oC. We have found that promoting effect of water on coal hydrogenation was significant at lower temperature. References (1) Song, C.; Saini, A. K. Energy Fuels 1995, 9, 188. (2) Yoneyama, Y.; Song, C.; Reddy, K. M. Catalysis Today 50, 19. (3) Yoneyama, Y.; Song, C. Energy Fuels 2002, 16, 767. (4) Song, C.; Saini, A. K.; Yoneyama, Y. Fuel, 2000, 79, 249. (5) Yoneyama, Y.; Song, C. Prepr. Pap.-Am. Chem. Soc. Div. Fuel
Chem., 1997, 42, 52. (6) Yoneyama, Y.; Okamura, M.; Morinaga, K.; Tsubaki N. Energy
Fuels 2002, 16, 48.
Prepr. Pap.-Am. Chem. Soc., Div. Fuel Chem. 2003, 48(2), 673

LOW TEMPERATURE OXIDATION OF COAL –EVALUATION OF TRANSFERABLE HYDROGEN
Koh Kidena, Masanori Murakami, Satoru Murata,
and Masakatsu Nomura
Department of Applied Chemistry, Faculty of Engineering, Osaka University, Suita, Osaka 565-0871, JAPAN
Introduction
Oxidation of coal is known to affect coal reactivity in liquefaction or carbonization[1]. Even at temperature lower than 100oC, oxidation gives serious effects as seen in weathering phenomena. In general, it is considered that oxidation induces chemical structural changes such as the conversion of methylene carbon into carbonyl or carboxyl group. Such changes were supported by various sources of analytical results, mainly FT-IR spectra. If the structural changes could be clarified qualitatively and quantitatively, the authors could consider the amount of transferable hydrogen with the assumption that transferable hydrogen would be lost easily during oxidation.
The authors reported[2] the reaction of coal with polynuclear aromatic hydrocarbon compounds as a measure to evaluate the amount of transferable hydrogen, which was another access of mobile hydrogen, by referring to the previous report by Yokono and Sanada et al.[3]. Although the values derived from this method could indicate the hydrogen donatability under thermal conditions, it seems not to give the intrinsic amount of mobile hydrogen since the reaction of coal with polynuclear aromatic hydrocarbon was performed at high temperature such as 420oC. Various types of complex reactions are expected during the heating to such the high temperature. In order to obtain the information on mobile hydrogen or transferable hydrogen, what sorts of reactions occurred on active sites should be clarified as possible as one can. This paper focused on the low temperature oxidation of coal. The detailed observation of oxidation reaction could be a plausible method for evaluating reactive hydrogen in coal molecule.
Table 1. Properties of the sample coals Ash VM FC
Coal C content wt%, daf. H/C
wt%, db. Luscar (LS) 88.3 0.63 9.5 23.5 67.0
Goonyella (GO) 88.1 0.69 9.8 23.4 66.8 Pittstone-MV
(PM) 85.7 0.77 7.3 34.3 58.4
Workworth (WW) 84.7 0.84 13.8 34.2 52.0 Witbank (WB) 82.5 0.72 8.0 32.9 59.1 K-Prima (KP) 81.2 0.87 3.8 43.4 52.8
Experimental
Six coal samples of bituminous range with variety of carbon content were used. These coals were supplied by the Iron and Steel Institute, Japan, and originally mined at various sites. Table 1 lists the sample coals used in this study. Oxidation treatment of pulverized sample was performed at 100-200oC under the flow of pure oxygen in a heating chamber that was installed in FT-IR spectrometer, and in an electric furnace of a themobalance, respectively. These experiments allow us to accomplish in-situ monitoring of both diffuse reflectance FT-IR spectra and sample weight.
The oxidized coal samples were separately prepared in an electric furnace under the flow of pure oxygen at determined temperature. Chemical analyses of oxygen functional groups such as
hydroxyl and carboxyl groups were performed with conventional titration methods on the oxidized samples. Results and Discussion
In-situ FT-IR measurement during oxidation. Low temperature oxidation of coals was performed at 100-200oC for 3 hours. As is generally known, in-situ measurement has a great advantage for the quantitative analysis of the changes during any treatments. Peaks at 1674-1759 cm-1 and 2920-2950 cm-1, which are assigned as C=O stretching and aliphatic C-H stretching vibrations, respectively, were focused on since they must change during oxidation treatment. In order to give the quantitative discussion, the obtained spectra were converted with Kubelka-Munk function, which is available to the IR spectra with diffuse reflectance method. Since the changes in C-H peak were small, the increment of carbonyl peak during oxidation treatment was evaluated by the peak heights on the basis of those in untreated coal. The results at various temperatures for Goonyella coal were shown in Figure 1. This figure showed that the oxidation rate, slope in this figure, declined with time. The authors are assuming that reactive methylene groups would react preferentially against oxidation when the rate was relatively high. Such the active ones could be converted into carbonyl group in the beginning of the treatment or even at low temperature. In this paper, the amount of hydrogen at active methylene groups was evaluated by the results at 140oC as discussed below.
Time / min
Incr
emen
t of C
=O a
bsor
banc
e / %
180oC
200oC
160oC
140oC120oC
Figure 1. The increment of C=O stretching region in in-situ FT-IR spectra of Goonyella coal during the oxidation treatment.
0
0.5
1
1.5
0 60 120 180Time / min
Wei
ght i
ncre
ase
/ % WB
KP
WWPM
GOLS
Figure 2. Weight increase during the oxidation treatment at 140oC.
Weight increase during oxidation. Weight increase was also observed in the oxidation treatment of the coals at 120oC or higher. Since weight of the sample was constant under argon flow at 100-200oC, the observed weight increase should be originated by oxygen uptake. Weight increase during oxidation treatment depended largely on the temperature. Higher temperature resulted in a greater degree
Prepr. Pap.-Am. Chem. Soc., Div. Fuel Chem. 2003, 48(2), 674

of weight increase. The weight increase of various coals at 140oC was plotted in Figure 2. Apparently, the increment was different from coal to coal. However, as shown in Figure 3, the increment of C=O peak intensity during oxidation treatment at 140oC correlated well with weight increase during similar treatment. Interestingly, this correlation did not depend on the coal type. On the other hand, when the similar plots were made from the data at higher temperature than 140oC, the correlation depended on the coal type. Therefore, rather simple reactions are expected to occur during oxidation at lower temperature such as 140oC up to 3 h.
0
20
40
60
80
100
120
0 0.5 1 1Weight increase / %
Incr
emen
t of C
=O a
bsor
banc
e / %
.5
Figure 3. Correlation between the increment of C=O stretching peak intensity and weight increase during the course of oxidation treatment at 140oC for 3 h.
-0.02
0
0.02
0.04
0.06
0.08
wei
ght i
ncre
ase
(g/g
-coa
l)
KP WB PM GO LS
difference(C=O)
COOH
OH
Figure 4. The increment of oxygen functional groups in regard to weight increase during the oxidation treatment at 200oC.
Functional group analysis of oxidized coal samples. Hydroxyl group and carboxyl group were analyzed according to chemical methods to elucidate chemical structural changes during oxidation. The original coals have minor amount of these functional groups because the sample coals are bituminous coals. At 140oC, the change of functional groups could not be observed quantitatively, while there observed significant changes for the samples treated at 200oC under oxygen. For each coal, both hydroxyl and carboxyl groups were increased by oxidation treatment at 200oC. Carbonyl carbon also must be increased, however, there are no methods to quantify it. Oxygen forms other than hydroxyl and carboxyl groups were carbonyl and ether. There is no need for considering the formation of etheric oxygen during the oxidation treatment, so the increase of the carbonyl group could be calculated by subtracting [hydroxyl and carboxyl] from whole increment of oxygen atoms during oxidation. The increments of the oxygen functional groups during oxidation at 200oC were summarized in Figure 4.
Evaluation of transferable hydrogen. During the oxidation at 140oC, both hydroxyl and carboxyl groups were not changed so that the formation of carbonyl group could be a main candidate for
structural change during oxidation. In order to evaluate the amount of transferable hydrogen, the authors assumed rather simple reaction at this temperature: active methylene groups are converted into carbonyl groups such as quinone structure via peroxy type intermediate. As the active sites with higher reactivity, partially hydrogenated polyaromatic hydrocarbon structure could be proposed instead of simple methylene group in diarylmethane. In this reaction, the formation of carbonyl group gave 8 units of increase per 1 unit of decrease of molecular weight (CH2 -> C=O). One of two hydrogen atoms on methylene carbon could act as mobile hydrogen so that one hydrogen should be counted for one methylene group. Therefore, the amount of transferable hydrogen could be calculated as [weight increase]/7/2, where weight increase should be corrected with ash content to give the values on dry ash free basis. Thus, the amount of transferable hydrogen was evaluated for each coal, then, the results were compared with the similar values obtained by the other reactions: the reaction with anthracene at 420oC for 5 min in a sealed tube[2], and the one with sulfur at 180oC for 24 h in dichlorobenzene[4].
Data at 200oC were also applied for evaluating the amount of transferable hydrogen with several assumptions of structural changes during oxidation treatment.
0.0
0.5
1.0
1.5
2.0
2.5
80 82 84 86 88 90Carbon content / wt%, daf.
Figure 5. The amount of transferable hydrogen evaluated by weight increase during oxidation at 140oC for 3 h (square), by the reaction with anthracene (circle), and by the reaction with sulfur (triangle). Conclusions
Low temperature oxidation of coal was performed under the flow of pure oxygen. The spectral and weight changes during the oxidation treatment were monitored by FT-IR and thermobalance, respectively. Besides, the oxidized samples were analyzed by chemical titration methods to observe the increase of oxygen functional groups. Based on these data, the amounts of transferable hydrogen were evaluated with the assumption of reactions during the oxidation treatment. The results were significantly different from the values obtained by other methods: the reaction with anthracene, or the reaction with sulfur.
Acknowledgement. Coal samples employed in this study were provided by the Iron and Steel Institute, Japan (ISIJ). A part of this work was performed with assistance of ISIJ. The authors thank ISIJ for useful discussion. References (1) For example, Neavel, R. C. Fuel, 1976, 55, 237; Crelling, J. C; Schrader,
R. H.; Benedict, L. G., Fuel 1979, 58, 542. (2) Kidena, K.; Murata, S.; Nomura, M. Energy Fuels 1996, 10, 872. (3) Yokono, T.; March, H.; Yokono, M. Fuel, 1981, 60, 607.; Yokono, T.;
Takahashi, N.; Sanada, Y. Energy Fuels, 1987, 1, 360. (4) Larsen, J. W.; Azik, M.; Lapucha, A.; Li, S.; Kidena, K.; Nomura, M.
Energy Fuels, 2001, 15, 801.
Prepr. Pap.-Am. Chem. Soc., Div. Fuel Chem. 2003, 48(2), 675

NEW, COMPUTER-DISCOVERED PATHWAYS FOR METHANE AND ETHANE PYROLYSIS
The cyclopentadiene product can dissociate to cause chain branching once again. With these reactions Dean provided the first plausible explanation for the autocatalytic upturn measured by Chen et al.
David M. Matheua, Jeffrey M. Grendab, Mark Saeysc, William H.
Green, Jr.d However, recent experimental and theoretical data on the enthalpy and entropy of formation for cyclopentadienyl5;6 indicate that reactions (1)-(3) alone are not sufficient to explain autocatalytic behavior. Dean used a cyclopentadienyl enthalpy of formation close to the 1982 value of McMillen and Golden (∆Hf(298) = 242 kJ/mol) 7, whereas more recent values from various research groups are about 18 kJ/mol higher (clustered around 260 kJ/mol). With the new thermochemical parameters for cyclopentadienyl, reaction (2) no longer proceeds rapidly enough to drive autocatalysis to the extent observed. Figure 1 below shows how the predictions of Dean’s 1990 mechanism change when more recent data for cyclopentadienyl radical are used. That mechanism is now clearly unable to explain the strong autocatalysis in methane pyrolysis, and a new mechanism is needed.
aNational Institute of Standards and Technology Div. 8380
Gaithersburg, MD 20899 bExxonMobil Research and Engineering
Annandale, NJ 08801 cUniversiteit Gent, Petrochemical Technology Lab
Ghent, Belgium, B-9000 dDept. of Chemical Engineering, Massachusetts Institute of
Technology Cambridge, MA 02139
Introduction
Our further understanding of fuel-rich combustion and oxidation processes (as well as process improvement in the multi-billion-dollar light hydrocarbon cracking industry) depends in part on the development of accurate, detailed chemical kinetic mechanisms for hydrocarbon pyrolysis. These models can be large, with thousands of reactions and species, reflecting the real complexity of the gas-phase chemistry. Unfortunately, such complexity makes by-hand construction of pyrolysis mechanisms exceedingly difficult – the building of mechanisms by-hand is especially prone to the inadvertent omission of important chemical pathways, and the inclusion of unimportant ones. As a step toward systematically-developed, elementary-step-based alkane pyrolysis mechanisms for arbitrary conditions, this work examines methane pyrolysis, using a new software algorithm to construct an appropriate mechanism automatically. A preliminary examination of ethane pyrolysis, using the same tool, is also presented.
0 500 1000 1500 2000 2500 30000.0
0.5
1.0
1.5
2.0
2.5
3.0
3.5
4.0
Chen, Back and Back Data Original AMD Mech. Updated AMD Mech.
C2H
6 M
ole
Frac
tion
(x 1
04 )
Time (sec) Figure 1. Attempts to explain autocatalysis in methane pyrolysis at 1038 K and 0.58 atm for very low conversions of methane. Open symbols represents experimental data sets from Chen and coworkers. The dotted line represents the prediction of the mechanism of Dean in 1990. The solid line illustrates the Dean mechanism once again, but this time with updated kinetic parameters, most importantly improved thermodynamic data for cyclopentadienyl radical.
Autocatalysis in Methane Pyrolysis. Methane pyrolysis has been extensively studied for many decades, both for its potential to convert methane to more valuable hydrocarbons, and its importance within larger combustion and pyrolysis processes. Beginning in the 1970’s, Chen and coworkers performed numerous experiments on methane pyrolysis at lower temperatures and moderate pressures (below 1100 K and 0.5-1.0 atm) 1-3, and discovered a sharp autocatalysis at very low methane conversion (< 1%), which neither surface reactions nor the then-current gas-phase chemical kinetics models could account for. Indeed, they found autocatalysis a general but inexplicable feature of lower-temperature (< 1100 K) methane pyrolysis. This system’s autocatalytic behavior defied explanation until the 1990 work of Dean4.
Minor-Product Yields in Ethane Pyrolysis. Due to its
industrial importance, ethane pyrolysis has been studied extensively. Most ethane cracking models used in industry are proprietary, and employ extensive parameter fitting, lumping, and tuning that allow optimization of industrial ethane cracking. These models also assume high-pressure-limit conditions for almost all reactions. Such models are extremely useful to chemical engineers, but further understanding of ethane pyrolysis under industrial conditions may need explicit, elementary-step-based mechanisms that incorporate pressure-dependence.
Dean proposed the importance of cyclopentadiene, formed via the pressure-dependent pathways of Equation (1):
+ + H (1) Cyclopentadiene, once formed, may function as a chain-
brancher by dissociating into the resonantly stabilized cyclopentadienyl radical, and a hydrogen atom:
Computational Method: Mechanism Generation with Integrated Pressure-Dependence
This work uses a new software algorithm, called “XMG-PDep”, to systematically construct the appropriate reaction mechanisms for methane and ethane pyrolysis, “from scratch”, for a specified temperature, pressure, and set of initial species concentrations8;9. A full description of this tool can be found in Matheu8.
+ H (2)
Both the cyclopentadienyl radical and the hydrogen atom
abstract hydrogens from CH4 under the experimental conditions:
Results for Methane and Ethane Pyrolysis Figure 2 below shows the generated model’s prediction of
ethane concentration with the experimental data of Chen, Back, and Back1-3. The autocatalytic upturn in ethane concentration is clearly captured; no mechanism parameters were manipulated or adjusted to
+ CH4 + CH3
(3)
Prepr. Pap.-Am. Chem. Soc., Div. Fuel Chem. 2003, 48(2), 676

fit any data. A CHEMKIN-compatible version of the mechanism is available from the authors.
0 500 1000 1500 2000 2500
0.0
1.0
2.0
3.0
4.0 Chen, Back and Back 1976 (a) Chen, Back and Back 1976 (b) Back and Back 1983 XMG w/P-Dep
C2H
6 M
ole
Frac
tion
(x 1
04 )
Time (sec)
Figure 2. XMG-PDep predicted ethane concentration at 1038 K and 0.58 bar, compared with three data sets from Chen and coworkers.
Radical production analysis in Figure 3 below shows a selection
of the top net-radical-producing reactions – these reactions function as chain-branchers which can give rise to the observed autocatalysis. The dissociation of cyclopentadiene, noted by Dean, is still an important pathway, but a collection of reverse disproportionation reactions are also critical to explaining the autocatalytic behavior in this model. In addition, cyclopentadienyl radical now arises not via allyl addition to acetylene to form cyclopentadiene (1), but by propargyl addition to acetylene to form the radical directly.
500 1000 1500 2000 25000
2
4
Rad
ical
Pro
duct
ion
[mol
/cm
3 -sec
] (x
1012
)
Time (sec)
+ H
+ CH3C + CH4
+ CH3C
+C + C
+ CH3+ CH4
Figure 3. Main radical production routes for autocatalysis in methane pyrolysis. Each curve represents a net rate of radical production, for which the reverse direction has been taken into account.
Preliminary Results for Ethane Pyrolysis. We have found
our generated mechanism to agree well with the high-conversion neat ethane pyrolysis experiments of Glasier and Pacey10, in particular for butadiene and acetylene concentration. In addition, early results suggest that key reactions for the formation of these minor products during industrial ethane pyrolysis are likely to be pressure-dependent, contrary to prevailing understanding. Table 1 presents ratios of the rate constant k(T,P) over the high-pressure-limit rate constant for a dilute ethane pyrolysis example, at 1100 K and 100 bar Ar. Table 1 does not imply industrial ethane pyrolysis, as a whole, is
strongly pressure-dependent, but it suggests that even at very high pressure, incorporation of pressure-dependence could be needed to describe the formation of important minor products like acetylene.
Table 1. Selected Ratios of k/k(inf) at 1100 K and 100 bar Ar,
Dilute Ethane Pyrolysis.
Reaction k/kinf C2H6 → C2H5 + H 0.45 C2H3 → C2H2 + H 0.28 C3H7 → C2H4 + CH3 0.67
Conclusions
We have used a new software tool to build chemical kinetic models for methane and ethane pyrolysis, automatically, with systematic criteria and with full incorporation of pressure-dependent effects. The methane mechanism yields surprising new pathways that can explain the mystery of experimentally-observed, low-conversion autocatalysis. The ethane mechanism suggests that some important pathways will be pressure-dependent, in spite of the common claim that industrial ethane pyrolysis occurs entirely within the high-pressure limit.
Acknowledgement. The authors thank Dr. A. M. Dean for much assistance and participation in this work. This work was financially supported by the Division of Chemical Sciences, Office of Basic Energy Services, Office of Energy Research, U.S. Department of Energy, through grant DE-FG02-98ER14914, as well as the EPA Center for Airborne Organics, and an NSF CAREER award to WHG (CTS-9875335), and a postdoctoral research associateship award to DMM from the National Research Council (U. S.). References (1) Back M. H.; Back, R. A., in Pyrolysis: Theory and Industrial
Practice; Albright, L. F., Crynes, B. L., and Corcoran, W. H., ed.; Academic Press: New York, 1983; pp. 1-24.
(2) Chen, C. J.; Back, M. H.; Back, R. A. Can. J. Chem. 1975, 53, 3580.
(3) Chen, C. J.; Back, M. H.; Back, R. A. Can. J. Chem. 1976, 54, 3175-3184.
(4) Dean, A. M. J. Phys. Chem. 1990, 94, 1432-1439. (5) Kiefer, J. H.; Tranter, R. S.; Wang, H.; Wagner, A. F. Int. J.
Chem. Kin. 2001, 33, 834-845. (6) Roy, K.; Braun-Unkhoff, M.; Frank, P.; Just, Th. Int. J. Chem.
Kin. 2001, 33, 821-833. (7) McMillen, D. F.; Golden, D. M. Ann. Rev. Phys. Chem. 1982,
33, 493-532. (8) Matheu, D. M. Ph.D. Thesis, Massachusetts Institute of
Technology, 2002. (9) Matheu, D. M. , Dean, A. M., Grenda, J. M., and Green, W. H.
Jr. J. Phys. Chem A., submitted for publication. (10) Glasier, G. F.; Pacey, P. D. Carbon 2001, 39, 15-23.
Prepr. Pap.-Am. Chem. Soc., Div. Fuel Chem. 2003, 48(2), 677

THE WATER-GAS-SHIFT REACTION: A REACTION NETWORK ANALYSIS OF THE MICROKINETIC
MODEL
Table 1. A Microkinetic Model for the WGSR s1: H2O + S H2OS s2: CO + S COS s3: CO2S CO2 + S s4: HS + HS H2S + S s5: H2S H2 + S s6: H2OS + S OHS + HS s7: COS + OS CO2S + S s8: COS + OHS HCOOS + S s9: OHS + S OS + HS s10: COS + OHS CO2S + HS s11: HCOOS + S CO2S + HS s12: HCOOS + OS CO2S + OHS s13: H2OS + OS 2OHS
Caitlin Callaghan, Ilie Fishtik and Ravindra Datta
Fuel Cell Center and Department of Chemical Engineering,
Worcester Polytechnic Institute Worcester, MA 01609
Introduction
The De Donder formula that relates the rate of an elementary reaction to its thermodynamic affinity has proved to be useful in the analysis of reaction kinetics and mechanisms. The affinity is considered as the driving force for a chemical reaction, determining both its direction and magnitude. Further, the affinity is a state function and follows the same linear combination rules as chemical reactions in a reaction network. In particular, the affinity of the elementary reactions is linearly related to the affinity of the overall reaction. An alternate form of the De Donder relation for an elementary reaction, given here, provides an insightful approach to the analysis of elementary reactions as well as sequences of series and parallel reaction schemes.
Elementary Reactions
According to the thermodynamic transition state theory (TTST), the rate, or turn-over frequency (TOF), of the forward and reverse reactions are defined as:
r r ρ =
r k ρ ai
−ν ρi
i=1
r
∏ where expo
B Gk Th R
ρρ κ
± ∆= −
k
T
rr
s r ρ =
s k ρ ai
νρi
i =r +1
n
∏ where expo
B Gk Tkh R
ρρ κ
± ∆= −
T
ss
In this work, we present a new rate-affinity formalism for reaction networks and use it to systematically study the microkinetics of the water-gas-shift (WGS) on a copper catalyst [1]. The first step in our analysis is the development of a detailed microkinetic model of WGS reaction comprising 13 elementary reactions. We next utilize a new reaction network analysis in terms of Kirchhoff’s Laws and an alternate form of the De Donder equation. This new approach provides a deeper understanding of the relationship between the rates of the elementary and overall reactions, and allows rational simplification of reaction networks and kinetic analysis.
The ratio of the reverse and forward steps illustrates the interrelation of the forward and reverse reactions through the affinity of the reaction. Thus, the net rate i : s
rρ =
r r ρ 1−
s r ρr r ρ
=
r r ρ 1 −exp −
Aρ
RT
which constitutes the conventional De Donder relation. The degree of reversibility and the direction of the reaction flux are determined by the sign and magnitude of the affinity. The affinity is calculated for each elementary reaction based on the following expression:
1 1
ln ln ln lnqn n
i i o o k k i ii k
A
1i
K PRT
ρρ ρ ρ ρ ρν µ α θ α θ β
= =
− = = − + + +∑ ∑=∑ Microkinetic Model
The mechanism of the WGS reaction is assumed to proceed via a set of elementary reactions (ERs) comprising of active sites on the surface of the catalyst (S), surface intermediates, and terminal species. Our starting point in the development of the microkinetic model is the experimental evidence according to which the WGS reaction normally proceed via the following set of eight surface intermediates: H2OS, COS, CO2S, H2S, HS, OHS, OS, and HCOOS. From these surface species, a plausible set of ERs may be generated using an appropriate chemical reaction generator. The stoichiometry of the ERs is further dictated by the application of the UBI-QEP method used to calculate the energetic characteristics of each of the ERs. The ERs are limited to the three types of reactions for which the UBI-QEP method may be applied:
For Aρ > 0, the net rate is positive, i.e., the reaction proceeds in the forward direction while the reaction proceeds in the reverse direction for Aρ < 0. When Aρ = 0, the net rate rρ = 0. As the affinity approaches zero, the forward and reverse rates approach a common value, the exchange rate, rρ,0. The formal definition of exchange rate is [3]:
rρ,0 ≡∂rρ
∂( Aρ / RT )
Aρ → 0
Furthermore, we assume the linear free energy relation ( )( )
o
o
d G
d Gρ
ρρ
β±∆
=∆
r
1. AB(g) + S ABS 2. AB(g) + S AS + BS
where βρ is a constant, called the symmetry factor, that takes on a value between zero and one[4]. The symmetry factor represents the fractional change of the standard Gibbs free energy of reaction and is frequently assumed to be ½ for elementary reactions [5].
3. AS + BCS ABS + CS The set of ERs selected under the above stoichiometric
constraints is given the Table 1. The UBI-QEP method was applied next to calculate the activation energies and enthalpies of each ER [1]. Further, the pre-exponential factors were estimated using the conventional transition state theory. In accordance with Waugh [2], an immobile transition state without rotation for all of the species is assumed. A pre-exponential factor of 101 Pa-1s-1 results for the adsorption/desorption reactions while 1013 s-1 results for surface reactions. Some of the pre-exponential factors were adjusted slightly to conform to the known WGS thermodynamics.
Application of the linear free energy relation to the rate of an ER yields:
,0 exp exp ( 1)A A
r rRT RT
ρ ρρ ρ ρ ρβ β
= − −
where the exchange rate is ( ) ( ), 0
1r r rρ ρ
ρ ρ ρ
β β−=
s r.
Further, for the special case of βρ = ½, the expression reduces to
Prepr. Pap.-Am. Chem. Soc., Div. Fuel Chem. 2003, 48(2), 678

,02 sinh2A
r rRT
ρρ ρ
=
( ) ( )
1
Nk k
k
rρ ρσ ν=
= ∑
In other words, if an ER is involved in more than one RR, its rate is equal to the sum of its stoiciometric number for the RR times the flux of the kth RR.
For the limiting case when the reaction is in the vicinity of equilibrium (Aρ →0) expansion of the exp function in the locality of zero and truncating after the first term yields:
In the electrical analogy of reaction networks, each ER is viewed as a resistance of value rρ,0
-1. The affinity is considered equivalent to voltage and the RR flux ν(k) is viewed as the current through a branch. Application of electrical theory and Kirchhoff’s Laws to the reaction network gives the following relationship for series and parallel fluxes along a single RR, respectively. For the linear, series case, we see that the effective resistance 1/ν0
(k)
,0
Ar r
RTρ
ρ ρ
≈
which, in the spirit of irreversible thermodynamics, is a linear equation in terms of the driving force [2,6]. For large values of affinity (Aρ →∞), the rates of the ERs can be written as
,0 expA
r rRTρ ρ
ρ ρ
β ≈
( ) 2
( )0 ,
( )1 k
k rρ
ρ
σν
=0
in direct analogy with the overall resistance being a sum of resistances in series. For effective resistances in parallel
Reaction Network Analysis A reaction route (RR) is defined as a linear combination of p
ERs sρ (ρ = 1,2,…,p), [1] ( ),0 0
1
Nk
Tk
ν ν=
= ∑
1
p
RR sρ ρρ
σ=
= ∑ which is analogous to the inverse total resistance being equal to the sum of inverse resistances for a parallel network. where σρ are the stoichiometric numbers chosen so as to eliminate all
the intermediates in the case of an overall RR, or all intermediates except one specified intermediate in the case of an intermediate RR
Table 2. Affinities, Rates, and Exchange Rates for a 13-step
WGSR Microkinetic Model s1
s2
s6 s13
s8
s11
s9
s7
s10
s8
s13
s7
s9
s10
s12
s13
s8
s12
s9
s7
s12
s11
s10
s12
s11
s8
s11
s12
s10
s12
s8
s8
s12
s9
s8
s11
s9
s7
s12
s11
s9
s7
s8
s11
s7
s3
s4
s5
s10
s7
RR
1
RR
2
RR
3
RR
4
RR
15
RR
16
RR
17
RR
5
RR
6
RR
7
RR
8
RR
9
RR
10
RR
11
RR
12
RR
13
RR
14
Figure 1. Reaction network for the 13-step WGSR microkinetic model.
(T = 150oC, Feed: 0.1 H2O, 0.1 CO, 0.8 N2) Step Ar rρ rρ,0 rρ,0
-1 s1 5.25E-08 3.79E-03 6.07E+07 1.65E-08 s2 5.25E-08 3.79E-03 6.07E+07 1.65E-08 s3 1.45E-07 3.79E-03 2.20E+07 4.55E-08 s4 5.23E-04 3.79E-03 6.10E+03 1.64E-04 s5 1.45E-07 3.79E-03 2.20E+07 4.55E-08 s6 1.10E+00 3.79E-03 2.89E+00 3.46E-01 s7 2.89E+00 2.04E-06 5.92E-04 1.69E+03 s8 7.98E+00 1.89E-03 2.00E-01 5.01E+00 s9 5.09E+00 1.58E-08 2.61E-06 3.82E+05 s10 7.98E+00 1.89E-03 2.00E-01 5.01E+00 s11 4.46E-07 1.90E-03 3.58E+06 2.80E-07 s12 -5.09E+00 -2.02E-06 3.33E-04 3.00E+03 s13 -3.99E+00 -2.69E-13 5.66E-11 1.77E+10
Results
The reaction network involving a complete list of RRs [1] is presented in Figure 1. From the affinities, rates and exchange rates of the ERs (Table 2) it may be deduced that the dominating RRs will be found in the left hand set of RRs in Figure 1. This conclusion is based on the magnitudes of the inverse exchange rates for ERs 6 and 13. As can be seen, the resistance (rρ,0
-1) via ER 6 is much smaller than that via ER 13. As a result, the contributions coming from the
(IRR). Here we are concerned only with a system comprising a single overall reaction (OR) and multiple overall RRs. The kth RR is defined by
( ) ( )
1
pk kRR sρ ρ
ρ
σ=
= ∑
where k = 1,2,…,N. Thermodynamics provides the affinity expression for the given OR or IR Table 3. Calculated Fluxes for RR with lower resistance (i.e. s6)
(T = 150oC, Feed: 0.1 H2O, 0.1 CO, 0.8 N2) ( ) ( )
1
pk k
TA Aρ ρρ
σ=
= ∑ RR (ν,o
(k))-1
RR1 5.36E+00 RR2 3.84E+05 RR3 5.36E+00 RR4 1.77E+10 RR15 1.77E+10 RR16 3.85E+05 RR17 4.69E+03
with the affinity of the OR or IR remaining invariant for all RRs. This invariance requires that [8]
( ) ( )
1 1
pNk k
kA r Aρ ρ
ρ
ν= =
=∑ ∑
where ν(k) represents the flux of the reaction through the kth RR. When the definition of affinity is applied, the following results
Prepr. Pap.-Am. Chem. Soc., Div. Fuel Chem. 2003, 48(2), 679

RRs involving the ER 13 are negligible as compared with the contributions coming from the RRs in which the ER 13 is not involved. These are just the RRs on the left hand side in Figure one, i.e., RRs 1, RR3, etc.
These results are in complete agreement with our previous numerical analysis based on the evaluation of individual contributions coming from single RRs (Figure 2).
When the effective resistances of the parallel pathways in the remaining RRs are compared (Table 3) and from the numerical results of Figure 2, it becomes clear that RR1 and RR3 are dominant, except at temperatures above 300oC, when RR2 also contributes. This analysis confirms that the formate and the associative routes are dominant in the WGS reaction, although the redox route contributes at higher temperatures [8].
0
0.2
0.4
0.6
0.8
1
0 100 200 300 400 500 600Temperature (oC)
Con
vers
ion
of C
O
RR2
RR1 & RR3
TotalMechanism
Equilibrium
RR16
RR17
RR4 & RR15
Figure 2. Simulation of CO conversion vs. temperature for Cu(111) along RRs including s6.
Conclusions
The reaction network analysis based on an alternate form of the De Donder relation is a useful tool for reduction, simplification and rationalization of the microkinetic model. This approach also provides an interesting analogy between a reaction and electrical network thus allowing the description of a chemical reaction network in terms of Kirchhoff’s Laws. Application of the proposed formalism to the analysis of the WGS reaction mechanism validated the reduced model developed earlier based solely on a numerical RR analysis [1]. References (1) Fishtik, I.; Datta, R. Surf. Sci., 2002, 512, 229. (2) Waugh, K. C., Catalysis Today, 1999, 53, 161. (3) Wagner, C. Advan. Catal. Relat. Subj. 1970, 21, 323. (4) Bokris, J.; Reddy, A.; Gamboa-Aldeco, M. Modern
Electrochemistry 2A. Fundamentals of Electrodics, 2nd ed.; Kluwer/Academic/Plenum: New York, 2000.
(5) Connors, K. A. Chemical Kinetics. The Study of Reaction Rates in Solution; VCH Publishers: New York, 1990.
(6) Haase, R. Thermodynamics or Irreversible Processes; Dover Publications, Inc.: New York, 1990.
(7) Haase, R. Z. Phys. Chem. Neue Folge, 1982, 132, 1. (8) Shustorovich, E.; Bell, A. Surf. Sci., 1991, 253, 385.
Prepr. Pap.-Am. Chem. Soc., Div. Fuel Chem. 2003, 48(2), 680

ANALYSIS AND KINETIC MODELING IN ULSD HYDROTREATING
C. López-García, M. Roy-Auberger, T. Chapus, F. Baco
Institut Français du Pétrole, CEDI "René Navarre", BP3,
69390 Vernaison, France Introduction
Production of ultra low sulfur diesel (ULSD) is an essential problem for refiners, as this objective requires a comprehensive knowledge in the matter of crude oil reactivity. A kinetic model was developed in order to estimate the most accurate operating conditions necessary to achieve sulfur levels as low as 10 ppm. The quantification of refractory or inhibiting compounds contained in feedstocks and effluents is obtained by accurate analytical methods and taken into account in the kinetic model. This paper presents these results. Experimental
Feed and hydrotreating experiments. Hydrotreating experiments were carried out on a pilot plant unit1 with an upflow fixed bed reactor, loaded with a commercial NiMo/Al2O3 catalyst from Axens. Pressure and temperature ranges were chosen according to standard industrial conditions (320-360°C, 2-9 MPa). Liquid hourly space velocity (LHSV) was varied between 0.5 and 4 h-1. Experiments were performed with several feedstocks from different refinery units: straight run, LCO and mixtures.
Analytical techniques. Feedstocks and effluents were characterized mainly in order to determine the content of aromatics, saturates, nitrogen and sulfur. Sulfur speciation was also carried out. The analysis of aromatics and saturates2 is based on a mass spectrometry analysis. This method allows quantification of 8 aromatic families CnH2n-6,-8,-10…-16,-18 and polyaromatics; saturates are detailed as paraffins, and 2 naphthenic families.
Total sulfur content is determined by X-Fluorescence according the ASTM D2622 method on a PW 2510 from Philips. Total nitrogen content is analyzed by chemiluminescence (IFP internal method). Speciation sulfur analysis was carried out on a GC HP 5890 Series II equipped with a sulfur chemiluminescence detector Sievers model 355 B. GC-SCD has an excellent selectivity, sensitivity and has an equimolar sulfur response. A SPB1 sulfur column from SUPELCO (30 m, 0.32 mm I.D., 4 µm) was used in this study. The GC conditions were as follows: 3 ml/min He as carrier gas; column temperature: 60°C (0 min) to 280°C (40 min) at a rate of 5°C/min with on-column injection. The FID detector: 350 ml/min of air, 31 ml/min of H2. Burner: 800°C, 4 ml/min of air, 97 ml/min H2. Reaction cell: ~8 torr. Ozone generator: 60 ml/min at 60 psig and 25°C. The injection volume was 0.5µl of sample diluted to obtain about 200 ppm of total sulfur. Results and Discussion
Analysis. It is well known that the dibenzothiophene family (DBT's) contains the most refractory sulfur compounds in diesel cuts.3,4 Relative reactivities reported in literature indicate that the refractory nature increases when alkyl substituents are adjacent to the sulfur atom. Hence, reactivity to hydrodesulfurization (HDS) is as follows: DBT > 4-methyldibenzothiophene > 4,6-dimethyldibenzothiophene. The refractory nature of 4,6-dialkylDBT’s is due to steric hindrance (two alkyl groups block access of hydrogen to the sulfur atoms) and/or electronic effects.5
In order to improve the detailed kinetic study of hydrotreating of sulfur compounds, a GC-SCD technique was used to develop a
detailed identification of DBT compounds and their quantification. Identification work is comprehensively described elsewhere.6 Quantification accuracy has been evaluated with addition of thiophene as internal standard (99.1% purity, Sigma Aldrich) and a LCO doping with DBT, 4-methylDBT and 4,6-dimethylDBT (4,6-DiMeDBT). Additionally, an injection of a weighed thiophene, benzothiophene and dibenzothiophene (Sigma Aldrich) mixture was systematically analyzed in the beginning, halfway and at the end of a series of analysis in order to verify the quantitative results.
The sulfur content (%w/w) of the samples was in the range of 0.03% to 2.6% in feedstocks and 0.0005% to 0.1% in hydrotreated products. Figure 1 shows an example the chromatogram obtained for a LCO gasoil and its effluent at 99.4 % HDS. The LCO feed is constituted of benzothiophenes and dibenzothiophenes; the product contains only some dibenzothiophenes. The analysis method allows for the identification of 32 alkyl-dibenzothiophene compounds among which various 4,6-alkylDBT’s (such as 4,6-DiMeDBT, 4-methyl, 6-ethylDBT, 2,4,6-TrimethylDBT, 1,4,6-TrimethylDBT, 4,6-diethylDBT and 3,4,6-TrimethylDBT) corresponding to the most refractory sulfur compounds as identified in Figure 1.
Figure 1. Sulfur profile of a 0.33% S feedstock and its 0.0021% S hydrotreated product.
25 30 35 40 45 50 (min)
arbitrary units
Feedstock
Product
4-M
e,6-I
sobuty
lDBT DBT
4-M
e,6-E
thyl
DBT
2,4
,6-T
riM
eDBT
4,6
-DiM
eDBT 4
-MeD
BT
1,4
,6-T
riM
eDBT
4,6
-Die
thyl
DBT+
3,4
,6Tri
MeD
BT
550 500 450 400 350 300 250 200 150
Reactivity of refractory sulfur species. Achieving ultra low
sulfur levels implies converting the most refractory compounds contained in diesel cuts such as 4,6-dimethydibenzothiophene and other substituted DBT with alkyl groups in 4,6 position. Moreover, this refractory nature is associated to a preferred reaction pathway.4 DBT compounds substituted in 4,6 position are preferably hydrogenated, whereas non-substituted DBT preferably undergo direct desulfurization (Figure 2).
S
S
SH
Hydrogenolysis pathway
Hydrogenation pathway
Figure 2. Preferred reaction pathway for 4,6-DiMeDBT
The quantification of each DBT compound was determined by GC-SCD analysis of feedstocks and products. The reactivity of DBT compounds has been calculated assuming a first order kinetic law. Ten feedstocks and their hydrotreated products were used for this purpose. Results for a LCO at 3 different LSHV are presented in Figure 3.
Prepr. Pap.-Am. Chem. Soc., Div. Fuel Chem. 2003, 48(2), 681

0
1
2
3
4
5
6
7
8
9
0 0.1 0.2 0.3 0.4 0.5 0.6 0.7 0.8 0.9 1t(h)
Ln(C
0/Ct)
1: highest reactivity group2: intermediate reactivity group3: lowest reactivity group
Table 2. Lumps considered in the kinetic model Name Description DBT1 DBT group 1 easy to convert by direct desulfurization
DBT2 DBT group 2 with intermediate reactivity, can react through direct HDS or hydrogenation
DBT3 DBT group 3 containing the most refractory compounds, reacting through hydrogenation
S very reactive sulfur compounds directly converted in H2S TRI+ polyaromatics DI1 conjugated diaromatics DI2 non conjugated diaromatics
MONO monoaromatics
N nitrogen group 1 containing very reactive nitrogen compounds directly converted in NH3
CARB nitrogen group 2 as carbazoles reacting by hydrogenation SAT saturated compounds
Figure 5 presents a parity plot between results from pilot plant
experimentation and from reactor simulation, of straight run gasoil, LCO gasoil and mixtures. For all feedstocks, model prediction is close to experimental results.
Figure 3. DBT’s 1st order kinetic constants for a LCO feedstock.
This study allowed to distinguish 3 reactivity groups: - DBT’s easy to convert, with a reactivity close to the unsubstituted
DBT.
0
50
100
150
200
250
300
350
400
0 50 100 150 200 250 300 350 400
Experimental sulfur (ppm)
Sulfu
r fro
m m
odel
(ppm
)
STRAIGHT RUN
LCO
MIXTURE
- An intermediate reactivity group with a reactivity similar to 4-MeDBT.
- DBT’s very difficult to convert, with a reactivity close to that of 4,6 dimethylDBT.
Table 1 presents the average ratio kDBT/ki for the 3 groups previously defined; kDBT is the first order constant of DBT, ki is the average first order constant of the considered substituted DBT. These ratios were compared to calculated average values reported by Ma et al.7 and our results are in good agreement with those reported in literature.
Table 1. Ratio kDBT/ki of 1st order rate constants for the 3 groups
Group This work Ma et al.7 1 1.32 1.12 2 4.03 3.03 3 6.92 7.89 Figure 5. Sulfur prediction parity plot for different type of diesels.
Conclusions Kinetic Modeling. With these various results, a Langmuir-
Hinshelwood lumped kinetic model was developed taking into account:
An accurate analysis method for sulfur speciation was developed and allowed to elaborate a kinetic hydrotreating model adapted to ULSD prediction for industrial feedstocks. This model is based on a lumped reaction scheme distinguishing three refractory sulfur families thanks to the identification. The Langmuir-Hinshelwood representation takes into account the inhibiting effect of aromatics and nitrogen species on HDS. A good agreement between most experimental and predicted sulfur content was obtained. The effect of nitrogen species will be subject to further study in order to improve the HDS predictions.
- the differences of reactivities of DBT compounds. - the two reaction pathways for desulfurization: hydrogenation and
direct hydrodesulfurization. - the inhibiting effect of the various compounds in industrial
feedstocks, especially aromatics and nitrogen compounds.
TRI+ DI1 DBT1
DBT2
DBT3MONODI2
SAT CARB
References (1) Burkhardt T., Verstraete J., Galtier P., Kraume M. Chemical
Engineering Science. 2002, 57, 1859-1866. (2) Castex H., Boulet R., Juguin J., Lepinasse A. Revue de l’Institut
Français du Pétrole. 1983, 38(4), 523-532. Figure 4. General kinetic scheme for diesel hydrotreating. (3) Houalla M, Broderick D.H., Sapre A.V., Nag N.K., De Beer V.H.J.,
Gates B.C., Kwart H. Journal of Catalysis. 1980, 61, 523-527. The kinetic scheme presented in Figure 4 is based on lumping of chemical species, as detailed in Table 2. Inhibitor effects are taken into account through competitive reaction of hydrogenation of aromatics and through competitive adsorption of H2S, NH3 and other species on the active sites. Through this model, HDS performances can be predicted for any diesel feedstock (straight-run, LCO and mixtures) taking into account their chemical composition. Aromatic conversion and hydrogen consumption are also predicted.
(4) Whitehurst D.D., Isoda T., Mochida I. Advances in Catalysis. 1998, 42, 345-471.
(5) Meille V., Schulz E., Lemaire M., Vrinat M. Applied Catalysis A: General. 1999, 187, 179-186.
(6) C. López García, M. Becchi, M.F. Grenier-Loustalot, O. Païsse, R. Szymanski. Anal. Chem. 2002, 74, 3849-3857.
(7) Ma X., Sakanishi K., Mochida I. Ind. Eng. Chem. Res. 1994, 33, 218-222.
Prepr. Pap.-Am. Chem. Soc., Div. Fuel Chem. 2003, 48(2), 682
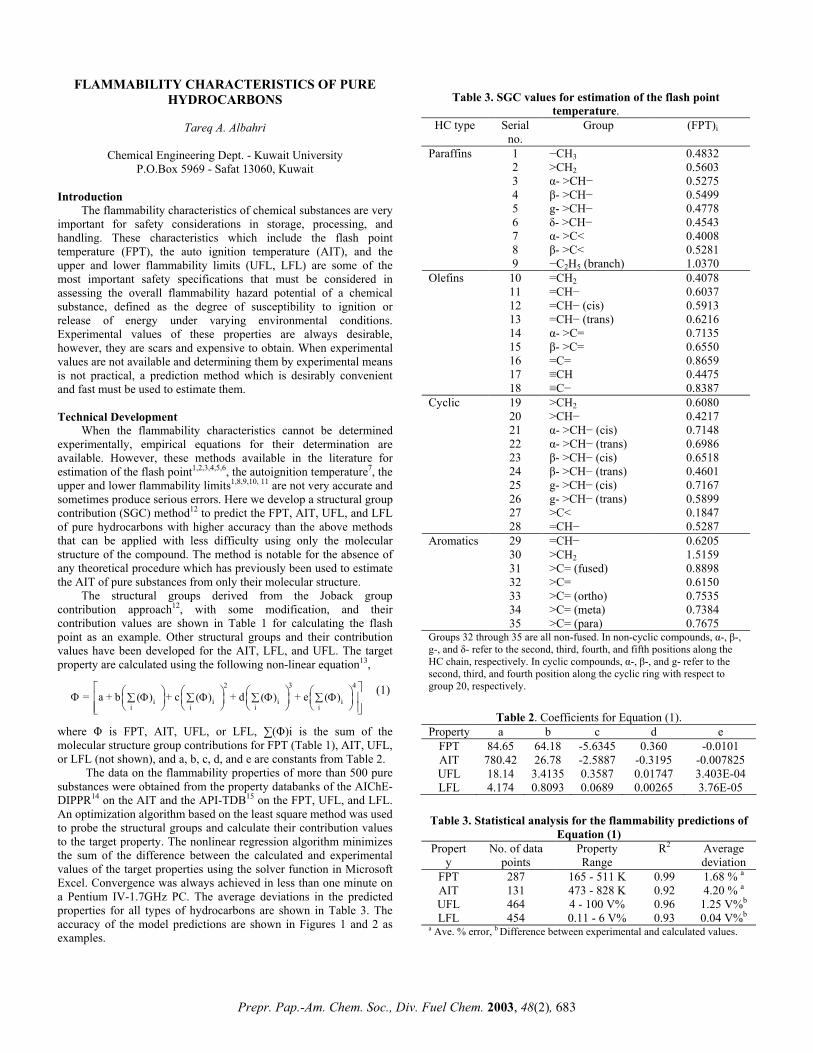
FLAMMABILITY CHARACTERISTICS OF PURE HYDROCARBONS
Tareq A. Albahri
Chemical Engineering Dept. - Kuwait University
P.O.Box 5969 - Safat 13060, Kuwait Introduction
The flammability characteristics of chemical substances are very important for safety considerations in storage, processing, and handling. These characteristics which include the flash point temperature (FPT), the auto ignition temperature (AIT), and the upper and lower flammability limits (UFL, LFL) are some of the most important safety specifications that must be considered in assessing the overall flammability hazard potential of a chemical substance, defined as the degree of susceptibility to ignition or release of energy under varying environmental conditions. Experimental values of these properties are always desirable, however, they are scars and expensive to obtain. When experimental values are not available and determining them by experimental means is not practical, a prediction method which is desirably convenient and fast must be used to estimate them. Technical Development
When the flammability characteristics cannot be determined experimentally, empirical equations for their determination are available. However, these methods available in the literature for estimation of the flash point1,2,3,4,5,6, the autoignition temperature7, the upper and lower flammability limits1,8,9,10,
11 are not very accurate and
sometimes produce serious errors. Here we develop a structural group contribution (SGC) method12 to predict the FPT, AIT, UFL, and LFL of pure hydrocarbons with higher accuracy than the above methods that can be applied with less difficulty using only the molecular structure of the compound. The method is notable for the absence of any theoretical procedure which has previously been used to estimate the AIT of pure substances from only their molecular structure.
The structural groups derived from the Joback group contribution approach12, with some modification, and their contribution values are shown in Table 1 for calculating the flash point as an example. Other structural groups and their contribution values have been developed for the AIT, LFL, and UFL. The target property are calculated using the following non-linear equation13,
Φ (1) 2 3
i i ii i i i
= a + b + c + d + e ( ) ( ) ( ) ( ) Φ Φ Φ Φ∑ ∑ ∑ ∑
4
i
Table 3. SGC values for estimation of the flash point temperature.
HC type Serial no.
Group (FPT)i
1 −CH3 0.4832 2 >CH2 0.5603 3 α- >CH− 0.5275 4 β- >CH− 0.5499 5 g- >CH− 0.4778 6 δ- >CH− 0.4543 7 α- >C< 0.4008 8 β- >C< 0.5281
Paraffins
9 −C2H5 (branch) 1.0370 10 =CH2 0.4078 11 =CH− 0.6037 12 =CH− (cis) 0.5913 13 =CH− (trans) 0.6216 14 α- >C= 0.7135 15 β- >C= 0.6550 16 =C= 0.8659 17 ≡CH 0.4475
Olefins
18 ≡C− 0.8387 19 >CH2 0.6080 20 >CH− 0.4217 21 α- >CH− (cis) 0.7148 22 α- >CH− (trans) 0.6986 23 β- >CH− (cis) 0.6518 24 β- >CH− (trans) 0.4601 25 g- >CH− (cis) 0.7167 26 g- >CH− (trans) 0.5899 27 >C< 0.1847
Cyclic
28 =CH− 0.5287 29 =CH− 0.6205 30 >CH2 1.5159 31 >C= (fused) 0.8898 32 >C= 0.6150 33 >C= (ortho) 0.7535 34 >C= (meta) 0.7384
Aromatics
35 >C= (para) 0.7675 Groups 32 through 35 are all non-fused. In non-cyclic compounds, α-, β-, g-, and δ- refer to the second, third, fourth, and fifth positions along the HC chain, respectively. In cyclic compounds, α-, β-, and g- refer to the second, third, and fourth position along the cyclic ring with respect to group 20, respectively.
Table 2. Coefficients for Equation (1). Property a b c d e
FPT 84.65 64.18 -5.6345 0.360 -0.0101 AIT 780.42 26.78 -2.5887 -0.3195 -0.007825 UFL 18.14 3.4135 0.3587 0.01747 3.403E-04 LFL 4.174 0.8093 0.0689 0.00265 3.76E-05
where Φ is FPT, AIT, UFL, or LFL, ∑(Φ)i is the sum of the molecular structure group contributions for FPT (Table 1), AIT, UFL, or LFL (not shown), and a, b, c, d, and e are constants from Table 2.
The data on the flammability properties of more than 500 pure substances were obtained from the property databanks of the AIChE-DIPPR14 on the AIT and the API-TDB15 on the FPT, UFL, and LFL. An optimization algorithm based on the least square method was used to probe the structural groups and calculate their contribution values to the target property. The nonlinear regression algorithm minimizes the sum of the difference between the calculated and experimental values of the target properties using the solver function in Microsoft Excel. Convergence was always achieved in less than one minute on a Pentium IV-1.7GHz PC. The average deviations in the predicted properties for all types of hydrocarbons are shown in Table 3. The accuracy of the model predictions are shown in Figures 1 and 2 as examples.
Table 3. Statistical analysis for the flammability predictions of Equation (1)
Property
No. of data points
Property Range
R2 Average deviation
FPT 287 165 - 511 K 0.99 1.68 % a AIT 131 473 - 828 K 0.92 4.20 % a UFL 464 4 - 100 V% 0.96 1.25 V%b LFL 454 0.11 - 6 V% 0.93 0.04 V%b
a Ave. % error, b Difference between experimental and calculated values.
Prepr. Pap.-Am. Chem. Soc., Div. Fuel Chem. 2003, 48(2), 683
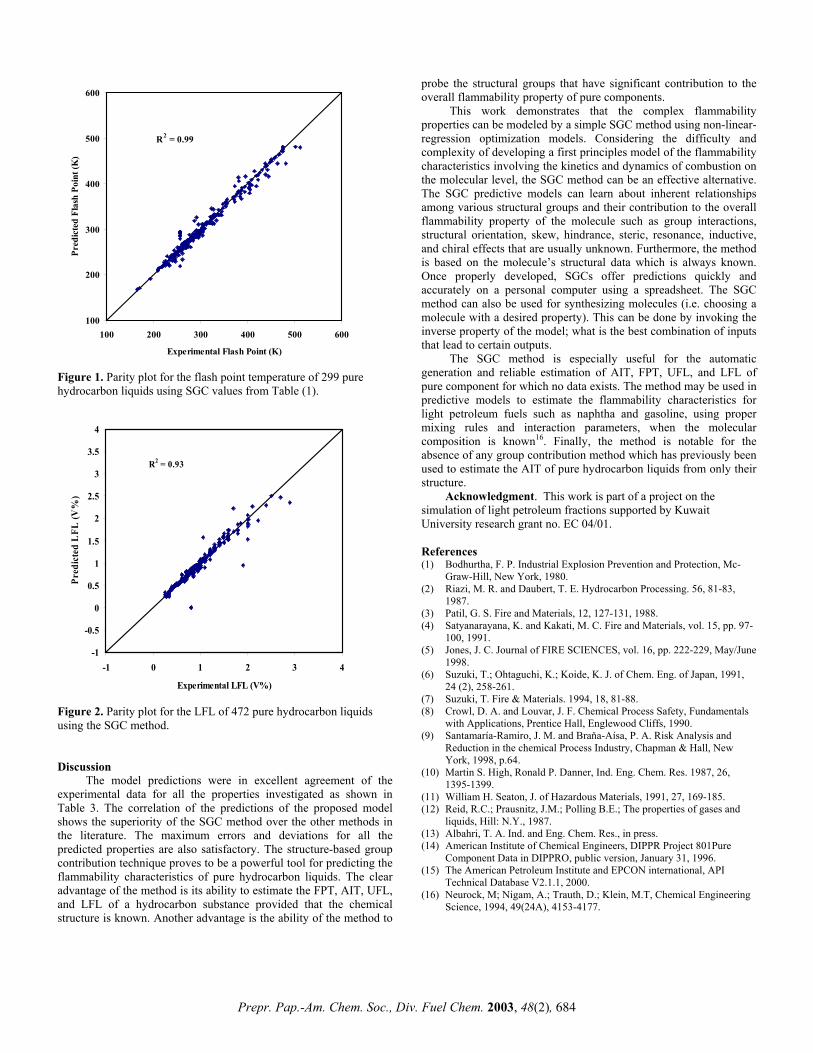
100
200
300
400
500
600
100 200 300 400 500 600
Experimental Flash Point (K)
Pred
icte
d Fl
ash
Poin
t (K
).
R2 = 0.99
Figure 1. Parity plot for the flash point temperature of 299 pure hydrocarbon liquids using SGC values from Table (1).
-1
-0.5
0
0.5
1
1.5
2
2.5
3
3.5
4
-1 0 1 2 3
Experimental LFL (V%)
Pred
icte
d L
FL (V
%)
R2 = 0.93
4
Figure 2. Parity plot for the LFL of 472 pure hydrocarbon liquids using the SGC method. Discussion
The model predictions were in excellent agreement of the experimental data for all the properties investigated as shown in Table 3. The correlation of the predictions of the proposed model shows the superiority of the SGC method over the other methods in the literature. The maximum errors and deviations for all the predicted properties are also satisfactory. The structure-based group contribution technique proves to be a powerful tool for predicting the flammability characteristics of pure hydrocarbon liquids. The clear advantage of the method is its ability to estimate the FPT, AIT, UFL, and LFL of a hydrocarbon substance provided that the chemical structure is known. Another advantage is the ability of the method to
probe the structural groups that have significant contribution to the overall flammability property of pure components.
This work demonstrates that the complex flammability properties can be modeled by a simple SGC method using non-linear-regression optimization models. Considering the difficulty and complexity of developing a first principles model of the flammability characteristics involving the kinetics and dynamics of combustion on the molecular level, the SGC method can be an effective alternative. The SGC predictive models can learn about inherent relationships among various structural groups and their contribution to the overall flammability property of the molecule such as group interactions, structural orientation, skew, hindrance, steric, resonance, inductive, and chiral effects that are usually unknown. Furthermore, the method is based on the molecule’s structural data which is always known. Once properly developed, SGCs offer predictions quickly and accurately on a personal computer using a spreadsheet. The SGC method can also be used for synthesizing molecules (i.e. choosing a molecule with a desired property). This can be done by invoking the inverse property of the model; what is the best combination of inputs that lead to certain outputs.
The SGC method is especially useful for the automatic generation and reliable estimation of AIT, FPT, UFL, and LFL of pure component for which no data exists. The method may be used in predictive models to estimate the flammability characteristics for light petroleum fuels such as naphtha and gasoline, using proper mixing rules and interaction parameters, when the molecular composition is known16. Finally, the method is notable for the absence of any group contribution method which has previously been used to estimate the AIT of pure hydrocarbon liquids from only their structure.
Acknowledgment. This work is part of a project on the simulation of light petroleum fractions supported by Kuwait University research grant no. EC 04/01. References (1) Bodhurtha, F. P. Industrial Explosion Prevention and Protection, Mc-
Graw-Hill, New York, 1980. (2) Riazi, M. R. and Daubert, T. E. Hydrocarbon Processing. 56, 81-83,
1987. (3) Patil, G. S. Fire and Materials, 12, 127-131, 1988. (4) Satyanarayana, K. and Kakati, M. C. Fire and Materials, vol. 15, pp. 97-
100, 1991. (5) Jones, J. C. Journal of FIRE SCIENCES, vol. 16, pp. 222-229, May/June
1998. (6) Suzuki, T.; Ohtaguchi, K.; Koide, K. J. of Chem. Eng. of Japan, 1991,
24 (2), 258-261. (7) Suzuki, T. Fire & Materials. 1994, 18, 81-88. (8) Crowl, D. A. and Louvar, J. F. Chemical Process Safety, Fundamentals
with Applications, Prentice Hall, Englewood Cliffs, 1990. (9) Santamaría-Ramiro, J. M. and Braňa-Aísa, P. A. Risk Analysis and
Reduction in the chemical Process Industry, Chapman & Hall, New York, 1998, p.64.
(10) Martin S. High, Ronald P. Danner, Ind. Eng. Chem. Res. 1987, 26, 1395-1399.
(11) William H. Seaton, J. of Hazardous Materials, 1991, 27, 169-185. (12) Reid, R.C.; Prausnitz, J.M.; Polling B.E.; The properties of gases and
liquids, Hill: N.Y., 1987. (13) Albahri, T. A. Ind. and Eng. Chem. Res., in press. (14) American Institute of Chemical Engineers, DIPPR Project 801Pure
Component Data in DIPPRO, public version, January 31, 1996. (15) The American Petroleum Institute and EPCON international, API
Technical Database V2.1.1, 2000. (16) Neurock, M; Nigam, A.; Trauth, D.; Klein, M.T, Chemical Engineering
Science, 1994, 49(24A), 4153-4177.
Prepr. Pap.-Am. Chem. Soc., Div. Fuel Chem. 2003, 48(2), 684