croatian power system 1 the electric power system - croatia -
TRANSCRIPT
Croatian Power System 1
The Electric Power System
- Croatia -

Croatian Power System 2
Basic facts
Area: 56 542 km2
Population: 4 284 889 (census 2011) Number of electricity consumers: “There are more than
2.3 million electricity customers and/or metering points in Croatia.” (www.hep.hr)
Number of TSOs: 1 Number of DSOs: 1 DSO (21 distribution area) Peak load: 3193 MW Average interruption of electricity (2014): 60.3 min/interruption
2

Croatian Power System 3
Global map of the gridand of its interconnections
3
Interconnectors with: Bosnia and
Hercegovina; Slovenia; Serbia; Hungary.
Croatian Power System 4
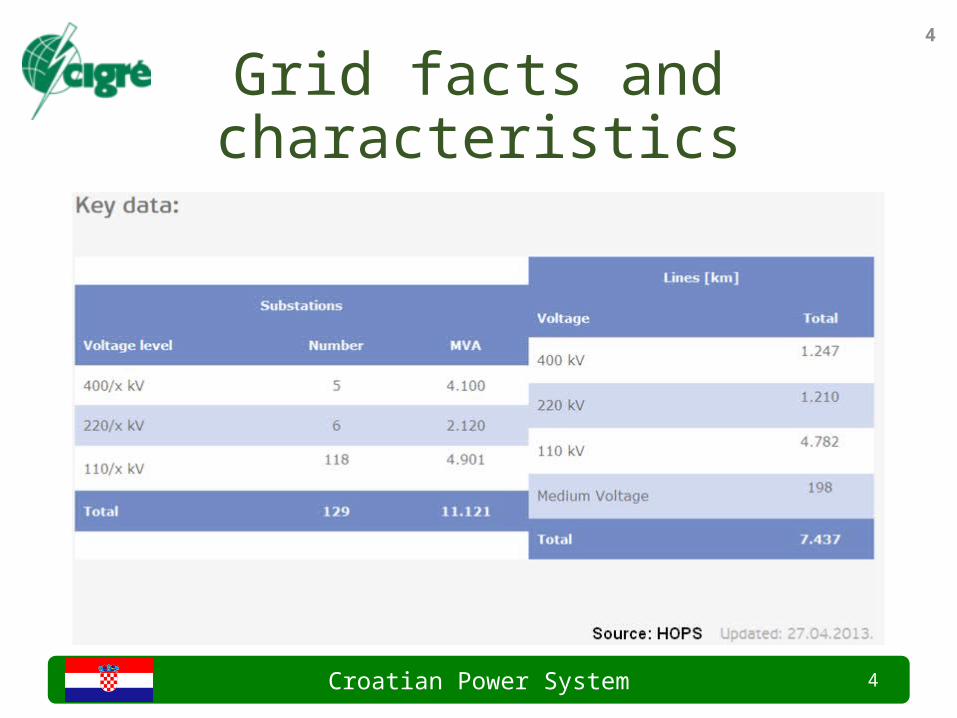
Grid facts and characteristics4
Croatian Power System 5
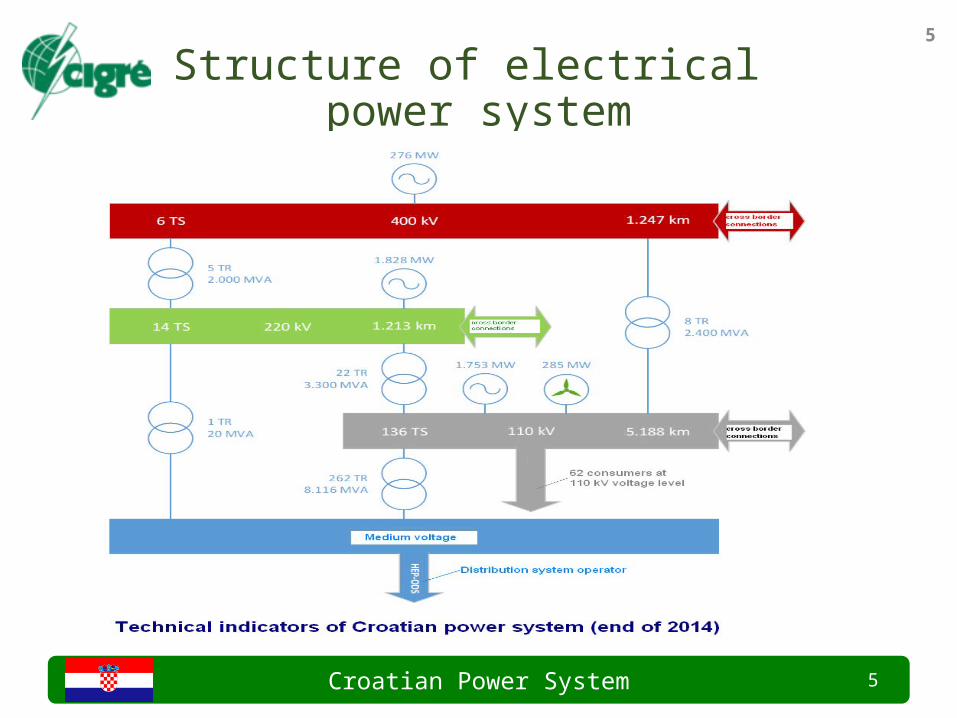
Structure of electrical power system
5
Croatian Power System 6
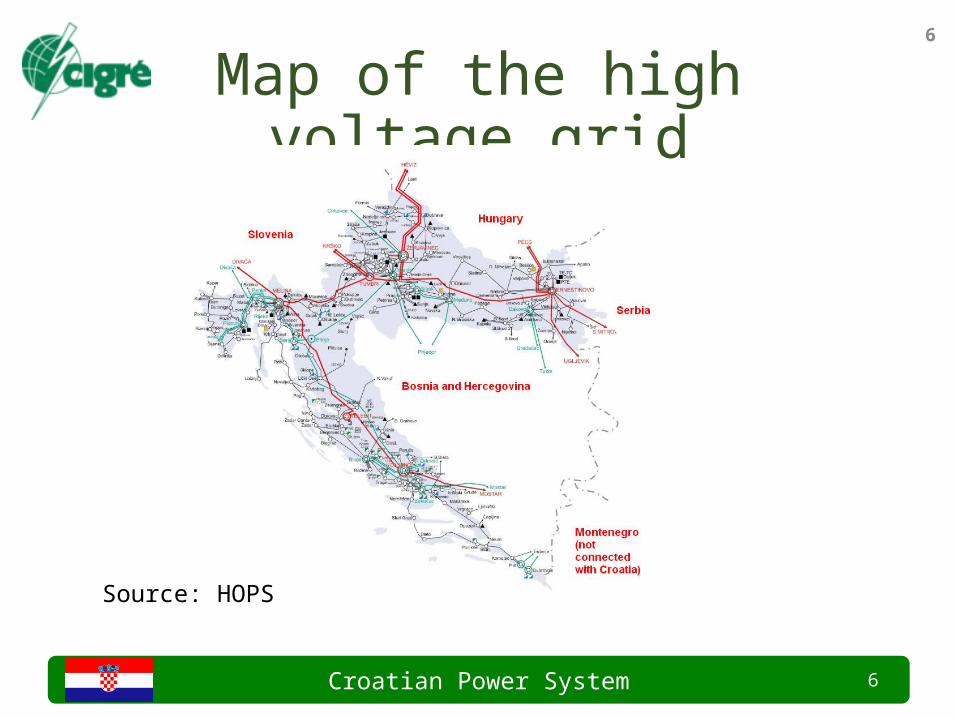
Map of the high voltage grid6
Source: HOPS
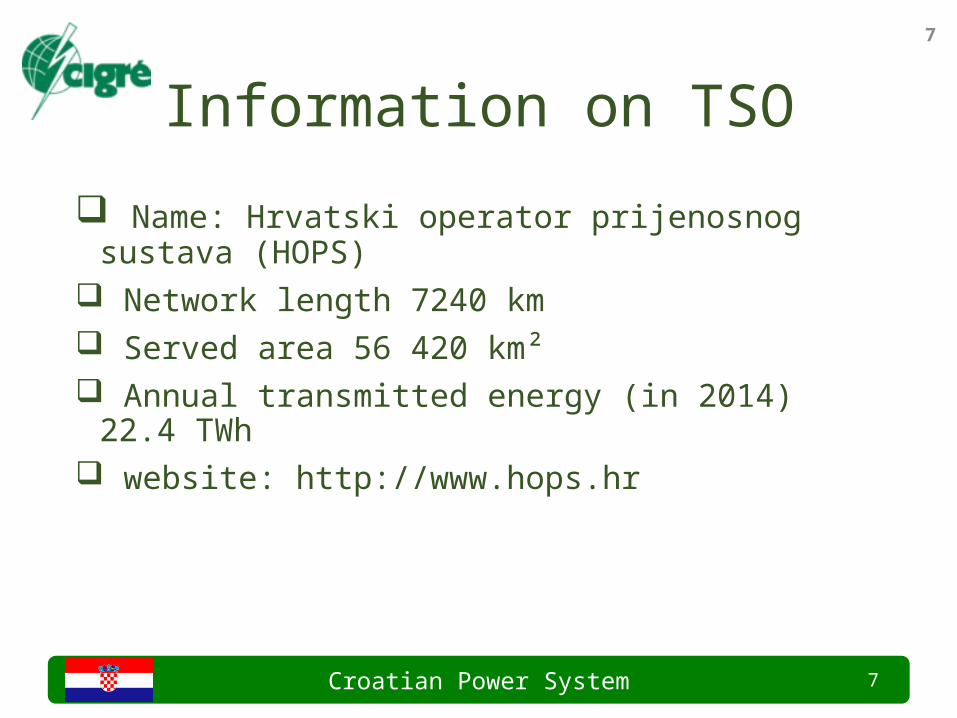
Croatian Power System 7
Information on TSO
Name: Hrvatski operator prijenosnog sustava (HOPS) Network length 7240 km Served area 56 420 km² Annual transmitted energy (in 2014) 22.4 TWh website: http://www.hops.hr
7
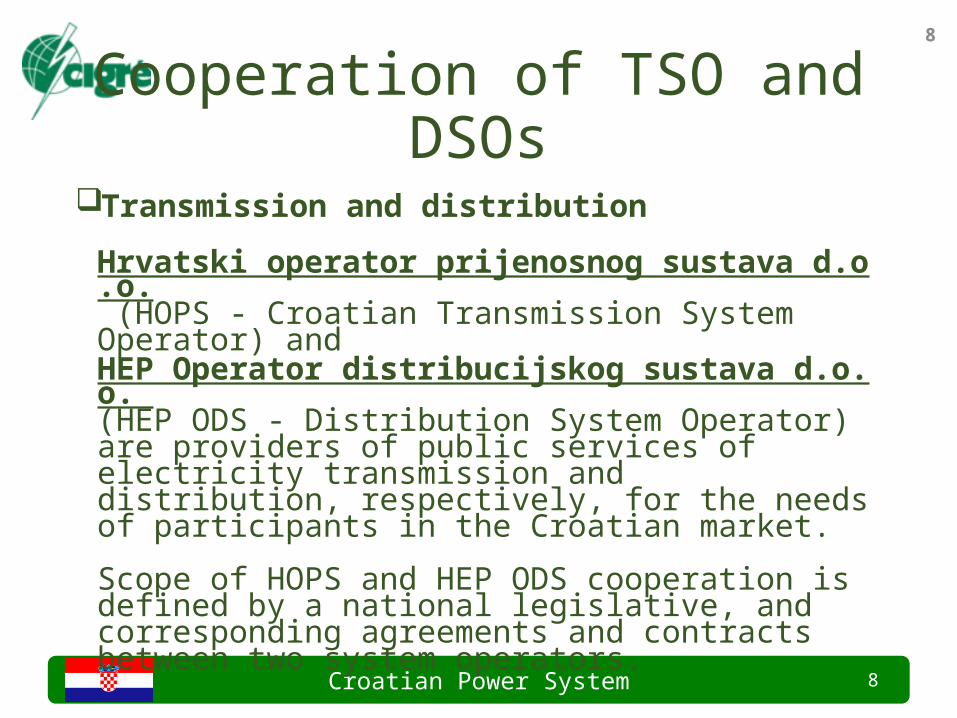
Croatian Power System 8
Cooperation of TSO and DSOsTransmission and distribution
Hrvatski operator prijenosnog sustava d.o.o. (HOPS - Croatian Transmission System Operator) and HEP Operator distribucijskog sustava d.o.o. (HEP ODS - Distribution System Operator) are providers of public services of electricity transmission and distribution, respectively, for the needs of participants in the Croatian market.
Scope of HOPS and HEP ODS cooperation is defined by a national legislative, and corresponding agreements and contracts between two system operators.
8

Croatian Power System 9
Responsibilities of TSO (part 1)9
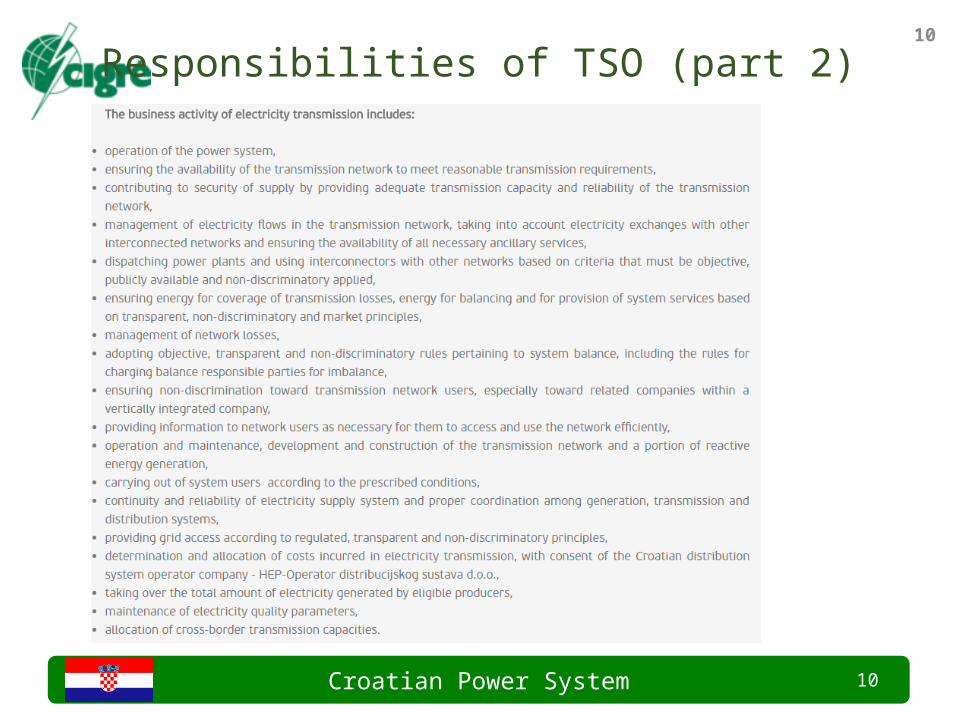
Croatian Power System 10
Responsibilities of TSO (part 2)10
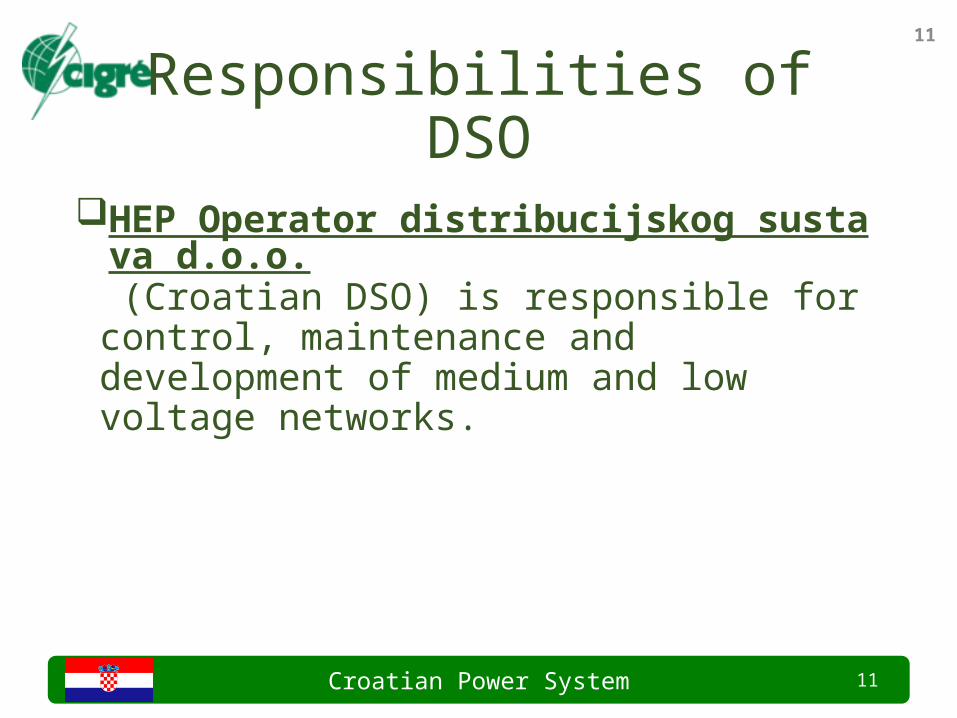
Croatian Power System 11
Responsibilities of DSO11
HEP Operator distribucijskog sustava d.o.o. (Croatian DSO) is responsible for control, maintenance and development of medium and low voltage networks.
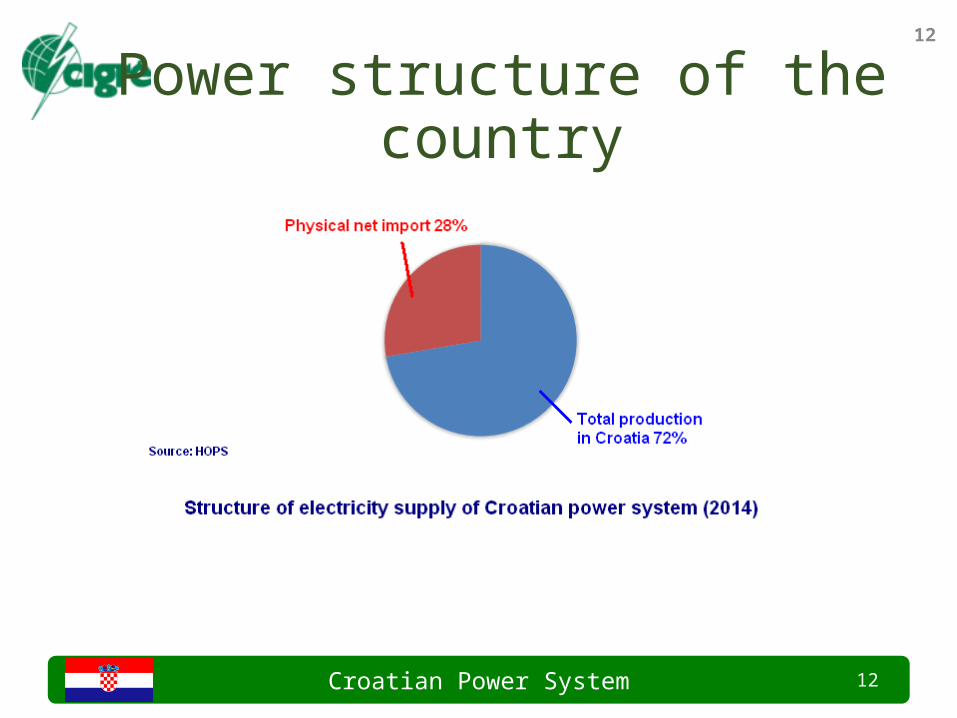
Croatian Power System 12
Power structure of the country12
Croatian Power System 13
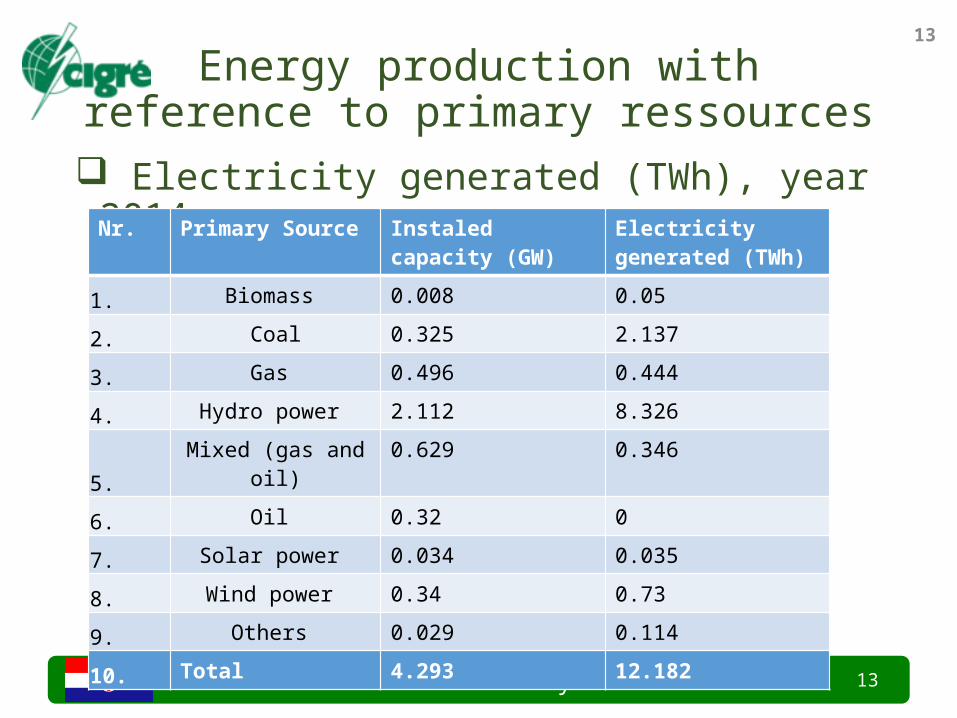
Energy production withreference to primary ressources
Electricity generated (TWh), year 2014
13
Nr. Primary Source Instaled capacity (GW) Electricity generated (TWh)
1. Biomass 0.008 0.05
2. Coal 0.325 2.137
3. Gas 0.496 0.444
4. Hydro power 2.112 8.326
5. Mixed (gas and oil) 0.629 0.346
6. Oil 0.32 0
7. Solar power 0.034 0.035
8. Wind power 0.34 0.73
9. Others 0.029 0.114
10. Total 4.293 12.182

Croatian Power System 14
Comsuption per customer groups14
Electricity consumption classes and indicative peak power for the consumers from rhe category ''Entrepreneurship'' in accordance with EUROSTAT
Nr. Electricity consumption class
Minimal consumption[MWh/year]
Maximal consumption[MWh/year]
Lowest value[kW]
Highest value[kW]
Entrepreneurship - Total values
Consumption (%)
Number (%)
1.Ia _
<205 20 9.7 79.4
2.Ib 20
<50010 350 29.5 19.3
3.Ic 500
<2 000200 1 500 11.6 0.7
4.Id 2 000
<20 000800 10 000 21.7 0.5
5.Ie 20 000
<70 0005 000 25 000 20.7 0.1
6.If 70 000 <=150 000 15 000 50 000 6.8 0.0
Source: HEP-ODS and HOPS
Croatian Power System 15
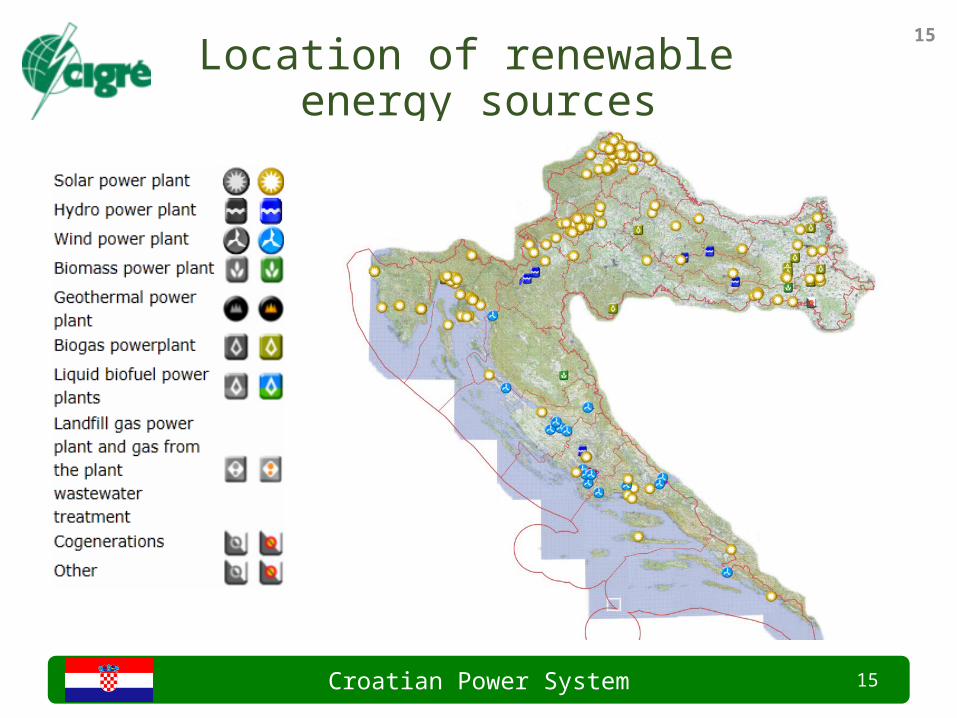
Location of renewable energy sources
15

Croatian Power System 16
Data about renewable energy sources16
Nr. Technology Number of plants
Instaled power (MW)
1. Solar 1022 33,52
2. Small hydro (<= 10 MW) 6 1,48
3. Biomass 4 7,69
4. Biogas 12 12,14
5. Wind 16 339,25
6. Waste gas 2 4,54
7. Cogeneration 5 13,29
8. Total 1067 411,90
Croatian Power System 17
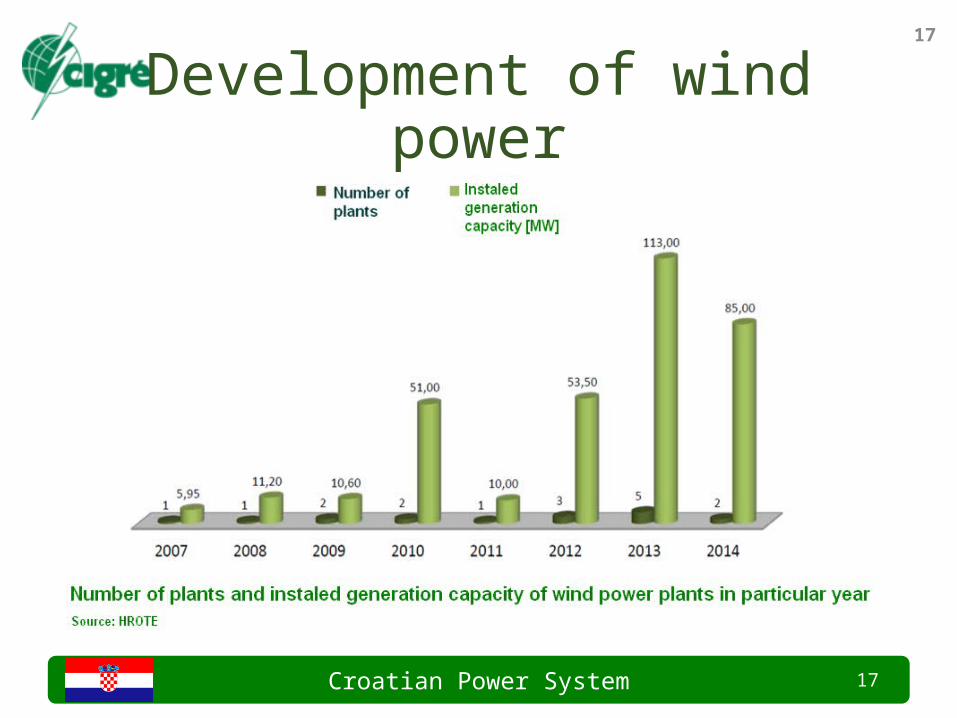
Development of wind power17

Croatian Power System 18
Development of photovoltaic power
18
Croatian Power System 19
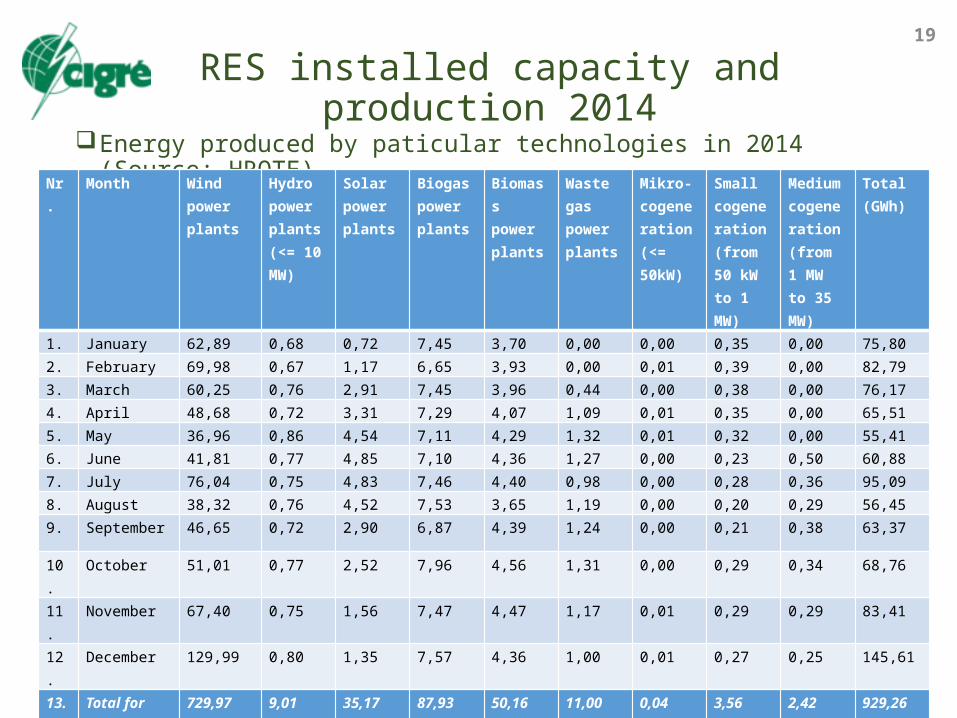
RES installed capacity and production 2014
19
Energy produced by paticular technologies in 2014 (Source: HROTE)Nr. Month Wind
power plants
Hydro power plants (<= 10 MW)
Solar power plants
Biogas power plants
Biomass power plants
Waste gas power plants
Mikro-cogeneration(<= 50kW)
Small cogeneration (from 50 kW to 1 MW)
Medium cogeneration (from 1 MW to 35 MW)
Total (GWh)
1. January 62,89 0,68 0,72 7,45 3,70 0,00 0,00 0,35 0,00 75,80
2. February 69,98 0,67 1,17 6,65 3,93 0,00 0,01 0,39 0,00 82,79
3. March 60,25 0,76 2,91 7,45 3,96 0,44 0,00 0,38 0,00 76,17
4. April 48,68 0,72 3,31 7,29 4,07 1,09 0,01 0,35 0,00 65,515. May 36,96 0,86 4,54 7,11 4,29 1,32 0,01 0,32 0,00 55,416. June 41,81 0,77 4,85 7,10 4,36 1,27 0,00 0,23 0,50 60,887. July 76,04 0,75 4,83 7,46 4,40 0,98 0,00 0,28 0,36 95,098. August 38,32 0,76 4,52 7,53 3,65 1,19 0,00 0,20 0,29 56,45
9. September 46,65 0,72 2,90 6,87 4,39 1,24 0,00 0,21 0,38 63,37
10. October 51,01 0,77 2,52 7,96 4,56 1,31 0,00 0,29 0,34 68,76
11. November 67,40 0,75 1,56 7,47 4,47 1,17 0,01 0,29 0,29 83,41
12. December 129,99 0,80 1,35 7,57 4,36 1,00 0,01 0,27 0,25 145,61
13. Total for 2014 729,97 9,01 35,17 87,93 50,16 11,00 0,04 3,56 2,42 929,26

Croatian Power System 20
Price development for households and industry consumers (‘’entrepreneurship’’)
20
Average electricity prices for terminal consumers (kn/ kWh) (exchange rate: 1 € ≈ 7.5 kn )
Category of terminal consumerYear
2008 2009 2010 2011 2012 2013 2014Consumers at medium voltage 0.49 0.58 0.58 0.58 0.61 0.60 0.58
Consumers at low voltage (Entrepreneurship)
0.64 0.72 0.74 0.73 0.79 0.78 0.75
Consumers at low voltage (Households)
0.64 0.70 0.70 0.70 0.78 0.82 0.79
Source: HEP-ODS
Croatian Power System 21
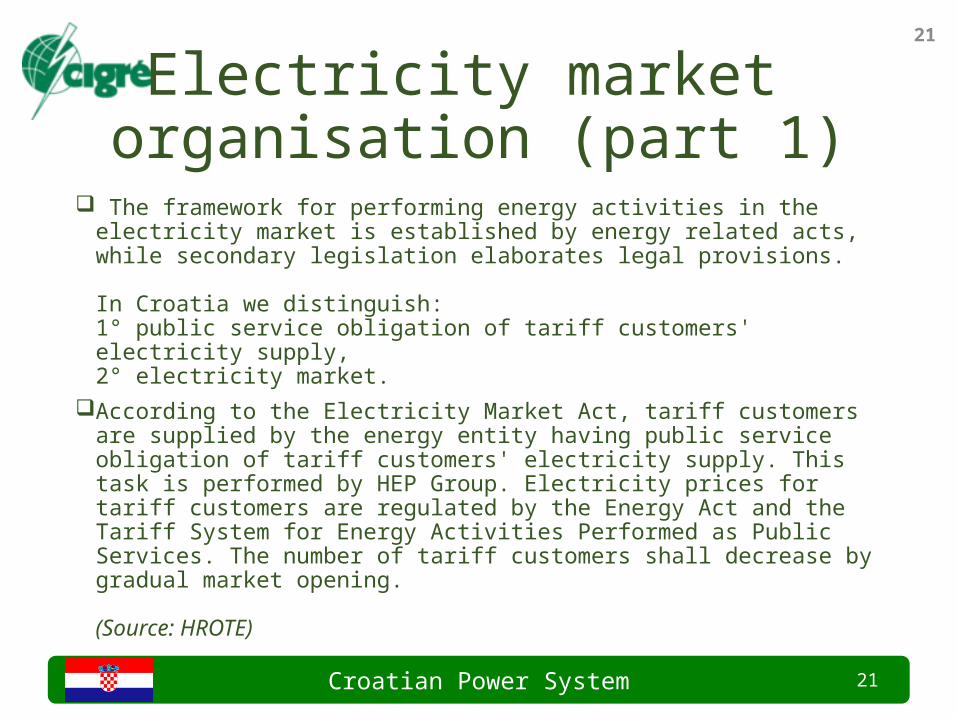
Electricity market organisation (part 1)
The framework for performing energy activities in the electricity market is established by energy related acts, while secondary legislation elaborates legal provisions.
In Croatia we distinguish:1° public service obligation of tariff customers' electricity supply, 2° electricity market.
According to the Electricity Market Act, tariff customers are supplied by the energy entity having public service obligation of tariff customers' electricity supply. This task is performed by HEP Group. Electricity prices for tariff customers are regulated by the Energy Act and the Tariff System for Energy Activities Performed as Public Services. The number of tariff customers shall decrease by gradual market opening.
(Source: HROTE)
21
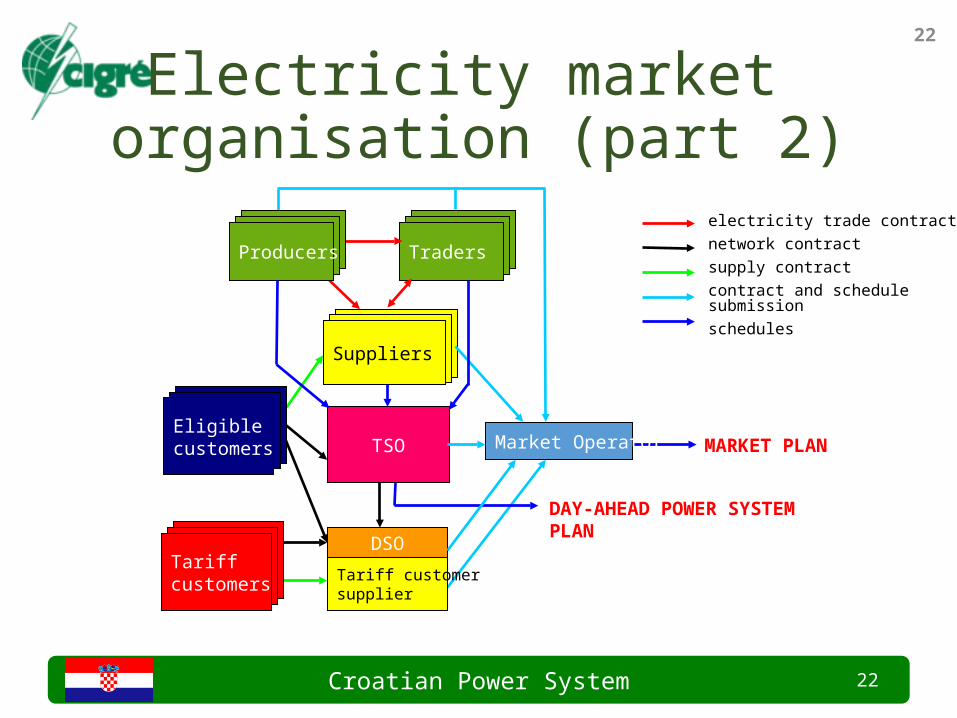
Croatian Power System 22
22
Suppliers
Traders
MARKET PLAN
DAY-AHEAD POWER SYSTEM PLAN
TSOEligiblecustomers Market Operator
Tariff customer supplier
electricity trade contractnetwork contractsupply contractcontract and schedule submissionschedules
Tariffcustomers
DSO
Producers
Electricity market organisation (part 2)

Croatian Power System 23
Power balance in 2014 Generation (TWh) Consuption (TWh) Imports (TWh) Exports (TWh) Losses (TWh)
23
Nr. Electricity balance Energy (GWh)1. Total generation 12 1922. Import 10 8993. Total supply (1. + 2.) 23 0914. Export 6 2275. Physical net import (2. – 4.) 4 6726. Total consumption (3. – 4.) 16 864
7.Supply from distribution network 544
8. Losses 430
9.Consumption of transmission network (6. – 7. – 8.)
15 890
10.Delivery to the terminal consumers at high voltage (110 kV)
746
11. Pumps and other own consumption 171
12.
Delivery to distribution network from transmission network (9. – 10. – 11.)
14 973
13. Transit (min (2. , 4.)) 6 227
Croatian Power System 24
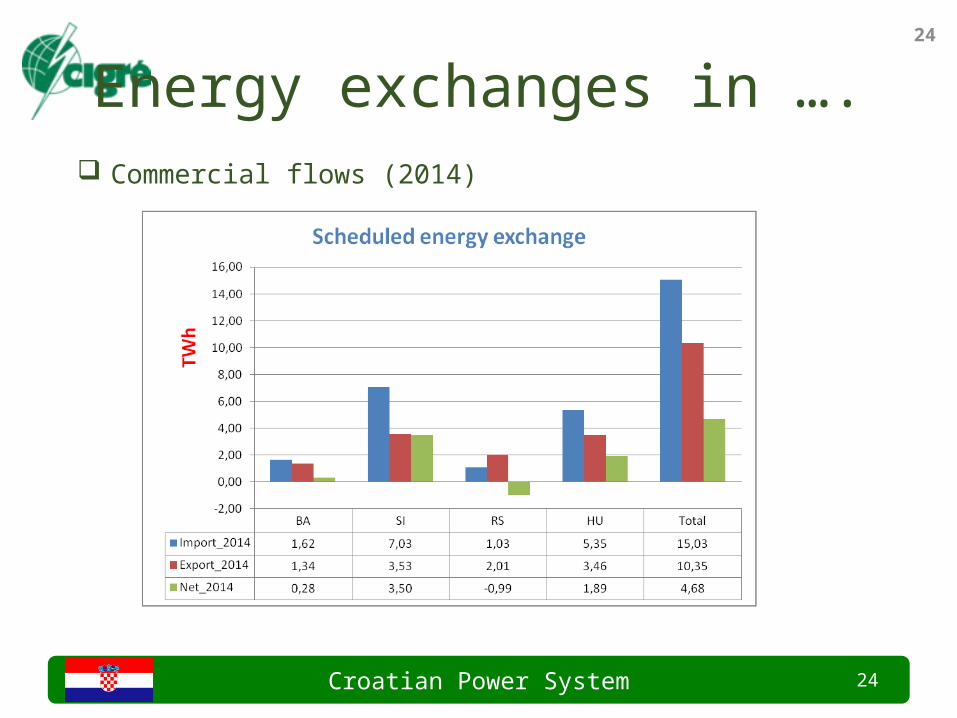
Energy exchanges in …. Commercial flows (2014)
24

Croatian Power System 25
Energy exchanges in ….25
Physical flows (2014)
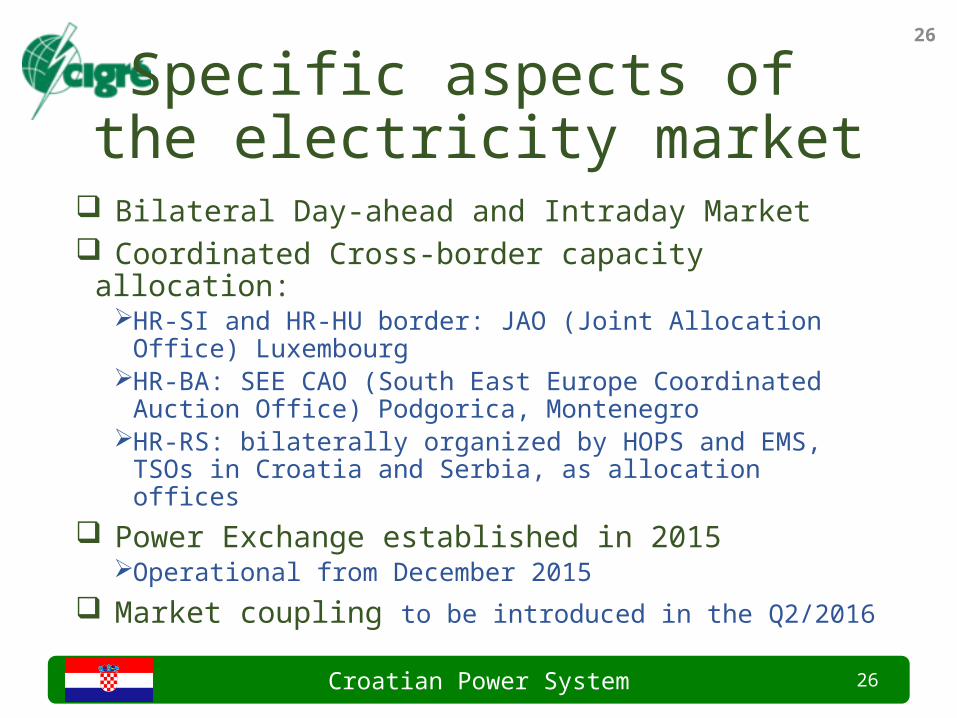
Croatian Power System 26
Specific aspects of the electricity market
Bilateral Day-ahead and Intraday Market Coordinated Cross-border capacity allocation:
HR-SI and HR-HU border: JAO (Joint Allocation Office) Luxembourg
HR-BA: SEE CAO (South East Europe Coordinated Auction Office) Podgorica, Montenegro
HR-RS: bilaterally organized by HOPS and EMS, TSOs in Croatia and Serbia, as allocation offices
Power Exchange established in 2015Operational from December 2015
Market coupling to be introduced in the Q2/2016
26