critical chain and advanced agile - speed4projects.net · critical chain aggregates the buffers...
TRANSCRIPT

Critical Chain and Advanced Agile
2015-01-06 The complete Overview

Critical Chain
results Reliability Throughput
100%
100% 50%
250%
170% 75%
Kingmedia Webdesign
P&G Pharma
HP digital cameras
Boeing Aerospace
von Ardenne plant engin.
Celesa Group (IT/SAP)
1&1 Internet AG
HP digital cameras
Kingmedia Webdesign
Von Ardenne plant engin.
P&G pharma
1&1 Internet AG
testimonials:
vistem.eu / realization.com
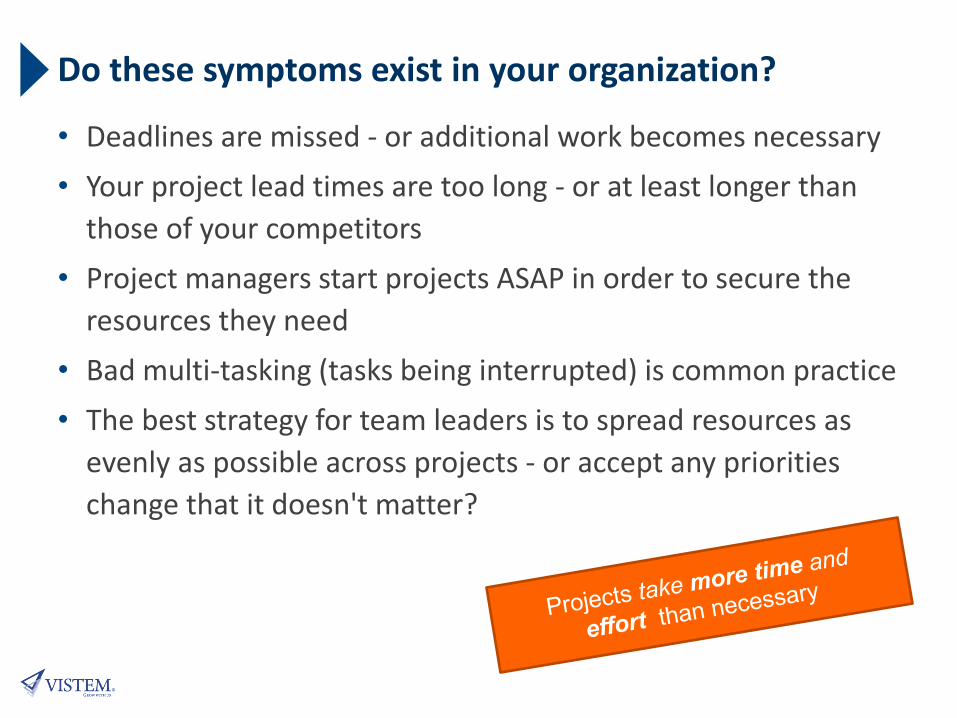
Do these symptoms exist in your organization?
• Deadlines are missed - or additional work becomes necessary
• Your project lead times are too long - or at least longer than
those of your competitors
• Project managers start projects ASAP in order to secure the
resources they need
• Bad multi-tasking (tasks being interrupted) is common practice
• The best strategy for team leaders is to spread resources as
evenly as possible across projects - or accept any priorities
change that it doesn't matter?

You'll find around 350 such symptoms … … but only two causes!
• too much work in
progress (WIP)
• local optimization – buffer in each work packages
– desynchronization due to lack
of operational priorities
cause and effect graph of problems in project management
of a global internet service provider

Intervention #1
L:C100 load to capacity = 100% in the constraint team
The workload at the constraint
can never exceed the actual
capacity - Little's Law.
Other teams will have some
"protective capacity".
How many constraints
do you have?

Sorry – there is only ever one constraint
no constraint = complex and chaotic
one constraint = simple and robust
10
Team A
Team D
Team F
Team G
100% Auslastung
10
Team A
Team D
Team F
Team G
100% Auslastung
10
Team A
Team D
Team F
Team G
100% Load to capacity

… overload – too much WIP!
100%
load per team
team
s
Situation:
• too much WIP
overload projects

Resource Conflicts …
100%
load per team
team
s
Situation:
• too much WIP
• many resource conflicts
* real (typical) distribution of an IT Company

… “perfect” load!
100%
load per team
team
s
Situation:
• too much WIP
• many resource conflicts
Situation:
• perfect WIP
• all the other teams have
protective capacity

Situation:
• perfect WIP
• protective capacity
• over capacity gets
visible
… visible hidden capacities!
100%
load per team
team
s
* there are different ideas how to achieve that
** compared to the physical real due date
A

… Focus on the Constraint > Flow!
100%
load per team
team
s
B
A
find the constraint „B“
CFDs are a good indicator …
remove any waste from the
constraint
no administration, full kit
subordinate to the constraint
WIP control, staggering
add capacity
move capacity from A to B
search for next constraint
the 5-focus-steps of flow-based
steering*:
* Theory of Constraints – E. Goldratt

staggering = strategic priority
if the constraint is not overloaded,
all the other teams cannot be
overloaded
from the perspective of the
stakeholder it looks like each
project has top priority

Intervention #2
50%/50% Buffer ½ - cut buffer in half
Move buffer from individual
tasks to the end (50%)
and cut buffer in half (50%)
Is there a single word
for “finishing early”?

The psychology of estimates
• typically 50% of
task duration is
buffer
• Early completions
are absorbed
• Delays are passed
on
relative
probability
opt. pes. 0%
max.
typ. estimate
Reasonable estimate
50%
real.
§1 Parkinson‘s Law
§2 Student Syndrome
§3 Murphy
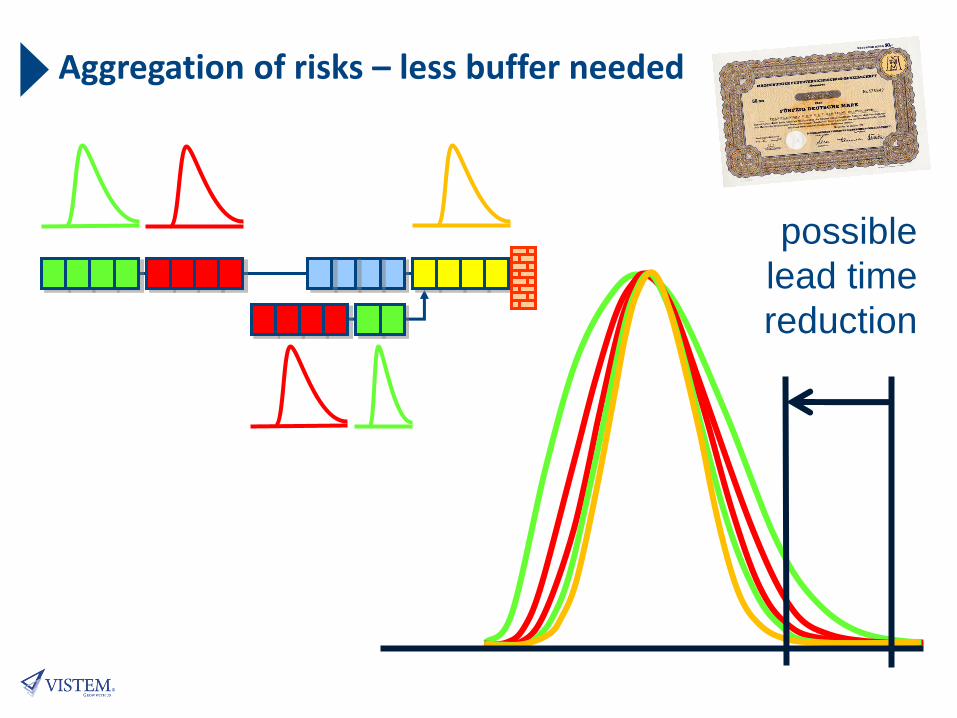
Aggregation of risks – less buffer needed
possible
lead time
reduction

Critical Chain Project Plans
• Buffer to
project end
• Cut buffer
by half
buffer
50% buffer

Intervention #3
LCC:BC longest critical chain to buffer consumption
Project status is the ratio
between progress on the Critical
Chain and buffer consumption
Do you know the color
“watermelon green”?

Example of project status of a big project …
Status = Progress to buffer consumption
Due date secured against disruptions
works for all process models: „classic“/CCPM, SCRUM, Kanban, Drum-Buffer-Rope
Bu
ffe
r c
on
su
me
d
Progress on Critical Chain
0 –
10%
10 –
20%
20 –
30%
30 –
40%
40 –
50%
50 –
60%
60 –
70%
70 –
80%
80 –
90%
90 –
100%
0 – 10%
10 – 20%
20 – 30%
30 – 40%
40 – 50%
50 – 60%
60 – 70%
70 – 80%
80 – 90%
90 – 100%
01/06
17/06
27/08
22/10
Project launch 01 Jun
Project deadline 10 Nov
End of the Critical
Chain (Plan-0)
12 Oct
Buffer 29 days
Length Critical Chain 133 days

… more real life examples!

… become an expert in reading fever charts

Project status according to Critical Chain:
• See at a glance if the project is on target!
• If measures are effective, the curve keep in yellow!
• One look at the portfolio shows the projects truly in danger!
• Objective traffic light system!
• Full operational effect – the 'reddest' project gets resources
everyone checks for correct status
• See buffer consumer at a glance!
• No more To Do list follow ups!
• Status meetings are simple
and solution-oriented.
Side effects:
• People talk to each other
• Real project plans
• Risk protection in the portfolio
• Operational priorities – no plan,
no resources
• No more arguments
• Minimal time needed to manage

Project Portfolio
Portfolio Controlling
Synchronized cooperation of all teams on the most endangered project
Creativity in problem solving and focus on results
Complete the most important task as efficiently as possible
Target: all projects on time
Risks are balanced over the whole portfolio
Bu
ffe
r c
on
su
me
d
Progress on Critical Chain
0 –
10%
10 –
20%
20 –
30%
30 –
40%
40 –
50%
50 –
60%
60 –
70%
70 –
80%
80 –
90%
90 –
100%
0 – 10%
10 – 20%
20 – 30%
30 – 40%
40 – 50%
50 – 60%
60 – 70%
70 – 80%
80 – 90%
90 – 100%
Project A
Project B
Project C Project D

… more from day to day practice
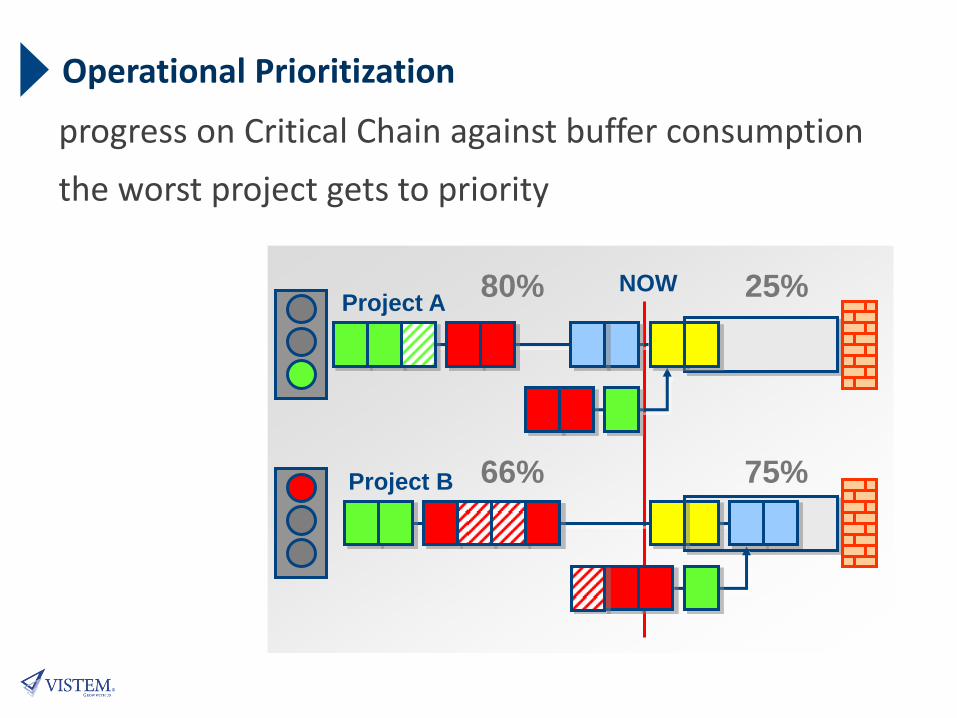
Operational Prioritization
progress on Critical Chain against buffer consumption
the worst project gets to priority
Project B
Project A NOW
66% 75%
80% 25%

The task manager‘s view – truly simple
The task manager has all info necessary to do their job and decide in favor of the company

The Three Interventions
• 50%/50% Buffer cut durations and buffer cut in half
• LCC:BC longest critical chain to buffer consumption
• L:C100 load to capacity < 100% in constraint team
Take the existing multi-project management system
and add three "simple" interventions:

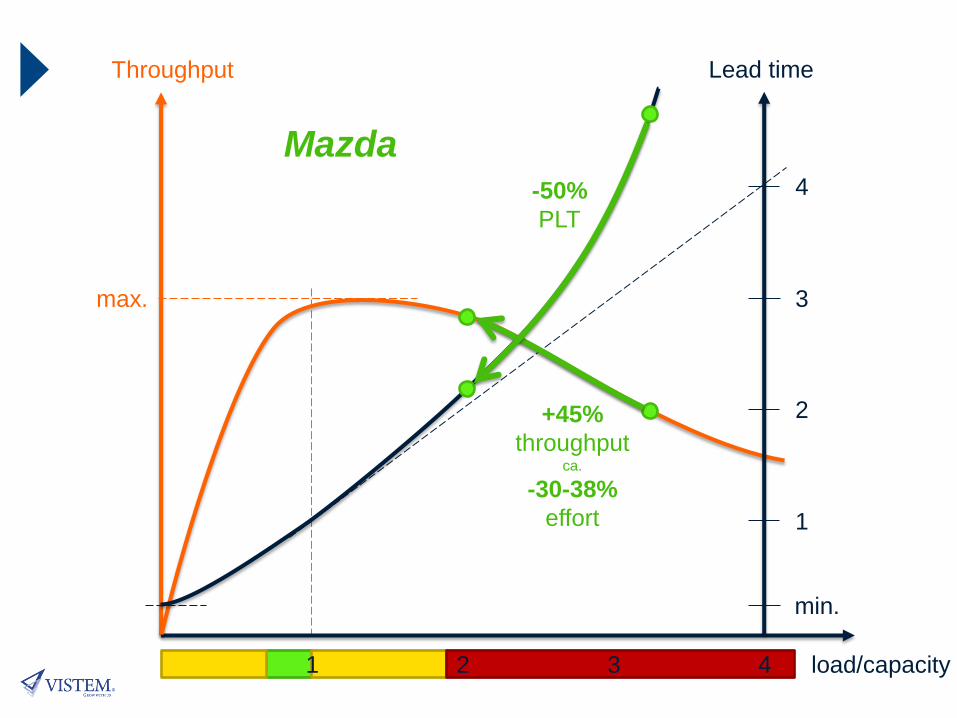
max.
load/capacity 1 2 3 4
1
2
4
3
Lead time Throughput
min.
Operation Diagram of a
Project Organization

Mazda CCPM Results • Between -32% and
-38% reduced effort
per project
• 50% development
duration
• Turnaround on
Mazda‘s bottom line
results achieved in
2013
max.
load/capacity 1 2 3 4
1
2
4
3
Lead time Throughput
min.
-50%
PLT
+45%
throughput ca.
-30-38%
effort
Mazda

25% initial speed up … less average effort per project
shorter lead times, higher throughput and reliable due dates
Sources of effort reduction:
• higher quality less reworking
• less bad Multi-tasking focused work, fewer set-up times
• focus on buffer over consumer measures to get flow to the right level continuous improvement
• better synchronization faster concepts and faster problem solving
• less reporting team lead, developer and project manager get capacity
• fewer escalations about operational priorities
• project manager can concentrate on clarifying project order, conceptual work
• obstacles get clear there is capacity to solve them focused kaizen
• easier and faster decisions less latency reduced effort to solve problems
• less communication needed more focused
• ….

Intervention multi-project management optimal flow by controlling work in
progress, staggering, fast strategic priority decisions and portfolio control highly reliable due dates
Situation:
• Bad multi-tasking
• Thin spread of resources
• Start ASAP
• Desynchronization
• Delays
Causes:
• Too much work in progress
• Ignoring Little‘s Law
Mechanism:
• Identify the constraint
• Stagger at the constraint
• Reduce WIP
• Reduce lead time
DBR management
Project #1
#2
Project #4
drum with capacity „3“
Project #3
#
5
Lead time Follow up
Bu
ffe
r c
on
su
me
d
Progress on Critical Chain
0 –
10
%
10 –
20%
20 –
30%
30 –
40%
40 –
50%
50 –
60%
60 –
70%
70 –
80%
80 –
90%
90
– 1
00
%
0 – 10%
10 – 20%
20 – 30%
30 – 40%
40 – 50%
50 – 60%
60 – 70%
70 – 80%
80 – 90%
90 – 100%
Project A
Project B
Project C Project D

Intervention single project management
highest reliability by buffering the critical project milestone, using progress against buffer consumption to operationally manage the resources comply with due dates Situation:
• Early completions are rare
• Delays are passed on
• Due dates slide/move
• Watermelon traffic lights
• Many traffic lights
• Job floor priorities unclear
Causes:
• Ignoring deviations in estimates
• Ineffective operational traffic light
Mechanism:
• Each estimate contains buffer.
Aggregate and reduce buffer
• Resources assigned based
on urgency
• Balanced portfolio
Critical Chain Management
Buffer
50% Buffer
Bu
ffe
r c
on
su
me
d
Progress on Critical Chain
0 –
10%
10 –
20%
20 –
30%
30 –
40%
40 –
50%
50 –
60%
60 –
70%
70 –
80%
80 –
90%
90 –
100%
0 – 10%
10 – 20%
20 – 30%
30 – 40%
40 – 50%
50 – 60%
60 – 70%
70 – 80%
80 – 90%
90 – 100%
01.06
17/06
27/08
22/10

Intervention Agile flexibility, innovation, product differentiation new future business
Situation:
• Waterfall development
• Long feedback cycles
• „Over-the-Wall“
• Very remote client
Causes:
• was efficient in fairly stable
environments
Mechanism:
• Include client in the team
• Feedback loops
• Break up into sub tasks
• Simplify management
• Combine with CCPM
Reliable/Ultimate Scrum
… we know how to
optimally combine
agile and classic!

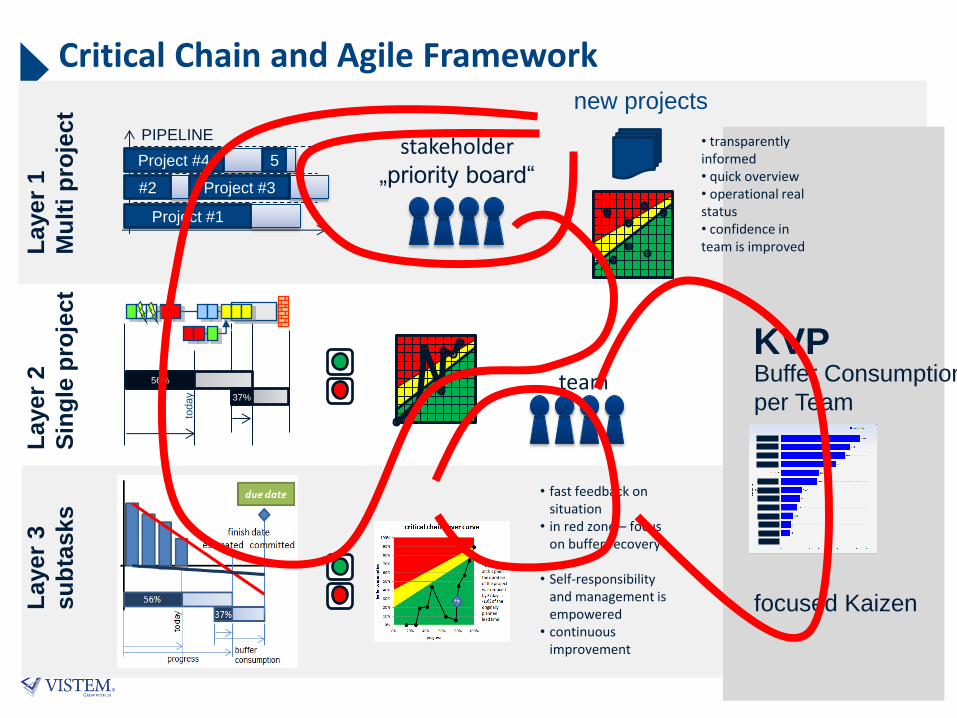
Critical Chain and Agile Framework
Project #1
#2
Project #4
PIPELINE
Project #3
5 stakeholder
„priority board“
team
• fast feedback on situation
• in red zone – focus on buffer recovery
• Self-responsibility and management is empowered
• continuous improvement
new projects
today
56%
37%
Layer
1
Mu
lti p
roje
ct
Layer
2
Sin
gle
pro
ject
Layer
3
su
bta
sk
s
Buffer Consumption
per Team
focused Kaizen
KVP
• transparently informed • quick overview • operational real status • confidence in team is improved

team
• fast feedback on situation • in red zone – focus on buffer regain • Self-responsibility and management
is empowered
„Critical Chain on a Page“
(5) project view
stakeholders
• transparently informed • quick overview • operational real status • confidence in team is improved
progress
status “green” (4) faster progress
than buffer consumption
portfolio view (6)
progress & status reporting
status “red” slower progress
than buffer consumption
buff
er
consum
ptio
n
(2) aggregate buffer at the project end
probability of estimates
• every estimate
is wrong
• every estimate
has buffer in it duration
typical
estimate
reasonable estimate 50/50%
#1 longest chain of work packages
#2 with 50% buffer highlighted (green)
#3 with buffer aggregated at the end
#4 with 50% of buffer reduced
resulting buffer
~33% of the
duration
Critical Chain Project Plan (3)
33% dedicated
buffer before the
fixed due date
due date
today
56%
37%
progress buffer
consumption
(1) Work in Progress is under control
P3 P2
P1
P1
project
pipeline
P2
P3 Critical Chain …
… complements your existing project
management. It builds on the fact that there is always
a constraint and staggers projects (1) in order to determine realistic
due dates. Critical Chain aggregates the buffers from individual tasks
at project end and uses the "insurance effect" among others to
considerably reduce the buffer (2), leading to a tighter schedule with a
critical chain and a buffer (3). Progress and buffer consumption create
a true operational project traffic light (4). The chart progress (5) supports
effective project management. All charts together (6) enable decision
makers to manage the portfolio.
Critical Chain acts as a catalyst, allowing
all existing good ideas, work processes
and methods to take full effect.
target
<10%
red

The Change
• how to create fast and
reliable change?

The meta constraint …
… management attention
• if a project has the attention of
top management it works!
• if you make many changes at
once, the effects are slower!
• if you make many changes at
once, you won‘t know which
one worked!
• if you make many changes at
once, everybody has excuses!

Step-by-Step
• if management attention is the
constraint – step by step
change is the solution
• if you do a change step by step
you can fully focus on the
effects and use the Deming
cycle

… Initial success as the engine for change
• every change initially
takes effort
• the point is to quickly
achieve a result
freeze
• this initial result
creates momentum
to get over the
hump! Time
Performance
Baseline
Freeze!

four phases of a reliable change …
freeze - flow, capacity & trust
prepare control to keep the flow
activate flow control - stabilize
continuous improvement

Strategy & Tactics … step by step

Process of continuous improvement …
• Where are the
buffer over
spender?
• Where are the
weak points?

Our successes …
u.a.

… more testimonials
Lufthansa aircraft
maintenance
+45% throughput
lead times cut in half
B2B web software
Kingmedia
+60% throughput
Plant construction
Von Ardenne -
Lead times reduced
from 21 to 6 months
Japan – organizations using CCPM are favored for public
building projects. Over 80% use CCPM.
Motorway
construction -
40% reduced
lead times
and costs

… scientifically proven

And if you want to find out more,
You can send an e-mail to [email protected]
or call: +49 171 565 182

Additional Details to Advanced Agile …
• Reliable Scrum
• Ultimate Scrum

Learning Agile!
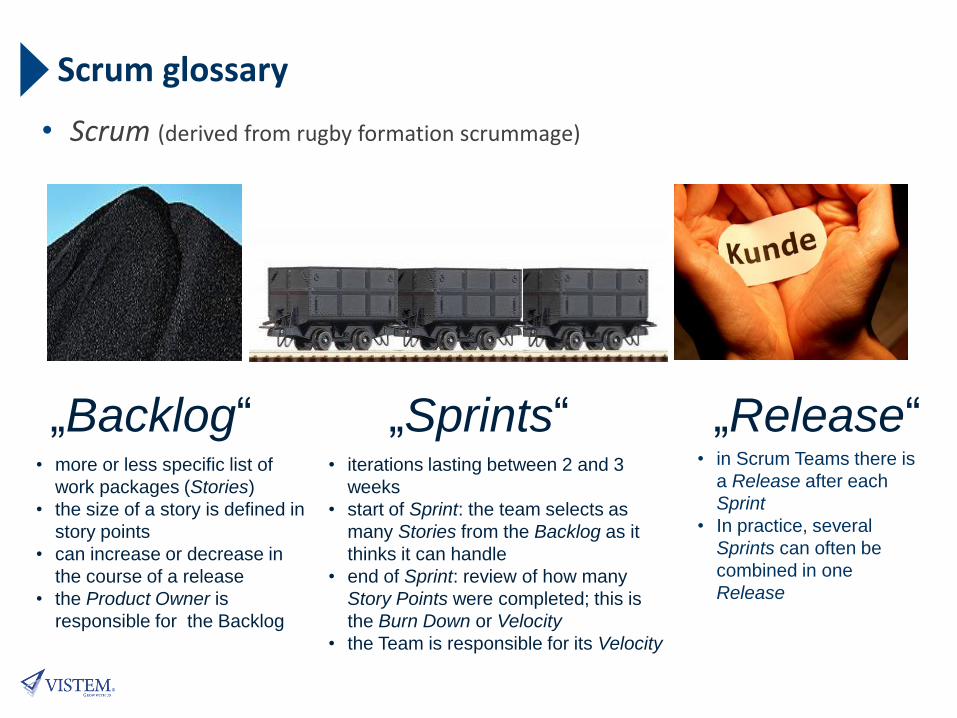
Scrum glossary
• Scrum (derived from rugby formation scrummage)
„Backlog“ „Sprints“ „Release“ • more or less specific list of
work packages (Stories)
• the size of a story is defined in
story points
• can increase or decrease in
the course of a release
• the Product Owner is
responsible for the Backlog
• iterations lasting between 2 and 3
weeks
• start of Sprint: the team selects as
many Stories from the Backlog as it
thinks it can handle
• end of Sprint: review of how many
Story Points were completed; this is
the Burn Down or Velocity
• the Team is responsible for its Velocity
• in Scrum Teams there is
a Release after each
Sprint
• In practice, several
Sprints can often be
combined in one
Release

Disadvantages of Scrum …
• Backlog open – can increase / decrease at any time
• Anything incomplete is included in the next Sprint
• No due date commitments – „it‘s done when it‘s done“
• Product Burndown Chart only knows deadline met / missed
• Circular developments
• …
Step 1 of 3: Reliable Scrum
• just short …
• … it‘s all about work in progress
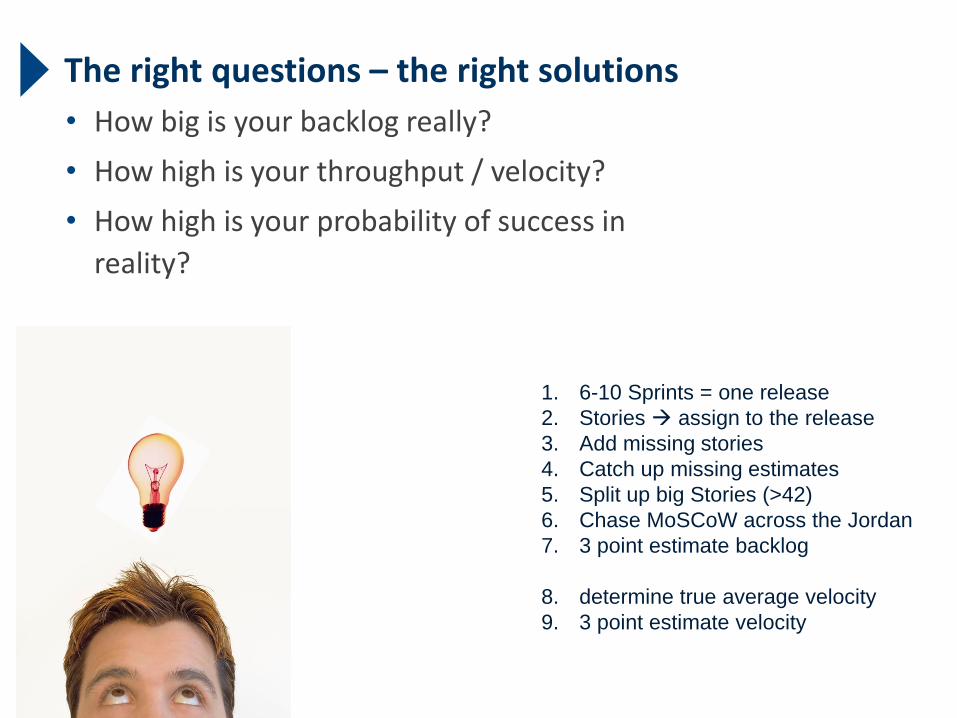
The right questions – the right solutions
• How big is your backlog really?
• How high is your throughput / velocity?
• How high is your probability of success in
reality?
1. 6-10 Sprints = one release
2. Stories assign to the release
3. Add missing stories
4. Catch up missing estimates
5. Split up big Stories (>42)
6. Chase MoSCoW across the Jordan
7. 3 point estimate backlog
8. determine true average velocity
9. 3 point estimate velocity

probabilty of success
worst real best
#2 velocity
* convolution
operator
time
#3 probability over time absolute
80%
reasonable
due date
#1 amount of story points
in the backlog
best real worst

Probability of Success
Variables:
• Backlog
• Time
• Velocity
absolute probability of success
Likelihood of success
• Bring Stories in order according priority
• Keep cutting Backlog until 80% probability is achieved
• Bring stakeholders on board
• Negotiate deadline/resources/scope
until saleable product achieved
Team has sufficient
probability of success
Stakeholders know exactly
what they’re getting –
no ambiguity!

… Well? What‘s the status of your project?
• Watermelon green!

ooops – but there is a buffer!
with real probability of
success
a bit of buffer in the
backlog
a bit of buffer in the
velocity
a real project buffer =

Progress > buffer consumption > traffic light
Progress >
buffer consumption
= green
Progress <
buffer consumption
= red
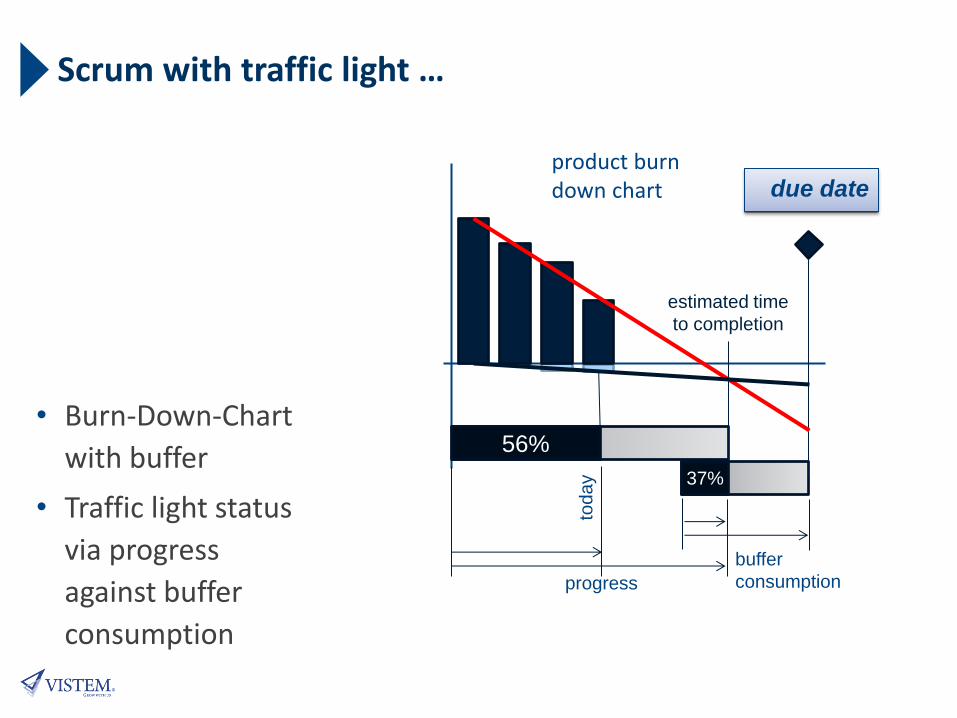
Scrum with traffic light …
• Burn-Down-Chart
with buffer
• Traffic light status
via progress
against buffer
consumption
product burn down chart
56%
37%
estimated time
to completion
due date
progress to
da
y
buffer
consumption
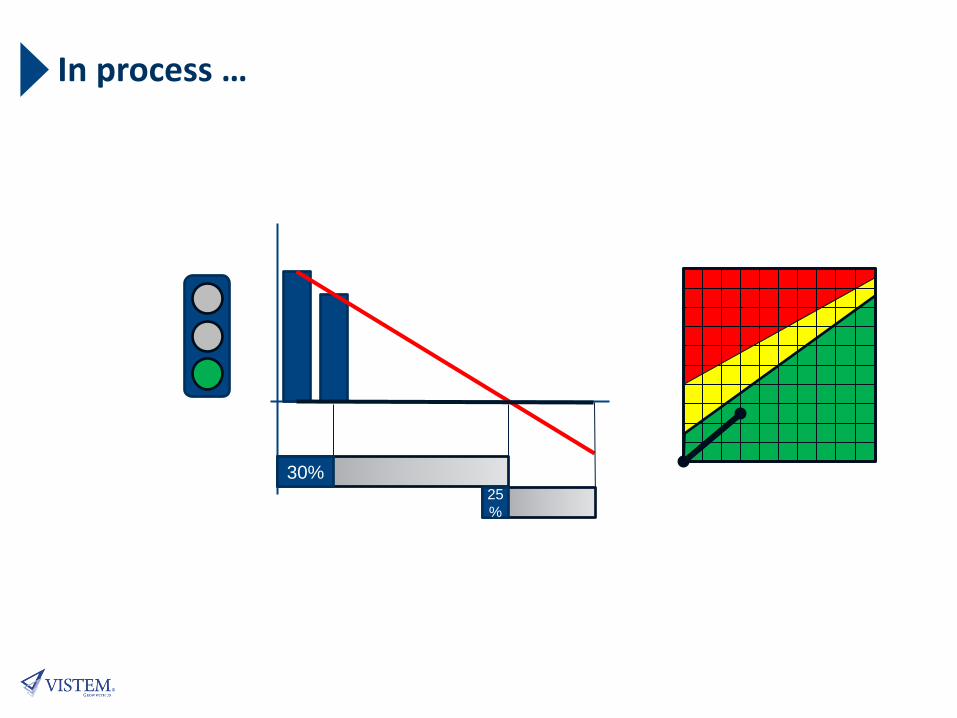
30% 25
%
In process …
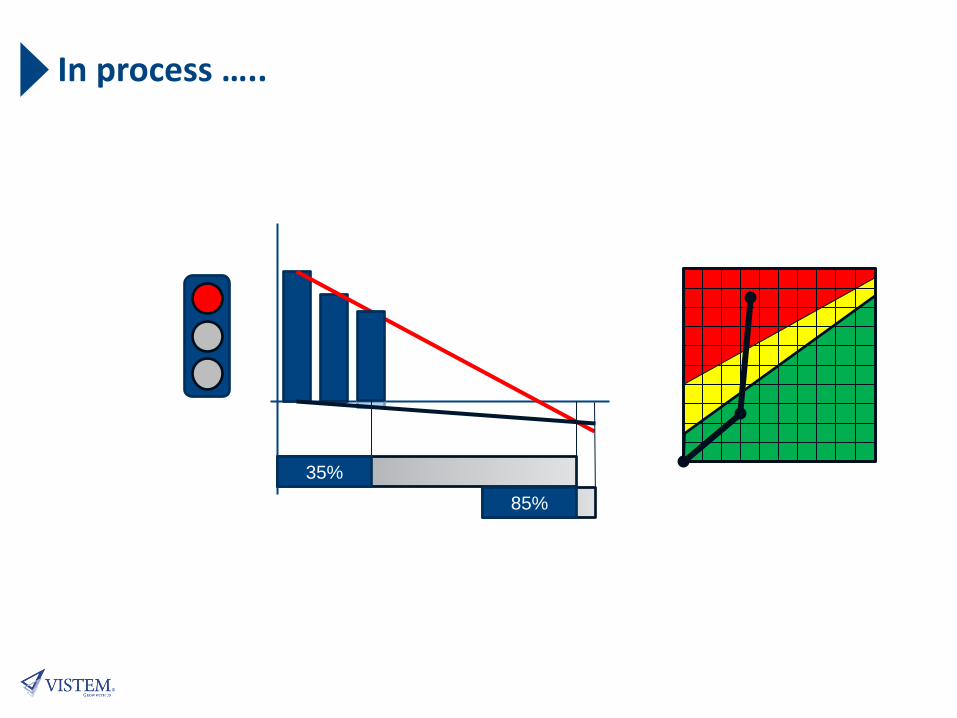
35%
85%
In process …..

56%
37%
In process …….
Buffer
consum
ed
Progress

59%
82%
In process ………

72%
78%
In process ………..
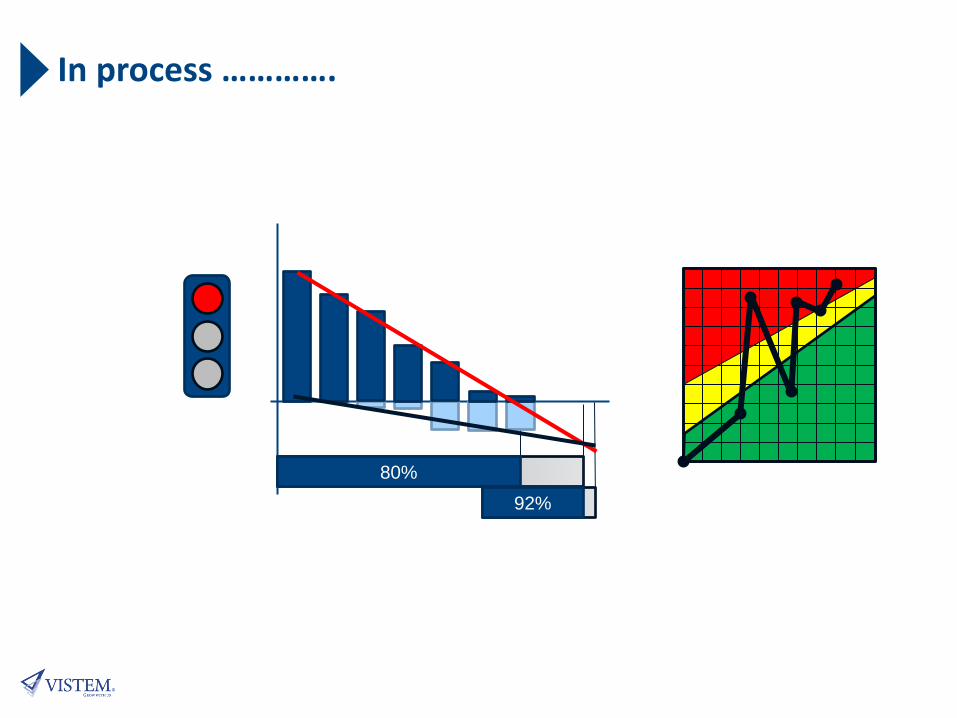
80%
92%
In process ………….

93%
85%
In process ……………

100%
91%
In process ……………..

End result …
• Backlog = project order clarified
• Stakeholders know what they’re getting
• Transparency about progress
• Product Owner able to manage
• Fear eliminated – high velocity
0%
10%
20%
30%
40%
50%
60%
70%
80%
90%
100%
0% 20% 40% 60% 80% 100%
Pu
ffe
rve
rbra
uch
Fortschritt
Fieberkurve das Fallbeispiels
Sprin
t #5
Sprin
t #8
example of a fever curve
• in Sprint #5 started with
reliable scrum
• in Sprint #8 buffer reduced
because of too much speed
bu
ffe
r co
nsu
mptio
n
progress (burn down)

one more fever chart … … compared with burn down chart
Which of the diagrams show the urgency better?

Step 2 of 3: Ultimate Scrum
• just short …
• … it‘s all about speed – the shortest possible lead time

Flow!?
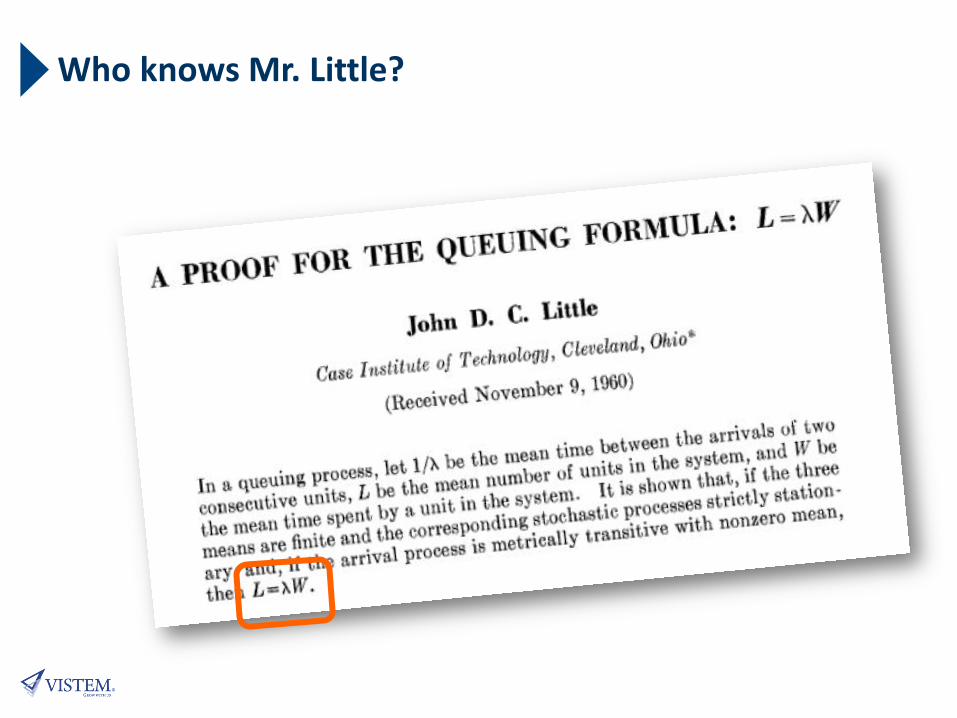
Who knows Mr. Little?

• Little’s Law has no mercy
• Multi-tasking causes context switches, desynchronization etc.
• more WIP longer lead times …
Rules for increasing the pipeline?
Pipeline
Workload
100%
100% capacity
Additional switching effects
and missing aggregation

LIMIT the WORK IN PROGRESS!!!!!
Henry Ford (1913)
Taiichi Ohno (1953)
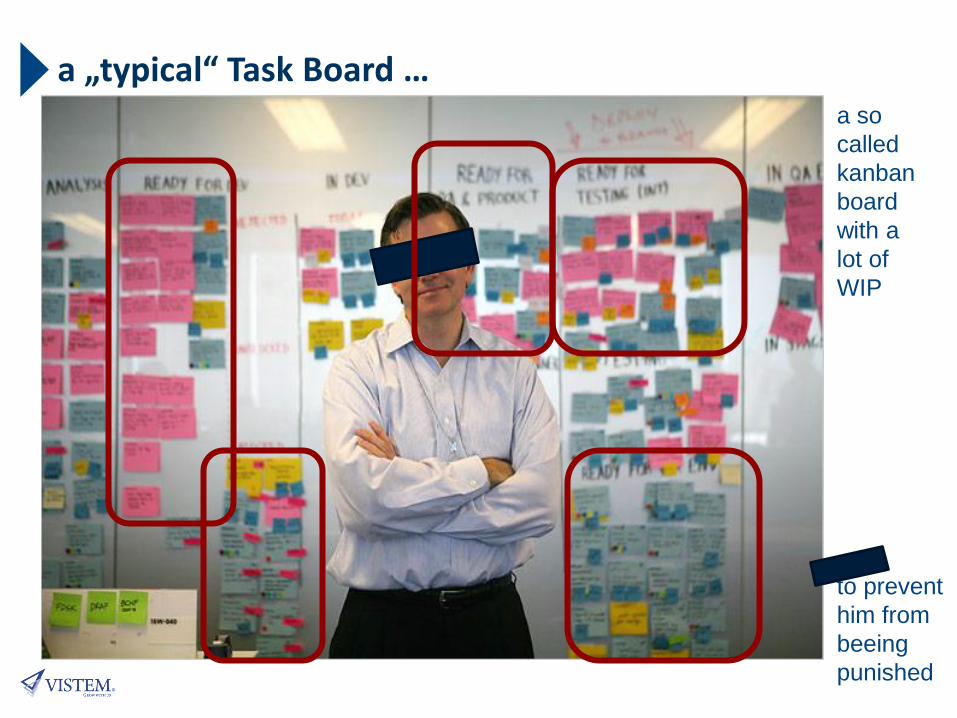
a „typical“ Task Board …
to prevent
him from
beeing
punished
a so
called
kanban
board
with a
lot of
WIP

• How can I get a group of boy scouts to walk to the finish line together as quickly as possible?
• Problem: they all walk at different speeds!
3. Generation - DBR - E. Goldratt (1984)
buffer
drum
rope
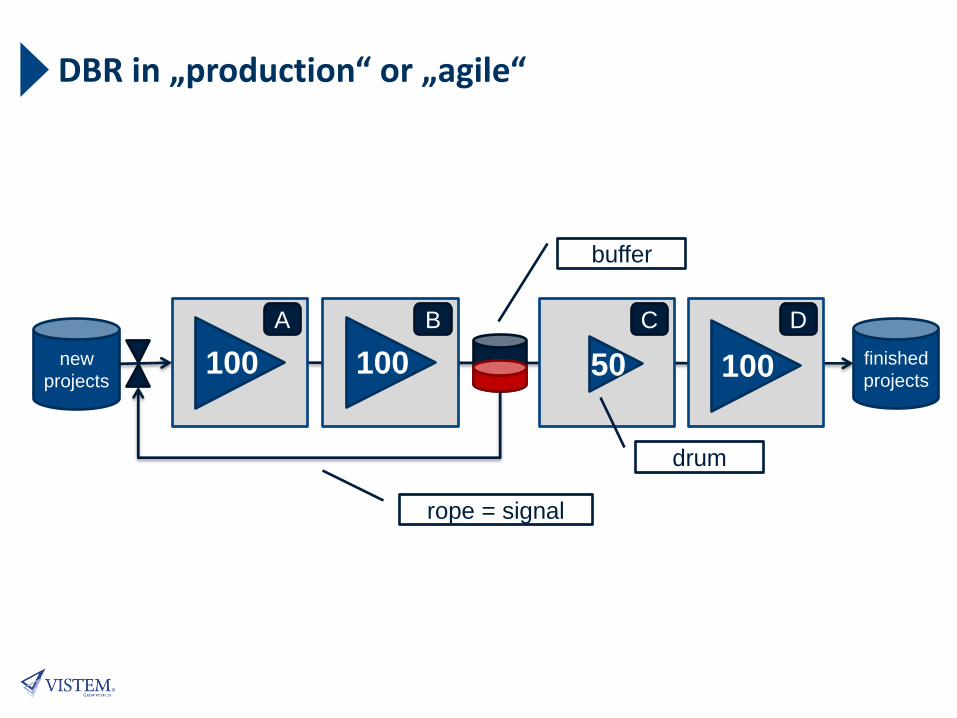
DBR in „production“ or „agile“
A
100 new
projects
C D
100 50
B
100 finished
projects
rope = signal
buffer
drum

Product
Backlog
[Stories]
finished
Tasks
Ultimate Scrum
Task
Buffer
[Tasks] developing review
breaking
stories up
into tasks
if number of tasks
below alarm threshold
select new story
alarm threshold just high
enough to get a new story
broken down into tasks
but no higher than half
the number of developers
if a developer is running
out of tasks a new one
can be drawn as an
exception – after
removing all impediments
if no starvation occurs,
the selection of new tasks
can be inhibited until
impediments arise
Drum-Buffer-Rope
(3rd generation agile)
if a task is finished
select new task
Drum
Rope
Buffer
Just-In-Time
cumul. in/out flow

Result …
• Minimal number of
open work
packages
• minimal lead time
• Problems are visible
immediately
• There is time to
solve problems
• Task lead time < 1
day
1
2

Daily stand up …
1 2
3
4
The goal is to have fewer open tasks
than developers! in this case there were 12 tasks open for 8 developer

Product
Backlog
[Stories]
finished
Tasks
Ultimate Scrum
Task
Buffer
[Tasks] developing review
breaking
stories up
into tasks
if number of tasks
below alarm threshold
select new story
alarm threshold just high
enough to get a new story
broken down into tasks
but no higher than half
the number of developers
if a developer is running
out of tasks a new one
can be drawn as an
exception – after
removing all impediments
if no starvation occurs,
the selection of new tasks
can be inhibited until
impediments arise
Drum-Buffer-Rope
(3rd generation agile)
if a task is finished
select new task
Drum
Rope
Buffer
Just-In-Time
cumul. in/out flow
Reliable Scrum
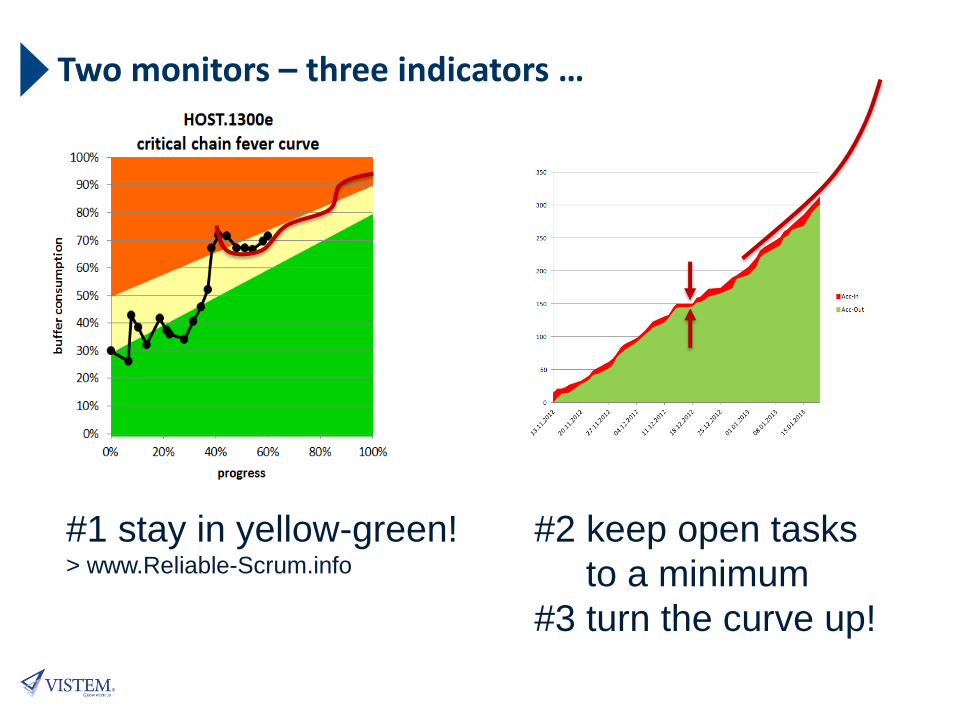
Two monitors – three indicators …
#1 stay in yellow-green! > www.Reliable-Scrum.info
#2 keep open tasks
to a minimum
#3 turn the curve up!

Our Sweet Spot …
SAFe
US
single
CCPM
multi
CCPM
3 Layer
PPF
1
>100
product development management
Partner
multi
CCPM
3 Layer
PPF
US
single
CCPM
class.
Agile
Scala
bili
ty
Team
s/I
nitia
tives
Production Project • Many small tasks
• Fairly similar
• Generally independent
• „continuous flow“
• Diverse tasks
• High scattering
• Hard interdependencies
• Deadline
• external partners
SAFe – Scalable Agile Framework,
UR – Ultimate Scrum, CCPM – Critical Chain
3 Layer PPF – fully integrated Product and Project Framework

And if you want to find out more,
You can send an email to [email protected]
or call: +49 171 565 182