crime in the united states - fbi · larceny analysis, 1998 47 motor vehicle theft, 1994-1998 51...
TRANSCRIPT
Crime in the United States
1998 Uniform Crime Reports
Printed Annually Federal Bureau of Investigation
U.S. Department of Justice Washington, D.C. 20535
Advisory: Criminal Justice Information Systems Committee, International Association of Chiefs of Police; Criminal Justice Information Services Committee, National Sheriffs’ Association; Criminal Justice Information Services Advisory Policy Board
For sale by Superintendent of Documents U.S. Government Printing Office, Mail Stop: SSOP, Washington, D.C. 20402-9328
ISBN 0-16-048756-0
FOREWORD
For nearly seven decades, local, state, and federal law enforcement agencies have reported crime statistics to the national Uniform Crime Reporting (UCR) Program. As the twenty-first century approaches, the Program continues working diligently to maintain the accuracy and credibility of the statistics received from participating agencies across the Nation. Detailed and timely submissions of data from monthly reports or individual crime incident records enable the UCR Program to compile a reliable set of statistics that can be used to help understand and combat crime.
The UCR Program continues its commitment and support towards the full implementation of the National Incident-Based Reporting System (NIBRS). Through its progressive, automated collection methods, NIBRS offers a wealth of crime information which has never before been available, taking crime reporting into the next century. As NIBRS becomes the standard of UCR, it will provide a more comprehensive national perspective of the characteristics, elements, volume, diversity, and complexity of reported crime.
The significant challenge of reducing crime requires commitment from all law enforcement agencies. The evolution of the UCR Program continues to bring about improvements that will provide additional information to the criminal justice community, government agencies, researchers, students, and others. Helping to prepare law enforcement agencies to meet daily challenges, this publication exists as one weapon in the fight against crime.
iii
CRIME FACTORS
Each year when Crime in the United States is published, many entities—news media, tourism agencies, and other groups with an interest in crime in our Nation—use reported Crime Index figures to compile rankings of cities and counties. These rankings lead to simplistic and/or incomplete analyses which often create misleading perceptions adversely affecting cities and counties, along with their residents. Assessing criminality and law enforcement’s response from jurisdiction to jurisdiction must encompass many elements, some of which, while having significant impact, are not readily measurable nor applicable pervasively among all locales. Geographic and demographic factors specific to each jurisdiction must be considered and applied if crime assessment is to approach completeness and accuracy. There are several sources of information which may assist the responsible researcher. The U.S. Bureau of the Census data, for example, can be utilized to better understand the makeup of a locale’s population. The transience of the population, its racial and ethnic makeup, its composition by age and gender, education levels, and prevalent family structures are all key factors in assessing and comprehending the crime issue.
Local chambers of commerce, planning offices, or similar entities provide information regarding the economic and cultural makeup of cities and counties. Understanding a jurisdiction’s industrial/economic base, its dependence upon neighboring jurisdictions, its transportation system, its economic dependence on nonresidents (such as tourists and convention attendees), its proximity to military installations, etc., all contribute to accurately gauging and interpreting the crime known to and reported by law enforcement.
The strength (personnel and other resources) and the aggressiveness of a jurisdiction’s law enforcement agency are also key factors. While information pertaining to the number of sworn and civilian law enforcement employees can be found in this publication, assessment of the law enforcement emphases is, of course, much more difficult. For example, one city may report more crime than a comparable one, not because there is more crime, but rather because its law enforcement agency through proactive efforts identifies more offenses. Attitudes of the citizens toward crime and their crime reporting practices, especially concerning more minor offenses, have an impact on the volume of crimes known to police.
It is incumbent upon all data users to become as well educated as possible about how to categorize and quantify the nature and extent of crime in the United States and in any of the approximately 17,000 jurisdictions represented by law enforcement contributors to this Program. Valid assessments are possible only with careful study and analysis of the various unique conditions affecting each local law enforcement jurisdiction.
Historically, the causes and origins of crime have been the subjects of investigation by varied disciplines. Some factors which are known to affect the volume and type of crime occurring from place to place are:
Population density and degree of urbanization. Variations in composition of the population, particularly youth concentration. Stability of population with respect to residents’ mobility, commuting patterns, and transient factors. Modes of transportation and highway system. Economic conditions, including median income, poverty level, and job availability. Cultural factors and educational, recreational, and religious characteristics. Family conditions with respect to divorce and family cohesiveness. Climate. Effective strength of law enforcement agencies.
iv
Administrative and investigative emphases of law enforcement. Policies of other components of the criminal justice system (i.e., prosecutorial, judicial,
correctional, and probational). Citizens’ attitudes toward crime. Crime reporting practices of the citizenry.
The Uniform Crime Reports give a nationwide view of crime based on statistics contributed by state and local law enforcement agencies. Population size is the only correlate of crime utilized in this publication. While the other factors listed above are of equal concern, no attempt is made to relate them to the data presented. The reader is, therefore, cautioned against comparing statistical data of individual reporting units from cities, counties, metropolitan areas, states, or colleges and universities solely on the basis of their population coverage or student enrollment.
v
Data users are cautioned against comparisons of crime trends presented in this report and those estimated by the National Crime Victimization Survey (NCVS), administered by the Bureau of Justice Statistics. Because of differences in methodology and crime coverage, the two programs examine the Nation’s crime problem from somewhat different perspectives, and their results are not strictly comparable. The definitional and procedural differences can account for many of the apparent discrepancies in results from the two programs.
vi
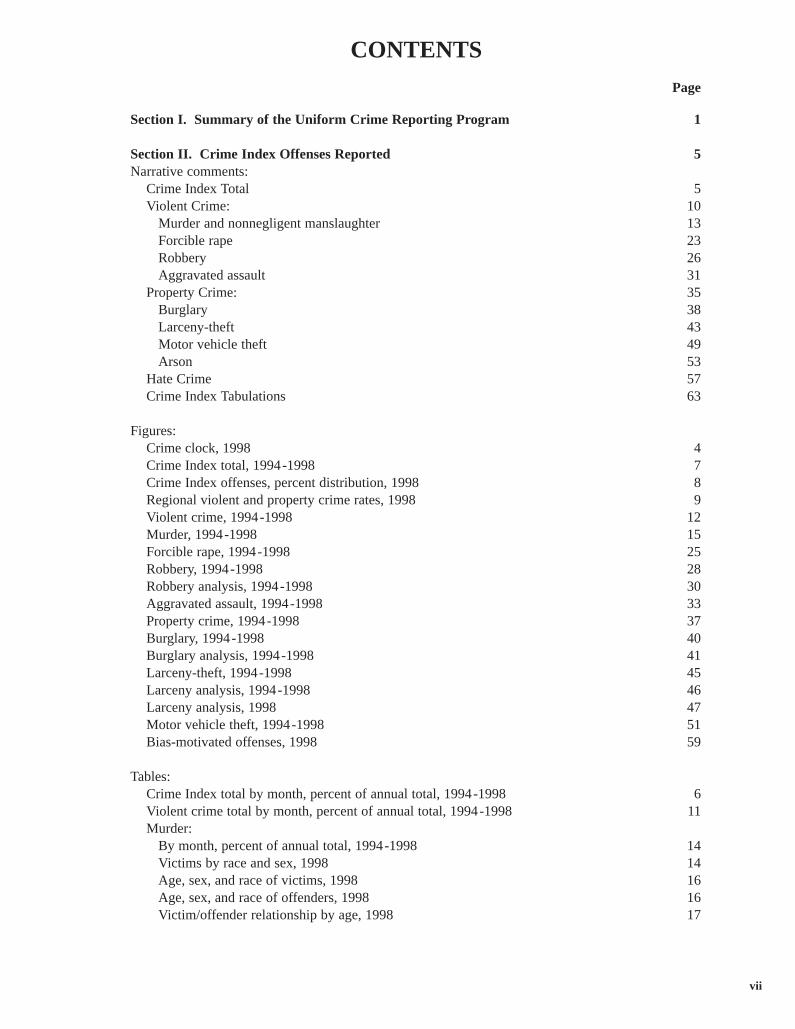
CONTENTS
Page
Section I. Summary of the Uniform Crime Reporting Program 1
Section II. Crime Index Offenses Reported 5 Narrative comments:
Crime Index Total 5 Violent Crime: 10
Murder and nonnegligent manslaughter 13 Forcible rape 23 Robbery 26 Aggravated assault 31
Property Crime: 35 Burglary 38 Larceny-theft 43 Motor vehicle theft 49 Arson 53
Hate Crime 57 Crime Index Tabulations 63
Figures: Crime clock, 1998 4 Crime Index total, 1994-1998 7 Crime Index offenses, percent distribution, 1998 8 Regional violent and property crime rates, 1998 9 Violent crime, 1994-1998 12 Murder, 1994-1998 15 Forcible rape, 1994-1998 25 Robbery, 1994-1998 28 Robbery analysis, 1994-1998 30 Aggravated assault, 1994-1998 33 Property crime, 1994-1998 37 Burglary, 1994-1998 40 Burglary analysis, 1994-1998 41 Larceny-theft, 1994-1998 45 Larceny analysis, 1994-1998 46 Larceny analysis, 1998 47 Motor vehicle theft, 1994-1998 51 Bias-motivated offenses, 1998 59
Tables: Crime Index total by month, percent of annual total, 1994-1998 6 Violent crime total by month, percent of annual total, 1994-1998 11 Murder:
By month, percent of annual total, 1994-1998 14 Victims by race and sex, 1998 14 Age, sex, and race of victims, 1998 16 Age, sex, and race of offenders, 1998 16 Victim/offender relationship by age, 1998 17
vii
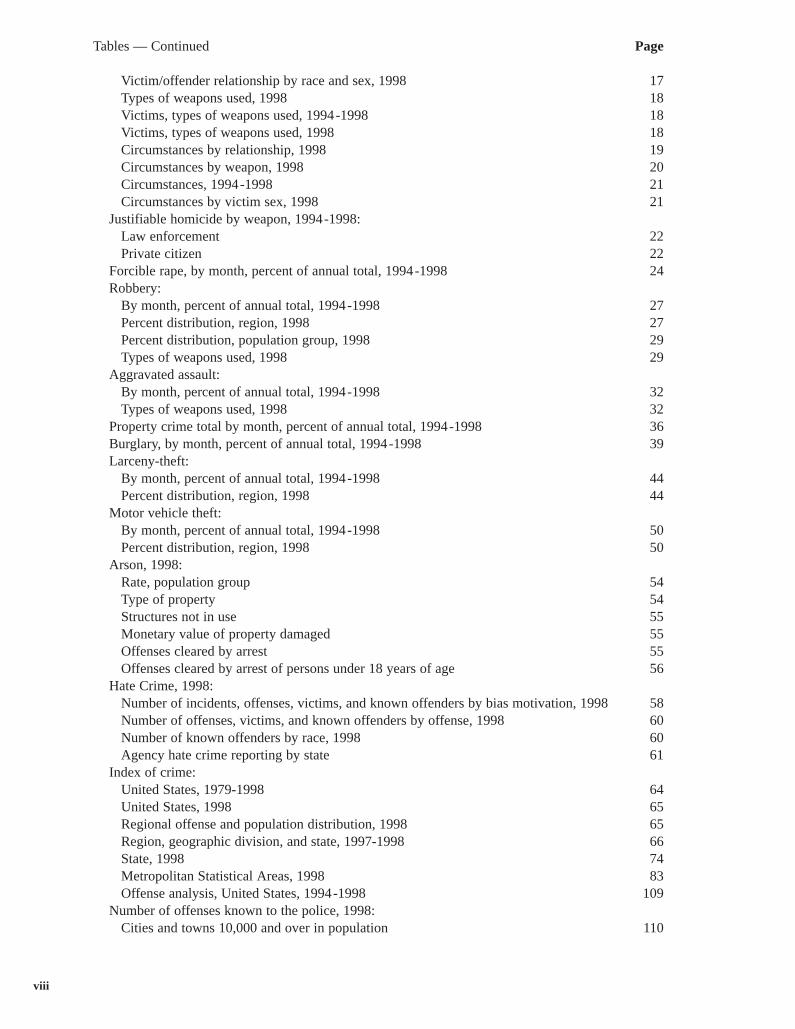
Tables — Continued Page
Victim/offender relationship by race and sex, 1998 17
Justifiable homicide by weapon, 1994-1998:
Robbery:
Aggravated assault:
Larceny-theft:
Motor vehicle theft:
Arson, 1998:
Hate Crime, 1998:
Index of crime:
Number of offenses known to the police, 1998:
Types of weapons used, 1998 18 Victims, types of weapons used, 1994-1998 18 Victims, types of weapons used, 1998 18 Circumstances by relationship, 1998 19 Circumstances by weapon, 1998 20 Circumstances, 1994-1998 21 Circumstances by victim sex, 1998 21
Law enforcement 22 Private citizen 22
Forcible rape, by month, percent of annual total, 1994-1998 24
By month, percent of annual total, 1994-1998 27 Percent distribution, region, 1998 27 Percent distribution, population group, 1998 29 Types of weapons used, 1998 29
By month, percent of annual total, 1994-1998 32 Types of weapons used, 1998 32
Property crime total by month, percent of annual total, 1994-1998 36 Burglary, by month, percent of annual total, 1994-1998 39
By month, percent of annual total, 1994-1998 44 Percent distribution, region, 1998 44
By month, percent of annual total, 1994-1998 50 Percent distribution, region, 1998 50
Rate, population group 54 Type of property 54 Structures not in use 55 Monetary value of property damaged 55 Offenses cleared by arrest 55 Offenses cleared by arrest of persons under 18 years of age 56
Number of incidents, offenses, victims, and known offenders by bias motivation, 1998 58 Number of offenses, victims, and known offenders by offense, 1998 60 Number of known offenders by race, 1998 60 Agency hate crime reporting by state 61
United States, 1979-1998 64 United States, 1998 65 Regional offense and population distribution, 1998 65 Region, geographic division, and state, 1997-1998 66 State, 1998 74 Metropolitan Statistical Areas, 1998 83 Offense analysis, United States, 1994-1998 109
Cities and towns 10,000 and over in population 110
viii
Tables — Continued Page
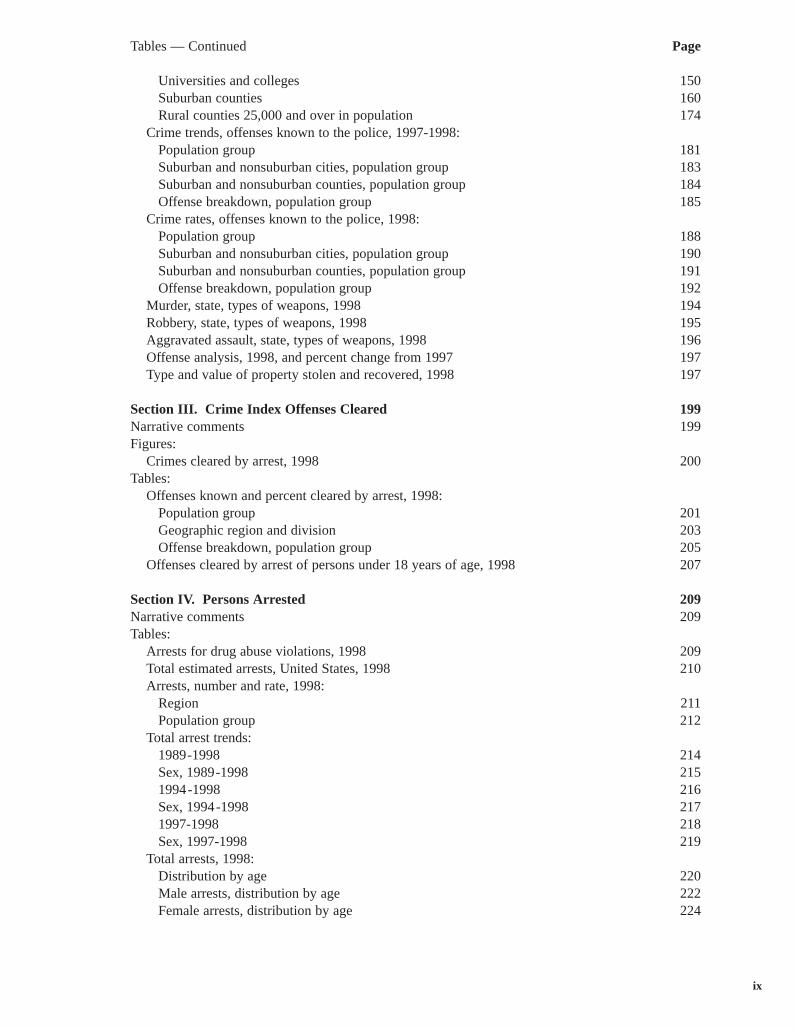
Universities and colleges 150
Crime trends, offenses known to the police, 1997-1998:
Crime rates, offenses known to the police, 1998:
Suburban counties 160 Rural counties 25,000 and over in population 174
Population group 181 Suburban and nonsuburban cities, population group 183 Suburban and nonsuburban counties, population group 184 Offense breakdown, population group 185
Population group 188 Suburban and nonsuburban cities, population group 190 Suburban and nonsuburban counties, population group 191 Offense breakdown, population group 192
Murder, state, types of weapons, 1998 194 Robbery, state, types of weapons, 1998 195 Aggravated assault, state, types of weapons, 1998 196 Offense analysis, 1998, and percent change from 1997 197 Type and value of property stolen and recovered, 1998 197
Section III. Crime Index Offenses Cleared 199 Narrative comments 199 Figures:
Tables: Offenses known and percent cleared by arrest, 1998:
Crimes cleared by arrest, 1998 200
Population group 201 Geographic region and division 203 Offense breakdown, population group 205
Offenses cleared by arrest of persons under 18 years of age, 1998 207
Section IV. Persons Arrested 209 Narrative comments 209 Tables:
Arrests, number and rate, 1998:
Total arrest trends:
Total arrests, 1998:
Arrests for drug abuse violations, 1998 209 Total estimated arrests, United States, 1998 210
Region 211 Population group 212
1989-1998 214 Sex, 1989-1998 215 1994-1998 216 Sex, 1994-1998 217 1997-1998 218 Sex, 1997-1998 219
Distribution by age 220 Male arrests, distribution by age 222 Female arrests, distribution by age 224
ix
Tables — Continued Page
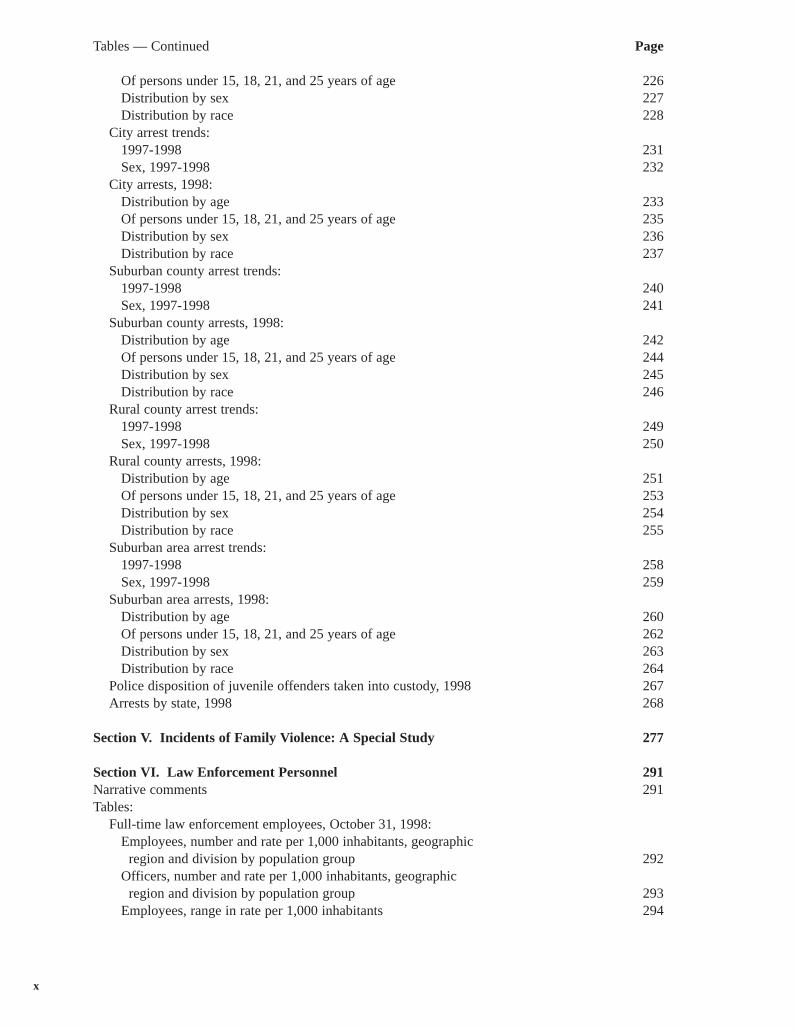
Of persons under 15, 18, 21, and 25 years of age 226 Distribution by sex 227 Distribution by race 228
City arrest trends: 1997-1998 231 Sex, 1997-1998 232
City arrests, 1998: Distribution by age 233 Of persons under 15, 18, 21, and 25 years of age 235 Distribution by sex 236 Distribution by race 237
Suburban county arrest trends: 1997-1998 240 Sex, 1997-1998 241
Suburban county arrests, 1998: Distribution by age 242 Of persons under 15, 18, 21, and 25 years of age 244 Distribution by sex 245 Distribution by race 246
Rural county arrest trends: 1997-1998 249 Sex, 1997-1998 250
Rural county arrests, 1998: Distribution by age 251 Of persons under 15, 18, 21, and 25 years of age 253 Distribution by sex 254 Distribution by race 255
Suburban area arrest trends: 1997-1998 258 Sex, 1997-1998 259
Suburban area arrests, 1998: Distribution by age 260 Of persons under 15, 18, 21, and 25 years of age 262 Distribution by sex 263 Distribution by race 264
Police disposition of juvenile offenders taken into custody, 1998 267 Arrests by state, 1998 268
Section V. Incidents of Family Violence: A Special Study 277
Section VI. Law Enforcement Personnel 291 Narrative comments 291 Tables:
Full-time law enforcement employees, October 31, 1998: Employees, number and rate per 1,000 inhabitants, geographic
region and division by population group 292 Officers, number and rate per 1,000 inhabitants, geographic
region and division by population group 293 Employees, range in rate per 1,000 inhabitants 294
x
Tables — Continued Page
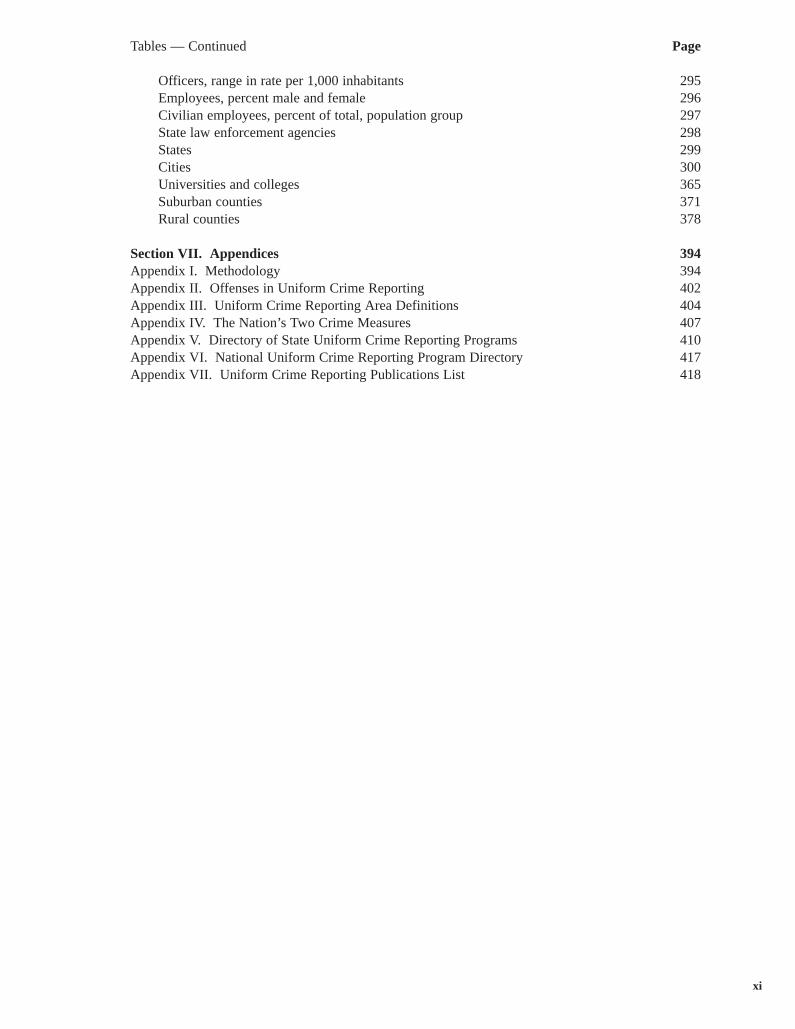
Officers, range in rate per 1,000 inhabitants 295 Employees, percent male and female 296 Civilian employees, percent of total, population group 297 State law enforcement agencies 298 States 299 Cities 300 Universities and colleges 365 Suburban counties 371 Rural counties 378
Section VII. Appendices 394 Appendix I. Methodology 394 Appendix II. Offenses in Uniform Crime Reporting 402 Appendix III. Uniform Crime Reporting Area Definitions 404 Appendix IV. The Nation’s Two Crime Measures 407 Appendix V. Directory of State Uniform Crime Reporting Programs 410 Appendix VI. National Uniform Crime Reporting Program Directory 417 Appendix VII. Uniform Crime Reporting Publications List 418
xi