cretaceous age, composition, and microstructure of pseudotachylyte in the otago schist, new zealand
TRANSCRIPT
This article was downloaded by: [Monash University Library]On: 17 September 2013, At: 08:30Publisher: Taylor & FrancisInforma Ltd Registered in England and Wales Registered Number: 1072954 Registered office: MortimerHouse, 37-41 Mortimer Street, London W1T 3JH, UK
New Zealand Journal of Geology and GeophysicsPublication details, including instructions for authors and subscription information:http://www.tandfonline.com/loi/tnzg20
Cretaceous age, composition, and microstructure ofpseudotachylyte in the Otago Schist, New ZealandShaun LL Barker a , Richard H Sibson a , J Michael Palin a , John D FitzGerald b , SteveReddy c , Laurence N Warr d & Ben A van der Pluijm ea Department of Geology, University of Otago, Dunedin, New Zealandb Research School of Earth Sciences, The Australian National University, Canberra, ACT,Australiac The Institute for Geological Research, Department of Applied Geology, CurtinUniversity of Technology, Perth, WA, Australiad Institute für Geographie und Geologie, Ernst Mortiz Arndt Universitaet Greifswald,Greifswald, Germanye Department of Geological Sciences, University of Michigan, Ann Arbor, USPublished online: 14 Apr 2010.
To cite this article: Shaun LL Barker , Richard H Sibson , J Michael Palin , John D FitzGerald , Steve Reddy , Laurence NWarr & Ben A van der Pluijm (2010) Cretaceous age, composition, and microstructure of pseudotachylyte in the OtagoSchist, New Zealand, New Zealand Journal of Geology and Geophysics, 53:1, 15-29, DOI: 10.1080/00288301003631764
To link to this article: http://dx.doi.org/10.1080/00288301003631764
PLEASE SCROLL DOWN FOR ARTICLE
Taylor & Francis makes every effort to ensure the accuracy of all the information (the “Content”) containedin the publications on our platform. However, Taylor & Francis, our agents, and our licensors make norepresentations or warranties whatsoever as to the accuracy, completeness, or suitability for any purpose ofthe Content. Any opinions and views expressed in this publication are the opinions and views of the authors,and are not the views of or endorsed by Taylor & Francis. The accuracy of the Content should not be reliedupon and should be independently verified with primary sources of information. Taylor and Francis shallnot be liable for any losses, actions, claims, proceedings, demands, costs, expenses, damages, and otherliabilities whatsoever or howsoever caused arising directly or indirectly in connection with, in relation to orarising out of the use of the Content.
This article may be used for research, teaching, and private study purposes. Any substantial or systematicreproduction, redistribution, reselling, loan, sub-licensing, systematic supply, or distribution in anyform to anyone is expressly forbidden. Terms & Conditions of access and use can be found at http://www.tandfonline.com/page/terms-and-conditions
Cretaceous age, composition, and microstructure of pseudotachylyte in the Otago Schist,
New Zealand
Shaun LL Barkera*$, Richard H Sibsona, J Michael Palina, John D FitzGeraldb, Steve Reddyc,
Laurence N Warrd and Ben A van der Pluijme
aDepartment of Geology, University of Otago, Dunedin, New Zealand; bResearch School of Earth Sciences, The Australian National University,Canberra, ACT, Australia; cThe Institute for Geological Research, Department of Applied Geology, Curtin University of Technology, Perth,WA, Australia; dInstitute fur Geographie und Geologie, Ernst Mortiz Arndt Universitaet Greifswald, Greifswald, Germany; eDepartment ofGeological Sciences, University of Michigan, Ann Arbor, US
(Received 23 June 2009; final version received 23 October 2009)
At Tucker Hill, in Central Otago, New Zealand, a series of pseudotachylyte veins are hosted in quartzofeldspathic schist. Chilledmargins, microlites, flow banding, and the crystallisation of mineral phases absent from the host rock provide unequivocalevidence for melting during pseudotachylyte formation. Whole rock analyses of pseudotachylyte reveal c. 3� enrichment ofK2O, Ba, and Rb, and similar depletion of Na2O, CaO, Sr, and Eu, as compared to host schist. Formation age ofpseudotachylyte is 95.991.8 Ma as measured by total fusion 40Ar/39Ar analyses. Stepwise heating of pseudotachylyte matrixyields an excellently defined 40Ar/39Ar plateau age of 96.090.3 Ma. These well-defined ages are attributed to the presence ofpotassium feldspar, low abundance of inherited lithic material from the host rock, and few fluid inclusions containing extraneous Ar.We propose that formation of these pseudotachylyte veins was related to Cretaceous extensional uplift and exhumation of theOtago Schist.
Keywords: pseudotachylyte; schist; Otago; Ar-Ar; geochronology; friction melting
Introduction
The presence of pseudotachylyte (former friction melt) in afault zone is commonly attributed to frictional melting ofrock during seismic slip (Sibson 1975). As such, pseudota-chylytes are valuable indicators that an exhumed fault zonewas seismically active. Pseudotachylytes have been describedfrom inactive, ancient fault zones (e.g., Outer HebridesFault Zone: Sibson 1975; Maddock 1983; Kelley et al. 1994)and present day seismically active fault zones (e.g., theAlpine Fault: Sibson et al. 1981; Bossiere 1991; Warr et al.2003). Determining the formation age of pseudotachylytecan reveal when a fault was seismically active, and provideinformation on the significance of a pseudotachylyte-bearing fault zone relative to the timing of other regionaldeformation events (Kelley et al. 1994; Magloughlin et al.2001; Sherlock & Hetzel 2001; Mueller et al. 2002; Warret al. 2003).In Central Otago, New Zealand, a series of pseudota-
chylyte veins are found in schist outcropping on Tucker Hill(1698 24?23??E; 458 15?16?S), near the township of Alexandra(Fig. 1). The pseudotachylyte veins are hosted in thegarnet-biotite-albite zone of the greenschist facies of theOtago Schist, which forms the basement rocks of much ofthe Otago region (Mortimer 1993a, b). Tucker Hill is
approximately 15 km to the east of the Cromwell GorgeShear Zone and approximately 20 km to the south of theRise and Shine Shear Zone, which are two Cretaceous ageextensional shear zones (Deckert et al. 2002).Previous studies that have attempted to determine the
age of pseudotachylyte utilising 40Ar/39Ar geochronology invarious localities have met with varying degrees of success.In particular, accurate and geologically meaningful40Ar/39Ar age determinations are negatively influenced bythe presence of variable amounts of inherited crystals (i.e.,incompletely melted) from host rocks (Magloughlin et al.2001; Warr et al. 2007), argon loss by diffusion or alteration(Davidson et al. 2003) or excess Ar in fluid inclusions(Di Vincenzo et al. 2004).In this study, we document the petrography and
geochemistry of pseudotachylyte veins, and present evidencefor the origin of these pseudotachylyte veins as a frictionmelt. In addition, we report laser ablation 40Ar/39Ar totalfusion, single-step infra-red laser heating ages, and stepwiseheated 40Ar/39Ar analyses of fragments of pseudotachylytematrix. Our results demonstrate excellent agreement be-tween both total fusion and stepwise heating 40Ar/39Argeochronology, which is attributed to the presence ofpotassium feldspar as the likely host for the majority of
*Corresponding author. Email: [email protected]$Present address: Department of Earth and Ocean Sciences, University of British Columbia, Vancouver, BC V6T1Z4, Canada
New Zealand Journal of Geology and GeophysicsVol. 53, No. 1, March 2010, 15�29
ISSN 0028-8306 print/ISSN 1175-8791 online
# 2010 The Royal Society of New Zealand
DOI: 10.1080/00288301003631764
http://www.informaworld.com
Dow
nloa
ded
by [
Mon
ash
Uni
vers
ity L
ibra
ry]
at 0
8:30
17
Sept
embe
r 20
13
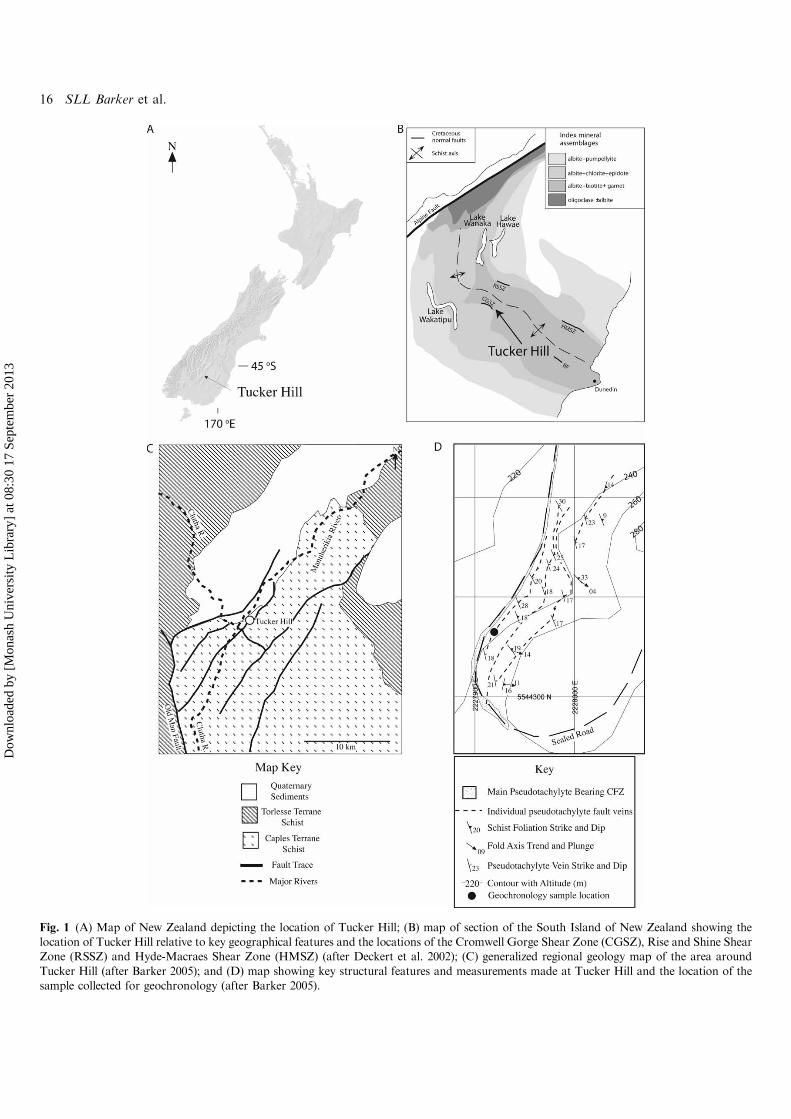
Fig. 1 (A) Map of New Zealand depicting the location of Tucker Hill; (B) map of section of the South Island of New Zealand showing thelocation of Tucker Hill relative to key geographical features and the locations of the Cromwell Gorge Shear Zone (CGSZ), Rise and Shine ShearZone (RSSZ) and Hyde-Macraes Shear Zone (HMSZ) (after Deckert et al. 2002); (C) generalized regional geology map of the area around
Tucker Hill (after Barker 2005); and (D) map showing key structural features and measurements made at Tucker Hill and the location of thesample collected for geochronology (after Barker 2005).
16 SLL Barker et al.
Dow
nloa
ded
by [
Mon
ash
Uni
vers
ity L
ibra
ry]
at 0
8:30
17
Sept
embe
r 20
13
argon, a lack of inherited lithic material from the host rock,and no significant alteration of the material selected for40Ar/39Ar analysis.
Geological setting
The structural setting of the pseudotachylyte veins at TuckerHill is described in Barker (2005). Briefly, more than 100pseudotachylyte veins are distributed throughout severalcataclastic fault zones. The largest of these fault zonesoccurs in shattered and incoherent schist and is�400 mlong, c. 5�10 m thick, and dips gently east with an unknownsense of displacement (Fig. 1D). In addition, several otherpseudotachylyte-bearing fault zones were mapped thatstrike NNW and dip east. The majority of pseudotachylyteveins lie subparallel to schist foliation (Fig. 1, 2), and dipgently towards the northeast. The length of fault veins ishighly variable, with most being between 1 and 10 m longandB2 cm thick. Slip-sense indicators, in the context of thepresent orientation of the veins, suggest that most veins havea top-to-the-north, normal sense of shear.The beginning of regional metamorphism for the Otago
Schist has been inferred at c. 199 Ma (Adams et al. 1985).Mortimer & Cooper (2004) suggest that the timing ofhighest grade metamorphic mineral growth in the OtagoSchist was during the Jurassic. Little et al. (1999) inferredthat peak metamorphism in the Otago Schist occurred in themiddle Jurassic (170�180 Ma) and that the Otago Schist washeld at mid-to-lower crustal depths until 135 Ma. There-after, exhumation occurred at 0.6�1 mm yr�1 (Little et al.1999). Uplift and exhumation of the schist was accompaniedby regional extension and the development of low-angleductile shear zones at 135�105 Ma (Deckert et al. 2002;Forster & Lister 2003). Continuing extension in the midCretaceous led to the development of brittle normal faultswith a NW/SE and NE/SW oriented orthogonal pattern(Craw & Norris 1991). Overlying volcanic sediments suggestthat deep levels of the Otago Schist had been exposed by themid-late Cretaceous (Adams & Raine 1988). Neitherthe Rise and Shine Shear Zone nor the Cromwell GorgeShear Zone displace the Waipounamu Erosion Surface(LeMasurier & Landis 1996), suggesting that shear zonedisplacement was complete by 105�85 Ma.Pseudotachylyte veins at Tucker Hill do not appear to
have any metamorphic overprint, and they crosscut allmetamorphic fabrics. The oldest apatite fission track agesfrom a nearby area (Tippett & Kamp 1993) suggest thatthese rocks were near the surface by c. 96�86 Ma. Thus, ageologically reasonable age for pseudotachylyte formation isconsidered to lie between 135 and 85 Ma.Several thick pseudotachylyte veins were collected in the
field, and three with unequivocal evidence for melting (e.g.,chill margins) were selected for geochemical analysis (thoserejected showed evidence for cataclasis, or were too small toprovide enough material for geochemical analyses). These
3 veins (University of Otago sample reference numbers
OU74171, OU 74172, and OU 74178, housed in the
Department of Geology collection, University of Otago)
were crushed and analysed for bulk rock by X-ray fluores-
cence (XRF) and laser ablation inductively coupled plasma
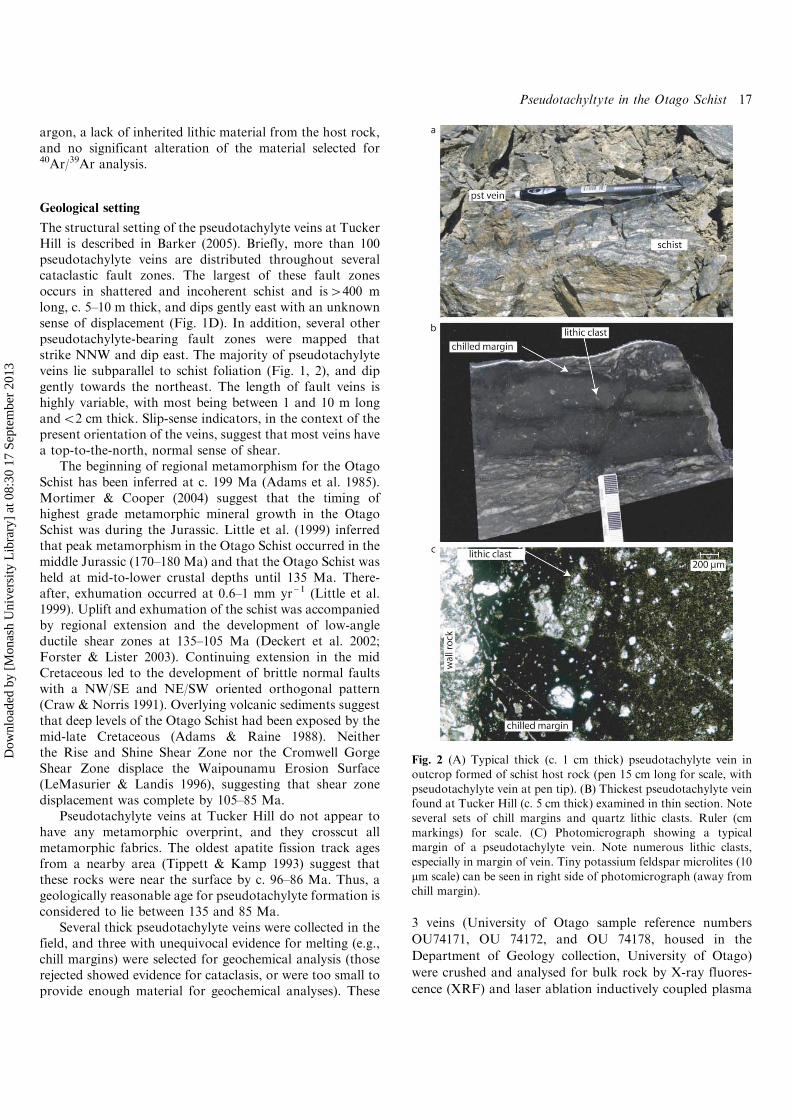
Fig. 2 (A) Typical thick (c. 1 cm thick) pseudotachylyte vein inoutcrop formed of schist host rock (pen 15 cm long for scale, with
pseudotachylyte vein at pen tip). (B) Thickest pseudotachylyte veinfound at Tucker Hill (c. 5 cm thick) examined in thin section. Noteseveral sets of chill margins and quartz lithic clasts. Ruler (cm
markings) for scale. (C) Photomicrograph showing a typicalmargin of a pseudotachylyte vein. Note numerous lithic clasts,especially in margin of vein. Tiny potassium feldspar microlites (10
mm scale) can be seen in right side of photomicrograph (away fromchill margin).
Pseudotachyltyte in the Otago Schist 17
Dow
nloa
ded
by [
Mon
ash
Uni
vers
ity L
ibra
ry]
at 0
8:30
17
Sept
embe
r 20
13
mass spectrometry (LA-ICP-MS). Additionally, Ar-Ar geo-chronology was performed both on an intact rock section(laser ablation) and selected fragments (stepwise heating) ofOU74171. Nine host schist samples were also chosen fromthe Tucker Hill field area for chemical comparison withpseudotachylyte. Fresh samples of schist were chosen i.e.,rocks with no macroscopic or microscopic evidence foralteration.
Analytical methods
XRF
Wall rock was trimmed from the edges of pseudotachylyteveins using a diamond saw and grindstone, and the veinswere then crushed in a tungsten carbide swing mill.Resulting powders were then turned into fused discs formajor element analysis. Trace element analyses were carriedout on pressed powder discs, using the procedures ofNorrish and Chappell (1967), and checked for accuracyusing a subset of international standards (Govindavaju1994). Analyses were conducted on a Phillips PW-2400Automated Sequential XRF Spectrometer in the Depart-ment of Geology, University of Otago.
LA-ICP-MS
One pseudotachylyte sample (OU 74171) and its adjacenthost rock (OU 74179) were chosen for LA-ICP-MS analysis.These samples were crushed in an agate swing mill and thenfused into glass. Analyses were carried out on an Agilent7500 quadrupole ICP-MS at the Research School of EarthSciences, The Australian National University. A pulsedLambola Physik LPX 1201 ArF excimer laser operated at aconstant energy, and a 5 Hz pulse rate was used to ablatematerial from the surface of the whole rock glass discs.A laser spot width of 70 mm was used during spot analysesof schist and pseudotachylyte fused whole rock samples.Data reduction followed established protocols for time-
resolved analysis (Longerich et al. 1996), using SiO2 as aninternal standard. Concentrations of SiO2 determined byXRF analyses for schist and pseudotachylyte were used forLA-ICP-MS data reduction. The NIST 612 standard (valuesof Pearce et al. 1997) was analysed before and after every sixanalyses for standardisation.
Electron microscopy
One transmission electron microscope (TEM) specimen wasprepared using standard petrographic thin section techni-ques, leading to extraction of a 3 mm diameter disc of rockand Argon-ion milling. Thin regions were dominantly foundin the chlorite-rich matrix areas of the specimen. Transmis-sion electron microscope observations were made at 300 kVusing a Philips CM300 TEM (1999) based at the ResearchSchool of Earth Sciences, Australian National University.
Scanning electron microscope (SEM) observations onpolished specimens were made on a Cambridge S360SEM (1987) in the Electron Microscope Unit, AustralianNational University.A whole rock powder X-ray diffraction (XRD) analysis
was carried out on one pseudotachylyte vein. X-raydiffraction was carried out with a SIEMENS D5005Bragg-Brentano diffractometer based in the Department ofGeology, Australian National University.
Ar-Ar geochronology
For laser ablation Ar-Ar geochronology, a thin section ofpseudotachylyte was examined and an area of matrix chosenand marked for analysis (e.g., an area free of lithic clasts).The sample was wrapped in aluminium foil and loaded intoan aluminium package along with biotite age standardHD-B1 (24.2190.32 Ma) to monitor the neutron fluxgradient of the reactor (McMaster University NuclearReactor, Hamilton, Canada).Argon analyses were undertaken at the Western
Australian Argon Isotope Facility, Curtin University ofTechnology, Perth. Argon data were collected by single step,total fusion infra-red laser heating of the thick polishedpseudotachylyte sample. A 110 W Spectron Laser Systems(CW-Nd-YAG laser, l�1064 nm) was used to fuseindividual c. 50 mm spots of the fault rock sample. Laseranalyses were attempted from fine-grained, clast-free areasof pseudotachylyte matrix. Gases released by fusion werereleased into a high sensitivity mass spectrometer (MAP215�50). Data were corrected for mass spectrometer dis-crimination and nuclear interference reactions. The J valuefor the irradiation was 0.00356590.000018. 40Ar/39Ar ageswere calculated using the decay constant of Steiger & Jaeger(1977).For ‘intact rock’ stepwise heating 40Ar/39Ar analysis,
selected fragments of pseudotachylyte matrix wereirradiated in the McMaster Nuclear Reactor (Canada).Unencapsulated samples were wrapped in aluminium foiland loaded into fused silica tubing for neutron irradiation.Encapsulated samples were analysed using the methoddescribed in Dong et al. (1995). The encapsulated sampleswere placed into fused silica breakseal tubes that weresubsequently evacuated to c. 5�10�8 Torr. The connectionsto the breakseals were then collapsed while under vacuum.After neutron irradiation, the capsules were placed into aglass manifold connected to the VG1200S mass spectro-meter at the University of Michigan. Upon breaking thefused silica vials, the recoil gas fraction can be analysed onthe mass spectrometer. All samples were step-heated usingthe defocused beam from a 5 W argon-ion continuous laser.Ages quoted are relative to an age of 27.99 Ma for standardbiotite FCT-3, which in turn is relative to an age of 520.4Ma for a standard hornblende MMhb-1 (Hall & Farrell1995).
18 SLL Barker et al.
Dow
nloa
ded
by [
Mon
ash
Uni
vers
ity L
ibra
ry]
at 0
8:30
17
Sept
embe
r 20
13
Sample descriptions
Host schist petrography
Schist (Fig. 2A) can be separated into two dominantlithologic components: quartz segregation bands and mela-nocratic bands. Segregation bands are composed of large,moderately to highly strained, quartz grains with minoralbitic plagioclase and rare muscovite, epidote, and chlorite.Melanocratic bands have a larger proportion of plagioclasethan quartz segregation bands, with muscovite, chlorite andepidote also present. More rarely, titanite (both meta-morphic and relict detrital grains), detrital zircon, apatite,and tourmaline are observed in melanocratic bands. Long,dusty streaks of fine-grained graphite occur in all schist thinsections.
Pseudotachylyte petrography
Macroscopically, lithic clasts of quartz (and minor schist)up to 5 mm are present within pseudotachylyte veins.Dark margins are noticeable at the edges of many thickpseudotachylyte veins, and one thick vein shows evidencefor repeated melt episodes with multiple sets of darkmargins and mutual crosscutting relations (Fig. 2). Threecomponents dominate the pseudotachylyte. These are: (1)lithic clasts � remnant mineral and rock fragments from schist(Fig. 2C); (2) grains that crystallised from the pseudotachylytemelt, which can be resolved by optical microscopy (�2 mm;Fig. 2C) and (3) fine-grained matrix (52 mm).Most lithic clasts within the pseudotachylytes are quartz
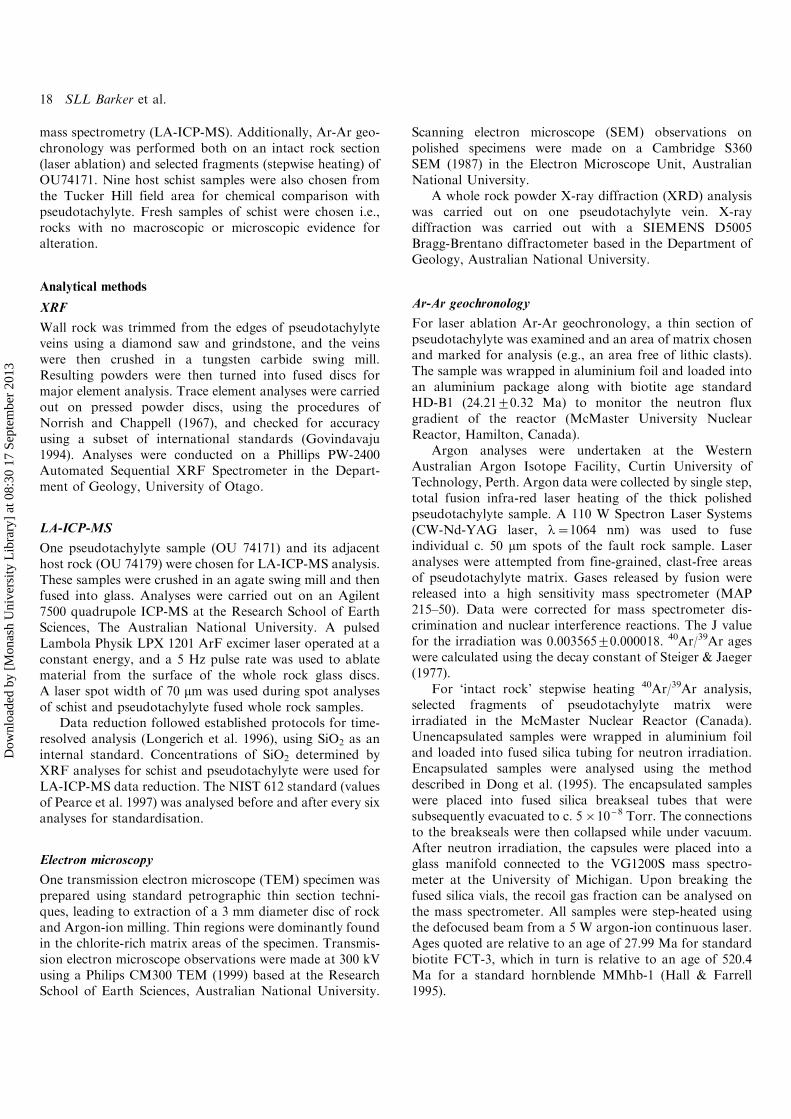
grains or aggregates, and are variable in size (2 mm to greaterthan 1 mm). Quartz lithic clasts are scattered relativelyuniformly throughout thin fault veins. In thick veins, quartzlithic clasts are most abundant within the dark margins.Small quartz clasts (B100 mm) are usually well rounded andintact. Larger quartz clasts are commonly more angularand contain fractures, some of which are filled with melt(Fig. 3A). Some quartz clasts display diffuse rims in bothoptical light microscopy and SEM (Fig. 3B). Small quartzclasts (B10 mm) are more commonly affected by suchrims than larger quartz grains. Quartz lithic clasts showrare embayments where melt has intruded them. Plagioclase(Fig. 3C), is a minor lithic clast in the pseudotachylytescompared to quartz, and its modal proportion is estimatedto beB1% of total pseudotachylyte volume.Small tabular crystals (typically 1�5 mm wide,
10�50 mm long) of potassium feldspar (characteristic XRDpeaks at 3.22, 3.26, and 3.27 A) occur in pseudotachylyteveins of width ]0.5 cm. Potassium feldspar microlites areabsent in the chill margins of veins, and become moreabundant towards the centres of veins (Fig. 1C, confirmedby electron diffraction in TEM). Measurements made usingEDS via the TEM suggest that the chemistry of potassiumfeldspar crystals changes little throughout the pseudotachy-lyte. Many quartz and plagioclase lithic clasts are radially
overgrown by potassium feldspar microlites, and potassium
feldspar infills small fractures in plagioclase lithic clasts.Chlorite forms the majority of matrix material between
potassium feldspar microlites (Fig. 3B, 3C, 4, 5). Selected
area electron diffraction of chlorite reveals characteristic
lattice spacing of 14 A. Ultra-fine grained chlorite occurs as
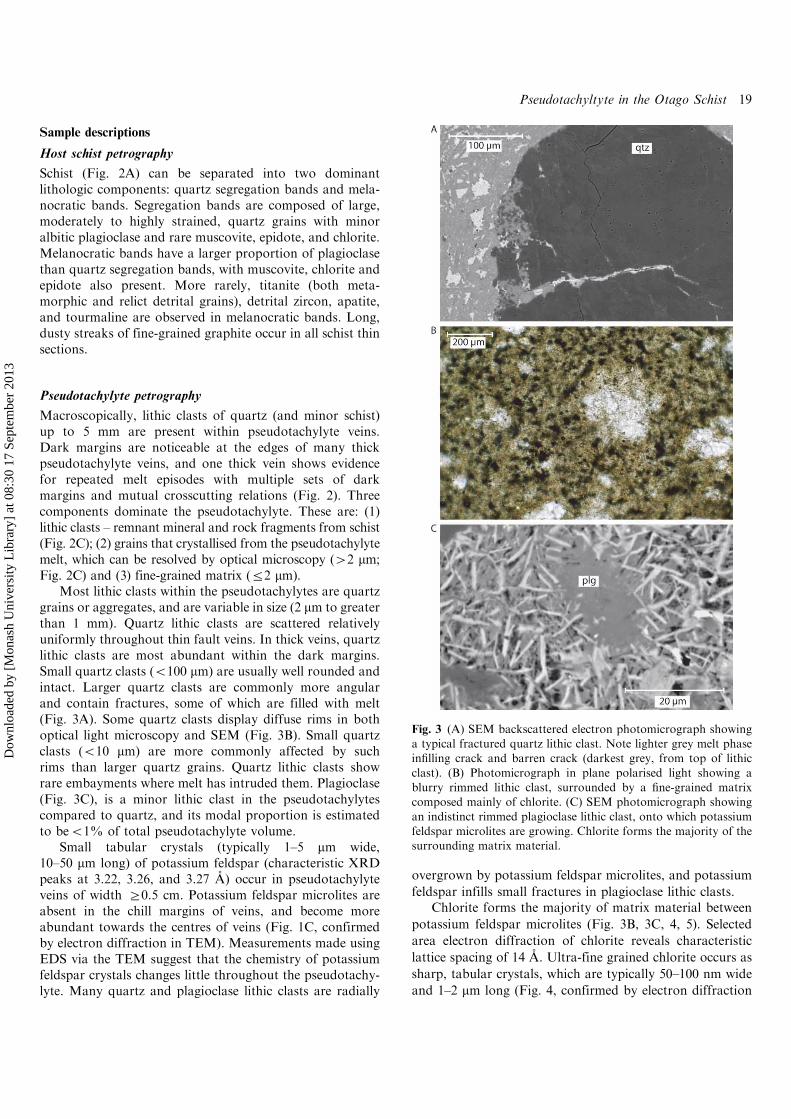
sharp, tabular crystals, which are typically 50�100 nm wideand 1�2 mm long (Fig. 4, confirmed by electron diffraction
Fig. 3 (A) SEM backscattered electron photomicrograph showinga typical fractured quartz lithic clast. Note lighter grey melt phaseinfilling crack and barren crack (darkest grey, from top of lithic
clast). (B) Photomicrograph in plane polarised light showing ablurry rimmed lithic clast, surrounded by a fine-grained matrixcomposed mainly of chlorite. (C) SEM photomicrograph showing
an indistinct rimmed plagioclase lithic clast, onto which potassiumfeldspar microlites are growing. Chlorite forms the majority of thesurrounding matrix material.
Pseudotachyltyte in the Otago Schist 19
Dow
nloa
ded
by [
Mon
ash
Uni
vers
ity L
ibra
ry]
at 0
8:30
17
Sept
embe
r 20
13
in TEM). We suggest that the chlorite crystallised from aformer glassy matrix.Spherical structures, here referred to as spheroids, are
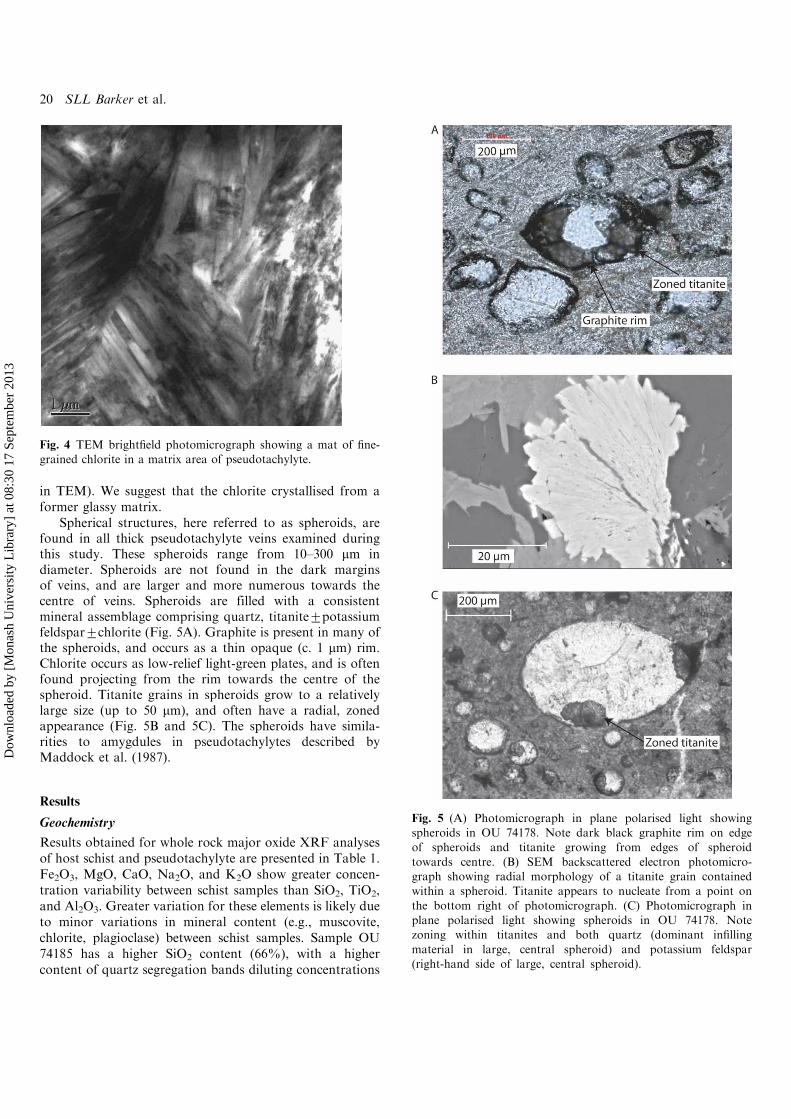
found in all thick pseudotachylyte veins examined duringthis study. These spheroids range from 10�300 mm indiameter. Spheroids are not found in the dark marginsof veins, and are larger and more numerous towards thecentre of veins. Spheroids are filled with a consistentmineral assemblage comprising quartz, titanite9potassiumfeldspar9chlorite (Fig. 5A). Graphite is present in many ofthe spheroids, and occurs as a thin opaque (c. 1 mm) rim.Chlorite occurs as low-relief light-green plates, and is oftenfound projecting from the rim towards the centre of thespheroid. Titanite grains in spheroids grow to a relativelylarge size (up to 50 mm), and often have a radial, zonedappearance (Fig. 5B and 5C). The spheroids have simila-rities to amygdules in pseudotachylytes described byMaddock et al. (1987).
Results
Geochemistry
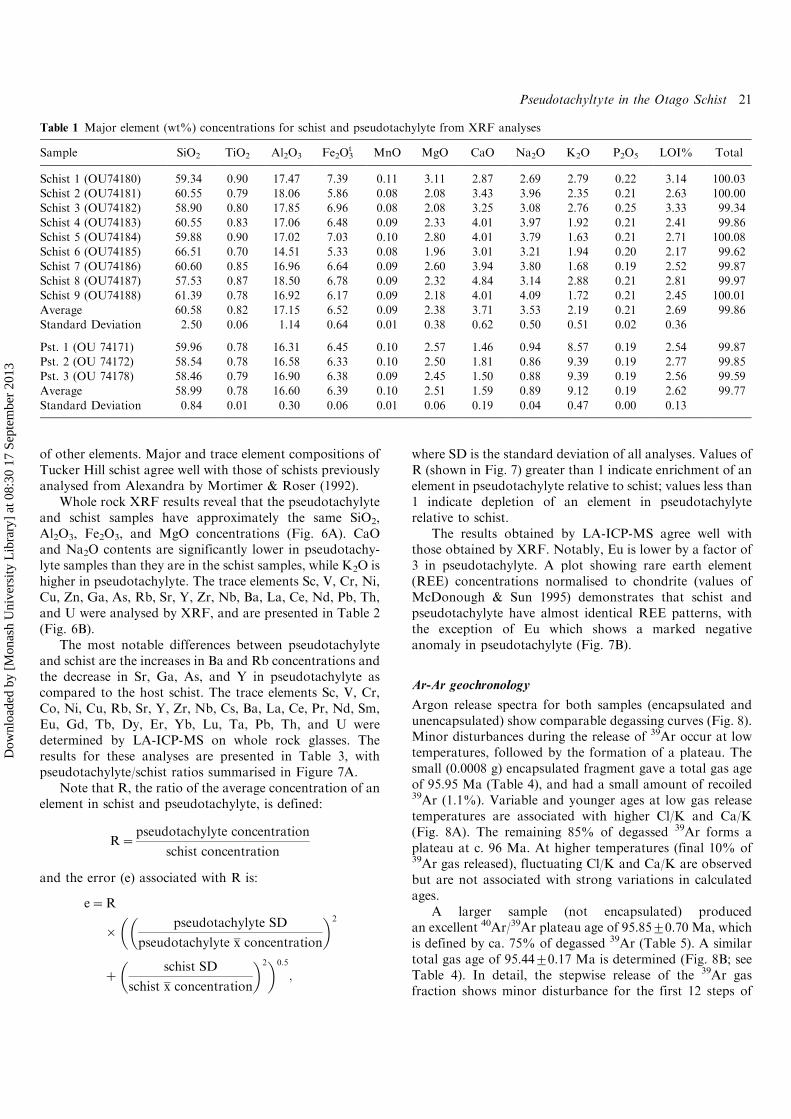
Results obtained for whole rock major oxide XRF analysesof host schist and pseudotachylyte are presented in Table 1.Fe2O3, MgO, CaO, Na2O, and K2O show greater concen-tration variability between schist samples than SiO2, TiO2,and Al2O3. Greater variation for these elements is likely dueto minor variations in mineral content (e.g., muscovite,chlorite, plagioclase) between schist samples. Sample OU74185 has a higher SiO2 content (66%), with a highercontent of quartz segregation bands diluting concentrations
Fig. 4 TEM brightfield photomicrograph showing a mat of fine-grained chlorite in a matrix area of pseudotachylyte.
Fig. 5 (A) Photomicrograph in plane polarised light showingspheroids in OU 74178. Note dark black graphite rim on edgeof spheroids and titanite growing from edges of spheroid
towards centre. (B) SEM backscattered electron photomicro-graph showing radial morphology of a titanite grain containedwithin a spheroid. Titanite appears to nucleate from a point on
the bottom right of photomicrograph. (C) Photomicrograph inplane polarised light showing spheroids in OU 74178. Notezoning within titanites and both quartz (dominant infilling
material in large, central spheroid) and potassium feldspar(right-hand side of large, central spheroid).
20 SLL Barker et al.
Dow
nloa
ded
by [
Mon
ash
Uni
vers
ity L
ibra
ry]
at 0
8:30
17
Sept
embe
r 20
13
of other elements. Major and trace element compositions ofTucker Hill schist agree well with those of schists previouslyanalysed from Alexandra by Mortimer & Roser (1992).Whole rock XRF results reveal that the pseudotachylyte
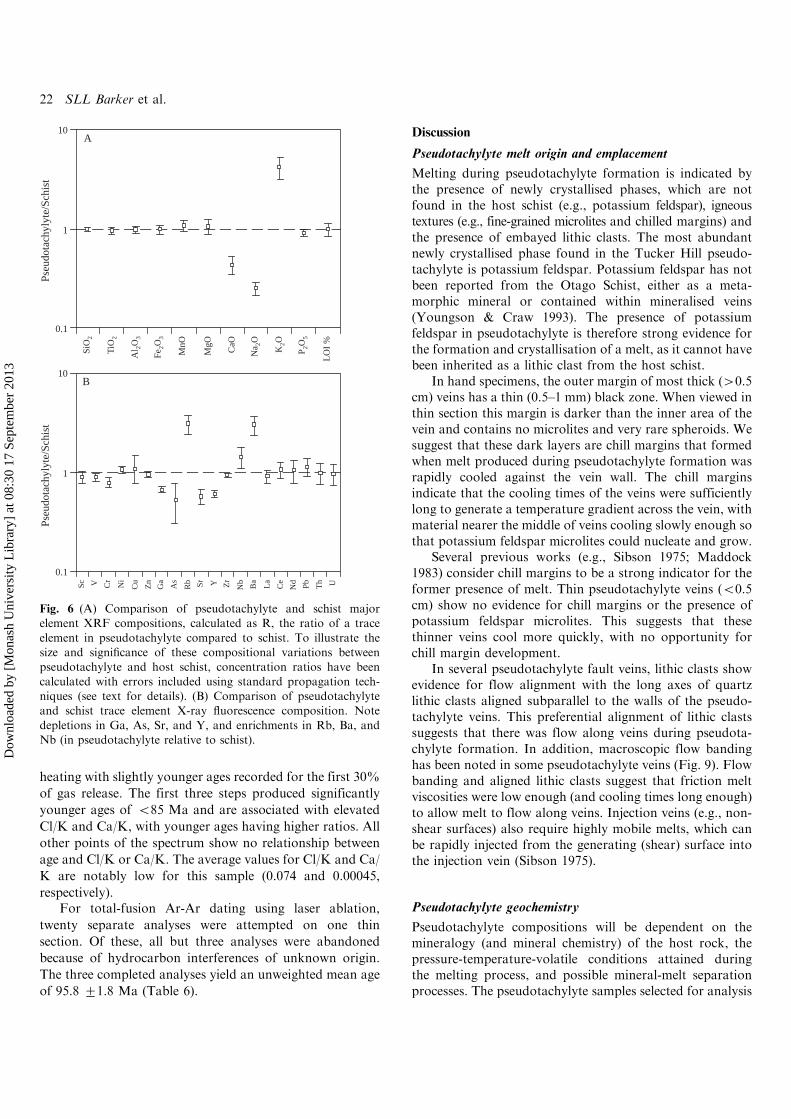
and schist samples have approximately the same SiO2,Al2O3, Fe2O3, and MgO concentrations (Fig. 6A). CaOand Na2O contents are significantly lower in pseudotachy-lyte samples than they are in the schist samples, while K2O ishigher in pseudotachylyte. The trace elements Sc, V, Cr, Ni,Cu, Zn, Ga, As, Rb, Sr, Y, Zr, Nb, Ba, La, Ce, Nd, Pb, Th,and U were analysed by XRF, and are presented in Table 2(Fig. 6B).The most notable differences between pseudotachylyte
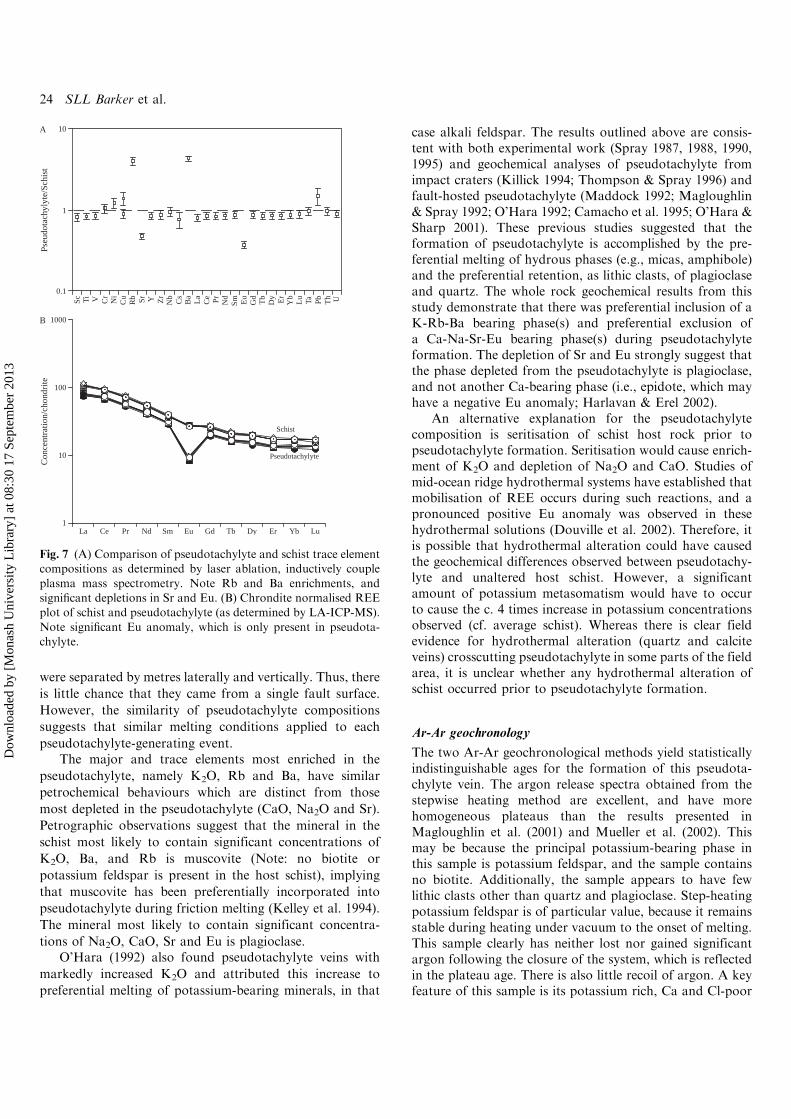
and schist are the increases in Ba and Rb concentrations andthe decrease in Sr, Ga, As, and Y in pseudotachylyte ascompared to the host schist. The trace elements Sc, V, Cr,Co, Ni, Cu, Rb, Sr, Y, Zr, Nb, Cs, Ba, La, Ce, Pr, Nd, Sm,Eu, Gd, Tb, Dy, Er, Yb, Lu, Ta, Pb, Th, and U weredetermined by LA-ICP-MS on whole rock glasses. Theresults for these analyses are presented in Table 3, withpseudotachylyte/schist ratios summarised in Figure 7A.Note that R, the ratio of the average concentration of an
element in schist and pseudotachylyte, is defined:
R�pseudotachylyte concentration
schist concentration
and the error (e) associated with R is:
e�R
���
pseudotachylyte SD
pseudotachylyte x concentration
�2
��
schist SD
schist x concentration
�2�0:5;
where SD is the standard deviation of all analyses. Values ofR (shown in Fig. 7) greater than 1 indicate enrichment of anelement in pseudotachylyte relative to schist; values less than1 indicate depletion of an element in pseudotachylyterelative to schist.The results obtained by LA-ICP-MS agree well with
those obtained by XRF. Notably, Eu is lower by a factor of3 in pseudotachylyte. A plot showing rare earth element(REE) concentrations normalised to chondrite (values ofMcDonough & Sun 1995) demonstrates that schist andpseudotachylyte have almost identical REE patterns, withthe exception of Eu which shows a marked negativeanomaly in pseudotachylyte (Fig. 7B).
Ar-Ar geochronology
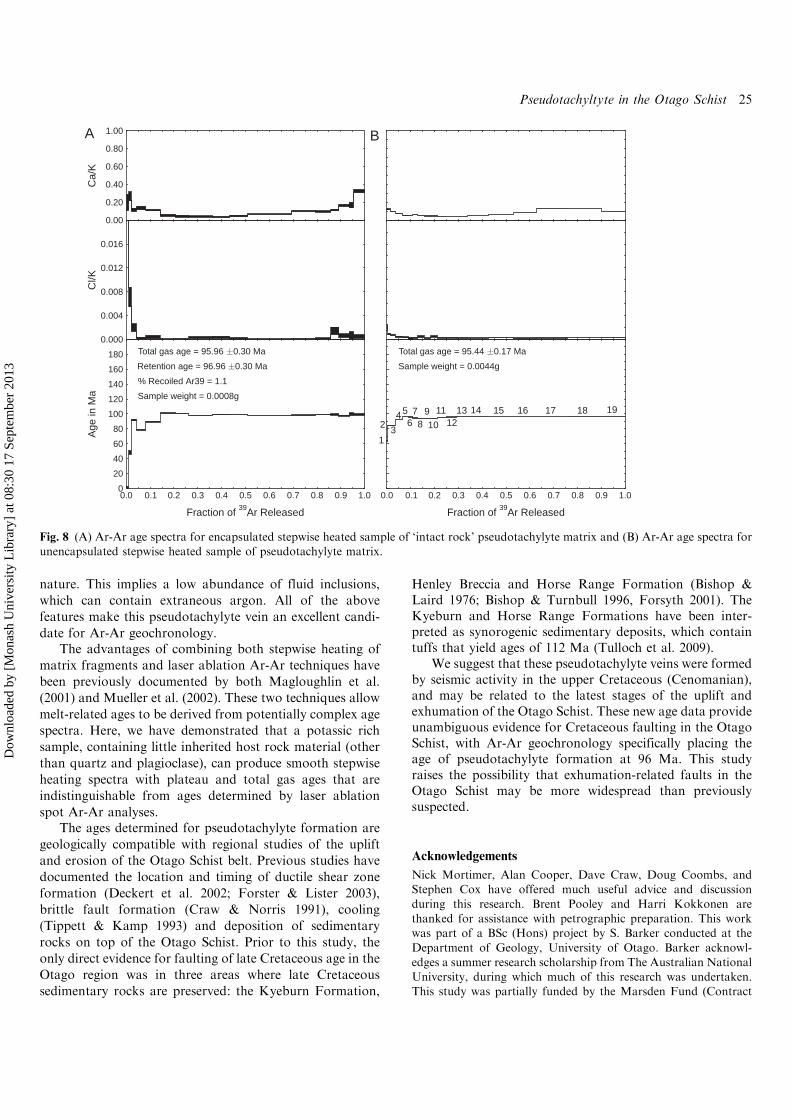
Argon release spectra for both samples (encapsulated andunencapsulated) show comparable degassing curves (Fig. 8).Minor disturbances during the release of 39Ar occur at lowtemperatures, followed by the formation of a plateau. Thesmall (0.0008 g) encapsulated fragment gave a total gas ageof 95.95 Ma (Table 4), and had a small amount of recoiled39Ar (1.1%). Variable and younger ages at low gas releasetemperatures are associated with higher Cl/K and Ca/K(Fig. 8A). The remaining 85% of degassed 39Ar forms aplateau at c. 96 Ma. At higher temperatures (final 10% of39Ar gas released), fluctuating Cl/K and Ca/K are observedbut are not associated with strong variations in calculatedages.A larger sample (not encapsulated) produced
an excellent 40Ar/39Ar plateau age of 95.8590.70 Ma, whichis defined by ca. 75% of degassed 39Ar (Table 5). A similartotal gas age of 95.4490.17 Ma is determined (Fig. 8B; seeTable 4). In detail, the stepwise release of the 39Ar gasfraction shows minor disturbance for the first 12 steps of
Table 1 Major element (wt%) concentrations for schist and pseudotachylyte from XRF analyses
Sample SiO2 TiO2 Al2O3 Fe2O3t MnO MgO CaO Na2O K2O P2O5 LOI% Total
Schist 1 (OU74180) 59.34 0.90 17.47 7.39 0.11 3.11 2.87 2.69 2.79 0.22 3.14 100.03Schist 2 (OU74181) 60.55 0.79 18.06 5.86 0.08 2.08 3.43 3.96 2.35 0.21 2.63 100.00Schist 3 (OU74182) 58.90 0.80 17.85 6.96 0.08 2.08 3.25 3.08 2.76 0.25 3.33 99.34
Schist 4 (OU74183) 60.55 0.83 17.06 6.48 0.09 2.33 4.01 3.97 1.92 0.21 2.41 99.86Schist 5 (OU74184) 59.88 0.90 17.02 7.03 0.10 2.80 4.01 3.79 1.63 0.21 2.71 100.08Schist 6 (OU74185) 66.51 0.70 14.51 5.33 0.08 1.96 3.01 3.21 1.94 0.20 2.17 99.62
Schist 7 (OU74186) 60.60 0.85 16.96 6.64 0.09 2.60 3.94 3.80 1.68 0.19 2.52 99.87Schist 8 (OU74187) 57.53 0.87 18.50 6.78 0.09 2.32 4.84 3.14 2.88 0.21 2.81 99.97Schist 9 (OU74188) 61.39 0.78 16.92 6.17 0.09 2.18 4.01 4.09 1.72 0.21 2.45 100.01
Average 60.58 0.82 17.15 6.52 0.09 2.38 3.71 3.53 2.19 0.21 2.69 99.86Standard Deviation 2.50 0.06 1.14 0.64 0.01 0.38 0.62 0.50 0.51 0.02 0.36
Pst. 1 (OU 74171) 59.96 0.78 16.31 6.45 0.10 2.57 1.46 0.94 8.57 0.19 2.54 99.87Pst. 2 (OU 74172) 58.54 0.78 16.58 6.33 0.10 2.50 1.81 0.86 9.39 0.19 2.77 99.85Pst. 3 (OU 74178) 58.46 0.79 16.90 6.38 0.09 2.45 1.50 0.88 9.39 0.19 2.56 99.59Average 58.99 0.78 16.60 6.39 0.10 2.51 1.59 0.89 9.12 0.19 2.62 99.77
Standard Deviation 0.84 0.01 0.30 0.06 0.01 0.06 0.19 0.04 0.47 0.00 0.13
Pseudotachyltyte in the Otago Schist 21
Dow
nloa
ded
by [
Mon
ash
Uni
vers
ity L
ibra
ry]
at 0
8:30
17
Sept
embe
r 20
13
heating with slightly younger ages recorded for the first 30%
of gas release. The first three steps produced significantly
younger ages of B85 Ma and are associated with elevated
Cl/K and Ca/K, with younger ages having higher ratios. All
other points of the spectrum show no relationship between
age and Cl/K or Ca/K. The average values for Cl/K and Ca/
K are notably low for this sample (0.074 and 0.00045,
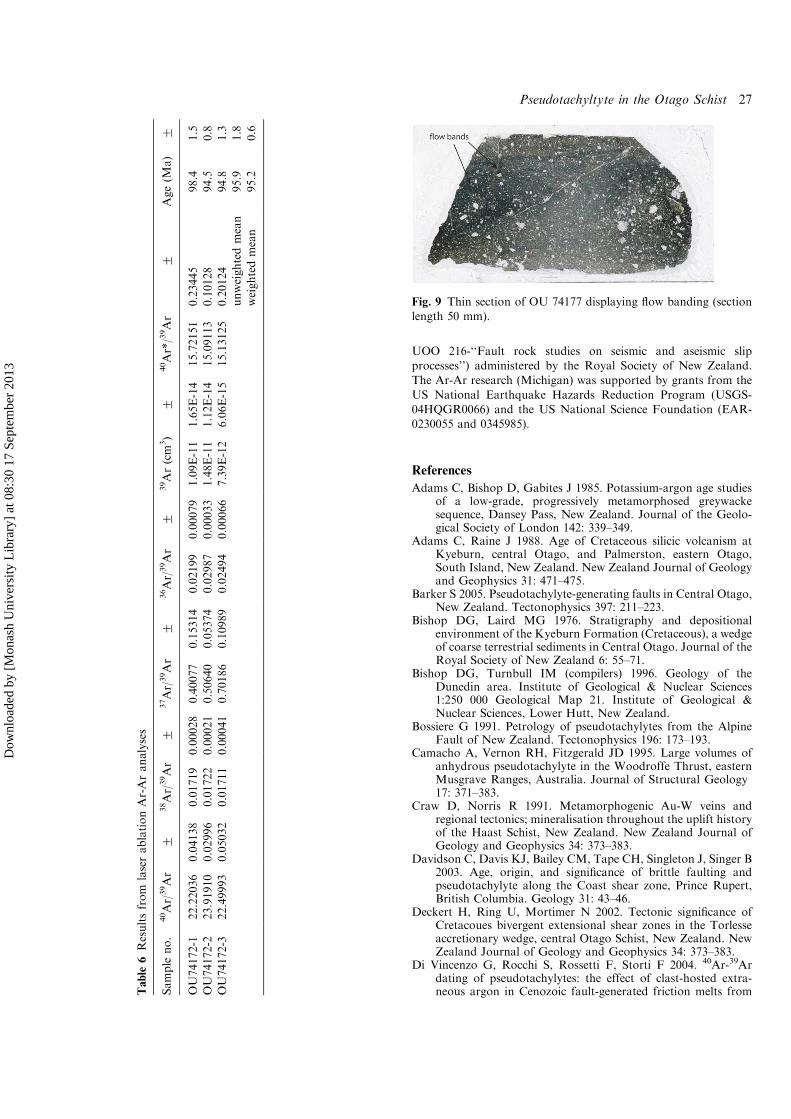
respectively).For total-fusion Ar-Ar dating using laser ablation,
twenty separate analyses were attempted on one thin
section. Of these, all but three analyses were abandoned
because of hydrocarbon interferences of unknown origin.
The three completed analyses yield an unweighted mean age
of 95.8 91.8 Ma (Table 6).
Discussion
Pseudotachylyte melt origin and emplacement
Melting during pseudotachylyte formation is indicated bythe presence of newly crystallised phases, which are notfound in the host schist (e.g., potassium feldspar), igneoustextures (e.g., fine-grained microlites and chilled margins) andthe presence of embayed lithic clasts. The most abundantnewly crystallised phase found in the Tucker Hill pseudo-tachylyte is potassium feldspar. Potassium feldspar has notbeen reported from the Otago Schist, either as a meta-morphic mineral or contained within mineralised veins(Youngson & Craw 1993). The presence of potassiumfeldspar in pseudotachylyte is therefore strong evidence forthe formation and crystallisation of a melt, as it cannot havebeen inherited as a lithic clast from the host schist.In hand specimens, the outer margin of most thick (�0.5
cm) veins has a thin (0.5�1 mm) black zone. When viewed inthin section this margin is darker than the inner area of thevein and contains no microlites and very rare spheroids. Wesuggest that these dark layers are chill margins that formedwhen melt produced during pseudotachylyte formation wasrapidly cooled against the vein wall. The chill marginsindicate that the cooling times of the veins were sufficientlylong to generate a temperature gradient across the vein, withmaterial nearer the middle of veins cooling slowly enough sothat potassium feldspar microlites could nucleate and grow.Several previous works (e.g., Sibson 1975; Maddock
1983) consider chill margins to be a strong indicator for theformer presence of melt. Thin pseudotachylyte veins (B0.5cm) show no evidence for chill margins or the presence ofpotassium feldspar microlites. This suggests that thesethinner veins cool more quickly, with no opportunity forchill margin development.In several pseudotachylyte fault veins, lithic clasts show
evidence for flow alignment with the long axes of quartzlithic clasts aligned subparallel to the walls of the pseudo-tachylyte veins. This preferential alignment of lithic clastssuggests that there was flow along veins during pseudota-chylyte formation. In addition, macroscopic flow bandinghas been noted in some pseudotachylyte veins (Fig. 9). Flowbanding and aligned lithic clasts suggest that friction meltviscosities were low enough (and cooling times long enough)to allow melt to flow along veins. Injection veins (e.g., non-shear surfaces) also require highly mobile melts, which canbe rapidly injected from the generating (shear) surface intothe injection vein (Sibson 1975).
Pseudotachylyte geochemistry
Pseudotachylyte compositions will be dependent on themineralogy (and mineral chemistry) of the host rock, thepressure-temperature-volatile conditions attained duringthe melting process, and possible mineral-melt separationprocesses. The pseudotachylyte samples selected for analysis
10
0.1
1
SiO
2
TiO
2
Al 2O
3
Fe2O
3
MnO
MgO
CaO
Na 2O
K2O
P 2O5
LO
I %
Pseu
dota
chyl
yte/
Schi
stPs
eudo
tach
ylyt
e/Sc
hist
10
0.1
1
Sc Ba
NbZrYRb SrAs
Ga
Zn
CuNi
CrV UThPbNd
Ce
La
A
B
Fig. 6 (A) Comparison of pseudotachylyte and schist majorelement XRF compositions, calculated as R, the ratio of a trace
element in pseudotachylyte compared to schist. To illustrate thesize and significance of these compositional variations betweenpseudotachylyte and host schist, concentration ratios have been
calculated with errors included using standard propagation tech-niques (see text for details). (B) Comparison of pseudotachylyteand schist trace element X-ray fluorescence composition. Note
depletions in Ga, As, Sr, and Y, and enrichments in Rb, Ba, andNb (in pseudotachylyte relative to schist).
22 SLL Barker et al.
Dow
nloa
ded
by [
Mon
ash
Uni
vers
ity L
ibra
ry]
at 0
8:30
17
Sept
embe
r 20
13
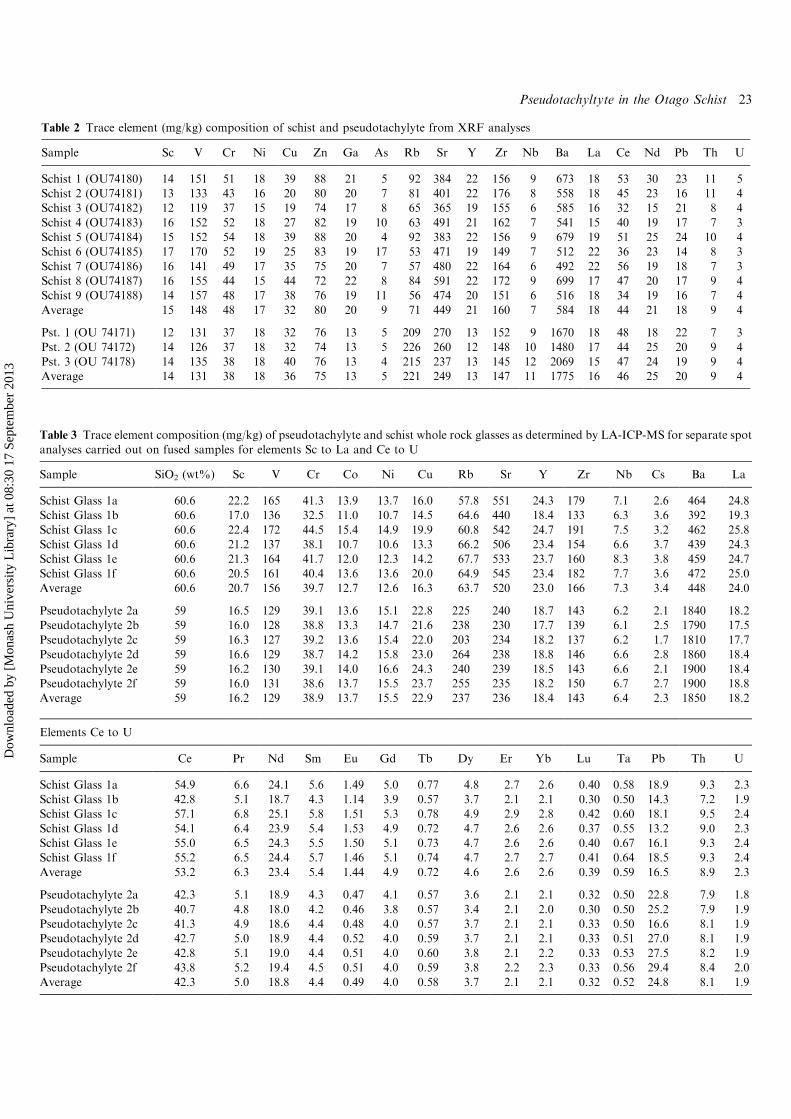
Table 2 Trace element (mg/kg) composition of schist and pseudotachylyte from XRF analyses
Sample Sc V Cr Ni Cu Zn Ga As Rb Sr Y Zr Nb Ba La Ce Nd Pb Th U
Schist 1 (OU74180) 14 151 51 18 39 88 21 5 92 384 22 156 9 673 18 53 30 23 11 5Schist 2 (OU74181) 13 133 43 16 20 80 20 7 81 401 22 176 8 558 18 45 23 16 11 4Schist 3 (OU74182) 12 119 37 15 19 74 17 8 65 365 19 155 6 585 16 32 15 21 8 4
Schist 4 (OU74183) 16 152 52 18 27 82 19 10 63 491 21 162 7 541 15 40 19 17 7 3Schist 5 (OU74184) 15 152 54 18 39 88 20 4 92 383 22 156 9 679 19 51 25 24 10 4Schist 6 (OU74185) 17 170 52 19 25 83 19 17 53 471 19 149 7 512 22 36 23 14 8 3
Schist 7 (OU74186) 16 141 49 17 35 75 20 7 57 480 22 164 6 492 22 56 19 18 7 3Schist 8 (OU74187) 16 155 44 15 44 72 22 8 84 591 22 172 9 699 17 47 20 17 9 4Schist 9 (OU74188) 14 157 48 17 38 76 19 11 56 474 20 151 6 516 18 34 19 16 7 4
Average 15 148 48 17 32 80 20 9 71 449 21 160 7 584 18 44 21 18 9 4
Pst. 1 (OU 74171) 12 131 37 18 32 76 13 5 209 270 13 152 9 1670 18 48 18 22 7 3
Pst. 2 (OU 74172) 14 126 37 18 32 74 13 5 226 260 12 148 10 1480 17 44 25 20 9 4Pst. 3 (OU 74178) 14 135 38 18 40 76 13 4 215 237 13 145 12 2069 15 47 24 19 9 4Average 14 131 38 18 36 75 13 5 221 249 13 147 11 1775 16 46 25 20 9 4
Table 3 Trace element composition (mg/kg) of pseudotachylyte and schist whole rock glasses as determined by LA-ICP-MS for separate spot
analyses carried out on fused samples for elements Sc to La and Ce to U
Sample SiO2 (wt%) Sc V Cr Co Ni Cu Rb Sr Y Zr Nb Cs Ba La
Schist Glass 1a 60.6 22.2 165 41.3 13.9 13.7 16.0 57.8 551 24.3 179 7.1 2.6 464 24.8Schist Glass 1b 60.6 17.0 136 32.5 11.0 10.7 14.5 64.6 440 18.4 133 6.3 3.6 392 19.3
Schist Glass 1c 60.6 22.4 172 44.5 15.4 14.9 19.9 60.8 542 24.7 191 7.5 3.2 462 25.8Schist Glass 1d 60.6 21.2 137 38.1 10.7 10.6 13.3 66.2 506 23.4 154 6.6 3.7 439 24.3Schist Glass 1e 60.6 21.3 164 41.7 12.0 12.3 14.2 67.7 533 23.7 160 8.3 3.8 459 24.7
Schist Glass 1f 60.6 20.5 161 40.4 13.6 13.6 20.0 64.9 545 23.4 182 7.7 3.6 472 25.0Average 60.6 20.7 156 39.7 12.7 12.6 16.3 63.7 520 23.0 166 7.3 3.4 448 24.0
Pseudotachylyte 2a 59 16.5 129 39.1 13.6 15.1 22.8 225 240 18.7 143 6.2 2.1 1840 18.2Pseudotachylyte 2b 59 16.0 128 38.8 13.3 14.7 21.6 238 230 17.7 139 6.1 2.5 1790 17.5Pseudotachylyte 2c 59 16.3 127 39.2 13.6 15.4 22.0 203 234 18.2 137 6.2 1.7 1810 17.7
Pseudotachylyte 2d 59 16.6 129 38.7 14.2 15.8 23.0 264 238 18.8 146 6.6 2.8 1860 18.4Pseudotachylyte 2e 59 16.2 130 39.1 14.0 16.6 24.3 240 239 18.5 143 6.6 2.1 1900 18.4Pseudotachylyte 2f 59 16.0 131 38.6 13.7 15.5 23.7 255 235 18.2 150 6.7 2.7 1900 18.8Average 59 16.2 129 38.9 13.7 15.5 22.9 237 236 18.4 143 6.4 2.3 1850 18.2
Elements Ce to U
Sample Ce Pr Nd Sm Eu Gd Tb Dy Er Yb Lu Ta Pb Th U
Schist Glass 1a 54.9 6.6 24.1 5.6 1.49 5.0 0.77 4.8 2.7 2.6 0.40 0.58 18.9 9.3 2.3Schist Glass 1b 42.8 5.1 18.7 4.3 1.14 3.9 0.57 3.7 2.1 2.1 0.30 0.50 14.3 7.2 1.9Schist Glass 1c 57.1 6.8 25.1 5.8 1.51 5.3 0.78 4.9 2.9 2.8 0.42 0.60 18.1 9.5 2.4
Schist Glass 1d 54.1 6.4 23.9 5.4 1.53 4.9 0.72 4.7 2.6 2.6 0.37 0.55 13.2 9.0 2.3Schist Glass 1e 55.0 6.5 24.3 5.5 1.50 5.1 0.73 4.7 2.6 2.6 0.40 0.67 16.1 9.3 2.4Schist Glass 1f 55.2 6.5 24.4 5.7 1.46 5.1 0.74 4.7 2.7 2.7 0.41 0.64 18.5 9.3 2.4
Average 53.2 6.3 23.4 5.4 1.44 4.9 0.72 4.6 2.6 2.6 0.39 0.59 16.5 8.9 2.3
Pseudotachylyte 2a 42.3 5.1 18.9 4.3 0.47 4.1 0.57 3.6 2.1 2.1 0.32 0.50 22.8 7.9 1.8
Pseudotachylyte 2b 40.7 4.8 18.0 4.2 0.46 3.8 0.57 3.4 2.1 2.0 0.30 0.50 25.2 7.9 1.9Pseudotachylyte 2c 41.3 4.9 18.6 4.4 0.48 4.0 0.57 3.7 2.1 2.1 0.33 0.50 16.6 8.1 1.9Pseudotachylyte 2d 42.7 5.0 18.9 4.4 0.52 4.0 0.59 3.7 2.1 2.1 0.33 0.51 27.0 8.1 1.9
Pseudotachylyte 2e 42.8 5.1 19.0 4.4 0.51 4.0 0.60 3.8 2.1 2.2 0.33 0.53 27.5 8.2 1.9Pseudotachylyte 2f 43.8 5.2 19.4 4.5 0.51 4.0 0.59 3.8 2.2 2.3 0.33 0.56 29.4 8.4 2.0Average 42.3 5.0 18.8 4.4 0.49 4.0 0.58 3.7 2.1 2.1 0.32 0.52 24.8 8.1 1.9
Pseudotachyltyte in the Otago Schist 23
Dow
nloa
ded
by [
Mon
ash
Uni
vers
ity L
ibra
ry]
at 0
8:30
17
Sept
embe
r 20
13
were separated by metres laterally and vertically. Thus, there
is little chance that they came from a single fault surface.
However, the similarity of pseudotachylyte compositions
suggests that similar melting conditions applied to each
pseudotachylyte-generating event.The major and trace elements most enriched in the
pseudotachylyte, namely K2O, Rb and Ba, have similar
petrochemical behaviours which are distinct from those
most depleted in the pseudotachylyte (CaO, Na2O and Sr).
Petrographic observations suggest that the mineral in the
schist most likely to contain significant concentrations of
K2O, Ba, and Rb is muscovite (Note: no biotite or
potassium feldspar is present in the host schist), implying
that muscovite has been preferentially incorporated into
pseudotachylyte during friction melting (Kelley et al. 1994).
The mineral most likely to contain significant concentra-
tions of Na2O, CaO, Sr and Eu is plagioclase.O’Hara (1992) also found pseudotachylyte veins with
markedly increased K2O and attributed this increase to
preferential melting of potassium-bearing minerals, in that
case alkali feldspar. The results outlined above are consis-tent with both experimental work (Spray 1987, 1988, 1990,1995) and geochemical analyses of pseudotachylyte fromimpact craters (Killick 1994; Thompson & Spray 1996) andfault-hosted pseudotachylyte (Maddock 1992; Magloughlin& Spray 1992; O’Hara 1992; Camacho et al. 1995; O’Hara &Sharp 2001). These previous studies suggested that theformation of pseudotachylyte is accomplished by the pre-ferential melting of hydrous phases (e.g., micas, amphibole)and the preferential retention, as lithic clasts, of plagioclaseand quartz. The whole rock geochemical results from thisstudy demonstrate that there was preferential inclusion of aK-Rb-Ba bearing phase(s) and preferential exclusion ofa Ca-Na-Sr-Eu bearing phase(s) during pseudotachylyteformation. The depletion of Sr and Eu strongly suggest thatthe phase depleted from the pseudotachylyte is plagioclase,and not another Ca-bearing phase (i.e., epidote, which mayhave a negative Eu anomaly; Harlavan & Erel 2002).An alternative explanation for the pseudotachylyte
composition is seritisation of schist host rock prior topseudotachylyte formation. Seritisation would cause enrich-ment of K2O and depletion of Na2O and CaO. Studies ofmid-ocean ridge hydrothermal systems have established thatmobilisation of REE occurs during such reactions, and apronounced positive Eu anomaly was observed in thesehydrothermal solutions (Douville et al. 2002). Therefore, itis possible that hydrothermal alteration could have causedthe geochemical differences observed between pseudotachy-lyte and unaltered host schist. However, a significantamount of potassium metasomatism would have to occurto cause the c. 4 times increase in potassium concentrationsobserved (cf. average schist). Whereas there is clear fieldevidence for hydrothermal alteration (quartz and calciteveins) crosscutting pseudotachylyte in some parts of the fieldarea, it is unclear whether any hydrothermal alteration ofschist occurred prior to pseudotachylyte formation.
Ar-Ar geochronology
The two Ar-Ar geochronological methods yield statisticallyindistinguishable ages for the formation of this pseudota-chylyte vein. The argon release spectra obtained from thestepwise heating method are excellent, and have morehomogeneous plateaus than the results presented inMagloughlin et al. (2001) and Mueller et al. (2002). Thismay be because the principal potassium-bearing phase inthis sample is potassium feldspar, and the sample containsno biotite. Additionally, the sample appears to have fewlithic clasts other than quartz and plagioclase. Step-heatingpotassium feldspar is of particular value, because it remainsstable during heating under vacuum to the onset of melting.This sample clearly has neither lost nor gained significantargon following the closure of the system, which is reflectedin the plateau age. There is also little recoil of argon. A keyfeature of this sample is its potassium rich, Ca and Cl-poor
Pseu
dota
chyl
yte/
Schi
st
10
0.1
1
Sc Ba
NbZrYRb SrCuNi
CrV UTh
PbNd
Ce
La
TaCs
Lu
YbEr
Dy
Tb
Gd
Eu
SmPrTi
La Ce Pr Nd Sm Eu Gd Tb Dy Er Yb Lu
10
100
1000
Con
cent
ratio
n/ch
ondr
ite
Schist
Pseudotachylyte
1
A
B
Fig. 7 (A) Comparison of pseudotachylyte and schist trace elementcompositions as determined by laser ablation, inductively couple
plasma mass spectrometry. Note Rb and Ba enrichments, andsignificant depletions in Sr and Eu. (B) Chrondite normalised REEplot of schist and pseudotachylyte (as determined by LA-ICP-MS).
Note significant Eu anomaly, which is only present in pseudota-chylyte.
24 SLL Barker et al.
Dow
nloa
ded
by [
Mon
ash
Uni
vers
ity L
ibra
ry]
at 0
8:30
17
Sept
embe
r 20
13
nature. This implies a low abundance of fluid inclusions,
which can contain extraneous argon. All of the above
features make this pseudotachylyte vein an excellent candi-
date for Ar-Ar geochronology.The advantages of combining both stepwise heating of
matrix fragments and laser ablation Ar-Ar techniques have
been previously documented by both Magloughlin et al.
(2001) and Mueller et al. (2002). These two techniques allow
melt-related ages to be derived from potentially complex age
spectra. Here, we have demonstrated that a potassic rich
sample, containing little inherited host rock material (other
than quartz and plagioclase), can produce smooth stepwise
heating spectra with plateau and total gas ages that are
indistinguishable from ages determined by laser ablation
spot Ar-Ar analyses.The ages determined for pseudotachylyte formation are
geologically compatible with regional studies of the uplift
and erosion of the Otago Schist belt. Previous studies have
documented the location and timing of ductile shear zone
formation (Deckert et al. 2002; Forster & Lister 2003),
brittle fault formation (Craw & Norris 1991), cooling
(Tippett & Kamp 1993) and deposition of sedimentary
rocks on top of the Otago Schist. Prior to this study, the
only direct evidence for faulting of late Cretaceous age in the
Otago region was in three areas where late Cretaceous
sedimentary rocks are preserved: the Kyeburn Formation,
Henley Breccia and Horse Range Formation (Bishop &Laird 1976; Bishop & Turnbull 1996, Forsyth 2001). TheKyeburn and Horse Range Formations have been inter-preted as synorogenic sedimentary deposits, which containtuffs that yield ages of 112 Ma (Tulloch et al. 2009).We suggest that these pseudotachylyte veins were formed
by seismic activity in the upper Cretaceous (Cenomanian),and may be related to the latest stages of the uplift andexhumation of the Otago Schist. These new age data provideunambiguous evidence for Cretaceous faulting in the OtagoSchist, with Ar-Ar geochronology specifically placing theage of pseudotachylyte formation at 96 Ma. This studyraises the possibility that exhumation-related faults in theOtago Schist may be more widespread than previouslysuspected.
Acknowledgements
Nick Mortimer, Alan Cooper, Dave Craw, Doug Coombs, andStephen Cox have offered much useful advice and discussion
during this research. Brent Pooley and Harri Kokkonen arethanked for assistance with petrographic preparation. This workwas part of a BSc (Hons) project by S. Barker conducted at the
Department of Geology, University of Otago. Barker acknowl-edges a summer research scholarship from The Australian NationalUniversity, during which much of this research was undertaken.This study was partially funded by the Marsden Fund (Contract
0.0 0.1 0.2 0.3 0.4 0.5 0.6 0.7 0.8 0.9 1.00
20
40
60
80
100
120
140
160
180
Age
in M
a
0.000
0.004
0.008
0.012
0.016
Cl/K
0.00
0.20
0.40
0.60
0.80
1.00
Ca/
K
0.0 0.1 0.2 0.3 0.4 0.5 0.6 0.7 0.8 0.9 1.0
Fraction of 39Ar Released Fraction of 39Ar Released
Total gas age = 95.96 0.30 Ma
Retention age = 96.96 0.30 Ma
% Recoiled Ar39 = 1.1
Sample weight = 0.0008g
Total gas age = 95.44 0.17 Ma
Sample weight = 0.0044g
1
23
45678
910
1112
13 14 15 16 17 18 19
A B
Fig. 8 (A) Ar-Ar age spectra for encapsulated stepwise heated sample of ‘intact rock’ pseudotachylyte matrix and (B) Ar-Ar age spectra forunencapsulated stepwise heated sample of pseudotachylyte matrix.
Pseudotachyltyte in the Otago Schist 25
Dow
nloa
ded
by [
Mon
ash
Uni
vers
ity L
ibra
ry]
at 0
8:30
17
Sept
embe
r 20
13
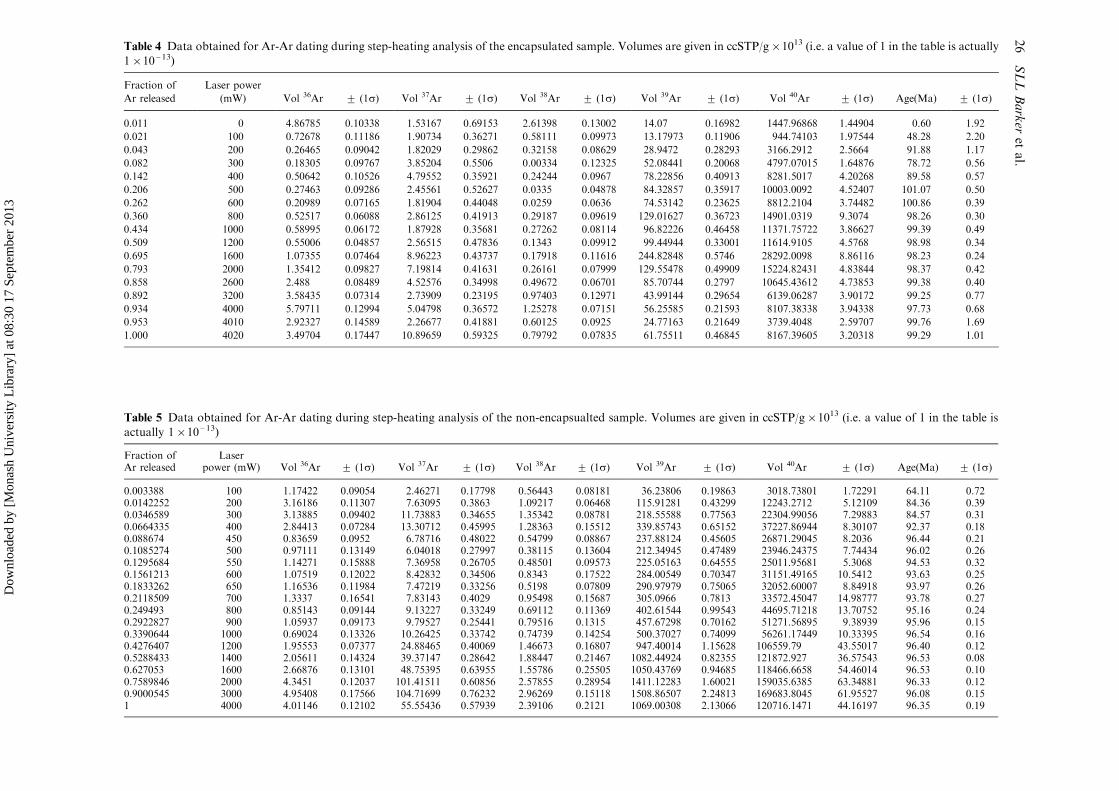
Table 4 Data obtained for Ar-Ar dating during step-heating analysis of the encapsulated sample. Volumes are given in ccSTP/g�1013 (i.e. a value of 1 in the table is actually1�10�13)
Fraction of
Ar released
Laser power
(mW) Vol 36Ar 9 (1s) Vol 37Ar 9 (1s) Vol 38Ar 9 (1s) Vol 39Ar 9 (1s) Vol 40Ar 9 (1s) Age(Ma) 9 (1s)
0.011 0 4.86785 0.10338 1.53167 0.69153 2.61398 0.13002 14.07 0.16982 1447.96868 1.44904 0.60 1.92
0.021 100 0.72678 0.11186 1.90734 0.36271 0.58111 0.09973 13.17973 0.11906 944.74103 1.97544 48.28 2.20
0.043 200 0.26465 0.09042 1.82029 0.29862 0.32158 0.08629 28.9472 0.28293 3166.2912 2.5664 91.88 1.17
0.082 300 0.18305 0.09767 3.85204 0.5506 0.00334 0.12325 52.08441 0.20068 4797.07015 1.64876 78.72 0.56
0.142 400 0.50642 0.10526 4.79552 0.35921 0.24244 0.0967 78.22856 0.40913 8281.5017 4.20268 89.58 0.57
0.206 500 0.27463 0.09286 2.45561 0.52627 0.0335 0.04878 84.32857 0.35917 10003.0092 4.52407 101.07 0.50
0.262 600 0.20989 0.07165 1.81904 0.44048 0.0259 0.0636 74.53142 0.23625 8812.2104 3.74482 100.86 0.39
0.360 800 0.52517 0.06088 2.86125 0.41913 0.29187 0.09619 129.01627 0.36723 14901.0319 9.3074 98.26 0.30
0.434 1000 0.58995 0.06172 1.87928 0.35681 0.27262 0.08114 96.82226 0.46458 11371.75722 3.86627 99.39 0.49
0.509 1200 0.55006 0.04857 2.56515 0.47836 0.1343 0.09912 99.44944 0.33001 11614.9105 4.5768 98.98 0.34
0.695 1600 1.07355 0.07464 8.96223 0.43737 0.17918 0.11616 244.82848 0.5746 28292.0098 8.86116 98.23 0.24
0.793 2000 1.35412 0.09827 7.19814 0.41631 0.26161 0.07999 129.55478 0.49909 15224.82431 4.83844 98.37 0.42
0.858 2600 2.488 0.08489 4.52576 0.34998 0.49672 0.06701 85.70744 0.2797 10645.43612 4.73853 99.38 0.40
0.892 3200 3.58435 0.07314 2.73909 0.23195 0.97403 0.12971 43.99144 0.29654 6139.06287 3.90172 99.25 0.77
0.934 4000 5.79711 0.12994 5.04798 0.36572 1.25278 0.07151 56.25585 0.21593 8107.38338 3.94338 97.73 0.68
0.953 4010 2.92327 0.14589 2.26677 0.41881 0.60125 0.0925 24.77163 0.21649 3739.4048 2.59707 99.76 1.69
1.000 4020 3.49704 0.17447 10.89659 0.59325 0.79792 0.07835 61.75511 0.46845 8167.39605 3.20318 99.29 1.01
Table 5 Data obtained for Ar-Ar dating during step-heating analysis of the non-encapsualted sample. Volumes are given in ccSTP/g�1013 (i.e. a value of 1 in the table isactually 1�10�13)
Fraction ofAr released
Laserpower (mW) Vol 36Ar 9 (1s) Vol 37Ar 9 (1s) Vol 38Ar 9 (1s) Vol 39Ar 9 (1s) Vol 40Ar 9 (1s) Age(Ma) 9 (1s)
0.003388 100 1.17422 0.09054 2.46271 0.17798 0.56443 0.08181 36.23806 0.19863 3018.73801 1.72291 64.11 0.720.0142252 200 3.16186 0.11307 7.63095 0.3863 1.09217 0.06468 115.91281 0.43299 12243.2712 5.12109 84.36 0.390.0346589 300 3.13885 0.09402 11.73883 0.34655 1.35342 0.08781 218.55588 0.77563 22304.99056 7.29883 84.57 0.310.0664335 400 2.84413 0.07284 13.30712 0.45995 1.28363 0.15512 339.85743 0.65152 37227.86944 8.30107 92.37 0.180.088674 450 0.83659 0.0952 6.78716 0.48022 0.54799 0.08867 237.88124 0.45605 26871.29045 8.2036 96.44 0.210.1085274 500 0.97111 0.13149 6.04018 0.27997 0.38115 0.13604 212.34945 0.47489 23946.24375 7.74434 96.02 0.260.1295684 550 1.14271 0.15888 7.36958 0.26705 0.48501 0.09573 225.05163 0.64555 25011.95681 5.3068 94.53 0.320.1561213 600 1.07519 0.12022 8.42832 0.34506 0.8343 0.17522 284.00549 0.70347 31151.49165 10.5412 93.63 0.250.1833262 650 1.16536 0.11984 7.47219 0.33256 0.5198 0.07809 290.97979 0.75065 32052.60007 8.84918 93.97 0.260.2118509 700 1.3337 0.16541 7.83143 0.4029 0.95498 0.15687 305.0966 0.7813 33572.45047 14.98777 93.78 0.270.249493 800 0.85143 0.09144 9.13227 0.33249 0.69112 0.11369 402.61544 0.99543 44695.71218 13.70752 95.16 0.240.2922827 900 1.05937 0.09173 9.79527 0.25441 0.79516 0.1315 457.67298 0.70162 51271.56895 9.38939 95.96 0.150.3390644 1000 0.69024 0.13326 10.26425 0.33742 0.74739 0.14254 500.37027 0.74099 56261.17449 10.33395 96.54 0.160.4276407 1200 1.95553 0.07377 24.88465 0.40069 1.46673 0.16807 947.40014 1.15628 106559.79 43.55017 96.40 0.120.5288433 1400 2.05611 0.14324 39.37147 0.28642 1.88447 0.21467 1082.44924 0.82355 121872.927 36.57543 96.53 0.080.627053 1600 2.66876 0.13101 48.75395 0.63955 1.55786 0.25505 1050.43769 0.94685 118466.6658 54.46014 96.53 0.100.7589846 2000 4.3451 0.12037 101.41511 0.60856 2.57855 0.28954 1411.12283 1.60021 159035.6385 63.34881 96.33 0.120.9000545 3000 4.95408 0.17566 104.71699 0.76232 2.96269 0.15118 1508.86507 2.24813 169683.8045 61.95527 96.08 0.151 4000 4.01146 0.12102 55.55436 0.57939 2.39106 0.2121 1069.00308 2.13066 120716.1471 44.16197 96.35 0.19
26
SLLBarkeretal.
Dow
nloa
ded
by [
Mon
ash
Uni
vers
ity L
ibra
ry]
at 0
8:30
17
Sept
embe
r 20
13
UOO 216-‘‘Fault rock studies on seismic and aseismic slipprocesses’’) administered by the Royal Society of New Zealand.The Ar-Ar research (Michigan) was supported by grants from the
US National Earthquake Hazards Reduction Program (USGS-04HQGR0066) and the US National Science Foundation (EAR-0230055 and 0345985).
References
Adams C, Bishop D, Gabites J 1985. Potassium-argon age studiesof a low-grade, progressively metamorphosed greywackesequence, Dansey Pass, New Zealand. Journal of the Geolo-gical Society of London /142: 339�349.
Adams C, Raine J 1988. Age of Cretaceous silicic volcanism atKyeburn, central Otago, and Palmerston, eastern Otago,South Island, New Zealand. New Zealand Journal of Geologyand Geophysics /31: 471�475.
Barker S 2005. Pseudotachylyte-generating faults in Central Otago,New Zealand. Tectonophysics /397: 211�223.
Bishop DG, Laird MG 1976. Stratigraphy and depositionalenvironment of the Kyeburn Formation (Cretaceous), a wedgeof coarse terrestrial sediments in Central Otago. Journal of theRoyal Society of New Zealand /6: 55�71.
Bishop DG, Turnbull IM (compilers) 1996. Geology of theDunedin area. Institute of Geological & Nuclear Sciences1:250 000 Geological Map 21. Institute of Geological &Nuclear Sciences, Lower Hutt, New Zealand.
Bossiere G 1991. Petrology of pseudotachylytes from the AlpineFault of New Zealand. Tectonophysics /196: 173�193.
Camacho A, Vernon RH, Fitzgerald JD 1995. Large volumes ofanhydrous pseudotachylyte in the Woodroffe Thrust, easternMusgrave Ranges, Australia. Journal of Structural Geology /
17: 371�383.Craw D, Norris R 1991. Metamorphogenic Au-W veins and
regional tectonics; mineralisation throughout the uplift historyof the Haast Schist, New Zealand. New Zealand Journal ofGeology and Geophysics /34: 373�383.
Davidson C, Davis KJ, Bailey CM, Tape CH, Singleton J, Singer B2003. Age, origin, and significance of brittle faulting andpseudotachylyte along the Coast shear zone, Prince Rupert,British Columbia. Geology /31: 43�46.
Deckert H, Ring U, Mortimer N 2002. Tectonic significance ofCretacoues bivergent extensional shear zones in the Torlesseaccretionary wedge, central Otago Schist, New Zealand. NewZealand Journal of Geology and Geophysics /34: 373�383.
Di Vincenzo G, Rocchi S, Rossetti F, Storti F 2004. 40Ar-39Ardating of pseudotachylytes: the effect of clast-hosted extra-neous argon in Cenozoic fault-generated friction melts fromT
able6ResultsfromlaserablationAr-Aranalyses
Sampleno.
40Ar/39Ar
938Ar/39Ar
937Ar/39Ar
936Ar/39Ar
939Ar(cm3)
940Ar*/39Ar
9Age(Ma)
9
OU74172-1
22.220360.04138
0.017190.000280.40077
0.15314
0.02199
0.00079
1.09E-11
1.65E-14
15.72151
0.23445
98.4
1.5
OU74172-2
23.919100.02996
0.017220.000210.50640
0.05374
0.02987
0.00033
1.48E-11
1.12E-14
15.09113
0.10128
94.5
0.8
OU74172-3
22.499930.05032
0.017110.000410.70186
0.10989
0.02494
0.00066
7.39E-12
6.06E-15
15.13125
0.20124
94.8
1.3
unweightedmean
95.9
1.8
weightedmean
95.2
0.6
Fig. 9 Thin section of OU 74177 displaying flow banding (sectionlength 50 mm).
Pseudotachyltyte in the Otago Schist 27
Dow
nloa
ded
by [
Mon
ash
Uni
vers
ity L
ibra
ry]
at 0
8:30
17
Sept
embe
r 20
13
the West Antarctic Rift System. Earth and Planetary ScienceLetters /223: 349�364.
Dong H, Hall C, Peacor D, Halliday A 1995. Mechanisms of argonretention in clays revealed by laser 40Ar/39Ar dating. Science /
267: 355�359.Douville E, Charlou L, Oelkers EH, Bienvenu P, Jove Colon CF,
Donval JP, Fouquet Y, Prieur D, Appriou P 2002. TheRainbow Vent fluids (36 degrees 14?N, MAR); the influence ofultramafic rocks and phase separation on trace metal contentin Mid-Atlantic Ridge hydrothermal fluids. Chemical Geology/184: 37�48.
Forster M, Lister G 2003. Cretaceous metamorphic core complexesin the Otago Schist, New Zealand. Australian Journal of EarthSciences /50: 181�198.
Forsyth PJ (compiler) 2001. Geology of the Waitaki area. Instituteof Geological & Nuclear Sciences 1:250 000 Geological Map19. Institute of Geological & Nuclear Sciences, Lower Hutt,New Zealand.
Govindavaju KA 1994. A 1994 Compilation of working values andsample description for 383 geostandards. Geostandards News-letter, 1: 158.
Hall C, Farrell J 1995. Laser 40Ar/39Ar ages of tephra from IndianOcean deep-sea sediments; tie points for the astronomical andgeomagnetic polarity time scales. Earth and Planetary ScienceLetters /133: 327�338.
Harlavan Y, Erel Y 2002. The release of Pb and REE fromgranitoids by the dissolution of accessory phases. Geochimicaet Cosmochimica Acta /66: 837�848.
Kelley S, Reddy S, Maddock R 1994. Laser-probe 40Ar/39Arinvestigation of a pseudotachylyte and its host rock from theOuter Isles Thrust, Scotland. Geology /22: 443�446.
Killick AM 1994. The geochemistry of pseudotachylyte and its hostrocks from the West Rand Goldfield, Witwatersrand Basin,South Africa; implications for pseudotachylyte genesis. Lithos/32: 193�205.
LeMasurier W, Landis C 1996. Mantle-plume activity recorded bylow-relief erosion surfaces in West Antarctica and NewZealand. Geological Society of America Bulletin /108(11):1450�1466.
Little T, Mortimer N, McWilliams M 1999. An episodic Cretac-eous cooling model for the Otago-Marlborough Schist, NewZealand, based on 40Ar/39Ar white mica ages. New ZealandJournal of Geology and Geophysics /42: 305�325.
Longerich H, Jackson S, Gunter D 1996. Laser ablation induc-tively coupled plasma mass spectrometric transient signal dataacquisition and analyte concentration calculation. Journal ofAnalytical Atomic Spectrometry /11: 899�904.
Maddock R 1983. Melt origin of fault-generated pseudotachylytesdemonstrated by textures. Geology /11: 105�108.
Maddock RH 1992. Effects of lithology, cataclasis and melting onthe composition of fault-generated pseudotachylytes in Lewi-sian gneiss, Scotland. Tectonophysics /204: 261�278.
Maddock R, Grocott J, van Nes M 1987. Vesicles, amygdales andsimilar structures in fault-generated pseudotachylytes. Lithos /
20: 419�432.Magloughlin JF, Spray JG 1992. Frictional melting processes and
products in geological materials; introduction and discussion.Tectonophysics /204: 197�204.
Magloughlin J, Hall C, van der Pluijm B 2001. 40Ar/39Argeochronometry of pseudotachylytes by vacuum encapsula-tion; North Cascade Mountains, Washington, USA. Geology /
29: 51�54.McDonough WF, Sun S 1995. The composition of the Earth.
Chemical Geology /120: 223�253.
Mortimer N 1993a Geology of the Otago Schist and adjacent rocks(scale 1: 500 000). Geological Map 7. Lower Hutt, NewZealand, Institute of Geological and Nuclear Sciences.
Mortimer N 1993b. Jurassic tectonic history of the Otago Schist,New Zealand. Tectonics /12: 237�244.
Mortimer N, Roser BP 1992. Geochemical evidence for theposition of the Caples-Torlesse boundary in the Otago Schist,New Zealand. Journal of the Geological Society of London /
149: 967�977.Mortimer N, Cooper A 2004. U-Pb and Sm-Nd from the Alpine
Schist, New Zealand. New Zealand Journal of Geology andGeophysics /47: 21�28.
Mueller W, Kelley S, Villa I 2002. Dating fault-generatedpseudotachylytes; comparison of 40Ar/39Ar stepwise-heating,laser-ablation and Rb-Sr microsampling analyses. Contribu-tions to Mineralogy and Petrology /144: 57�77.
Norrish K, Chappell B 1967. X-ray fluoresence spectrography. In:Zussman J ed. Physical Methods in Determinative Mineral-ogy. Academic Press, London. Pp. 161�214.
O’Hara K 1992. Major- and trace-element constraints on thepetrogenesis of a fault-related pseudotachylyte, western BlueRidge Province, North Carolina. Tectonophysics /204: 279�288.
O’Hara KD, Sharp ZD 2001. Chemical and oxygen isotopecomposition of natural and artificial pseudotachylyte; role ofwater during frictional fusion. Earth and Planetary ScienceLetters /184: 393�406.
Pearce NJG, Perkins WT, Westgate JA, Gordon MP, Jackson SE,Neal CR, Chenery SP 1997. A compilation of new andpublished major and trace element data for NIST SRM 610and NIST SRM 612 glass reference materials. Geostandardsand Geoanalytical Research /21: 115�144.
Sherlock S, Hetzel R 2001. A laser-probe 40Ar/39Ar study ofpseudotachylite from the Tambach fault zone, Kenya; directisotopic dating of brittle faults. Journal of Structural Geology /
23: 33�44.Sibson R 1975. Generation of pseudotachylyte by ancient seismic
faulting. The Geophysical Journal of the Royal AstronomicalSociety /43: 775�794.
Sibson R, White S, Atkinson B 1981. Structure and distribution offault rocks in the Alpine Fault Zone, New Zealand. In Thrustand nappe tectonics; International conference. Special Pub-lication-Geological Society of London /9: 197�210.
Spray JG 1987. Artificial generation of pseudotachylyte usingfriction welding apparatus; simulation of melting on a faultplane. Journal of Structural Geology /9: 49�60.
Spray JG 1988. Generation and crystallization of an amphiboleshear melt; an investigation using radial friction weldingapparatus. Contributions to Mineralogy and Petrology /99:464�475.
Spray JG, 1990. Experimental friction melting of Lewisian gneiss;implications for Outer Hebrides thrust fault dynamics. In:Geological Society of America, 1990 annual meeting. Ab-stracts with Programs: 285�286.
Spray JG 1995. Pseudotachylyte controversy; fact or friction?Geology /23: 1119�1122.
Steiger R, Jaeger E 1977. Subcommission on geochronology;convention on the use of decay constants in geo- andcosmochronology. Earth and Planetary Science Letters /36:359�362.
Thompson LM, Spray JG 1996. Pseudotachylyte petrogenesis;constraints from the Sudbury impact structure. Contributionsto Mineralogy and Petrology /125: 359�374.
Tippett J, Kamp P 1993. Fission track analysis of the late Ceno-zoic vertical kinematics of continental pacific crust, Otago
28 SLL Barker et al.
Dow
nloa
ded
by [
Mon
ash
Uni
vers
ity L
ibra
ry]
at 0
8:30
17
Sept
embe
r 20
13
Schist, New Zealand. Journal of Geophysical Research /98:16,199�16,148.
Tulloch AJ, Ramezani J, Mortimer N, Mortensen J, van denBogaard P, Maas R 2009. Mid-Cretaceous felsic volcanism inNew Zealand and Lord Howe Rise (Zealandia) as a precursorto continental breakup. Geol Soc London Special Publication321: 89�118.
Warr L, van der Pluijm B, Peacor D, Hall C 2003. Frictional meltpulses during a approximately 1.1 Ma earthquake along the
Alpine Fault, New Zealand. Earth and Planetary ScienceLetters /209: 39�52.
Warr L, van der Pluijm B, Tourscher S 2007. The age and depth ofexhumed friction melts along the Alpine Fault, New Zealand.Geology /35: 603�606.
Youngson JH, Craw D 1993. Gold nugget growth during tec-tonically induced sedimentary recycling, Otago, New Zealand.Sedimentary Geology /84: 71�88.
Pseudotachyltyte in the Otago Schist 29
Dow
nloa
ded
by [
Mon
ash
Uni
vers
ity L
ibra
ry]
at 0
8:30
17
Sept
embe
r 20
13