credit risk transfer and de facto gse reform · credit risk transfer and de facto gse reform david...
TRANSCRIPT
This paper presents preliminary findings and is being distributed to economists
and other interested readers solely to stimulate discussion and elicit comments.
The views expressed in this paper are those of the authors and do not necessarily
reflect the position of the Federal Reserve Bank of New York or the Federal
Reserve System. Any errors or omissions are the responsibility of the authors.
Federal Reserve Bank of New York
Staff Reports
Credit Risk Transfer and
De Facto GSE Reform
David Finkelstein
Andreas Strzodka
James Vickery
Staff Report No. 838
February 2018
Credit Risk Transfer and De Facto GSE Reform
David Finkelstein, Andreas Strzodka, and James Vickery
Federal Reserve Bank of New York Staff Reports, no. 838
February 2018
JEL classification: G10, G18, G21, G23, G28
Abstract
We summarize and evaluate Fannie Mae and Freddie Mac’s credit risk transfer (CRT) programs,
which have been used since 2013 to shift a portion of credit risk on more than $1.8 trillion of
mortgages to private sector investors. We argue that the CRT programs have been successful in
reducing the exposure of the federal government to mortgage credit risk without disrupting the
liquidity or stability of mortgage secondary markets. In the process, the programs have created a
new financial market for pricing and trading mortgage credit risk, which has grown in size and
liquidity over time. The CRT programs provide an important building block to help facilitate
reform of the U.S. housing finance system.
Key words: mortgage, credit risk transfer, securitization, Fannie Mae, Freddie Mac, GSE
_________________
Vickery: Federal Reserve Bank of New York (email: [email protected]). Finkelstein, Strzodka: Annaly Capital Management (emails: [email protected], [email protected]). The authors thank Dayna Goodwin, Roman Shimonov, Shane Sherlund, Joseph Tracy, Susan Wachter, and participants at the New York Fed MBS Analytical Forum, as well as numerous colleagues at Annaly Capital Management, the Federal Reserve, and elsewhere for helpful comments and feedback. Margaret McKee was instrumental in providing research assistance for this paper. The views expressed in this paper are those of the authors and do not necessarily reflect the position of Annaly Capital Management, the Federal Reserve Bank of New York, or the Federal Reserve System. To view the authors’ disclosure statements, visit https://www.newyorkfed.org/research/staff_reports/sr838.html.
1
1. Introduction
Nearly a decade into the conservatorships of Fannie Mae and Freddie Mac, no legislation has yet been
passed to reform the housing finance system and resolve the long-term future of these two
government-sponsored enterprises (GSEs). The GSEs have, however, implemented significant changes to
their operations and practices over this period, even in the absence of legislation.1 The goal of this paper
is to summarize and evaluate one of the most important of these initiatives – the use of credit risk
transfer (CRT) instruments to shift mortgage credit risk from the GSEs to the private sector.2
Fannie Mae and Freddie Mac have significant mortgage credit risk exposure, largely because they
provide a credit guarantee to investors on the agency mortgage-backed securities (MBS) they issue.
Since the CRT programs began in 2013, Fannie Mae and Freddie Mac have transferred to the private
sector a portion of the credit risk on approximately $1.8 trillion in single-family mortgages (as of
December 2017; source: Fannie Mae, 2017, Freddie Mac, 2017). The GSEs have experimented with a
range of different risk transfer instruments, including reinsurance, senior-subordinate securitizations,
and transactions involving explicit lender risk sharing. The bulk of CRT, however, has occurred via the
issuance of structured debt securities whose principal payments are tied to the credit performance of a
reference pool of securitized mortgages. A period of elevated mortgage defaults and losses will trigger
automatic principal write-downs on these CRT bonds, partially offsetting credit losses experienced by
the GSEs.
[Figure A: Credit Risk Transfer Volumes by Transaction Type]
Our thesis is that the CRT initiative has improved the stability of the housing finance system and
advanced a number of important objectives of GSE reform. In particular the CRT programs have 1 Aside from credit risk transfer, other reforms implemented over the period of the GSE conservatorships include the development of a common securitization platform for issuing MBS, the single security initiative to issue MBS backed by collateral from both GSEs, changes to the level and structure of guarantee fees, and changes and clarifications to representations and warranty arrangements. These changes have taken place under the stewardship of the GSEs’ regulator and conservator, the Federal Housing Financing Agency (FHFA). More detail about these initiatives is available from the FHFA website (fhfa.gov). The GSEs have also wound down the size of their retained mortgage and MBS portfolios over time, in line with the preferred stock purchase agreements reached between the GSEs and U.S. Treasury when the conservatorships began in September 2008. 2 Although there is little academic literature on the GSE credit transfer programs, for related discussions of these programs from public policy and practitioner perspectives please see Zandi et al. (2017), Goodman et al. (2016), Davidson et al. (2016), Goodman and Parrott (2016) and FHFA (2015).
2
meaningfully reduced the exposure of the Federal government to mortgage credit risk without
disrupting the liquidity or stability of secondary mortgage markets. In the process, the CRT programs
have created a new financial market for pricing and trading mortgage credit risk, which has grown in size
and liquidity over time. Given diminished private-label securitization activity in recent years, these CRT
securities are one of the primary ways for private-sector capital market investors to gain exposure to
residential mortgage credit risk.
An important reason for this success is that the credit risk transfer programs do not disrupt the
operation of the agency MBS market or affect the risks facing agency MBS investors. Because agency
MBS carry a GSE credit guarantee, agency MBS investors assume that they are exposed to interest rate
risk and prepayment risk, but not credit risk. This reduces the set of parameters on which pass-through
MBS pools differ from one another, improving the standardization of the securities underlying the liquid
to-be-announced (TBA) market where agency MBS mainly trade3. Even though the GSEs now use CRT
structures to transfer credit risk to a variety of private sector investors, these arrangements do not
affect agency MBS investors, since the agency MBS credit guarantee is still being provided only by the
GSE. In other words, the GSE stands in between the agency MBS investors and private-sector CRT
investors, acting in a role akin to a central counterparty.
Ensuring that Fannie Mae and Freddie Mac’s credit risk sharing efforts occur independently of the
agency MBS market is important for both market functioning and financial stability. The agency MBS
market, which remains one of the most liquid fixed income markets in the world, proved to be quite
resilient during the 2007-2009 financial crisis, helping to support the supply of mortgage credit during
that period. The agency market financed $2.89 trillion of mortgage originations during 2008 and 2009,
experiencing little drop in secondary market trading volume during that period (Vickery and Wright,
2013). In contrast, the non-agency MBS market, where MBS investors are exposed directly to credit risk,
proved to be much less stable; Issuance in this market essentially froze in the second half of 2007, and
has remained at low levels since that time.4
3 The to-be-announced (TBA) market is a forward market for agency pass-through MBS. In a TBA trade, the buyer and seller agree on a set of characteristics of the pool (issuer, term, coupon, settlement month), but do not stipulate the exact security which will be delivered at settlement. This thereby concentrates trading into a small number of liquid contracts, enhancing the liquidity of typically highly heterogeneous individual mortgages. See Vickery and Wright (2013) for more details. 4 This freeze in non-agency MBS liquidity reduced mortgage credit availability for loans which could no longer be securitized; for example, interest rates for jumbo mortgages rose sharply relative to rates on conforming
3
The remainder of this paper is structured into four sections. Section 2 provides background on the risks
faced by Fannie Mae and Freddie Mac and different mechanisms used by the GSEs to mitigate their
exposure to mortgage credit risk. Section 3 explains the mechanics of how CRT instruments work, and
provides descriptive statistics about the growth and composition of this market. Section 4 considers
some potential improvements to the market and its ancillary structures. Section 5 concludes.
2. Background and history of GSE credit risk sharing
Residential mortgages are exposed to three key types of risk: interest rate risk, prepayment risk, and
credit risk. In an agency mortgage securitization, Fannie Mae and Freddie Mac effectively transfer
interest rate and prepayment risk to agency MBS investors.5 Credit risk is however retained by the GSEs,
who provide a credit guarantee of timely payment of principal and interest on the MBS, even if there are
defaults on the mortgages in the MBS pool. This credit risk exposure of Fannie Mae and Freddie Mac is
substantial, given that the GSEs own or guarantee $5.1 trillion of residential mortgages (FHFA, 2017a).
Fannie Mae and Freddie Mac manage this credit risk in a number of ways:
1. Guarantee fees. The GSE issuer receives up front and ongoing guarantee fees from the pool to
compensate them for their MBS credit guarantee. Historically these guarantee fees have not
varied significantly based on mortgage loan credit characteristics (Hurst et al., 2016), although
since 2008, up-front fees have been sensitive to loan-to-value ratios and borrower credit scores
(see FHFA, 2016a, for more details).
2. Private mortgage insurance. Under their charters, the GSEs cannot purchase mortgages with
loan-to-value ratios exceeding 80 percent unless those loans have additional credit
enhancement. This requirement is generally met by requiring mortgage borrowers to obtain
private mortgage insurance (PMI). PMI reduces the GSEs’ credit risk exposure although it
mortgages which could be funded through the still-liquid agency MBS market (Vickery and Wright, 2013). Kung (2015) finds evidence that the liquidity freeze had broader macroeconomic effects, in particular that it reduced home prices. Kung identifies this result using microeconomic data on home sales and listings and changes in the conforming loan limit in 2008. 5 Fannie Mae and Freddie Mac are also exposed to interest rate risk and prepayment risk associated with mortgage assets which are retained in portfolio rather than sold. Historically this risk was substantial (Jaffee, 2003), although the GSEs have significantly reduced the size of their retained mortgage portfolios over the past decade.
4
exposes them to counterparty risk if the PMI provider is unable to perform on the insurance
contract, as may be the case during a severe housing downturn.6
3. Underwriting standards. The GSEs set minimum standards governing which mortgages they will
guarantee, including maximum debt-to-income and minimum credit score requirements,
property inspection and appraisal requirements, and required documentation of borrower
income and assets.
4. Representations and warranties. Fannie Mae and Freddie Mac require loan sellers to agree to a
set of representations and warranties setting out terms under which the seller must repurchase
the loan at par (e.g., in the case of mortgage fraud or significant misrepresentation of loan
terms).7
5. Equity capital. Equity capital provides an additional buffer against insolvency if credit losses
exceed guarantee fee income and other revenue. Historically, the GSEs faced minimum capital
requirements, which would need to be evaluated under more comprehensive GSE reform.
Today, the two firms essentially have no equity capital, because retained earnings are remitted
to the U.S. Treasury under the revised terms of the firms’ conservatorship (see Frame et al.,
2015, for more information on the conservatorships).
Despite the use of these credit risk management tools, Fannie Mae and Freddie Mac experienced high
mortgage credit losses during the 2007-2009 financial crisis period, leading to the conservatorship of the
two GSEs in September 2008. This experience highlighted the need to find ways to more effectively
mitigate credit risk. This mitigation has in part been achieved by significantly increasing and redesigning
guarantee fees, strengthening fraud detection, and winding down the size of the GSEs’ retained
mortgage portfolios.
To supplement these steps, in 2012, Fannie Mae and Freddie Mac’s regulator, the Federal Home
Financing Agency (FHFA), established its intent to develop “loss sharing agreements” under which
6 Bhutta and Keys (2017) document the financial distress experienced by the private mortgage insurance industry during the 2007-09 financial crisis, including the failure of several large PMI providers. 7 The GSEs have revised their representations and warranty framework in recent years to provide additional clarity to lenders about the conditions under which mortgages may be repurchased (e.g., see Goodman, Parrot and Zhu, 2015; Housing Wire, 2014). These changes have been motivated by concerns that uncertainty around repurchase risk may be reducing mortgage credit supply, particularly for riskier types of loans.

5
private investors would bear credit risk on mortgage loans underlying agency MBS (see FHFA, 2012).8
The first credit risk transfer pilot transaction was a Structured Agency Credit Risk (STACR) offering
brought to market by Freddie Mac in mid-2013.9 The first Connecticut Avenue Securities (CAS) bond
offering from Fannie Mae followed shortly thereafter. In addition to issuing STACR/CAS securities on a
fairly regular basis, the GSEs have also tested a range of other instruments such as lender risk-sharing
and reinsurance.
The FHFA has established several principles which are used in evaluating and fine-tuning the design of
the CRT programs. Among these are: (i) reducing taxpayer risk, (ii) engaging in transactions which are
economically viable (where the cost of transferring the credit risk does not meaningfully exceed the cost
of the GSEs retaining that risk), (iii) not interfering with the continuation of the GSEs’ core business of
acquiring and securitizing mortgages and guaranteeing mortgage-backed securities and (iv) designing
transaction structures that will be robust and retain CRT investor interest throughout different phases of
economic and housing cycles (see FHFA, 2016b, for a complete list).
2.1 Private versus public sector assumption of mortgage credit risk
Should the GSEs aim to transfer all mortgage credit risk to private investors? Asset pricing theory would
suggest that the “price” of credit risk is the same regardless of which party owns that risk, and therefore
that the GSEs (backed up by the Federal government) have no particular comparative advantage in
bearing that risk. From this perspective, it may be appropriate, or at least benign, to sell off all credit risk
to the private sector.10
8 Related to this paper, see Frame (2003) for a discussion of mortgage risk-sharing transactions undertaken in an earlier program by the Federal Home Loan Banks. 9 In this inaugural transaction, Freddie Mac retained the risk of the first 0.3 percent of credit losses on the reference pool, transferred a substantial portion of the next 2.7 percent of credit losses across two tranches (mezzanine tranches M1 and M2), and retained top 97 percent of loss risk. For the purposes of measuring credit losses, a credit event was defined as the event of a loan becoming 180-day delinquent, and loss severity was defined to be 15 percent for the initial 1 percent of defaults, with defaults exceeding this initial level being assigned a progressively higher severity rate. These features simplified loss modeling, because it meant that investors did not need to worry about foreclosure and property liquidation timelines, which impact both cash flow timing and ultimate realized loss severity. This structure introduces basis risk for the issuer, however, because realized credit losses will differ from the calculated loss rate based on these stylized assumptions. 10 One reason to minimize the government guarantees and other contingent liabilities is that such liabilities are not properly fair valued for budgetary purposes. Thus, the presence of such guarantees may yield a misleading position of the government’s fiscal position (Lucas and McDonald, 2010).

6
There are likely to be some limits to this “full risk transfer” argument, however. First, in a financial crisis,
specialized mortgage investors may be financially distressed or face high costs of external finance,
leading to high risk premia for mortgage credit risk (as in the model of Shleifer and Vishny, 1992; see
Stanton and Wallace, 2011, for evidence). In such cases, it may be appropriate and stabilizing for
government to bear more risk, at least temporarily, particularly considering the central role of housing
in the business cycle and in propagating financial crises (Leamer, 2015; Reinhart and Rogoff, 2009). The
FHFA’s credit risk transfer principles note this consideration explicitly, stating that “In some market
downturns, the Enterprises could retain credit risk for a period of time and then subsequently transfer it
to private investors when more normal market conditions return” (FHFA, 2016b). For example, the GSEs
would likely retain the credit risk on a mortgage pool if the cost of risk transfer significantly exceeded
the guarantee fee income on the underlying mortgages.
By the same logic, it may be costly to reinsure extreme mortgage tail risks which would be realized only
in a crisis or severe recession. In an insurance context, Froot (2001) documents the lack of supply of
private capital for tail risk catastrophe reinsurance.
Second, the GSEs play an important ex ante screening role in setting standards for which mortgages they
will purchase and securitize into agency MBS. They also conduct ongoing monitoring of loan
performance and compliance with representations and warranties. It may be useful for the GSEs to
retain at least some risk for incentive reasons, analogous to a deductible on a standard insurance policy.
How do these considerations match up to the portions of credit risk transferred to date using the CRT
programs? Using the taxonomy of FHFA (2015), the GSEs’ credit risk exposure can be segmented into: (i)
expected losses likely to occur in a typical time period, (ii) unexpected losses occurring in a period of
heightened defaults such as a recession or housing market downturn, and (iii) catastrophic losses, which
occur during a severe and unlikely tail event. The GSEs currently generally retain the first loss exposure
(e.g., for the first 50 basis points of credit losses), as well as extreme tail risk (e.g., losses in excess of
roughly 400 basis points) and have focused on transferring risk associated with unexpected credit losses.
The benefits and drawbacks of the current extent of risk sharing has been widely debated, as we discuss
further in section 4.
3. Mechanics, structure, and trading of STACR/CAS synthetic notes
7
Although the GSEs have experimented with a number of different risk transfer instruments, the STACR
and CAS debt securities have been the most widely used, accounting for 77% of the risk in force shed
from the GSEs’ balance sheets (FHFA 2017b).11 While other risk sharing models, such as front-end risk
transfers and reinsurance transactions, have their own merits, the broad investor base in STACR/CAS
transactions, combined with the independence of the structure from other parts of the agency MBS
market has helped the securities gain a wide acceptance and a broad investor support in the
marketplace.
3.1 Basic structure
Figure B represents an illustrative STACR/CAS structure in which the Enterprises transfer credit risks on a
reference pool of 30 year fixed rate GSE-guaranteed mortgages.12 The STACR/CAS securities are floating
rate fixed income securities that pay the investor an interest rate tied to the 1-month London Interbank
Offer Rate (LIBOR) plus a spread determined by market demand at the time of the primary market
issuance of the bond, discussed in more detail below. Recently issued securities have a 12 1/2 year final
maturity, with a call option for the GSE after 10 years.13
[Figure B: Illustrative Enterprise Debt Issuance Structure]
The key feature of these STACR/CAS bonds is that the required principal payments are linked to the
credit performance of a mortgage reference pool. In the representative example shown in Figure B, the
securities are divided, or tranched, into four risk slices.14 Starting with the most junior securities, the
bottom 0.5 percent of the structure represents the “first loss” piece covering the expected credit losses.
The GSEs retained all of the first loss tranche in early CRT transactions, but have also sold portions of
this risk in a subset of more recent transactions. Immediately senior to this first loss tranche are three
11 The term “risk in force” refers to the maximum credit loss which could be incurred by the investor in the credit risk transfer instrument. For example, if a STACR bond assumed the first 3% of credit losses on a $10bn mortgage reference pool, the risk in force would be $300m. 12 To date, all STACR/CAS deals have referenced 30-year fixed rate mortgages (FRMs), which represent the majority of the mortgage collateral securitized into agency MBS. Shorter-term FRMs (e.g., 15 year FRMs) also bear less credit risk than 30 year FRMs, reducing the need to transfer credit risk on these loans. Even so, it seems possible that CRT programs could be expanded to other loan types in the future. 13 This means that the GSE can prepay the bond at par after 10 years. In practice, it is expected that the GSEs would exercise this call option under nearly all scenarios, given that after 10 years the remaining mortgages will generally have little remaining credit risk, making the bond an expensive source of funding relative to the amount of credit protection provided. Earlier CRT deals had 10 year final maturities with no call option. 14 In practice, the number of tranches differs by CRT transaction. More complex transactions generally involve the same basic structure as shown here, but include a larger number of mezzanine tranches.
8
mezzanine tranches that cover credit losses between 0.5 and 1.0 percent (typically referred to as B1),
1.0 and approximately 3.0 percent (typically referred to as M2), and 3.0 to approximately 4.0 percent
(typically referred to as M1).15 Credit risk for both mezzanine tranches, covering elevated unexpected
losses, is sold to private investors, with the GSEs typically retaining only a small 5 percent vertical slice of
each mezzanine tranche. Finally, the top roughly 96 percent of the structure, the “senior tranche”, is
entirely retained by the GSEs to cover catastrophic losses.
After issuance, when the GSE receives the proceeds from the debt sale, the GSEs begin forwarding
principal and interest payments to the investors. The lower STACR/CAS tranches, which bear more credit
risk, receive higher coupon payments relative to more senior tranches. Scheduled principal payments
and prepayments result in a corresponding pro rata paydown of principal between the GSE-retained
senior tranche (the top 96% of the structure in recent transactions) and the mezzanine classes of
STACR/CAS notes sold to investors. But initially this is not the case; instead, prepayments are soley
directed towards the senior tranche, resulting in an increase in the credit enhancement of the senior
class over time. Typically, this occurs until credit enhancement has increased by 25-50bps relative to the
initial credit enhancement, thereby affording the GSEs incremental protection against credit losses
relative to initial credit enhancement available at transaction inception.16
Within the set of mezzanine tranches, principal payments are allocated in order of seniority; thus,
payments will first be made to the M1 tranche, leading the outstanding balance of the M1 tranche to
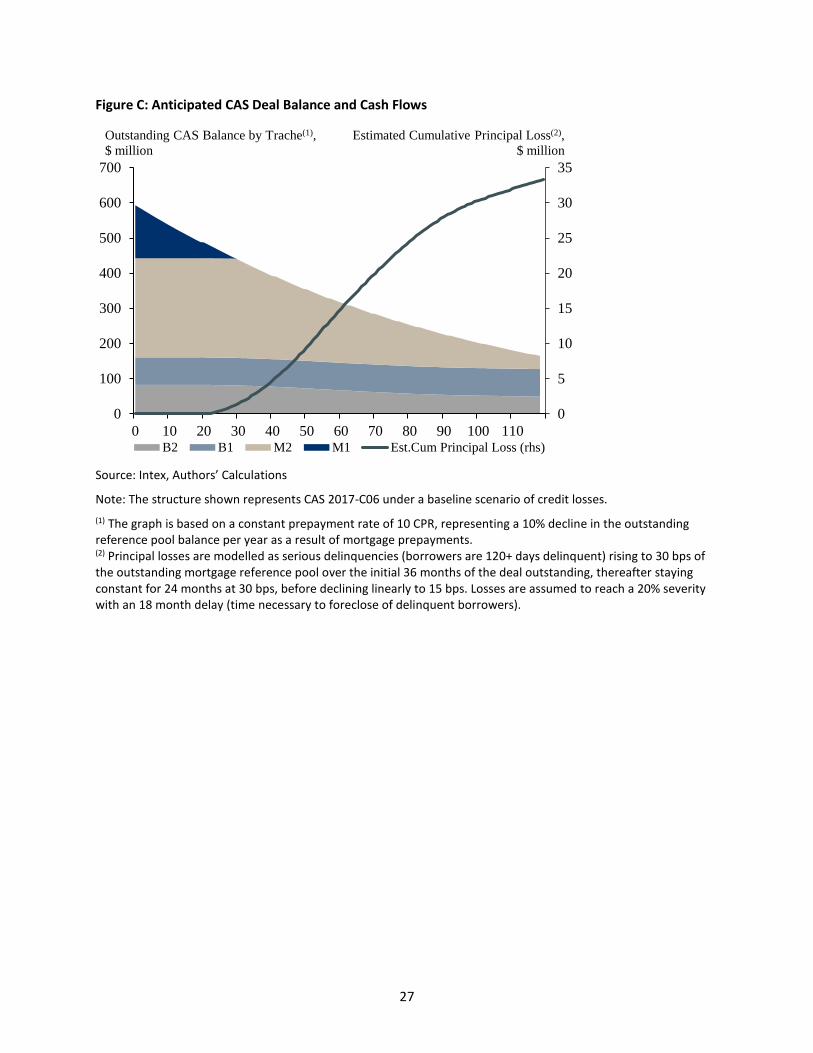
decline towards zero over time. 17 Figure C illustrates how the unpaid balance of the different tranches
for a typical CRT deal evolves over time under a baseline scenario.
[Figure C: Anticipated CAS Deal Balance and Cash Flows]
15 Some of the earlier STACR bonds have a three tranche structure. For example, in STACR-2016-DNA2 M1 covers credit losses ranging from 4.0 to 5.0 percent of the reference pool, M2 covers losses between 3.05 to 4.0 percent, and M3 covers losses between 1.0 to 3.05 percent. 16 In addition, there are delinquency and cumulative net loss tests in the deal that are designed to provide incremental structural protection to the GSE-retained senior tranche, should performance deteriorate beyond initial expectations. These tests are designed to shut off mezzanine tranches from principal cash flow should delinquencies and losses increase above pre-determined thresholds. 17 After prepayments and scheduled amortization have extinguished the M1 tranche, further principal payments are allocated to the M2 tranche, and so on. Meanwhile, losses are being allocated to the most junior tranche outstanding, initially the B2 tranche. Mortgage delinquencies can result in one of three outcomes: 1) they can be cured in which case no loss occurs, 2) they can be modified, in which case the difference between the original loan and the modified loan is passed as a loss on a monthly basis, 3) the underlying loan property might be disposed in which case the loss is passed as a onetime reduction in principal at the time of the disposition of property. The loss would be the difference between the loan amount and the net proceeds from the disposition (essentially the property sale amount less transaction costs).
9
The GSEs assume no counterparty risk through the STACR/CAS structure. CRT investors pay for the notes
in full at purchase and absorb credit losses through reduction in the principal value of the bonds. After
the sale of the securities, the GSEs manage the proceeds to generate a return close to 1-month LIBOR to
ultimately service the floating leg of the STACR/CAS coupon paid to the investors. As the mortgage loans
in the reference pool prepay, the GSEs pay down the bonds accordingly. However, if mortgage loans in
the reference pool default, the GSEs will use a portion of cash, equivalent to the loss incurred, to
reimburse themselves for the cost of making full payment of principal and interest to the investors in
the MBS pool. In this situation, the face value of the STACR/CAS bond will be written down, and the
investor will lose a corresponding portion of the principal payment and associated interest.
It should be noted that high-LTV mortgages in GSE securitizations have credit enhancement in the form
of private mortgage insurance. Credit losses on the reference pool are measured net of payouts on the
private mortgage insurance. However, it is the GSE, not the STACR/CAS investor, which bears the
counterparty risk associated with contractual failure to pay by the PMI provider.18 This simplifies credit
analysis from the perspective of the STACR/CAS investor.
Early STACR/CAS deals involved a concept of scheduled severity, whereby loss severity assigned to
defaulted loans for purposes of determining losses to be allocated to CRT investors were pre-defined up
front at deal issuance.19 Although this approach helped attract investors to this developing sector in the
early stages of its life cycle, the use of this formulaic approach led to an imprecise hedge against losses
for the GSEs, given that actual defaults and loss severities realized in practice may differ from the
scheduled severity assumptions. With that in mind, starting in 2016, both Fannie and Freddie made
adjustments to the structures, transitioning to a configuration where losses would accumulate to the
bondholders upon actual property liquidation (or a similar event) and would reflect actual realized loss
severity.
3.2. Primary market issuance
18 For instance, the GSE would cover any counterparty losses due to the bankruptcy of a PMI provider. However, if for example, if a borrower walks away from a hurricane-damaged property, the GSEs would not cover the mortgage insurers’ failure to pay, because the mortgage insurer would not be contractually obligated to cover the damage in this case. 19 In this formulaic approach, a loan default was defined as 180 day delinquency, in addition to certain other events, such as foreclosure sale or deed-in-lieu. A pre-specified loss severity schedule is then applied to every defaulted loan. Loss severity increases with the level of defaults.
10
CRT transactions are issued in a fairly predictable, regularly-scheduled fashion roughly every four weeks
alternating between Fannie Mae and Freddie Mac. Since the initiation of the program in 2013, Fannie
Mae has issued 23 CAS deals, while Freddie Mac has issued 31 STACR deals (as of late 2017).20
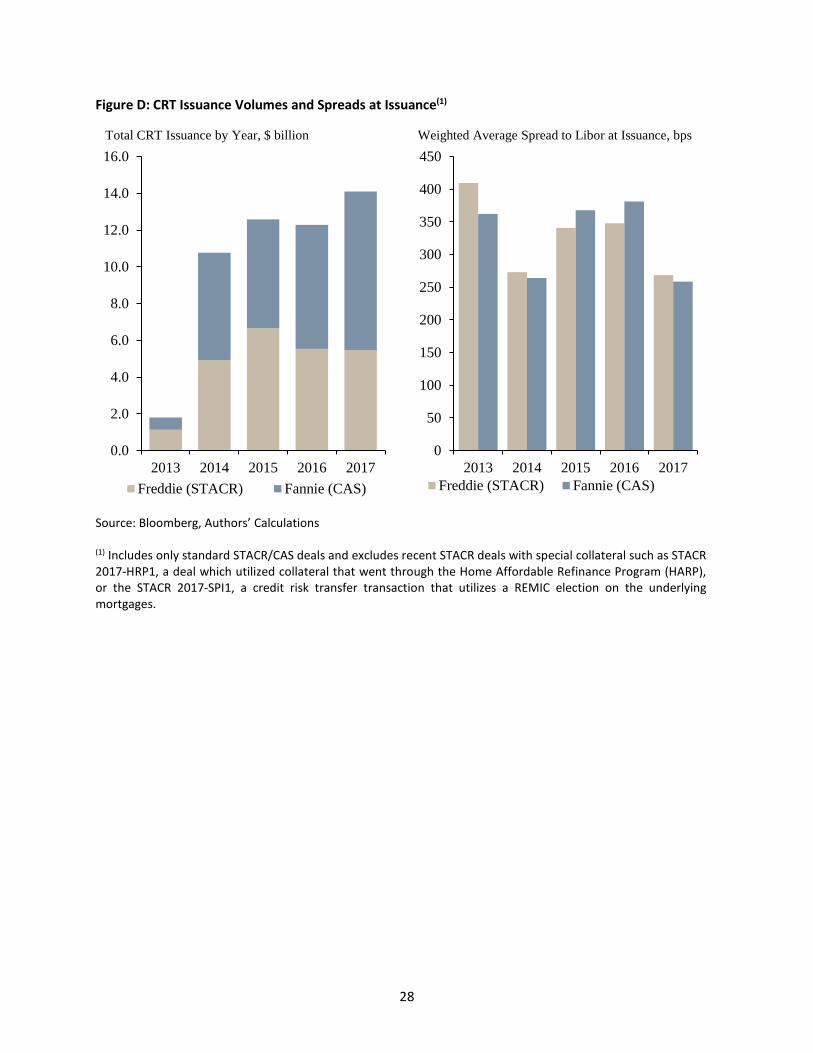
[Figure D: CRT Issuance Volumes and Spreads at Issuance]
Deals are generally announced and marketed one week before pricing. STACR/CAS securities are issued
through a syndication process in which participating broker-dealers take customer orders and adjust
pricing to most effectively match customer demand with the supply of bonds from the GSEs. Since
bonds are issued at par, pricing is adjusted via a fixed spread over Libor payable by each bond, which
represents the effective cost of CRT financing for the GSE. Broker-dealers and the GSEs strive to avoid
situations in which overly aggressive pricing leads to poor performance in the secondary market shortly
after transaction pricing. Similarly, they also attempt to avoid situations whereby pricing is overly
conservative such that GSEs end up overpaying investors for the protection they buy. Every attempt is
made to price each deal so that secondary trading post transaction pricing is orderly and does not cause
undue volatility for a given issue or the sector at large.
Once pricing is set, the GSEs ultimately allocate the bonds to the individual investors according to their
internal methodology. While that methodology is not disclosed to investors, the GSEs appear to favor
investors that place orders earlier in the syndication process over ones that place later orders. Given
that earlier investors face greater price risk, this allocation method rewards investors taking on greater
risk.
The STACR/CAS market has grown in size and investor popularity over time, reflecting continued
investor demand for residential mortgage credit risk amid a shrinking volume of available credit-
sensitive mortgage securities. As a whole, the residential credit sector is now less than one third of its
pre-crisis peak size, reflecting low issuance of non-agency MBS since 2007. Although CRT securities
represent only 5.1 percent of this smaller market’s total outstanding size, STACR/CAS issuance
represented 21 percent and 18 percent of aggregate residential credit gross issuance in 2016 and 2017,
respectively (SIFMA 2017).
The growth in investor interest in the STACR/CAS market has also benefited from:
20 These statistics are through the end of 2017, excluding the STACR SPI and HARP deals issued in Q4 2017. The most recent CAS and STACR securities considered at time of writing were issued on November 21 and October 18, 2017, respectively.
11
• The regularity of and transparency around primary market issuance,
• Granular loan-level historical performance data which has been made available by the GSEs,
helping investors to model credit performance across various market environments and
macroeconomic scenarios (see also Canter 2017),
• A sound economy and housing market21, and
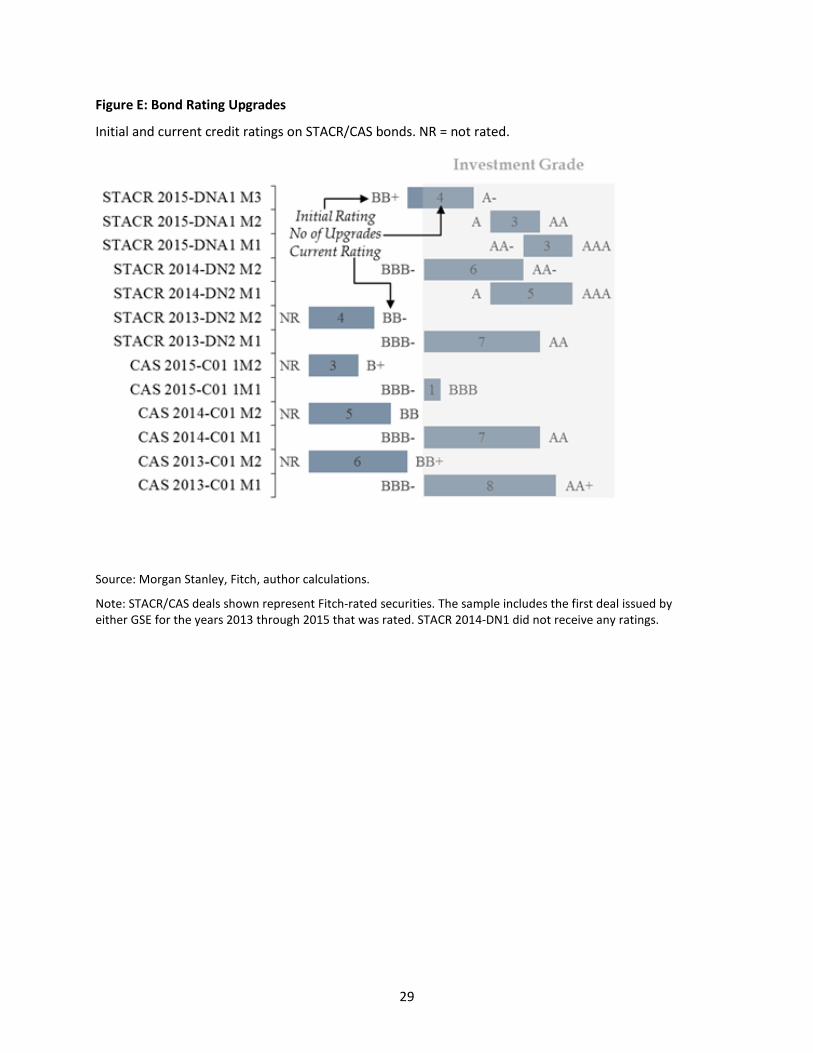
• The availability of credit ratings from a number of credit rating agencies (e.g., Fitch). Ratings for
some CRT bonds have been frequently upgraded since issuance (see figure E below).
[Figure E: Bond Rating Upgrades]
3.3. Secondary market trading and liquidity
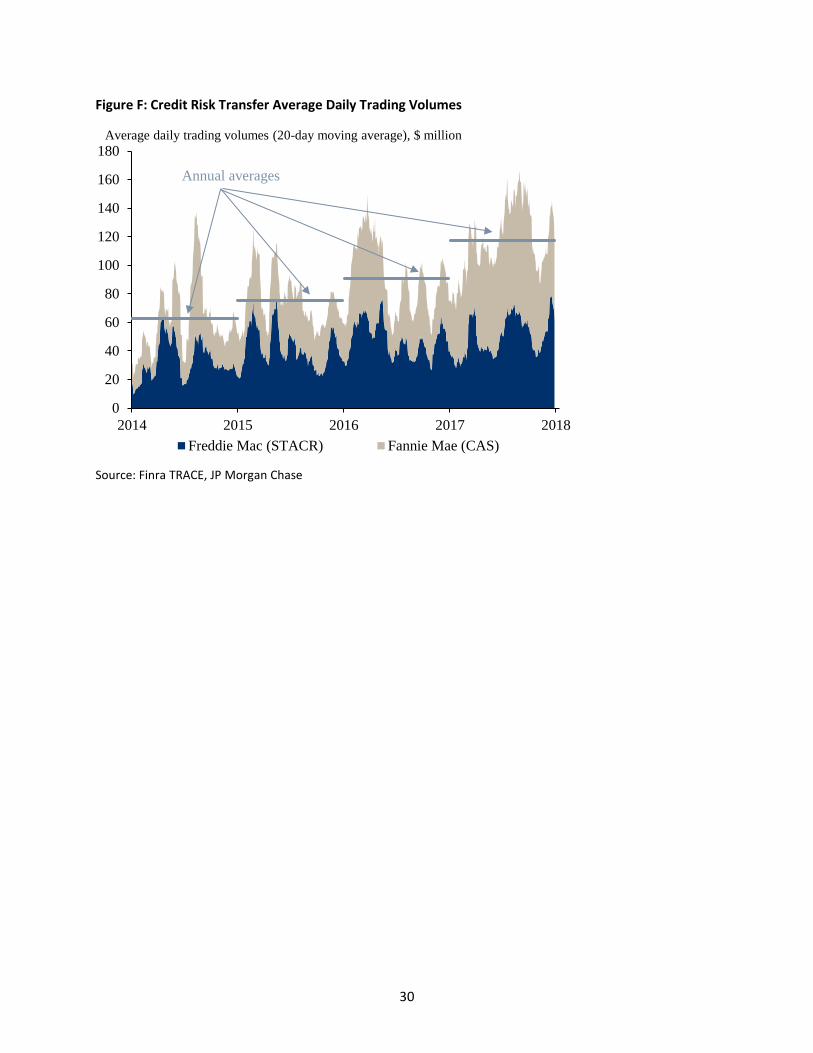
Secondary market trading of STACR/CAS has more than doubled from an average of $47.7 million per
day in 2014 to $117.1 million per day in 2017, roughly proportional to the expansion in the volume of
outstanding securities. As shown in figure F, CRT trading volume fluctuates significantly over time. For
example, volume increased in early 2016, corresponding to a period of elevated market volatility and
widening in credit spreads. Trading volume for STACR and CAS bonds tends to move closely together,
reflecting the high degree of substitutability between the two types of securities. Trades are typically
conducted in $2-10 million block sizes, smaller than commonly seen in agency MBS, particularly in the
much larger and more liquid TBA market, yet comparable with other sectors of the fixed income market
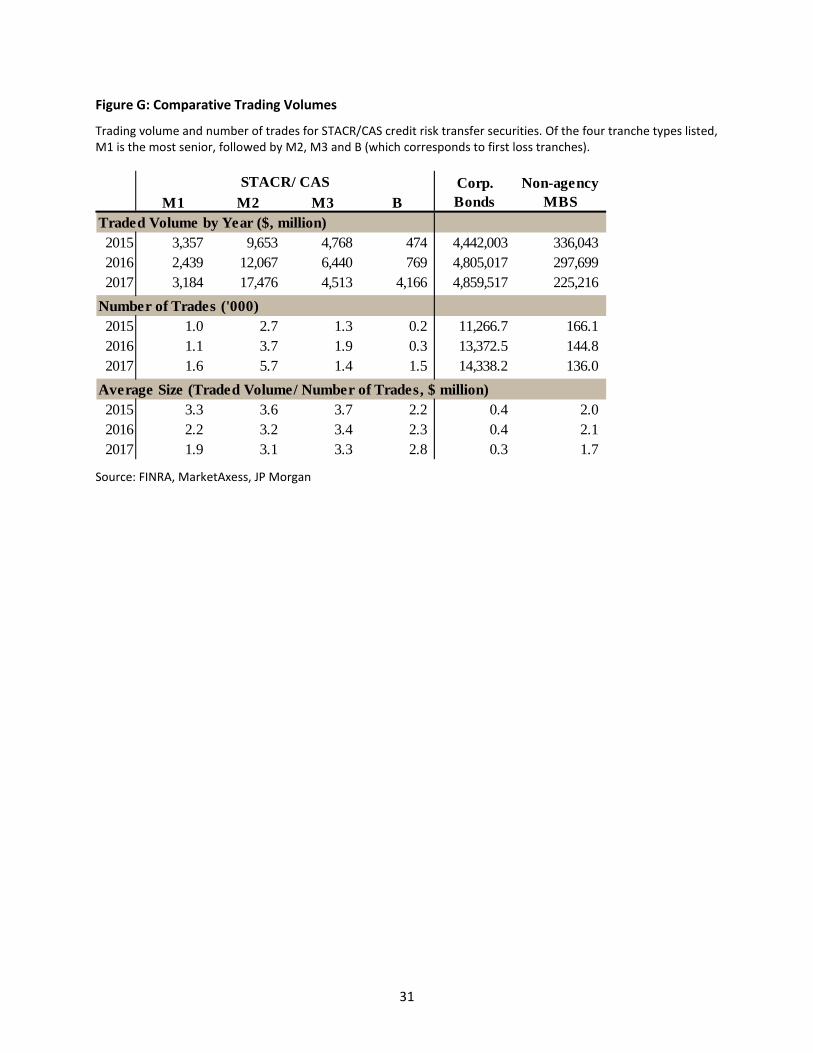
such as corporate bonds and non-agency MBS. Figure G reports some summary statistics about trading
volume drawn from FINRA TRACE data. Trade size for STACR/CAS securities averages $2-3 million, and is
roughly similar across securities of different seniorities.
[Figure F: Average Daily Trading Volumes]
[Figure G: FINRA TRACE Trading Volumes Table]
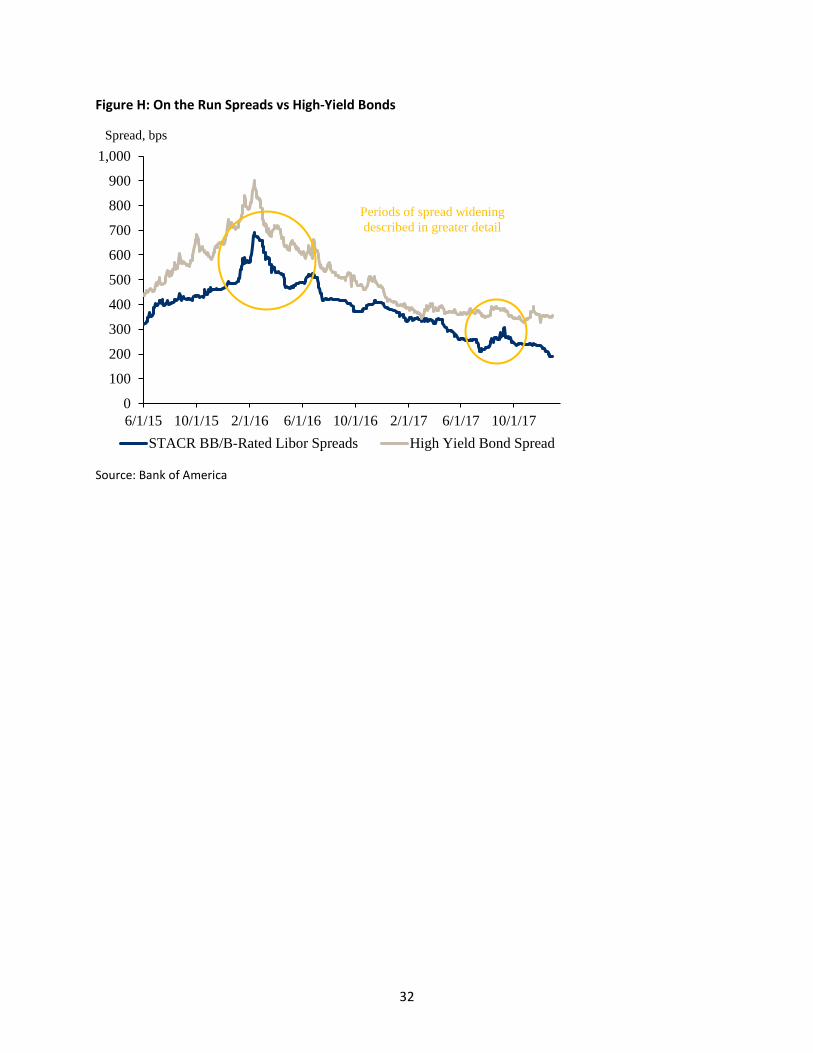
Figure H plots on-the-run yield spreads to Libor on STACR/CAS bonds as well as for high-yield corporate
bonds. After rising in the second half of 2015, STACR/CAS yield spreads have declined significantly since
early 2016, broadly tracking high yield corporate credit spreads over the same period. On net, spreads
21 National home prices measured by the Case-Shiller index have grown in excess of 5% at a seasonally adjusted annual rate over the life of the CRT programs (2013-17). Meanwhile, mortgage lending standards remain tight by most measures, while mortgage delinquencies remain at levels similar to those seen during the prior housing market peak in 2003-06.
12
on M2 tranches have tightened from around 400 basis points (bps) in mid-2015 to 250 bps by the third
quarter of 2017.
[Figure H: On The Run CRT Spreads vs High-Yield Bonds]
Two periods of spread widening are worth noting. First, STACR/CAS spreads spiked by about 200 bps in
early 2016, reflecting a general widening in credit spreads due to macroeconomic concerns around the
stability of the Chinese economy and the declining price of oil weighing on the spectrum of credit
products. STACR/CAS spreads mirrored the general trend in high yield spreads during this episode,
despite no evidence of deterioration in underlying housing and mortgage market fundamentals. Second,
STACR/CAS spreads widened by about 100 bps during August and September of 2017, as the
anticipation of extensive hurricane damage to Texas and Florida raised investor concerns about
heightened mortgage default risk. The spread widening ultimately reversed in both cases, reflecting a
sound housing market and strong demand for credit, but the temporary widening provides a “real-time”
measure of market expectations about the anticipated effect of these events on credit loss rates for
agency-eligible residential mortgages.
3.4. Investors
The CRT investor base has broadened over time and Freddie Mac has publically indicated that they have
seen more than 200 distinct investors in their credit-risk transfer transactions.22 The largest CRT investor
group is money managers which invest across the mezzanine stack of securities offered by the GSEs.
These money managers are interested in replacing maturing non-agency mortgage holdings and have
been consistent CRT investors. Real Estate Investment Trusts (REITs) have similar intentions to money
managers but generally invest in the lower mezzanine tranche (M2), which offers a more desirable
risk/return tradeoff than more senior tranches for this investor group. Hedge funds also actively invest
in the sector, either to take advantage of short-term fluctuations in spreads, or because CRT
investments have become an attractive way to speculate on broader housing market performance.23
Sovereign wealth funds and a limited number of insurance companies round out the investor base. Of
note, banks currently do not invest in STACR/CAS securities, primarily due to their high regulatory capital
risk weights, which make it difficult for STACR/CAS investments to meet bank return on equity targets.
22 Fannie Mae and Freddie Mac provide regularly updated information on the size and composition of their CRT investor bases on their websites. 23 The ample availability of repo financing to lever positions and achieve attractive returns has generally made the STACR/CAS securities attractive for the hedge fund community.

13
The different investment objectives and investment horizons of STACR/CAS investors (in which some
investors are motivated by yields over the medium run, while others are focused on short-term
directional trading) have supported the growth in sector liquidity since inception. Moreover, the
presence of many smaller investors and low-leverage investors, such as asset managers, is a positive
feature of the market from the perspective of diversifying mortgage credit risk exposure and reducing
overall systemic risk. One caveat, however, is that the increasing depth of the CRT investor base has
occurred during a period of quiescence in the housing market and broader macroeconomy. The market
has not yet been tested by a significant period of falling home prices and elevated mortgage defaults.
3.5 Other risk transfer instruments
Although STACR/CAS has been the core of the GSE credit risk transfer initiative, the two enterprises also
make use of several other structures. Largest among these, the GSEs purchase credit reinsurance from a
set of highly-rated diversified reinsurers through the Freddie Mac Agency Credit Insurance Structure
(ACIS) and Fannie Mae Credit Insurance Risk Transfer (CIRT) programs. These reinsurance transactions
are structured the same way as STACR/CAS, and are used either to reinsure the retained vertical slice of
mezzanine risk on a STACR transaction (in the case of ACIS), or a standalone reference pool. These
transactions are partially collateralized, reducing but not completely eliminating counterparty risk.
In addition, the GSEs have also experimented with senior-subordinated transactions, in which a pool of
mortgage collateral is effectively securitized into several tranches of MBS, and the junior bonds do not
carry a credit guarantee. The current active program of this type is the STACR Securitized Participation
Interests (SPI) offering introduced by Freddie Mac in late 2017.24 STACR SPI bonds have a fixed coupon
rate, rather than the floating rate offered by STACR/CAS bonds.
The GSEs also engage in some “front-end” risk sharing, in which a portion of mortgage credit risk is
transferred to a third party prior to securitization. Some front end risk sharing involves a portion of
credit risk being retained by the loan seller. The GSEs have also recently made use of “deep cover”
private mortgage insurance, in which additional credit risk is insured by specialist mortgage insurers,
beyond the required credit enhancement for mortgages with LTV exceeding 80 percent.
24 In a STACR SPI transaction, participation interests in a pool of mortgages are deposited into a trust which issues Freddie Mac gold pass-through MBS. Any loans repurchased due to nonperformance are then deposited in the STACR SPI trust, which thereby assumes any credit losses. STACR SPI replaces the Freddie Mac Whole Loan Securities program. STACR SPI is designed to be a residential MBS transaction, unlike regular STACR bonds which are unsecured debt of the GSEs. See Freddie Mac 2017b for more details.
14
Maintaining a range of CRT tools helps satisfy the needs of different investors. For example, the fixed
coupon rate offered by STACR SPI certificates may appeal particularly to life insurers who generally
prefer long-duration investments. It also gives the GSEs flexibility to adjust the mix of CRT instruments
over the cycle as demand by different investors fluctuates. This is important for stabilizing overall
demand for agency mortgage credit risk, and ensuring the program remains viable in a range of different
market environments.25 Experimentation is also valuable in itself, given that the CRT programs are still
relatively new.
That said, our assessment is that STACR/CAS should remain at the core of credit risk transfer programs.
STACR/CAS has proven successful in attracting a wide range of investors and diversifying exposure to
mortgage credit risk, and has created a secondary market for trading and pricing risk. The liquidity of
this market will be greater if CRT issuance is concentrated in STACR/CAS rather than being fragmented
across a large number of different programs. We also note that front end risk sharing provides less
diversification of mortgage credit risk than the various back end programs used to date, since it involves
credit risk being retained by loan sellers or specialized private mortgage insurers, which like the GSEs
already have a concentrated exposure to mortgage credit risk.
4. Outstanding Issues in CRT Design
The GSE STACR/CAS programs have been a success both for the GSEs and for participating investors.
These programs significantly diversified the GSEs’ concentrated exposure to mortgage credit risk among
a wider number of participants. For investors, the programs provided exposure to a significant part of
the residential credit sector. In this section, however, we consider a number of open issues regarding
the design of STACR/CAS securities and the GSE CRT programs more broadly.
4.1. Should the GSEs transfer first loss and catastrophic risk?
As discussed in section 2.1, the GSE credit risk exposure can be segmented into expected, unexpected,
and catastrophic losses, reflecting progressively higher losses which are correspondingly less likely to
25 Anecdotally we have heard from the GSEs that ACIS/CIRT reinsurers are generally considered to be stable buy-and-hold investors, and include a significant number of foreign investors, helping to diversify mortgage credit risk exposure.
15
occur.26 Current STACR/CAS security design focuses on transferring the unexpected losses borne by the
mezzanine bonds. As discussed below, we deem this to be an appropriate strategy, weighing the costs
and benefits of transferring different slices of mortgage credit risk.
Starting at the bottom of the capital structure, although the GSEs have embedded some sharing of the
most junior “first loss” tranche of credit losses into recent CRT transactions, they primarily retain this
exposure, for several reasons. First, losses sustained on this risk slice (usually around the first 50bp of
credit losses) are unlikely to lead to overall net losses for the GSEs after taking into consideration the
stream of guarantee fee income earned on the reference mortgage pool.27 Second, given that some
credit losses are expected to be incurred even during normal periods, selling the most junior slice of
credit losses is of limited benefit from a risk-sharing point of view. Third, by retaining the first loss piece,
the GSEs retain “skin in the game” exposure to the deal structure, which may help attract investors and
mitigate moral hazard given the important screening and ongoing monitoring role played by the GSEs.
Fourth, some private investors may face high capital costs from holding first-loss tranches (e.g., because
of minimum capital requirements or other regulations). Given these factors, as well as transaction costs,
selling the first loss tranche would be likely to increase the STACR/CAS implied guarantee fee relative to
current GSE execution. For example, we estimate that a 50 percent increase in the spreads for the first
loss piece would increase the STACR/CAS security implied guarantee fee from 18 bps to 23 bps.28
On the other side, should future risk-sharing transactions attempt to sell catastrophic risk, which to date
has been retained by the GSEs? Currently, the GSEs retain exposure to credit losses in excess of roughly
four percent of the principal value of the reference pool. Credit losses are only estimated to reach this
range under an extremely adverse macroeconomic environment.
26 Expected losses are, as their name suggests, a common part of residential credit. These losses are thought to be independent of the state of the economy or the housing market, but are thought to occur as a result of borrower specific circumstances. Catastrophic losses, meanwhile, are only seen during a significant downtown in the economy or housing market that typically exceeds that of a more frequent business cycle downturn. A business cycle recession or a regional national disaster that witnesses localized or modest national home price declines is expected to impact unexpected losses. 27 The FHFA estimates that the GSEs charged an average annual guarantee fee of 61 bps for 30-year fixed rate mortgages in 2016. 10bp of this fee is distributed to the U.S. Department of Treasury and 7bp is estimated to cover general and administrative expenses. The remainder of the fees covers credit risks included in the insured mortgages, including risk of catastrophic losses. 28 Calculations based on the Fannie Mae issued deal CAS 2017-C06 in which we assume that spreads for B2 tranches from 12% to 18% in a scenario in which Fannie Mae transfers the first loss credit risk to the private market.
16
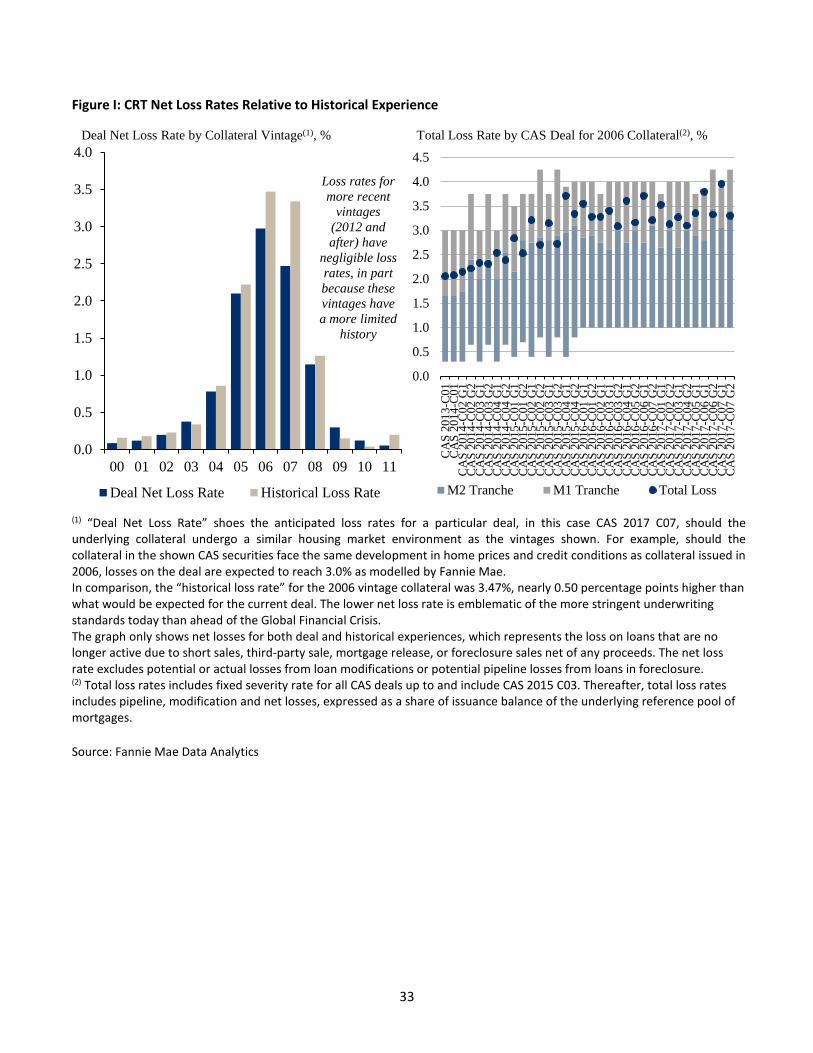
As an illustration of this point, the left panel of Figure I presents the projected cumulative credit loss
rates for the reference pool in a recent Fannie Mae CAS deal29 assuming that the evolution of
macroeconomic conditions matches the experience from different historical vintages. As the figure
illustrates, net credit losses are projected to reach 3.0 percent if the mortgage reference pool
experienced the same home price and macroeconomic environment as the 2006 vintage, originated just
prior to the housing market collapse and 2007-09 recession. Even this scenario would therefore not be
likely to lead to full extinguishment of the principal of the mezzanine CRT bonds, given that the senior
mezzanine security (M1) for this transaction covers cumulative credit losses up to 4.25 percent.
[Figure I: Projected CRT Net Loss Rates Relative to Historical Experience]
For comparison, the left panel of figure H also shows the actual realized credit loss rate for these
different vintages. Note that the conditional expected loss rate of 3.0 percent projected for the CRT
reference pool under post-2006 macroeconomic conditions is below the historical actual loss rate of 3.5
percent realized by Fannie Mae on their 2006 mortgage vintage.30 The difference between the two
reflects the improvement in credit quality and underwriting standards of agency mortgages post-crisis.
However, even under a more conservative assumption where losses match the historical performance of
Fannie Mae 2006 vintage mortgages one for one, net credit losses would not exceed the detachment
point of the M1 CRT tranche for this deal.
The right panel of Figure I presents results for the same exercise looking across CAS deals issued thus
far. Fannie Mae loan level disclosures and modelling show that total credit losses for performance
comparable to that experienced by 2006 collateral would not breach the catastrophic loss portion of
CAS deals issued to date.
Note that the attachment and detachment points reported in Figure I reflect the initial level of credit
enhancement at the point in time when the CAS/STACR deal is issued. Even though CRT deals do not
29 CAS 2017-C07, in this case collateral group 1 which represents low LTV pools. The average LTV of the collateral is 75.3%, compared to CAS 2017-C07 collateral group 2, which represents high LTV pools and has an average LTV of 92.5% at issuance. Recall, however that all mortgages with LTV exceeding 80 percent have additional credit enhancement in the form of private mortgage insurance. 30 Represents the credit net loss rate on 2006 issued original unpaid principal balance of Fannie guaranteed residential credit loans. Based on 2006 issuance of $172.4 billion, net losses totaled $6.6 billion. The figures exclude losses from expenses related to modification of loans or losses that occurred from loans that remain in the pipeline.
17
have an explicit cash flow lock out feature31, the deals do contain structural features which result in an
increase in credit enhancement for the senior tranche and mezzanine class over time, as we discussed in
section 3.1. Thus, if a period of housing stress occurred relatively early in a transaction’s life, losses
would reach further up the capital stack than would be the case in a more seasoned structure which has
already delevered somewhat.
This evidence suggests that the senior credit risk tranche currently retained by the GSEs would suffer
losses only in a very adverse macroeconomic environment, mirroring or exceeding the 2007-09 financial
crisis in magnitude and pervasiveness. We do note that the credit rating agencies project loss rates for a
“triple-A” level stress event of the order of 8-9 percent for recent CRT deals, significantly above the
detachment point for the M1 CRT bonds. These stress projections are based on very conservative
assumptions, however.
This logic suggests that the risk management benefits of transferring the senior tranches of credit risk
from the GSEs to the private sector would be relatively small. Furthermore, as we argue in section 2, it
also seems appropriate from a fiscal and financial stability perspective for the public sector to retain
exposure to mortgage tail risk, given the systemic risk of the housing sector. Against this limited upside,
the GSEs would incur some nontrivial costs if they were to transfer this risk. Aside from transaction
costs, this asset would be expensive to hold on bank or insurance company balance sheets given
constraints around regulatory capital. This asset will also likely command a sizeable liquidity premium.32
For these reasons, our reading of the evidence is that it is appropriate for the GSEs to retain this
catastrophe risk and first loss piece, while continuing to focus on transferring the mezzanine credit risk
associated with their guarantee portfolio.
4.2. The tradeoff in the timing of the GSE risk transfer
31 A cash flow lock out feature, used in certain types of insurance contracts and other securities containing credit risk, would delay principal and interest payments to investors until further credit enhancement has been built up in the structure. Although it would be possible to incorporate such a feature in the design of STACR/CAS deals, such a mechanism would extend the average lives of the mezzanine notes, in turn increasing the cost of the risk transfer as investors require higher returns to hold a similar credit risk over a longer period. 32 A hypothetical example around the expansion of the mezzanine structure might illustrate this point. Assume that the GSEs issued an additional senior mezzanine tranche covering credit losses between 4 percent and 7 percent of the reference pool. The additional tranche would bear little credit risk, suggesting it should trade at a very modest spread to the underlying floating rate. Hypothetically, the security could trade at Libor + 10 bps. However, given the high capital cost for the private investor and the unattractive return of such a security, demand would be rather weak, resulting in wider spreads for the additional now most senior mezzanine tranche.
18
Under the current approach to credit risk transfer, there is a time lag between when the GSE purchases
and securitizes agency mortgages and when the CRT securities are sold to investors. This lag arises
because it takes time to assemble a large enough reference pool of mortgages for inclusion in the CRT
transaction. The GSE remains exposed to mortgage credit risk during this intervening period when the
CRT deal is being assembled.
The FHFA has sought feedback regarding how to reduce the time lag between MBS issuance and the
transfer of credit risk. In this vein, Fannie Mae and Freddie Mac have completed several transactions
involving front-end risk sharing, in which mortgage sellers retain part of the credit risk in return for a
reduced guarantee fee or a premium payment from the GSEs. The transactions eliminate the
aforementioned time-lag between MBS securitization and risk transfer for the GSEs.33
Although front-end risk transfer appears appealing given the effective elimination of the
aforementioned time lag, this comes at the cost of a smaller investor universe. These front-end risk
transfers can only be conducted by mortgage originators delivering loans to the GSEs, therefore
significantly limiting the universe of possible holders of mortgage credit risk. This more limited investor
universe should make for less efficient execution, in turn raising the premium for the credit risk. From a
broader financial stability perspective, this approach also implies less system-wide diversification of
mortgage credit risk, given that mortgage originators, like the GSEs, are significantly exposed to the
housing market and are also often highly leveraged. Some earlier front-end risk transfer deals were then
securitized by the originators (e.g. JP Morgan Madison Avenue Securities), in turn helping the GSEs to
transfer the credit risk through an intermediary. However, these deals were one-off issuances that
required a significant liquidity premium, making them less appealing from an economic perspective for
the GSEs.
As the CRT market has ramped up in size, the GSEs have also shortened the time lag between mortgage
issuance and credit-risk transfer (see figure J). For recent CRT reference pools, loan age at the time of
the CRT transaction averages only about 4-6 months, a relatively small fraction of the 5-7 year average
life of a mortgage. Further reducing the pipeline risk, newly originated mortgages tend to have more
limited prepayment and credit risk in the early part of their life, because the borrower’s financial
33 In front-end or lender-facing upfront risk transfer transactions, the GSEs utilize collateralized recourse structures to sell credit risk on loans the GSEs counterparties originated and/or service at the time of loan acquisition from the GSEs.
19
position and the state of the economy likely have not evolved significantly from the point in time when
the mortgage was underwritten.
[Figure J: Weighted Average Reference Pool Loan Age by Quarter of STACR/ CAS Issuance]
4.3. Improving dealer market making capabilities
One of the major challenges to the STACR/CAS market has been dealers’ market making ability, which
has been primarily curbed by difficulties in warehousing securities to facilitate trading. Higher post-crisis
capital requirements and other regulations affecting securities trading portfolios, combined with the
limited turnover for CRT bonds, make it difficult for dealers to meet return on equity targets as CRT
market makers. Current STACR/CAS bid-ask spreads are estimated to be roughly 10 basis points,34 a level
which, on a standalone basis, does not support an attractive return on equity for dealers given current
CRT transaction volumes.
Despite these considerations, secondary market trading volumes in this sector have risen primarily
because dealers are incentivized to act as market makers in the secondary market through the allocation
of lucrative underwriting fees from the syndication process. The GSEs have chosen to allocate issuance
share according to dealers’ support for the secondary market, allocating more syndication volume to
dealers that support secondary market trading. The practice allows dealers to subsidize lower returns
generated from providing secondary market liquidity with lucrative underwriting. Whether such cross-
subsidies represent the most opportune way to support liquidity in the CRT sector is one aspect of the
market that regulators and policy makers may wish to consider in the future.
4.4. Further broadening the investor base
In addition to dealers’ limited market making ability, the STACR/CAS sector faces a number of regulatory
uncertainties, which once removed could further expand and deepen the investor base.
• The CAS and STACR deals are classified as derivative contracts for which the US Commodities
Futures Trading Commission requires investors to register as “commodity pool operators” or
otherwise have an exemption from registration. Although Fannie Mae and Freddie Mac received
exemptions from registering from the Commission, certain investors in the structures are unsure
34 Dealers generally do not take directional positions in markets. They rather profit from the bid-ask spread, which allows them to sell securities at prices (ask prices) slightly above the price at which they purchased the same security (bid price) shortly before.
20
whether the exemption extends to them as well. The overhang from regulatory uncertainty for
investors remains and therefore somewhat curbs attractiveness of the sector to a broader set of
investors (Goodman 2016).
• CRTs represent unsecured debt of the GSEs, while the underlying mortgage bonds are only
indexed in the structure. Given that STACR/CAS investors do not have recourse against the
underlying real estate assets, CRTs do not qualify as “good” assets for the purpose of the REIT
tax rules, precluding a significant residential mortgage investor class from investing in the sector
beyond their current more limited holdings.35 Recognizing this issue, the GSEs are currently
considering proposals to switch CRT bonds to a real estate mortgage investment conduit
(REMIC) structure, with the first transaction expected to be issued in mid-2018. A REMIC is a
pass-through trust which offers investors recourse to the underlying real estate assets.36
• STACR/CAS primary market issuance has seen more limited insurance company participation
given a lack of National Association of Insurance Commissioners (NAIC) ratings on the deals.
Obtaining such ratings at issuance would potentially help to attract more insurance companies
to participate as investors.
5. Conclusion
Like many observers, we believe that the Fannie Mae and Freddie Mac credit risk transfer programs
have to date been a notable success. The programs have reduced the exposure of the GSEs and the
Federal government to mortgage credit risk without disrupting the liquidity or stability of mortgage
secondary markets. In the process, the CRT programs have created a new financial market for pricing
35 Applicable REIT tax qualification rules require that 75% of gross income is derived from assets tied to real estate. In addition, at least 95% of the REIT’s gross income must be derived from real estate income that meets the 75% test plus passive income such as dividends and interest income. The monthly GSE interest payments on CRT securities would qualify as passive income and therefore count as “good income” with respect to the 95% test. Generally, REITs must also satisfy an exemption from registration to the Investment Company Act of 1940 in order to operate their businesses. This exemption requires a company to invest at least 55% of its assets in “mortgages and other liens on and interest in real estate” (qualifying interests) and at least 80% of its assets in qualifying interests plus “real estate-type interests” (real estate-type interests). On October 16, 2017, the Division of Investment Management of the SEC issued a no-action letter which specified that certain CRT securities may be treated as real estate-type interests under the Investment Company Act. 36 As long as a REMIC holds at least 95% in real estate assets, interests in the REMIC would be considered good REIT assets; the tax treatment would switch to a proportional allocation should the REMIC hold less than 95% of its assets in qualifying real estate.
21
and trading mortgage credit risk, which has grown in size and liquidity over time and attracted a broad
base of investors. A key benefit of the structured CRT bonds used to date by the GSEs, compared to
other possible types of mortgage risk transfer such as reinsurance, is that the market prices of these
bonds provide real-time market information about the price of credit risk in the mortgage market.
We note that the CRT programs have not yet been tested by an adverse macroeconomic environment,
and we cannot be certain how CRT investor demand and pricing will evolve under such conditions (see
Wachter, 2018, for a more detailed discussion of how CRT pricing may evolve over the housing cycle).
Careful management of the programs will likely be needed during such an episode. As we discuss, there
are also a several outstanding questions about the design of CRT instruments, and how to maximize
secondary market liquidity and enhance the breadth of the investor base. The credit risk transfer
programs will continue to grow and evolve in response to these considerations.
Even in the absence of legislation, the CRT program represents a valuable step forward towards GSE
reform, as well as a basis for future reform. Many proposals have been put forward for long-term
reform of mortgage market since the GSE conservatorships began in 2008.37 Although the details of
these proposals vary, they generally share in common the goals of (1) ensuring that mortgage credit risk
is borne by the private sector (probably with some form of government backstop and/or tail insurance
to insure catastrophic risk and stabilize the market during periods of stress), while (2) maintaining the
current securitization infrastructure as well as the standardization and liquidity of agency MBS markets.
The credit risk transfer program, now into its fifth year, represents an effective mechanism for achieving
these twin goals.
37 Reform proposals include Cantrill et al. (2018), Bright and DeMarco (2016), Ranieri et al. (2016), Mortgage Bankers Association (2017), Mosser, Tracy and Wright (2016), Scharfstein and Sunderam (2011). See Scharfstein and Swagel (2016) for a review and discussion of the Corker-Warner bill and other post-crisis legislative efforts to reform the housing finance system.
22
References
Bhutta, Neil and Benjaming Keys. 2017. "Eyes Wide Shut? Private Mortgage Insurance During the Housing Boom". Working Paper, University of Pennsylvania and the Federal Reserve Board. Bright, Michael and Edward DeMarco, 2016, “Towards a New Secondary Mortgage Market”, Milken Institute Center for Financial Markets. Canter, Michael. 2017. “Housing Finance Reforms – A CRT Investor’s Perspective”. Written Statement for Hearing before House of Representative Subcommittee on Housing and Insurance. December 6. https://financialservices.house.gov/uploadedfiles/hhrg-115-ba04-wstate-mcanter-20171206.pdf Cantrill, Libby, Michael Cudzil, Daniel Hyman and Kent Smith. 2018. “U.S. Housing Finance Reform: Why Fix What Isn’t Broken?” PIMCO Viewpoints, February. https://www.pimco.com/en-us/insights/viewpoints/viewpoints/us-housing-finance-reform-why-fix-what-isnt-broken/ (accessed 2/21/2018). Davidson, Andrew, William Roth, Howard Altarescu, Rohit Gupta, Laurie Goodman and Faith Schwartz. 2016. “Credit Risk Transfer: Making a Successful Program Even Better”. Urban Institute and CoreLogic Sunset Seminar. February 10. http://www.corelogic.com/downloadable-docs/schwartz_sunset_seminar_presentation.pdf Fannie Mae. 2017 “Fannie Mae 2017 Form 10-K.” http://www.fanniemae.com/resources/file/ir/pdf/quarterly-annual-results/2017/10k_2017.pdf Federal Home Financing Agency. 2017a. “2016 Report to Congress.” https://www.fhfa.gov/AboutUs/Reports/ReportDocuments/FHFA_2016_Report-to-Congress.pdf Federal Home Financing Agency. 2016a. “Fannie Mae and Freddie Mac Single Family Guarantees in 2015.” https://www.fhfa.gov/AboutUs/Reports/ReportDocuments/GFee_Report_FINAL.pdf Federal Home Financing Agency. 2016b. “Single-Family Credit Risk Transfer Request For Input.” June. https://www.fhfa.gov/PolicyProgramsResearch/Policy/Documents/SF-CRT-RFI-6292016.pdf Federal Home Financing Agency. 2015. “Overview of Fannie Mae and Freddie Mac Credit Risk Transfer Transactions.” August. https://www.fhfa.gov/aboutus/reports/reportdocuments/crt-overview-8-21-2015.pdf Federal Home Financing Agency. 2012. “A Strategic Plan for Enterprise Conservatorships: The Next Chapter in a Story that Needs an Ending.” February 21. https://www.fhfa.gov/AboutUs/Reports/ReportDocuments/20120221_StrategicPlanConservatorships_508.pdf Freddie Mac. 2017a. “Freddie Mac 2017 Form 10-K.” http://www.freddiemac.com/investors/financials/pdf/10k_021518.pdf
23
Freddie Mac. 2017b. “Freddie Mac Structured Agency Credit Risk Securitized Participation Interests: STACR SPITM.” October 2017. Frame, W. Scott. 2003. “Federal Home Loan Bank Mortgage Purchases: Implications for Mortgage Markets”. Federal Reserve Bank of Atlanta Economic Review, 88(3). https://www.frbatlanta.org/research/publications/economic-review/2003/q3/vol88no3_federal-home-loan-bank-mortgage-purchases.aspx Frame, W. Scott, Andreas Fuster, Joseph Tracy, and James Vickery. 2015. "The Rescue of Fannie Mae and Freddie Mac." Journal of Economic Perspectives, 29(2): 25-52. https://doi.org/10.1257/jep.29.2.25 Froot, Kenneth. 2001. The market for catastrophe risk: a clinical examination, Journal of Financial Economics, 60 (2–3), 529-571. https://doi.org/10.1016/S0304-405X(01)00052-6 Goodman, Laurie, Jim Parrott, Ellen Seidman and Mark Zandi. 2016. “How to Improve Fannie and Freddie’s Risk Sharing Effort.” Moody’s Analytics and Urban Institute, August. https://www.economy.com/mark-zandi/documents/2016-08-25-How-to-Improve-Fannie-and-Freddiess-Risk-Sharing-Effort.pdf
Goodman, Laurie and Jim Parrott. 2016. “A Glimpse at the Future of Risk Sharing.” Urban Institute. https://www.urban.org/research/publication/glimpse-future-risk-sharing Goodman, Laurie, Jim Parrott and Jun Zhu. 2015. “The Impact of Early Efforts to Clarify Mortgage Repurchases: Evidence from Freddie Mac and Fannie Mae’s Newest Data”, Urban Institute Housing Finance Policy Center Brief, March 12. https://www.urban.org/research/publication/impact-early-efforts-clarify-mortgage-repurchases Hancock, Diana and Wayne Passmore, Catastrophic Mortgage Insurance and the Reform of Fannie Mae and Freddie Mac, in The Future of Housing Finance, Martin Neil Bailey, ed., Brookings Institution Press. HousingWire. 2014. “GSEs officially update representation and warranty policies”. November 20. https://www.housingwire.com/articles/32130-gses-officially-update-representation-and-warranty-policies Hurst, Erik, Benjamin J. Keys, Amit Seru, and Joseph Vavra. 2016. "Regional Redistribution through the US Mortgage Market." American Economic Review, 106(10): 2982-3028. Jaffee, Dwight. 2003. “The Interest Rate Risk of Fannie Mae and Freddie Mac.” Journal of Financial Services Research, 24(1): 5-29. Kung, Edward. 2015. The Effect of Credit Availability on House Prices: Evidence from the Economic Stimulus Act of 2008. Working Paper, UCLA. Available at https://sites.google.com/site/edwardkung/ Leamer, Edward. 2015. “Housing Really Is the Business Cycle: What Survives the Lessons of 2008–09?” Journal of Money, Credit and Banking, Vol. 47 (1) Supplement, March–April. http://onlinelibrary.wiley.com/doi/10.1111/jmcb.12189/pdf
24
Lucas, Deborah and Robert McDonald. 2010. “Valuing Government Guarantees: Fannie and Freddie Revisited”, in Measuring and Managing Federal Financial Risk, University of Chicago Press. Mortgage Bankers Association, 2017. “GSE Reform Principles and Guardrails.” January. Parrott, Jim, Lewis Ranieri, Gene Sperling, Mark Zandi and Barry Zigas, 2016, “A More Promising Road to GSE Reform”, Working Paper, Urban Institute, March. Reinhart, Carmen and Kenneth Rogoff. 2009. “This Time Is Different: Eight Centuries of Financial Folly.” Princeton University Press. Scharfstein David and Phillip Swagel, 2016, “Legislative Approaches to Housing Finance Reform, Milken Institute Center for Financial Markets, October. Scharfstein, David and Adi Sunderam, 2011, “The Economics of Housing Finance Reform: Privatizing, Regulating and Backstopping Mortgage Markets”, in The Future of Housing Finance, Martin Neil Bailey, ed., Brookings Institution Press. SIFMA. “US Bond Market Issuance and Outstanding.” October 2017. https://www.sifma.org/resources/research/us-bond-market-issuance-and-outstanding/ Shleifer, A. and Vishny, R. W. 1992. Liquidation Values and Debt Capacity: A Market Equilibrium Approach. The Journal of Finance, 47: 1343–1366. doi:10.1111/j.1540-6261.1992.tb04661.x Stanton, Richard and Nancy Wallace. 2011. “The Bear's Lair: Index Credit Default Swaps and the Subprime Mortgage Crisis”, The Review of Financial Studies, 24(10), 3250–3280, https://doi.org/10.1093/rfs/hhr073 Vickery, James, and Joshua Wright. 2013. TBA Trading and Liquidity in the Agency MBS Market. Federal Reserve Bank of New York Economic Policy Review 19:1-18. Wachter, Susan. 2018. Credit Risk Transfer, Informed Markets, and Securitization. Federal Reserve Bank of New York Economic Policy Review, this volume. Zandi, Mark, Gus Harris, Ruby Shi and Xinyan Hu, 2017, Who Bears the Risk in Risk Transfers? Moody’s Analytics, August. https://www.economy.com/mark-zandi/documents/2017-08-02-who-bears-the-risk.pdf

25
Figures
Figure A: Cumulative Single Family Credit Risk Transfer Transactions(1,2)
Senior
Mezzanine
First Loss
Reference Pool(4) $1,788
GSEs(3) $1,713
GSEs $3
GSEs $11
ACIS/ CIRT(4)
$13
STACR/CAS Notes $42
Front-end risk sharing
$1
Front-end risk sharing
$2
STACR/ CAS Notes $4
Paydowns
Losses
(1) Represents the issuance amount across Fannie Mae and Freddie Mac since inception of the credit risk transfer program in 2013; current amount outstanding is smaller than the numbers quotes. All figures are quoted in USD billions as of December 31, 2017
(2) Actual tranche sizes vary across programs. (3) Orange boxes represent risk amounts retained by the GSEs, blue boxes represent risk sold to the private sector. (4) ACIS refers to the Freddie Mac Agency Credit Insurance Structure program, and CIRT is the Fannie Mae Credit
Insurance Risk Transfer (CIRT) program. See section 3.5 for details. (5) For CIRT and some front-end risk sharing transactions, “reference pool” reflects the pool of covered loans
Source: Fannie Mae 2017 10K, Freddie Max 2017 10K.

26
Figure B: Illustrative Enterprise Debt Issuance Structure
Source: Fannie Mae (1) STACR/ CAS reference pools have averaged $18.8 billion per STACR deal and $31.1 billion per CAS deal.
Enterprises
Tranche Structure
Senior A Tranche Retained
M-1 M-1 Tranche (Sold)
M-2 M-2 Tranche (Sold)
B1 B1 Tranche (Sold)
Private Investors
Reference Pool of
Mortgages(1)
Retained Tranches
Risk Sharing
Tranches
Principal and Interest Payments
Enterprise Issues Debt Securities
100% Loss
4.0% Loss
1.0% Loss
0.5% Loss
0.0% Loss
Subordination (Payment Priority)
Losses
Note Sale Proceeds
B2 Tranche (Retained)
3.0% Loss
Credit events in the Reference Pool reduces principal and interest
payments based on either calculated or actual losses
27
Figure C: Anticipated CAS Deal Balance and Cash Flows
Source: Intex, Authors’ Calculations
Note: The structure shown represents CAS 2017-C06 under a baseline scenario of credit losses. (1) The graph is based on a constant prepayment rate of 10 CPR, representing a 10% decline in the outstanding reference pool balance per year as a result of mortgage prepayments. (2) Principal losses are modelled as serious delinquencies (borrowers are 120+ days delinquent) rising to 30 bps of the outstanding mortgage reference pool over the initial 36 months of the deal outstanding, thereafter staying constant for 24 months at 30 bps, before declining linearly to 15 bps. Losses are assumed to reach a 20% severity with an 18 month delay (time necessary to foreclose of delinquent borrowers).
0
5
10
15
20
25
30
35
0
100
200
300
400
500
600
700
0 10 20 30 40 50 60 70 80 90 100 110B2 B1 M2 M1 Est.Cum Principal Loss (rhs)
Outstanding CAS Balance by Trache(1), $ million
Estimated Cumulative Principal Loss(2), $ million
28
Figure D: CRT Issuance Volumes and Spreads at Issuance(1)
Source: Bloomberg, Authors’ Calculations (1) Includes only standard STACR/CAS deals and excludes recent STACR deals with special collateral such as STACR 2017-HRP1, a deal which utilized collateral that went through the Home Affordable Refinance Program (HARP), or the STACR 2017-SPI1, a credit risk transfer transaction that utilizes a REMIC election on the underlying mortgages.
0.0
2.0
4.0
6.0
8.0
10.0
12.0
14.0
16.0
2013 2014 2015 2016 2017Freddie (STACR) Fannie (CAS)
Total CRT Issuance by Year, $ billion
0
50
100
150
200
250
300
350
400
450
2013 2014 2015 2016 2017Freddie (STACR) Fannie (CAS)
Weighted Average Spread to Libor at Issuance, bps
29
Figure E: Bond Rating Upgrades
Initial and current credit ratings on STACR/CAS bonds. NR = not rated.
Source: Morgan Stanley, Fitch, author calculations.
Note: STACR/CAS deals shown represent Fitch-rated securities. The sample includes the first deal issued by either GSE for the years 2013 through 2015 that was rated. STACR 2014-DN1 did not receive any ratings.
30
Figure F: Credit Risk Transfer Average Daily Trading Volumes
Source: Finra TRACE, JP Morgan Chase
0
20
40
60
80
100
120
140
160
180
2014 2015 2016 2017 2018Freddie Mac (STACR) Fannie Mae (CAS)
Average daily trading volumes (20-day moving average), $ million
Annual averages
31
Figure G: Comparative Trading Volumes
Trading volume and number of trades for STACR/CAS credit risk transfer securities. Of the four tranche types listed, M1 is the most senior, followed by M2, M3 and B (which corresponds to first loss tranches).
Source: FINRA, MarketAxess, JP Morgan
M1 M2 M3 BTraded Volume by Year ($, million)2015 3,357 9,653 4,768 474 4,442,003 336,043 2016 2,439 12,067 6,440 769 4,805,017 297,699 2017 3,184 17,476 4,513 4,166 4,859,517 225,216
Number of Trades ('000)2015 1.0 2.7 1.3 0.2 11,266.7 166.12016 1.1 3.7 1.9 0.3 13,372.5 144.82017 1.6 5.7 1.4 1.5 14,338.2 136.0
Average Size (Traded Volume/ Number of Trades, $ million)2015 3.3 3.6 3.7 2.2 0.4 2.02016 2.2 3.2 3.4 2.3 0.4 2.12017 1.9 3.1 3.3 2.8 0.3 1.7
Corp. Bonds
Non-agency MBS
STACR/ CAS
32
Figure H: On the Run Spreads vs High-Yield Bonds
Source: Bank of America
0
100
200
300
400
500
600
700
800
900
1,000
6/1/15 10/1/15 2/1/16 6/1/16 10/1/16 2/1/17 6/1/17 10/1/17STACR BB/B-Rated Libor Spreads High Yield Bond Spread
Spread, bps
Periods of spread widening described in greater detail
33
Figure I: CRT Net Loss Rates Relative to Historical Experience
(1) “Deal Net Loss Rate” shoes the anticipated loss rates for a particular deal, in this case CAS 2017 C07, should the underlying collateral undergo a similar housing market environment as the vintages shown. For example, should the collateral in the shown CAS securities face the same development in home prices and credit conditions as collateral issued in 2006, losses on the deal are expected to reach 3.0% as modelled by Fannie Mae. In comparison, the “historical loss rate” for the 2006 vintage collateral was 3.47%, nearly 0.50 percentage points higher than what would be expected for the current deal. The lower net loss rate is emblematic of the more stringent underwriting standards today than ahead of the Global Financial Crisis. The graph only shows net losses for both deal and historical experiences, which represents the loss on loans that are no longer active due to short sales, third-party sale, mortgage release, or foreclosure sales net of any proceeds. The net loss rate excludes potential or actual losses from loan modifications or potential pipeline losses from loans in foreclosure. (2) Total loss rates includes fixed severity rate for all CAS deals up to and include CAS 2015 C03. Thereafter, total loss rates includes pipeline, modification and net losses, expressed as a share of issuance balance of the underlying reference pool of mortgages. Source: Fannie Mae Data Analytics
0.0
0.5
1.0
1.5
2.0
2.5
3.0
3.5
4.0
00 01 02 03 04 05 06 07 08 09 10 11
Deal Net Loss Rate Historical Loss Rate
Deal Net Loss Rate by Collateral Vintage(1), %
Loss rates for more recent
vintages (2012 and after) have
negligible loss rates, in part because these vintages have a more limited
history
0.0
0.5
1.0
1.5
2.0
2.5
3.0
3.5
4.0
4.5
CA
S 20
13-C
01C
AS
2014
-C01
CA
S 20
14-C
02 G
1C
AS
2014
-C02
G2
CA
S 20
14-C
03 G
1C
AS
2014
-C03
G2
CA
S 20
14-C
04 G
1C
AS
2014
-C04
G2
CA
S 20
15-C
01 G
1C
AS
2015
-C01
G2
CA
S 20
15-C
02 G
1C
AS
2015
-C02
G2
CA
S 20
15-C
03 G
1C
AS
2015
-C03
G2
CA
S 20
15-C
04 G
1C
AS
2015
-C04
G2
CA
S 20
16-C
01 G
1C
AS
2016
-C01
G2
CA
S 20
16-C
02 G
1C
AS
2016
-C03
G1
CA
S 20
16-C
03 G
2C
AS
2016
-C04
G1
CA
S 20
16-C
05 G
2C
AS
2016
-C06
G1
CA
S 20
16-C
07 G
2C
AS
2017
-C01
G1
CA
S 20
17-C
02 G
2C
AS
2017
-C03
G1
CA
S 20
17-C
04 G
2C
AS
2017
-C05
G1
CA
S 20
17-C
06 G
1C
AS
2017
-C06
G2
CA
S 20
17-C
07 G
1C
AS
2017
-C07
G2
M2 Tranche M1 Tranche Total Loss
Total Loss Rate by CAS Deal for 2006 Collateral(2), %
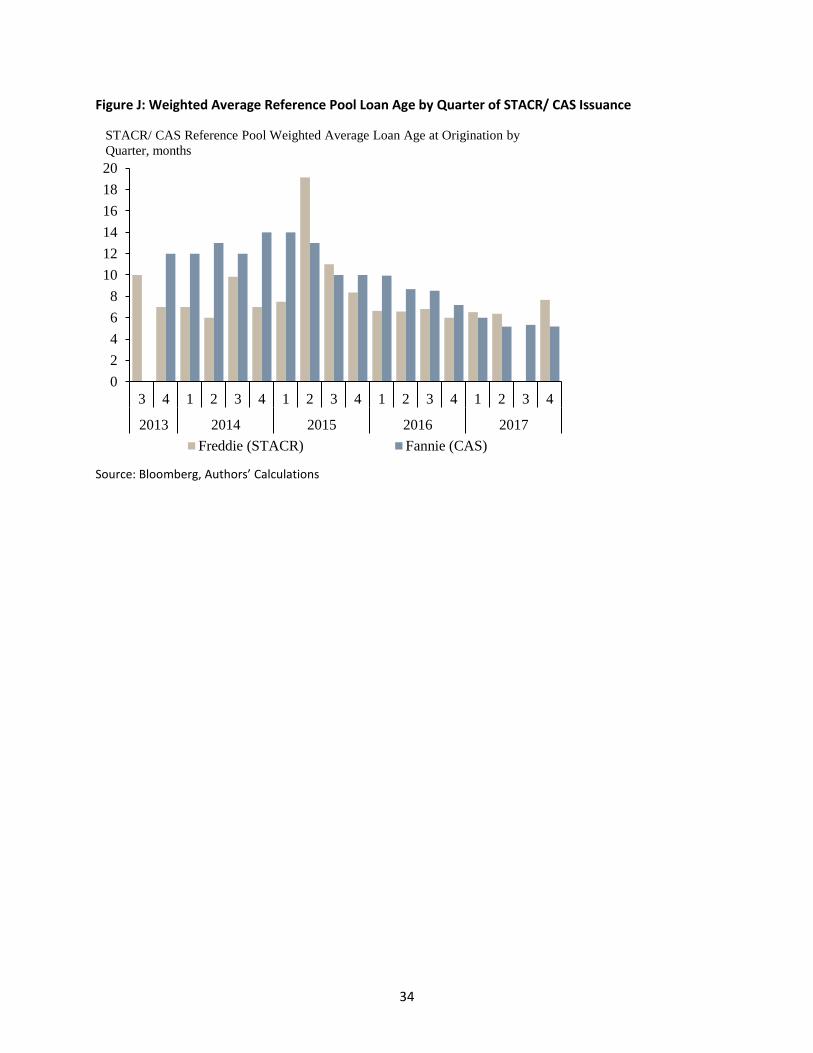
34
Figure J: Weighted Average Reference Pool Loan Age by Quarter of STACR/ CAS Issuance
Source: Bloomberg, Authors’ Calculations
02468
101214161820
3 4 1 2 3 4 1 2 3 4 1 2 3 4 1 2 3 4
2013 2014 2015 2016 2017Freddie (STACR) Fannie (CAS)
STACR/ CAS Reference Pool Weighted Average Loan Age at Origination by Quarter, months