creativity, entrepreneurship and economic …centaur.reading.ac.uk/54798/1/creativity spillover...
TRANSCRIPT

Creativity entrepreneurship and economic development cityshylevel evidence on creativity spillover of entrepreneurship Article
Accepted Version
Belitski M and Desai S (2016) Creativity entrepreneurship and economic development cityshylevel evidence on creativity spillover of entrepreneurship Journal of Technology Transfer 41 (6) pp 1354shy1376 ISSN 1573shy7047 doi httpsdoiorg101007s10961shy015shy9446shy3 Available at httpcentaurreadingacuk54798
It is advisable to refer to the publisherrsquos version if you intend to cite from the work See Guidance on citing
To link to this article DOI httpdxdoiorg101007s10961shy015shy9446shy3
Publisher Springer
All outputs in CentAUR are protected by Intellectual Property Rights law including copyright law Copyright and IPR is retained by the creators or other copyright holders Terms and conditions for use of this material are defined in the End User Agreement
wwwreadingacukcentaur
CentAUR
Central Archive at the University of Reading
Readingrsquos research outputs online
1
CREATIVITY SPILLOVER OF ENTREPRENEURSHIP AN EMPIRICAL STUDY OF
CREATIVITY ENTREPRENEURSHIP AND URBAN ECONOMIC DEVELOPMENT
Maksim Belitski
Henley Business School
University of Reading
Email mbelitskireadingacuk
Sameeksha Desai
School of Public and Environmental Affairs
Indiana University
Email desaiindianaedu
Abstract We examine the black box of creativity entrepreneurship and economic
development by asking about the mechanisms through which creativity can influence
economic development in cities We propose that like the knowledge spillover theory of
entrepreneurship creativity spillovers occur and can be slowed by a creativity filter We
examine how creativity and entrepreneurship and creativity and a melting pot environment
interact to influence urban economic development Using data on 187 cities in 15 European
countries for the period 1999-2009 we advance the extant literature by providing evidence on
the existence and dynamics of a creativity filter
Keywords creativity spillover entrepreneurship melting pot economic development urban
2
1 Introduction
Creativity and ideas are key components in enhancing the performance of
organizations (Drazin Glynn and Kazanijan 1999 Shalley Gilson and Blum 2000 Shalley
Zhou and Oldham 2004 Fleming and Marx 2006 Somech and Drach-Zahavy 2013) and
regions (Lucas 1988 Rodriacuteguez-Pose and Vilalta-Bufigrave 2005 Acs and Armington 2006
Audretsch and Keilbach 2007 Marrocu and Paci 2012) Despite several studies which
examine the relationship between human capital creativity and regional economic
development (eg Boschma and Fritsch 2009 Markusen 2006 Marrocu and Paci 2012)
relatively little attention has been paid to the mechanisms that induce these effects and in
particular at the subregional level such as the city (Audretsch et al 2015) An important
question concerns how creativity can be facilitated and harnessed for greater urban economic
development (Boschma and Fritsch 2009 Lorenzen and Andersen 2009 Falck Fritsch and
Heblich 2011)
Several streams of inquiry are relevant in answering this question Ongoing research
on creativity and entrepreneurship in the last 10-15 years has examined individuals and teams
(Cohen and Bailey 1997 Gilson and Shalley 2004 Shalley et al 2004 Fleming et al
2007 ) firms (Choi Anderson and Veillette 2009 Somech and Drach-Zahavy 2013) or
regions and countries (Fleming and Marx 2006 Boschma and Fritsch 2009 Lorenzen and
Andersen 2009) While these studies have advanced our understanding of the relationship
between creativity and entrepreneurship the conduit from creativity to economic growth
remains an open question (Audretsch and Belitski 2013)
A second important stream of inquiry is on knowledge spillovers found to be greater
in regions with higher population density industrial density and cultural diversity (Audretsch
et al 2010) indicating exploitation of competitive advantage of urban areas (Brunello and
De Paola 2004 Audretsch and Lehmann 2005 Agarwal et al 2007 2010) Recent studies
3
on creativity and knowledge spillovers of entrepreneurship (Audretsch and Keilbach 2007
Acs et al 2009 Agarwal et al 2010 Marrocu and Paci 2012) have not yet produced
consensus on how geography and entrepreneurship can influence knowledge flows and
effects on urban economic development and how region-specific characteristics of human
capital need to be taken into account (Qian et al 2012) Some of these studies consider the
firm level examining the generation of creativity in groups and organizations and how this
influences economic performance (Gilson and Shalley 2004 George 2007 Somech and
Drach-Zahavy 2013) and others examine the contexts for human and creativity in varied
business environments (Rodriacuteguez-Pose and Vilalta-Bufigrave 2005 Acs and Armington 2006
Audretsch Keilbach and Lehmann 2006 Florida et al 2008 Agarwal et al 2010)
These streams of prior research point to the role for creativity in entrepreneurship as
well as in contributing to economic performance However our study focuses on a significant
gap which still exists on the mechanisms of creativity commercialization for urban economic
development (Audretsch and Keilbach 2007 Acs et al 2009 Boschma and Fritsch 2009
Asheim and Hansen 2009) In addressing this gap we bridge the literature on knowledge
spillover theory of entrepreneurship and the literature on creativity and entrepreneurship
We make four contributions to the existing literature First we treat creativity as
heterogeneous and as ldquoa different measure of human capital - the lsquocreative classrsquo based on
the actual occupations of individuals in specific jobsrdquo (Marrocu and Paci 2012 369) In
doing so we draw upon the heterogeneity of creativity (Lee Florida and Acs 2004
Markusen 2006 Asheim and Hansen 2009 Lorenzen and Andersen 2009 Florida and
Mellander 2010 and Marrocu and Paci 2012) This goes beyond extant studies linking
entrepreneurship and creativity which treat creativity as homogeneous (Amabile 1996 Choi
et al 2009 Fleming and Marx 2006) Second we provide empirical evidence that industry
mix does not per se contribute to urban economic development as long as what people know
4
and create is recognised and exploited through starting a new business (Audretsch et al
2006 2008 Qian et al 2012) Third we demonstrate through interaction analysis the role of
entrepreneurship in moderating the relationship between creativity embedded in a specific
industrial sectors and urban economic development Our approach suggests this could be a
missing link with important implications for organizational and urban competitiveness
Fourth we introduce the concept of a creativity filter as a gap between commercialized and
uncommercialized creativity We also find that cities rich in openness talent and diversity are
associated with a higher regional development
Building upon the knowledge spillover theory of entrepreneurship (Acs et al 2009
Audretsch and Keilbach 2007 Agarwal et al 2010) and studies of creativity and
entrepreneurship in ldquoplacesrdquo (Florida 2002 Boschma and Fritsch 2009 Asheim and
Hansen 2009 Marrocu and Paci 2012) we demonstrate that entrepreneurship serves as a
conduit for the spillover of knowledge and creativity to urban economic development
The remainder of the paper is as follows In the next section we discuss our
theoretical background and our hypotheses We present our data and method in the third
section and report our results in the fourth section We discuss our findings in section five
followed by a brief conclusion
2 Theoretical Background and Hypotheses
21 The notion of creativity
The concept of creativity is difficult to capture and measure yet continues to gain
importance and meaning to organizations and to policymakers Creativity in the 1990s was
linked as an outcome to the production of new ideas and marketable innovation (eg
Amabile 1996 Oldham and Cummings 1996 Drazin et al 1999) A series of studies on
creativity and entrepreneurship since the late 1990s (Cohen and Bailey 1997 Fleming and
5
Marx 2006 Boschma and Fritsch 2009 Marrocu and Paci 2012) argued that creative
activity can improve individual firm and cluster performance
Florida (2002) identified creativity as the process of introducing and implementing
new ideas which are critically processed such that other ideas seem useless or trivial
Creativity is embodied in an individual who adds economic value of a firm (Florida 2002) A
management perspective on creativity (Drazin et al 1999) is more tangible and treats it as
the ability to focus on and identify complex problems formulate propositions and make
inferences from hypotheses discuss ideas with others through socialization and networking
and even contradict normal expectations Consequently creative people can choose to engage
(or not) in a creative process and to transfer (or not) creative ideas into marketable products
(Kahn 1990) Problem identification and linking new ideas can be benefits from creative
activity not simply just product creation (Gilson and Shalley 2004)
While some studies on performance outcomes treat creativity as homogeneous
(Shalley et al 2004 Choi et al 2009 Somech and Drach-Zahavy 2013) the literature on
creativity and entrepreneurship tends to consider creativity as a heterogeneous concept (Lee
et al 2004 Florida 2002 Boschma and Fritsch 2009 Florida and Mellander 2010 Falck et
al 2011) Building on entrepreneurship and creativity literature we consider creativity as the
individualrsquos ability to introduce and implement new ideas and new work style which can
differ across various industries known as creative industries (Boschma and Fritsch 2009)
Creativity embedded in an individual or industry (Florida 2002) is therefore heterogeneous
because it can vary based on profession and industry not necessarily qualifications and is
diffused through the professional activity of an individual Though members of the creative
class may be found in every industry it is useful to distinguish workers employed in sectors
where performing creative tasks is secondary from workers employed in sectors where it is
primary It is also useful to distinguish creativity from human capital because what people do
6
may be different from what they know (Marlet and van Woerkens 2004) Human capital is
considered and measured as some type of formal educational attainment such as the
proportion of population with university or college degree (Glaeser 2004 Qian et al 2012)
It is important to recognize that human capital and creativity are not the same (Florida et al
2008 Boschma and Fritsch 2009)
22 Creativity economic development and entrepreneurship
Although a positive impact of creativity on urban economic development is almost
intuitive (Florida 2002 2012 Markusen 2006 Agarwal et al 2010) the mechanisms which
act as a conduit of creativity to entrepreneurship remain subtle This is at least for three main
reasons First unlike knowledge (Arrow 1962 Acs et al 2009) creativity is distinct from
traditional resources because of excludability and non-transferability Creativity is impossible
to transfer to other individuals because of the skill experience talent work and lifestyle of
the individual This is unlike formal education such as specialized degree programs which
can more reasonably be compared As opposed to human capital and knowledge creativity
could be excluded from accessing and using creative ideas skills and talent by a third party
as this capital is in an individualrsquos head The use of creative skills and new ideas by an
individual (unlike the use of knowledge clustered within an organization industry or a city)
does preclude others from copying creativity
Second outcomes associated with new non-trivial ideas generated by the creative
class are highly uncertain (Florida 2002) Creative individuals will be affected by uncertainty
related to bringing their creative ideas into the market and turning those ideas into profitable
sustainable business activity
Third a climate conducive to creativity is critical for individuals to engage in creative
problem-solving Creativity (unlike human capital and information) can only be transmitted
7
when members of a group feel comfortable in jointly taking risks resolving uncertainty and
finding new ways of problem-solving The environment in which the creative class works
should be perceived as non-threatening tolerant and open to different ideas and cultures
(West 1990 Florida 2002) Creative individuals need to feel comfortable taking risks in a
non-threatening environment conducive to new ideas (Gilson and Shalley 2004 Shalley et
al 2004) Such an environment could include collaborative networks which influence
creativity (Fleming and Marx 2006) and could create a supportive and conducive
environment to test new ideas An environment filled with new ideas alternative solutions
collaborative networks and cultural diversity is known as a melting pot environment (Lee et
al 2004 Bassett‐Jones 2005 Boschma and Fritsch 2009) and conditional on the level of
creativity can enhance economic development in cities The role of diversity and
cosmopolitanism can be especially important (Audretsch et al 2010 Florida 2012) We
therefore hypothesize
H1a More creativity is associated with higher urban economic development
H1b A combination of creativity and a melting pot environment is associated with
higher urban economic development
A related question is what affects the propensity of creativity to spill over Audretsch
and Keilbach argue that that (unlike investment in physical capital) investments in
knowledge are more likely to spill over for commercialization by third-party firms who have
not incurred the full costs associated with implementing ideas developed from the knowledge
(2007 1246) Entrepreneurship such as in the form of newly established firms can also
serve as a conduit of knowledge in an economy (Audretsch and Lehmann 2005 Audretsch et
al 2008 Acs et al 2009 Zahra and Wright 2011) and impact economic development by
channeling other resources such as creativity However the possible mechanism of creativity
spillover ndash in other words a conduit which enables introducing outcomes of creative ideas to
8
the market - remains a black box Since creativity promotes idea generation but the
implementation of those ideas is limited due to things like non-transferability and idea
uniqueness creativity could affect economic development indirectly via entrepreneurship
Specifically an interaction analysis allows us to consider an effect of creativity on economic
development conditional on entrepreneurship in a city (Audretsch et al 2015)
Our creativity spillover of entrepreneurship approach clarifies where (melting pot
environment) and why (higher entrepreneurship) creativity may positively contribute to
entrepreneurship innovation and growth in firms industries and cities Our creativity
spillover of entrepreneurship approach adds to the growing literature on the knowledge
spillover of entrepreneurship (Audretsch and Keilbach 2007 Acs et al 2009) and to
research on entrepreneurship and creativity (eg Gilson and Shalley 2004 Somech and
Drach-Zahavy 2013) and states that entrepreneurship may tap into creative melting pot
environments to produce more outputs Creativity is embodied in individuals and industries
(Stein 1974 Markusen 2006) which Florida (2002) posits as ldquocreative classesrdquo across
various sectors that can drive change and commercialize the outcomes of entrepreneurship
We consider entrepreneurial activity serves as a conduit of creativity to high growth
(Agarwal et al 2010) Unlike other models such as input-process-output models creativity
needs to be brought to the market by a third party (entrepreneur) which performs the role of a
conduit for the path from creativity to marketing new ideas We thus hypothesize
H2a Entrepreneurship moderates the relationship between creativity and urban
economic development (creativity spillover of entrepreneurship)
Entrepreneurs have been found to facilitate commercialization of ideas (Acs et al
2009 Qian et al 2012) Creativity that could be commercialized but is not creates a
potential gap in creativity diffusion We refer to this as a creativity filter The larger the gap
between the ideas embodied in the creative class and the actual commercialization of ideas
9
then the larger the creativity filter It can be also explained as a creativity gap eg the
difference between the potential of creativity commercialisation and a factual
commercialisation of creativity Unlike the knowledge filter which was described by
Audretsch and Keilbach (2007 1247) as ldquoinertia inherent in decision-making under
uncertainty within incumbent organizationsrdquo the creativity filter is about the inertia inherent
in decision-making of entrepreneurs under uncertainty It is a combination of an individual
ready to recognize the opportunity and be creative to push it further in the market (Audretsch
and Belitski 2013) We hypothesise
H2b The size of the creativity filter will be larger with less entrepreneurship
Along with entrepreneurship melting pot environments perceived as comfortable and
nonthreatening for creativity diffusion will minimize the volume of creativity which does not
get commercialized An individual may choose not to share creative ideas should the benefits
be uncertain and the environment unfriendly (Gilson and Shalley 2004) The knowledge base
can influence living and business climate in terms of attracting and retaining talent (Asheim
and Hansen 2009)
The presence of a melting pot environment which offers tolerance and diversity
(Florida 2002 Audretsch et al 2010) is conducive to economic development This kind of
environment is appreciated by the creative class creating more space for people who do not
fit with common norms to leverage new ideas and creativity (Florida 2012) This increases
opportunities for innovative thinking and development of new competitive knowledge and
raises the chances of more well-educated and entrepreneurial people moving and starting
business in a city bringing regional change (Glaeser et al 2010 2014) Entrepreneurs
attracted to amenities and diversity (Florida 2002) will commercialize knowledge (Acs et al
10
2009) and find new combinations (Agarwal et al 2010) Similarly a non-melting pot
environment should hinder commercialization of creative ideas We thus hypothesize
H3 A melting pot environment is associated with higher urban economic
development
The entire mechanism of the creativity spillover of entrepreneurship is shown in Figure 1
3 Method
31 Data
Methodologically cities are the most appropriate spatial units to fully understand the
process of creativity commercialization (Florida 2002 Audretsch et al 2015) Our study
follows the Eurostat classification of a core city also known as the local administrative unit
(LAU) corresponding to administrative boundaries of the city (European Commission
2010) The advantage of using LAUs is an emphasis on knowledge spillovers which can
occur within a certain area1 (Audretsch and Feldman 1996 Peri 2005 Acs and Armington
2006 Audretsch et al 2006) as well as managerial concerns and responsibility when
designing policies for cities
We use the European Urban Audit Surveys (UAS) from Eurostat (2012) UAS is a
comprehensive dataset of socio-economic business environment entrepreneurship national
composition and education indicators Our cross-sectional dataset includes 187 cities in 15
European countries for the period 1999-2009 (see Table 1 and Figure 2) The data is a three
period short panel The dataset includes 153 (81) cities in Western Europe and 33 (19)
cities in Eastern Europe The sample includes cities with at least 50000 residents
1 It is important to note that economic activity may cross core-city boundaries For example the ldquototal
populationrdquo indicator provides the amount of people living within the city but does not include surrounding
communities outside the core city Therefore a question may arise over whether the surrounding agglomeration
zone potentially effects urban economic development within larger urban areas Later in the paper we report on
a robustness check which we implement in light of the overlap of economic activity between the LAU and large
urban zones (LUZ) Leveraging this effect ties to the concept of market potential (Harris 1954)
11
Due to missing values in the data once all variables are included we are left with 240
observations (on average 14 observations per city) Another factor worth noting is the
distribution of data within time periods 81 of the city observations were available from 1999-
2002 172 from 2003-2006 and 139 from 2007-2009 While included all variables the number
of observations with non-missing values has dropped to 240 Note that the market potential
indicator was not taken directly from Eurostat but was designed for a robustness check
Variables and summary statistics are shown in Table 2 A correlation matrix is shown in
Table 3
32 Variables and controls
Dependent variable
Our dependent variable urban economic development is measured as GDP per capita
in PPP (in Euro) taken in logarithms This measure has been used in the established literature
for studies of countries and regions (Glaeser et al 2010 Audretsch et al 2006 2010) The
UAS is relatively new and our study is among the first to use this across cities
Explanatory variables
Our first variable of explanatory interest is creativity (Stein 1974 Amabile 1996)
We measure creativity with consideration of industry (Audretsch et al 2002 Boschma and
Fritsch 2009) using aggregated sectors classified by NACE2 and identifying creativity as a
proportion of employment in those sectors We use the following sectors Culture High-Tech
manufacturing Trade and hospitality Finance Public Communication and ICT We do not
include the agriculture fishing and forestry sector which becomes a reference category The
proportion employed in culture and entertainment is a proxy for creativity in the Culture
2 NACE - General Name for Economic Activities in the European Union and is the European standard for
industry classifications introduced in 1970
12
sector3 the proportion employed in high-tech manufacturing is a proxy for creativity in the
high-tech manufacturing sector and likewise for each of the remaining Trade and hospitality
Finance Public Communication and ICT sectors Our reasoning behind consideration of
ldquoindustry mixrdquo (Audretsch and Feldman 1996 Audretsch et al 2002) is that in addition to
industry-specific characteristics which could themselves be more or less attractive to creative
individuals ldquocertain occupations are more important than others when it comes to
entrepreneurship (Florida 2012)rdquo This could be the case when some job tasks are creative in
nature such as in ICT or trade and hospitality (Lee et al 2004 Boschma and Fritsch 2009)
Also this could be the case in industries where basic business skills are part of the industry
and in industries where market knowledge may be important to industry activity such as in
media design and entertainment high-tech manufacturing and ICT (Florida 2012)
Our second explanatory variable captures diversity and tolerance in a city (Florida
2002) To do this we measure the melting pot index as the population comprising non-
European Economic Area (EEA) nationals which captures diversity tolerance and openness
to new ideas (Florida 2002 2012 Lee et al 2004)
Our third explanatory variable is entrepreneurship measured as a proportion of new
business start-ups to existing companies registered in a city (see Praag and Versloot 2007
Zahra and Wright 2011) New business start-up refers to enterprise births4
in a city an
existing company moving in is regarded as new (Eurostat 2012) The proportion of new
start-ups as a dynamic measure of entrepreneurship is robust (Shane and Venkataraman
2000) and has two advantages First it is an established proxy for the intensity of
entrepreneurial activity in a city (Glaeser et al 2010) Second it is available for a large
3 This is also known as Bohemians in studies following Florida (2002)
4 Excluding mergers break-ups split-offs restructuring of enterprises changes of company activity or name
13
number of cities and after applying appropriate harmonization by Eurostat it can be
compared across cities and over time (Eurostat 2012)5
Control variables
We use a measure of education attainment to control for human capital (Glaser 2004
Audretsch et al 2006 Glaeser et al 2010) Proportion of residents with tertiary education
(ISCED6 5-6) The relevance of human capital in urban economic development has been
established in recent research (Audretsch and Keilbach 2007 Rodriacuteguez-Pose and Vilalta-
Bufigrave 2005) and it is appropriate to include this control in our study to distinguish what
people do from what they know
We also control for economies of scope and scale using a population density for a
market size (Boschma and Fritsch 2009 Falck et al 2011 Acs et al 2014) In addition we
control for the difference in market size potentialbetween a core city and larger urban area
based on the ldquomarket potentialrdquo approach (Harris 1954) This measure is calculated as the
ratio of local administrative unit population density (LAU) to larger urban zone population
densitydescribed in details in section5 (robustness check)
We control for the presence of country fixed effects as a robustness check the impact
of institutions culture and other unobserved heterogeneity across countries by including
country dummies (Baumol 1993 Audretsch and Belitski 2013) The results have not
changed F-test that all coefficients of country dummies are jointly equal to zero was rejected
at 1 significance level In addition we clustered our standard errors by country This allows
correlation of standard errors within the country but not across the countries
5 A limitation of this measure is it does not capture firm survival However we want to study entrepreneurship
as a conduit of creativity allowing for the transfer of new ideas into marketable innovation therefore capturing
new businesses which reflect the initial stage of commercialization is adequate for our purposes 6 UNESCO International Standard Classification of Education (ISCED) facilitates comparisons of education
statistics Tertiary education comprises ISCED levels 5 6 7 and 8 which are labelled as short-cycle tertiary
bachelor or equivalent master or equivalent and doctoral or equivalent respectively
14
33 Empirical strategy
Endogeneity issues
Potential criticisms of our approach include endogeneity multicollinearity and non-
linearities The relationship between creativity and economic performance could be bi-
directional (Boschma and Fritsch 2009 Falck et al 2011) The Culture sector has been found
to support local quality of life build social capital encourage tourism and attract jobs
(Florida 2002) At the same time the most successful and wealthy European cities have
vibrant cultural and distinctive melting pot environments rich in cultural amenities with
skilled and talented people (Eurostat 2012) The endogeneity issue could also arise because
individuals with high human capital may be willing and able to pay for cultural services
bridging the bi-directional relationship between human capital and creativity Factors like
lifestyle amenities culture social capital and quality of life may affect both human capital
and creativity We deal with the bi-directional relationship between human capital and
creativity by including both variables on the right hand side of the model and therefore the
effect of human capital on urban economic development is now explicitly controlled
Further the relationship between the dependent variable and the explanatory variables
which proxy creativity is not linear as we cannot assume constant marginal returns to
creativity We use the logarithm of GDP per capita to account for a non-linear relationship
We estimate a pooled OLS data model7 with each city observed between one and two
times over 1999-2009 This limited the potential use of the panel data model like fixed effects
of random effects We control for country-specific characteristics by including country fixed
effects in several specifications as a robustness check We also control for time fixed effects
by including time period dummies in the estimation The time period 2004-2009 is a
reference period when controlling for time fixed effects F-test for the joint significance of
7 Pooled OLS allows improvements in efficiency over a simple average approach by year cross-section as it
pools all available data over three time periods
15
time-fixed effects and country controls were implemented We consider the following linear
panel regression model which resembles the Cobb-Douglas production function at a regional
level (Douglas 1976)
119884119894119905 = 120572119894 + 119889119905 + 1205731119894119909119894119905 + 1205732119894119894119905 + 120583119894119905 (1)
where i = 1 hellip N t = 1 hellip T where 119884119894119905 indicates GDP per capita in PPP of a city i at time
t 119909119894119905 is a ktimes1 set of explanatory regressors including new firm start-ups melting pot and
sector specialization as a proxy for creativity 119894119905 is a ktimes1 set of control variables (eg
human capital country dummies population density) 120572119894 is a city- specific intercept 119889119905 is
time control and 120583119894119905 is the idiosyncratic error term All variables in (1) are expressed in
logarithms except for those expressed in percentages or proportions Heteroskedasticity
robust standard errors clustered by country are included This allows correlation of standard
errors within the country but not across the countries
We run our analysis on a dataset comprising 240 observations across 187 cities Our
results for the analysis with entrepreneurship in Table 4 and for the analysis with the melting
pot index in Table 5 In both sets of tables Models 5-10 include interaction terms of
entrepreneurship and proportion of employed by sector in a city
3 Results
Our interaction analysis methodology (Preacher et al 2007) is reported in Tables 4 and 5
Table 4 presents results on creativity and the moderating effect of entrepreneurship on urban
economic development Table 5 presents results on creativity and the moderating effect of
melting pot environment on urban economic development
16
We first report results for our controls Human capital is found positive and
statistically significant for urban economic development The coefficient for human capital
does not change but significance varies slightly in Models 2-3 (001 plt01) and Models 4-11
(001 plt005) in Table 4 It also remains positive and statistically significant with
unchanging coefficient across Models 2-11 (001 plt05) in Table 5 The findings for human
capital are consistent with previous research (Glaeser 2004 Audretsch et al 2008 Glaeser
et al 2014) Tertiary education especially has been found positively related to economic
development (Sianesi and Van Reenen 2003 Audretsch and Keilbach 2007 Audretsch et al
2008) The control for market size potential is not significant across any of the models in
Tables 4 and 5 indicating that the existence of a potential market by itself does not have
positive or negative implications for urban economic development Finally country fixed
effects point to cultural and institutional differences between countries included in this study
and that on average higher GDP per capita in Belgium Cyprus Germany Spain Finland
France Netherlands Sweden and Slovenia8
We now turn to our hypotheses A link between creativity and urban economic
development is established shown in Models 2-3 in both the Tables 4 and 5 These findings
support H1a and are in line with the idea of a ldquocreative class cityrdquo (Florida 2002 Florida et
al 2008) Further more diverse cities are also likely to have higher GDP per capita We now
turn to our results when examining if the combination of creativity and a melting pot
environment will result in higher economic development as predicted in H1b As indicated in
Models 5-10 in Table 5 H1b was not supported Interestingly although the interaction of
ICT sector with melting pot index is positive and statistically significant (001 plt005) the
other two significant interactions were both negative Finance with melting pot index (-016
plt005) and Public with melting pot index (-034 plt01) The interaction term of special
8 Results suppressed in Tables 4 and 5 to save space
17
interest Culture with melting pot index was not statistically significant Although a melting
pot environment has been found important for innovation and growth in other studies
(Florida 2002 Audretsch et al 2010 Boschma and Fritsch 2009) our findings indicate that
the relationship between creativity and economic development is not conditional upon a
melting pot environment
We now turn to our findings testing the creativity spillover of entrepreneurship H2a
predicted that entrepreneurship moderates the relationship between creativity and urban
economic development Several models in Table 4 provide support for H2a A greater
proportion employed in high-tech Manufacturing (011 plt01) and in Trade and hospitality
(014 plt01) have a positive and statistically significant association with urban economic
development reported in Models 5 and 6 of Table 4 respectively The same is true for a
greater proportion employed in ICT (001 plt005) and Culture (002 plt005) sectors shown
in Models 9 and 10 of Table 4 respectively Conditional upon higher entrepreneurship rates
a greater proportion employed in these sectors which are rich in creativity in production is
positively and significantly associated with urban economic development Interestingly as
shown in Model 7 of Table 4 Finance has a direct impact (308 plt005) but an insignificant
incremental effect for urban economic development It is noteworthy that a higher proportion
of employed in the Culture sector also known as Bohemians (Florida 2002) is associated
with greater urban economic development Entrepreneurship is associated with opportunity
recognition and bringing those opportunities to the market by launching a new business
(Audretsch and Keilbach 2007 Acs et al 2009) Our findings support the idea that creativity
embodied in people in industries does not per se result in economic development rather it is
a combination of new business start-ups which commercialize the creativity in industries
which is important for urban economic development
18
H2b predicted that the size of the creativity filter (the gap between real and potential
creativity commercialization) would be larger with less entrepreneurship We find support for
H2b in Table 4 which shows that higher employment in four creative sectors conditional on
higher entrepreneurship is associated with higher urban economic development high-tech
manufacturing shown in Model 5 (011 plt01) Trade and hospitality shown in Model 6
(014 plt01) ICT shown in Model 9 (001 plt005) and Culture (002 plt005) shown in
Model 10 Our findings indicate that entrepreneur serves to minimize the size of the creativity
filter New start-ups can be seen as a process of formalization of new ideas innovation and
creativity (Audretsch and Lehmann 2005) Our findings indicate that creative workers in the
high-tech Manufacturing Trade and hospitality ICT and Culture sectors have more skills and
knowledge but entrepreneurial action is needed to spill this knowledge and creativity further
Creativity this way becomes economic knowledge (Arrow 1962 Audretsch and Feldman
1996) and the type of special market knowledge necessary to exploit opportunities is what
entrepreneurs bring to the sector (Audretsch et al 2006) Entrepreneurship thus acts as a
conduit for creativity commercialization and supports individuals to overcome the
uncertainty related to market commercialization of ideas and spill over creative ideas into
new products (Audretsch and Belitski 2013) In doing so entrepreneurs decrease the
creativity filter
Additionally more opportunities for idea exchange may be present in the melting pot
environment As a result of sharing ideas there is a greater likelihood of experimentation and
spinning off unique approaches to work (Pinto et al 1993 Gilson and Shalley 2004) We
predicted in H3 that a melting pot environment would result in higher urban economic
development The results reported in Table 4 and 5 clearly provide support for H3 The
coefficients of the melting pot environment (measured as non-EEU residents) remains
statistically significant and positive across all specifications In Table 4 this coefficient for
19
melting pot environment was consistent for Models 2-4 and 7-11 (004 plt01) and consistent
for Models 5-6 (003 plt01) The coefficient stayed positive and statistically significant in
Table 5 but varied more across models Models 2-4 (004 plt01) Model 5 (002 plt005)
Model 6 10 11 (005 plt01) Model 7 (007 plt01) Model 8 (014 plt01) and Model 9
(006 plt01) Overall our results indicate the diversity and vibrancy (Stein 1974) which
accompanies a melting pot environment (Florida 2002) boost urban economic development
This could be through letting people feel comfortable with their creative ideas and share their
ldquoidea mixrdquo (Audretsch et al 2010)
4 Robustness check
Economic areas which surpass to varying degrees administrative boundaries may
impact economic development within a core city Exogenous effects could bias the model as
a dependent variable or could be subjected to distortion LAUs limited by core city
boundaries may not capture economic activity localized in larger urban zones (Eurostat
2012) As pointed out by Cheshire and Magrini (2009) GDP is estimated at workplaces
whereas people are counted where they live To check for this possibility a control was
designed to compare two agglomeration economies Within and outside the LAUs based on
the ldquomarket potentialrdquo approach (Harris 1954)
The market potential P equals the sum of accessible market sizes (M) divided by the
geographic distances to those markets (D) Cities can be seen as agglomerations of markets in
a given area Following Head and Mayer (2000) the sum of distances may be approximated
as an area (A) By this we assume that producers and consumers are evenly distributed
within the area (A) which may not be the case However our objective is to capture the
differences in magnitude of two levels of agglomeration economies Within the core city and
outside city boundaries Market size potential (Harris 1954) can be proxied by population
20
size (number of city residents) living within certain agglomeration boundaries We refer to
this proxy as population density
To perform a robustness check and access differences in economic activity which may
exist between different spatial units we compared two different densities ie the core-city
(LAU level 2) and larger urban zone (LUZ) LAU population density is related to LUZ
population density with the following ratio 119863119871119860119880
119863119871119880119885 This control demonstrating the difference
between LAU and LUZ market potentials was added to Model 11 in both Tables The results
are reported show the value of the coefficient is not statistically significant Notably factor
coefficients for other explanatory variables have not changed their sign of significance
remaining similar to Model 10 Post-estimation Wald test did not yield evidence to support
the significant bias in model estimation due to variations in the market potential across LUZ
and LAU In other words our market potential Harris-type control has indicated neither the
effect from larger urban zone externalities upon core-city economic performance nor a
distortion in the previously estimated effects
We identified several city-outliers with a relatively high level of entrepreneurship
The top 5 of the sample includes 9 cities with 35 times more than the mean value of
entrepreneurship (39-47) In order to check the robustness of our model estimation we
excluded eight German cities (Berlin Dortmund Frankfurt-Oder Halle an der Saale Koln
Leipzig Monchengladbach and Weimar) and one Spanish city (Murcia) from our sample as
outliers and re-ran the estimations Results on the main coefficients of interest in Tables 4 and
5 remained unchanged but the sample size fell to 178 cities
5 Discussion
Three results are especially noteworthy First we found a positive direct impact of
creativity embodied in the Culture sector on urban economic development controlling for
21
human capital (Glaeser et al 2014) Although we did not find support for a combination of
creativity and a melting pot effect to be positively associated with regional economic
development a melting pot environment on its own was found important (Florida 2002
Audretsch et al 2010)
Second we can conclude that creativity is not a magic bullet for urban economic
development and that a conduit is needed to commercialize creative ideas (Audretsch and
Belitski 2013) Not surprisingly our results provided positive evidence that workers in four
key sectors (high-tech Manufacturing Trade and hospitality ICT and Culture) are more
likely to commercialize their creativity unlike workers employed in other sectors This could
be attributed to a greater need for creativity in the basic functioning and productive activities
in these sectors Third we confirmed that entrepreneurship is a catalyst for promoting urban
economic development and spilling over creativity embedded in industries to the market
Entrepreneurship can be an important condition to commercialize creativity in cities where
localized knowledge spillovers are most efficient (Arrow 1962 Audretsch and Feldman
1996 Glaeser et al 2014 Audretsch et al 2015) Entrepreneurship reduces the size of the
creativity filter in particular in the four sectors where creativity is likely part of a production
process Policymakers and company managers looking for ways to engage workers in
creative activities (Drazin et al 1999 Shalley et al 2004 Shalley et al 2009) should be
aware of a conduit role of entrepreneurship in this process (Audretsch et al 2006 2008
2010)
Our findings have interesting implications for entrepreneurs and corporate managers
First entrepreneurs and managers may find that locating in melting pot environments
provides not only better access to high quality potential employees but also that potential
spillovers can result from talent employed in other firms and sectors in a melting pot area
Second entrepreneurial firms may benefit from interacting with creative workers especially
22
in the four sectors mentioned earlier as this may provide greater access to new ideas It may
be worthwhile for entrepreneurs or managers to seek opportunities to engage with creative
workers
Overall our findings lead to four interesting implications for local economic
development policymakers First a melting pot environment could be an important tool in
providing individuals with tolerance and diversity (Florida 2002) If workers are exposed to
creative abilities and appreciate diversity they may engage in more intense collaborative
networking A melting pot environment could facilitate interactions between people and
hence potentially increase the welfare of cities (Glaeser 2004) as well as support their
creative performance (Madjar et al 2002) A supportive environment of this nature could
serve a broader policy objective Second the exchange of ideas between the creative class
and entrepreneurs is important for recognition modification and exploitation of new ideas
(Audretsch et al 2006) Entrepreneurs serve as a conduit for creative industries that result in
commercialization of new ideas and therefore higher urban economic development
Identifying and supporting greater opportunities for interaction between entrepreneurs and
creative workers could be an interesting approach for policymakers Third the existing
complementarity of creativity embodied in workers and entrepreneurship may have both
direct and indirect impacts on economic development in various sectors This suggests it may
be wide to consider the effects of policies on both workers and entrepreneurs Fourth we
advise policymakers to consider supporting industry mix in such a way that promotes urban
economic development such as by supporting sectors with greater integration of creativity in
productive activities
6 Concluding remarks
23
Our study is the first to examine the concept of a creativity filter and creativity spillover
of entrepreneurship We propose the creativity spillover of entrepreneurship to better
understand how creativity spills over for economic development (Audretsch et al 2006
Agarwal et al 2007 2010) We examined creativity and urban economic development with
consideration of moderating roles for entrepreneurship and a melting pot environment We
use interaction analysis methodology (Brambor et al 2006) to uncover complex novel
findings on creativity melting pot environment entrepreneurship and urban economic
development Using a panel from 187 European cities over the period 1999-2009 we present
evidence on the existence size and interacting dynamics of a creativity filter We find that
creativity contributes to urban economic development directly and indirectly through
entrepreneurship We also find evidence of the importance of a melting pot environment Our
findings show that the impact of creativity on urban economic development can actually be
accelerated to generate creativity spillovers and minimize the creativity filter
Our study lays the groundwork for further research moving towards a creativity
theory spillover of entrepreneurship theory Future research should attempt to identify and
test a range of potential conduits for creativity to lead to urban economic development We
addresses a lack of city-level research which can shed light on how better to enable creativity
spillover to help regional economic development (Lorenzen and Andersen 2009 Marrocu
and Paci 2012 Audretsch et al 2015) Few efforts have attempted to understand the
mechanisms which spillover knowledge and creativity in particular in cities where
interactions between the creative classes take place (Florida et al 2008 Audretsch and
Keilbach 2007 Boschma and Fritsch 2009)
Our contribution to the entrepreneurship literature is in marrying the knowledge
spillover of entrepreneurship theory (Audretsch and Lehmann 2005 Audretsch and Keilbach
2007 Acs et al 2009 Qian et al 2012) with the burgeoning research on creativity and
24
entrepreneurship (Florida 2002 Florida et al 2008 Florida and Mellander 2010 Marrocu
and Paci 2012) We also make linkages with the organizational creativity literature
(Amabile 1996 Shalley Gilson and Blum 2000 Shalley et al 2004 Fleming and Marx
2006 Shalley et al 2009) an area which is ripe for deeper applications with
entrepreneurship research
References
Acs ZJ and Armington C 2006 Entrepreneurship Agglomeration and US Regional
Growth Cambridge Cambridge University Press
Acs ZJ Audretsch DB Braunerhjelm P Carlsson B 2009 The knowledge spillover
theory of entrepreneurship Small Business Economics 32 15ndash30
Acs Z J Autio E Szerb L 2014 National Systems of Entrepreneurship Measurement
Issues and Policy Implications Research Policy 43 476ndash449
Agarwal R Audretsch DB Sarkar M 2007 The Process of Creative Construction
Knowledge Spillovers Entrepreneurship and Economic Growth Strategic Entrepreneurship
Journal 1 263ndash286
Agarwal R Audretsch DB Sarkar M 2010 Knowledge Spillovers and Strategic
Entrepreneurship Strategic Entrepreneurship Journal 4 271ndash283
Amabile T M 1996 Creativity in context Boulder CO Westview
Arrow K 1962 Economic welfare and the allocation of resources for invention In R
Nelson (Eds) The rate and direction of inventive activity NJ Princeton University Press and
NBER
Asheim B and Hansen H K 2009 Knowledge bases talents and contexts On the
usefulness of the creative class approach in Sweden Economic Geography 85425ndash42
Audretsch D B and Feldman M P 1996 RandD spillovers and the geography of
innovation and production The American economic review 86 630-640
Audretsch DB and Lehmann EE 2005 Does the knowledge spillover theory of
entrepreneurship hold for regions Research Policy 34(8) 1191ndash1202
Audretsch DB Keilbach M and Lehmann E 2006 Entrepreneurship and economic
growth New York Oxford University Press
Audretsch DB and Keilbach MC 2007 The Theory of Knowledge Spillover
Entrepreneurship Journal of Management Studies 44 1242ndash1254
Audretsch DB Boumlnte W and Keilbach M 2008 Entrepreneurship capital and its impact
on knowledge diffusion and economic performance Journal of Business Venturing 23 687ndash
698
Audretsch D B Dohse D Niebuhr A 2010 Cultural diversity and entrepreneurship a
regional analysis for Germany Annals of Regional Science 45 55ndash85
Audretsch DB and Belitski M 2013 The missing pillar the creativity theory of
knowledge spillover entrepreneurship Small Business Economics 41 819ndash836
Audretsch D Belitski M Desai S 2015 Entrepreneurship and Economic Development in
Cities Annals of Regional Sciences Special Issue The Geography of Innovation doi
101007s00168-015-0685-x
Bassett‐Jones N (2005) The paradox of diversity management creativity and
innovation Creativity and innovation management 14(2) 169-175
Baumol WJ 1993 Formal entrepreneurship theory in economics existence and bounds
25
Journal of Business Venturing 8 197ndash210
Boschma R and Fritsch M 2009 Creative Class and Regional Growth Empirical Evidence
from Seven European Countries Economic Geography 85 391-423
Brambor T Clark WR and Golder M 2006 Understanding interaction models
improving empirical analyses Political Analysis 14 63-82
Brunello G and De Paola M 2004 Market failures and the under-provision of training
CES info paper Business Innovation Department 2010 Skills for Growth The national
skills strategy BIS Economic paper No 4
Cheshire P and Magrini S 2009 Urban growth drivers in a Europe of sticky people and
implicit boundaries Journal of Economic Geography 9 85ndash115
Choi J N Anderson T A and Veillette A 2009 Contextual inhibitors of employee
creativity in organizations The insulating role of creative ability Group and Organization
Management 34 330-357
Cohen S G and Bailey D E 1997 What makes teams work Group effectiveness research
from the shop floor to the executive suite Journal of Management 23 239ndash290
Douglas PH 1976 The Cobb-Douglas production function once again its history its
testing and some new empirical values Journal of Political Economy 84 903ndash915
Drazin R Glynn M A and Kazanjian R K 1999 Multilevel theorizing about creativity
in organizations A sensemaking perspective Academy of Management Review 24 286ndash307
European Commission 2010 European Regional and Urban Statistics Reference Guide
Eurostat Methodologies and Working Papers
Eurostat 2012 City statistics - Urban audit Accessed online in December 2nd 2012 at
httpeppeurostateceuropaeuportalpageportalregion_citiescity_urban
Falck O Fritsch M and Heblich S 2011 The Phantom of the Opera Cultural Amenities
Human Capital and Regional Economic Growth IZA Discussion Paper No 5065
Fleming L and Marx M 2006 Managing Creativity in a Small World California
Management Review 48 6-27
Fleming L Chen D and Mingo S 2007 Collaborative Brokerage Generative Creativity
and Creative Success Administration Science Quarterly 52 443-475
Florida RL 2002 The rise of the creative class New York Basic Books
Florida R and Mellander C 2010 There Goes the Metro How and Why Artists
Bohemians and Gays Effect Housing Values Journal of Economic Geography 10 167-188
Florida R Mellander C and Stolarick K 2008 Inside the black box of regional
development Human capital the creative class and tolerance Journal of Economic
Geography 8 615ndash649
Florida R 2012 The Connection Between Creativity and Entrepreneurship Accessed online
at httpwwwtheatlanticcitiescomjobs-and-economy201208creativity-entrepreneurship-
connection2847
Gilson LL and Shalley CE 2004 A Little Creativity Goes a Long Way An Examination
of Teams Engagement in Creative Processes Journal of Management 30(4) 453ndash470
Glaeser EL 2004 Review of Richard Floridarsquos The rise of the creative class Regional
Science and Urban Economics 35 593ndash596
Glaeser EL Rosenthal SS Strange WC 2010 Urban economics and entrepreneurship
Journal of Urban Economics 67 1ndash14
Glaeser EL Ponzetto G Tobio K 2014 Cities Skills and Regional Change Regional
Studies 48 7-43
Harris CD 1954 The market as a factor in the localization of industry in the United States
Annals of the Association of American Geographers 44 315-348
Head K and Mayer T 2000 Non-Europe The magnitude and causes of market
fragmentation in the EU Weltwirtschaftliches Archiv 136 284-314
26
Jovanovic B MacDonald GM 1994 Competitive diffusion The Journal of Political
Economy 102 (1) 24ndash53
Kahn W A 1990 Psychological conditions of personally engagement and disengagement at
work Academy of Management Journal 33 692ndash724
Lee SY Florida RL and Acs ZJ 2004 Creativity and entrepreneurship A regional
analysis of new firm formation Regional Studies 38 879ndash891
Lorenzen M and Andersen K V 2009 Centrality and creativity Does Richard Floridarsquos
creative class offer new insights into urban hierarchy Economic Geography 85363ndash90
Madjar N Oldham G R and Pratt M G 2002 Therersquos no place like home The
contribution of work and nonwork creativity support to employeesrsquo creative performance
Academy of Management Journal 45 757-765
Markusen A 2006 Urban development and the politics of a creative class Evidence from
the study of artists Environment and Planning A 381921ndash40
Marrocu E and Paci R 2012 Education or Creativity What Matters Most for Economic
Performance Economic Geography 88(4) 369ndash401
Marlet G and van Woerkens C 2004 Skills and creativity in a cross-section of Dutch
cities Koopmans Research Institute Discussion Paper Series 04-29
Oldham G R and Cummings A 1996 Employee creativity Personal and contextual
factors at work Academy of Management Journal 39 607-634
Peri G 2005 Determinants of knowledge flows and their effect on innovation Review of
Economics and Statistics 87 308-322
Pinto M B Pinto J K and Prescott J E 1993 Antecedents and consequences of project
team cross-functional cooperation Management Science 39 1281ndash1297
Praag C and Versloot P 2007 What is the value of entrepreneurship A review of recent
research Small Business Economics 29 351-382
Preacher KJ Rucker DD and Hayes AF 2007 Addressing moderated mediation
hypotheses Theory methods and prescriptions Multivariate Behavioral Research 42 185-
227
Qian H Acs ZL Stough R 2013 Regional systems of entrepreneurship the nexus of
human capital knowledge and new firm formation Journal of Economic Geography 13
559ndash587
Rodriacuteguez-Pose A and Vilalta-Bufigrave M 2005 Education migration and job satisfaction
The regional returns of human capital in the EU Journal of Economic Geography 5545ndash66
Shalley CE Zhou J and Oldham GR 2004 The Effects of Personal and Contextual
Characteristics on Creativity Where Should We Go from Here Journal of Management
30(6) 933ndash958
Shalley C E Gilson L L and Blum T C 2000 Matching creativity requirements and the
work environment Effects on satisfaction and intent to turnover Academy of Management
Journal 43 215ndash224
Shalley C E Gilson L L and Blum T C 2009 Interactive effects of growth need
strength work context and job complexity on self-reported creative performance Academy
of Management Journal 52 489-505
Shane S and Venkataraman S 2000 The promise of entrepreneurship as a field of
research Academy of Management Review 25 217-226
Shin S J and Zhou J 2003 Transformational leadership conservation and creativity
Evidence from Korea Academy of Management Journal 46 703-714
Sianesi B and Van Reenen J 2003 The Returns to Education Macroeconomics Journal of
Economic Surveys 17 157-200
27
Somech A and Drach-Zahavy A 2013 Translating team creativity to innovation
implementation the role of team composition and climate for innovation Journal of
Management 39(3) 684-708
Stein M K 1974 Stimulating creativity New York Academic Press
West M A 1990 The social psychology of innovation in groups In M A West and J L
Farr (Eds) Innovation and creativity at work Psychological and organizational strategies
555ndash576 Chichester Wiley
Zahra S A and Wright M 2011 Entrepreneurships next act The Academy of Management
Perspectives 25(4) 67-83
28
FIGURE 1 Creativity Spillover of Entrepreneurship
Creativity spillover of entrepreneurship (creativity filter)
Control variables
Melting pot
environment
(Diversity openness
tolerance institutions)
Creativity
Economic development
Entrepreneurship
(new business start-
ups)
29
TABLE 1 Cities included in the study
City Country
Brussels Belgium
Ruse Plovdiv Burgas Pleven Varna Sofia Vidin
Lefkosia Cyprus
Frankfurt am Main Trier Augsburg Potsdam Bonn Wiesbaden Mainz Freiburg im Breisgau
Koblenz Magdeburg Weimar Frankfurt-Oder Erfurt Dresden Monchengladbach Rostock
Darmstadt Dusseldorf Moers Halle an der Saale Hannover Karlsruhe Bochum Schwerin Leipzig
Bielefeld Berlin Regensburg Munchen Essen Mulheim ad Ruhr Koln Kiel Dortmund Hamburg
Nurnberg Stuttgart Saarbrucken Bremen
Germany
Tallinn Tartu Estonia
Cordoba Las Palmas Gijon Zaragoza Santiago de Compostela Badajoz Malaga Santander
Hospitalet de Llobregat VitoriaGasteiz Valladolid Toledo Sevilla Murcia Vigo Oviedo Sta Cruz
de Tenerife PamplonaIruna Bilbao Madrid Barcelona Valencia Logrono AlicanteAlacant
Spain
Kernel Helsinki Helsinki Tampere Turku Oulu Finland
Lens ndash Lievin Tours Rouen Amiens Ajaccio Nantes Paris Metz Marseille Nancy Orleans Dijon
Le Havre Grenoble Poitiers Strasbourg Saint-Etienne Montpellier Limoges Caen Besancon Saint
Denis Aix-en-Provence Toulouse Bordeaux Lyon Lille Reims Clermont-Ferrand
France
Budapest Debrecen Gyor Kecskemet Miskolc Nyiregyhaza Pecs Szeged Szekesfehervar Hungary
Panevezys Kaunas Vilnius Lithuania
Ancona Catanzaro Venezia Genova Taranto Perugia Aquila Potenza Catania Caserta Cagliari
Foggia Sassari Verona Bari Roma Salerno Firenze Milano Brescia Trieste Napoli Modena
Trento Palermo Reggio di Calabria Bologna Torino Padova Campobasso Cremona Pescara
Italy
Riga Liepaja Latvia
Almere Breda Arnhem Apeldoorn Amsterdam Eindhoven Tilburg s-Gravenhage Groningen
Leeuwarden Rotterdam Enschede Heerlen Nijmegen Utrecht Netherlands
Goteborg Linkoping Malmo Orebro Stockholm Umea Jonkoping Sweden
Maribor Ljubljana Slovenia
Kosice Banska Bystrica Nitra Presov Zilina Trnava Bratislava Trencin Slovakia
Source Eurostat (2012) Urban and regional statistics 1994-2009
30
FIGURE 2 Cities included in the study
Source Authors calculations based on Eurostat (2012)
31
TABLE 2 VARIABLES AND SUMMARY STATISTICS
Variables Definition Mean St dev Min Max
GDP Gross Domestic Product in PPP prices logarithm 1007 049 858 1116
High-tech
manufacturing
Proportion employed in high-tech manufacturing
industry 013 006 003 036
Trade and
hospitality
Proportion of employment in trade hotels
restaurants and other food industry 015 004 005 026
Finance Proportion of employment in financial
intermediation and business activities 016 008 002 051
Public Proportion of employment in public administration
health and education industry 028 008 014 053
ICT Proportion of employed in manufacturing ICT
products and content 1013 779 090 8270
Culture Proportion of employment in culture and
entertainment industry 258 329 010 3390
Entrepreneurship New businesses registered in proportion of existing
companies 2130 1311 040 5690
Population density Population density 186623 206307 4420 202482
Human Capital Proportion of residents with tertiary education
(ISCED 5-6)
2366 690 600 4180
Melting Pot Index Non-EEA nationals as a proportion of total
population 608 425 019 1622
Market potential
Ratio of local administrative unit population density
(LAU) to larger urban zone population density
1994-2009 averaged (Harris 1954)
1294 3638 080 35454
Source Author calculations based on Eurostat (2012)
Note Interaction variables which are the product of entrepreneurship and proportion of employment by sector
are supressed here to save space The total number of cities is 187 and total number of observations is 240
32
TABLE 3 Correlation matrix
1 2 3 4 5 6 7 8 9 10
1 GDP 100
2 High-tech
manufacturing 005 100
3 Trade and hospitality 048 045 100
4 Finance 076 006 061 100
5 Public 051 -010 031 042 100
6 ICT 032 013 023 032 010 100
7 Culture 006 -007 001 008 011 053 100
8 Entrepreneurship 037 000 025 036 019 007 -002 100
9 Population density 025 -004 018 026 -004 019 010 003 100
10 Human Capital 019
-
027
-
012 012 020 029 014
-
023 000 100
11 Melting Pot Index 062 017 043 060 014 023 000 056 036
-
012
Note Significance is 5
Source Eurostat (2012)
33
TABLE 4 Results with entrepreneurship (dependent variable GDP per capita in PPP in logs)
Model (1) (2) (3) (4) (5) (6) (7) (8) (9) (10) (11)
Manufacturing 038
(042)
019
(043)
019
(043)
009
(043)
-229
(094)
-019
(048)
029
(041)
054
(034)
038
(036)
018
(038)
018
(038)
Trade and hospitality -086 (073)
-033 (068)
-033 (068)
040 (178)
020 (184)
-238 (194)
012 (171)
017 (159)
012 (173)
008 (183)
008 (183)
Finance
384
(039)
257
(037)
257
(037)
219
(050)
220
(053)
216
(053)
308
(116)
209
(048)
228
(048)
224
(052)
224
(052)
Public
164
(027)
175
(027)
175
(027)
180
(055)
160
(050)
174
(045)
172
(057)
382
(097)
184
(057)
191
(056)
191
(056)
ICT
001
(000)
000
(000)
000
(000)
001
(001)
001
(001)
001
(001)
001
(001)
001
(001)
003
(001)
001
(001)
001
(001)
Culture
001
(000)
001
(000)
-000
(001)
-000
(001)
-000
(001)
-000
(001)
-000
(001)
-001
(001)
004
(002)
004
(002)
Start-ups
001
(000)
000
(000)
000
(000)
000
(000)
001
(000)
002
(001)
001
(001)
002
(001)
001
(001)
001
(000)
001
(000)
Market size potential
000 (000)
000 (000)
000 (000)
000 (000)
000 (000)
000 (000)
000 (000)
000 (000)
000 (000)
000 (000)
Human Capital
001
(000)
001
(000)
001
(000)
001
(000)
001
(000)
001
(000)
001
(000)
001
(000)
001
(000)
001
(000)
Melting Pot
004 (001)
004 (001)
004 (001)
003 (001)
003 (001)
004 (001)
004 (001)
004 (001)
004 (001)
004 (001)
Manufacturing x
start-ups
011
(003)
Trade and hospitality x
start-ups
014
(004)
Finance x start-ups
-003
(003)
Public x start-ups
-008 (003)
ICT x start-ups
001 (000)
Culture x start-ups
002
(000)
Harrison type index
-007
(012)
Constant
892
(009)
874
(013)
874
(013)
845
(021)
924
(021)
928
(024)
879
(019)
837
(030)
875
(017)
877
(017)
878
(017)
Time dummies No Yes Yes Yes Yes Yes Yes Yes Yes Yes Yes
Country dummies No No No Yes Yes Yes Yes Yes Yes Yes Yes
Observations 240 240 240 240 240 240 240 240 240 240 240
R-squared 063 071 071 076 077 077 076 077 077 077 077
Note Level of statistical significance is p lt 10 p lt 05 and p lt 01 Standard errors clustered by
country and robust for heteroskedasticity are in parenthesis Country and time dummies are supressed to save
space Source Authors calculations
34
TABLE 5 Results with melting pot environment (dependent variable GDP per capita in PPP in logs)
Model (1) (2) (3) (4) (5) (6) (7) (8) (9) (10) (11)
Manufacturing 038
(042)
019
(043)
019
(043)
009
(043)
-078
(112)
011
(042)
028
(040)
039
(039)
024
(036)
008
(041)
008
(041)
Trade and hospitality -086
(073)
-033
(068)
-033
(068)
040
(178)
059
(174)
066
(212)
-011
(164)
054
(156)
019
(174)
030
(176)
030
(176)
Finance
384
(039)
257
(037)
257
(037)
219
(050)
216
(050)
222
(053)
383
(109)
190
(051)
213
(047)
219
(054)
219
(054)
Public
164
(027)
175
(027)
175
(027)
180
(055)
174
(049)
180
(056)
155
(058)
408
(072)
188
(057)
190
(056)
190
(056)
ICT
001
(000)
000
(000)
000
(000)
001
(001)
001
(001)
001
(001)
001
(001)
001
(001)
003
(001)
001
(001)
001
(001)
Culture
001
(000)
001
(000)
-000
(001)
-000
(001)
-000
(001)
-000
(001)
-000
(001)
-001
(001)
001
(000)
001
(000)
Start-ups
001
(000)
000
(000)
000
(000)
000
(000)
000
(000)
000
(000)
000
(000)
-000
(000)
000
(000)
000
(000)
000
(000)
Market size potential
000
(000)
000
(000)
000
(000)
000
(000)
000
(000)
000
(000)
000
(000)
000
(000)
000
(000)
000
(000)
Human capital
001
(000)
001
(000)
001
(000)
001
(000)
001
(000)
001
(000)
001
(000)
001
(000)
001
(000)
001
(000)
Melting Pot
004
(001)
004
(001)
004
(001)
002
(001)
005
(002)
007
(002)
014
(003)
006
(001)
005
(001)
005
(001)
Manufacturing x Melting Pot
012
(012)
Hospitality x Melting Pot
-005
(014)
Finance x Melting Pot
-016
(007)
Public x Melting Pot
-034
(007)
ICT x Melting Pot
001
(000)
Culture x Melting Pot
-001
(000)
Harrison type index
-002
(007)
Constant
892
(009)
874
(013)
874
(013)
845
(021)
901
(013)
885
(021)
877
(015)
831
(020)
877
(016)
881
(017)
882
(017)
Time dummies No Yes Yes Yes Yes Yes Yes Yes Yes Yes Yes
Country dummies No No No Yes Yes Yes Yes Yes Yes Yes Yes
Observations 240 240 240 240 240 240 240 240 240 240 240
R-squared 063 071 071 076 076 076 077 079 077 076 076
Note Level of statistical significance is p lt 10 p lt 05 and p lt 01 Standard errors clustered by
country and robust for heteroskedasticity are in parenthesis Country and time dummies are supressed to save
space Source Authors calculations
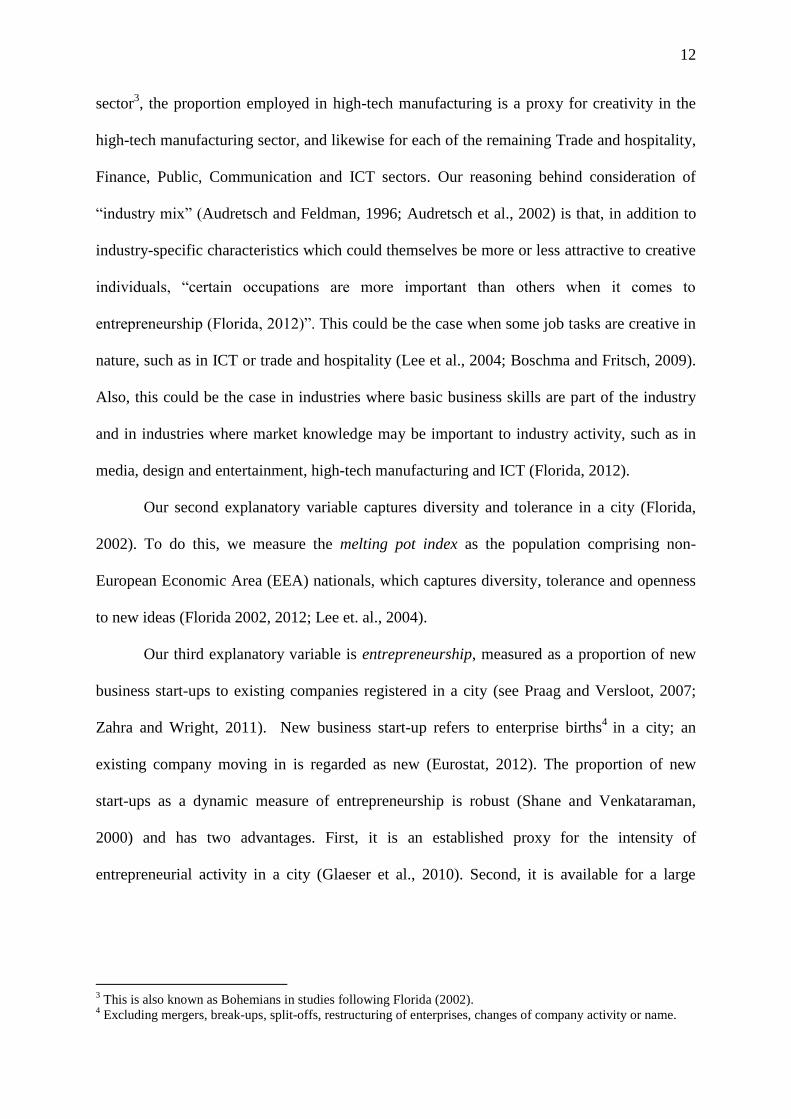
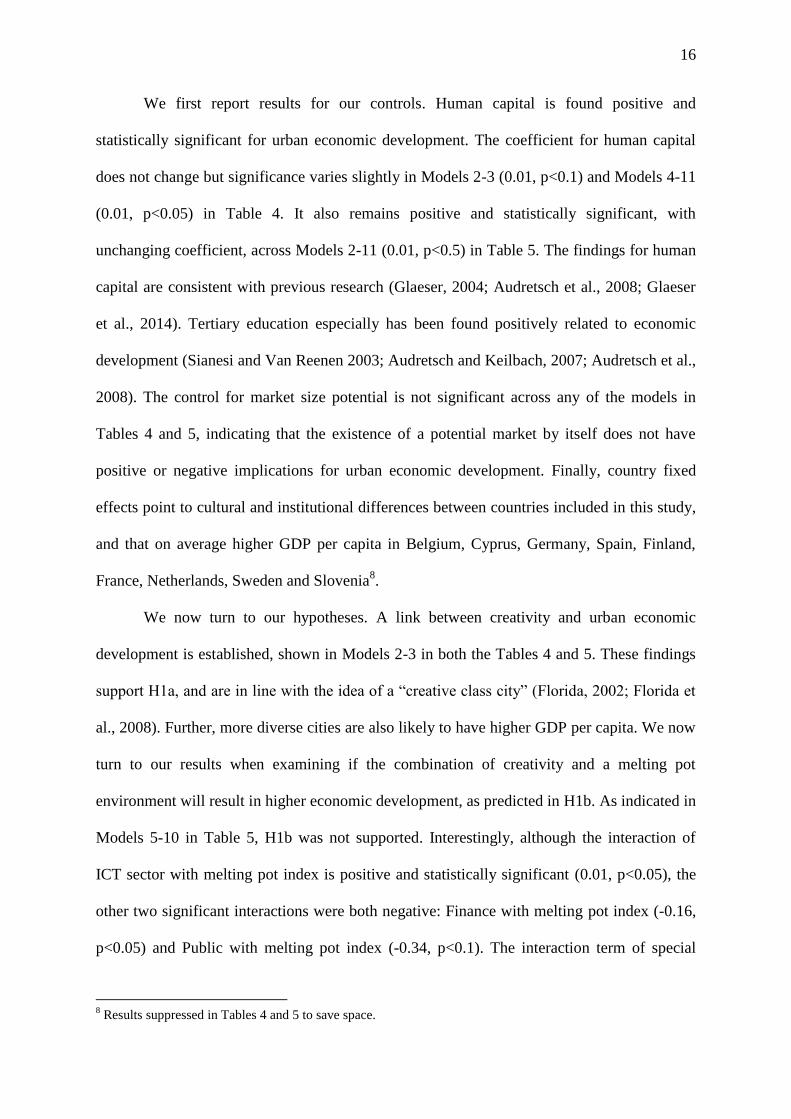
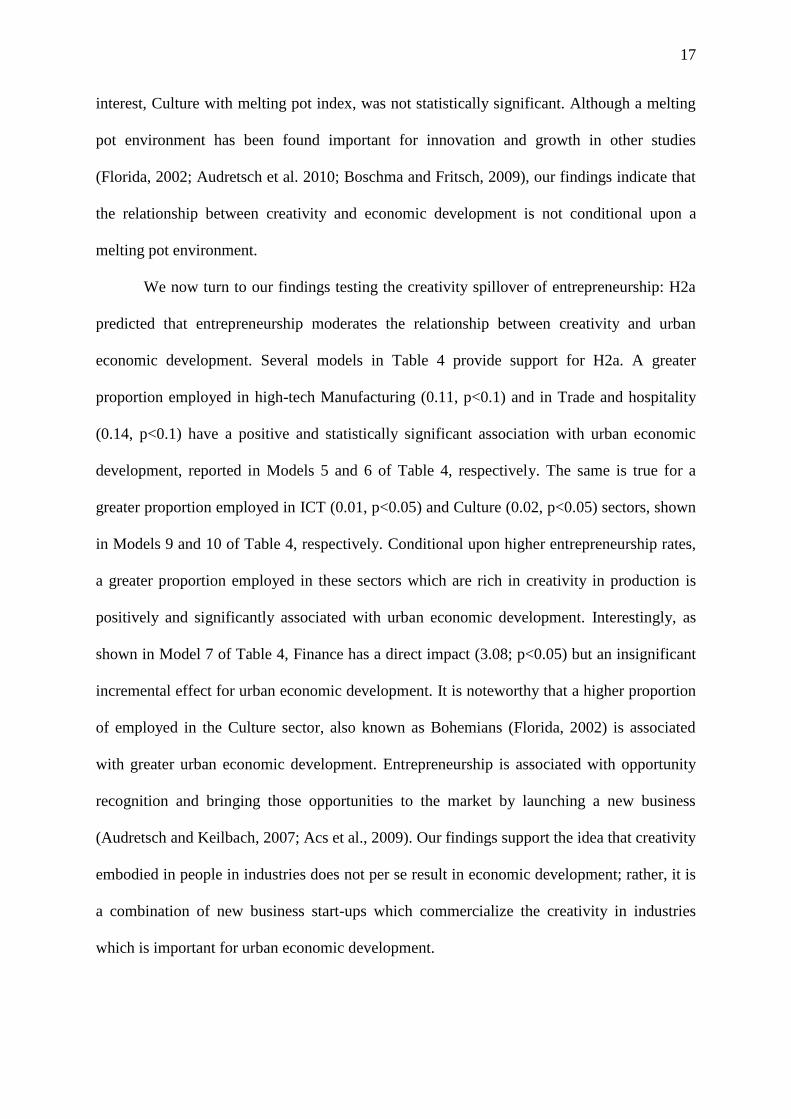
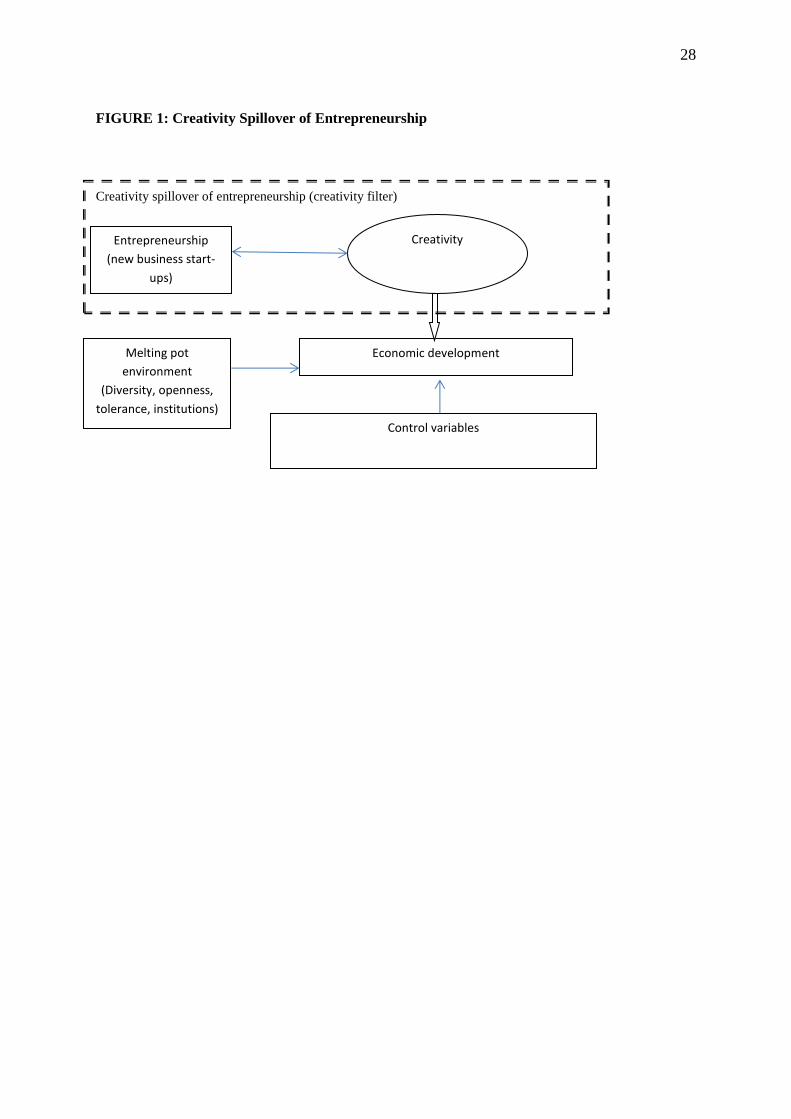
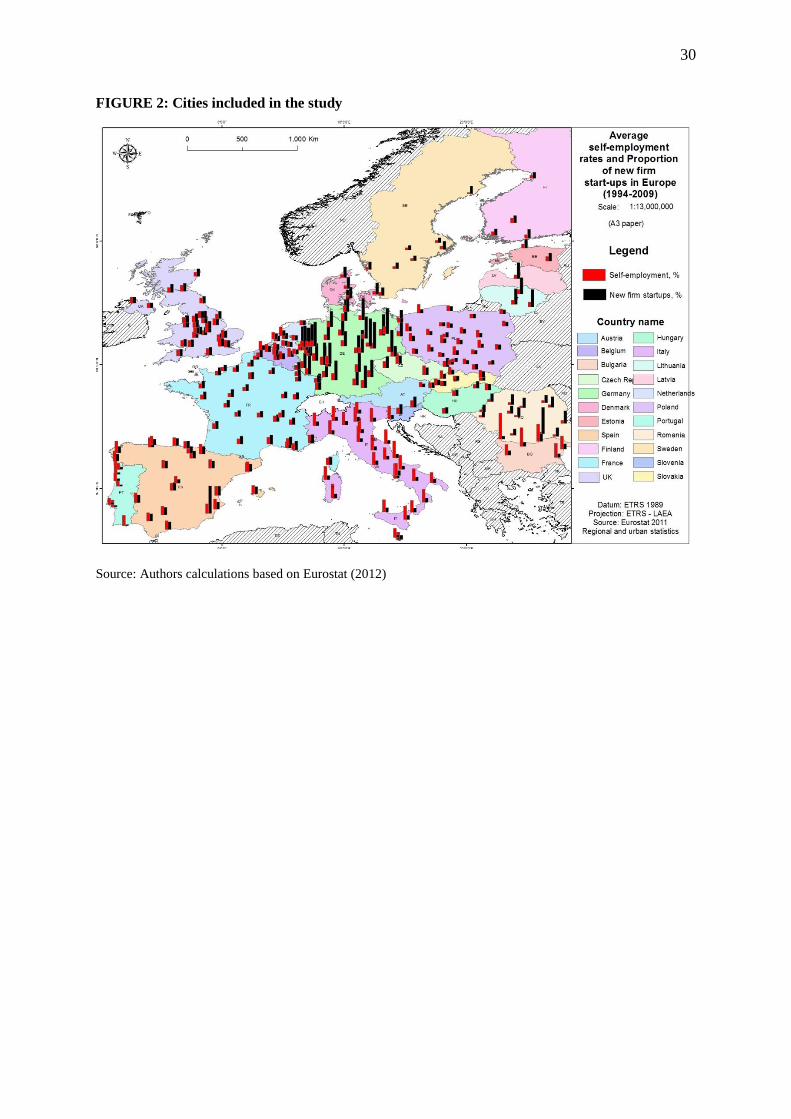
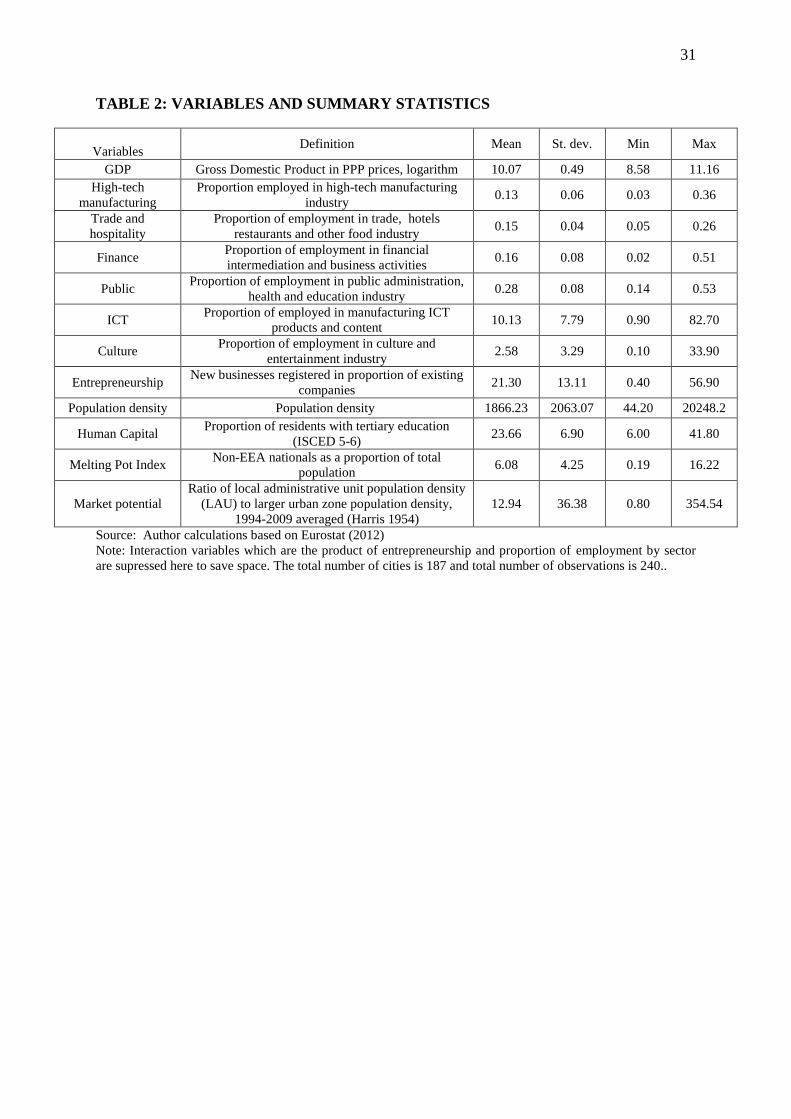
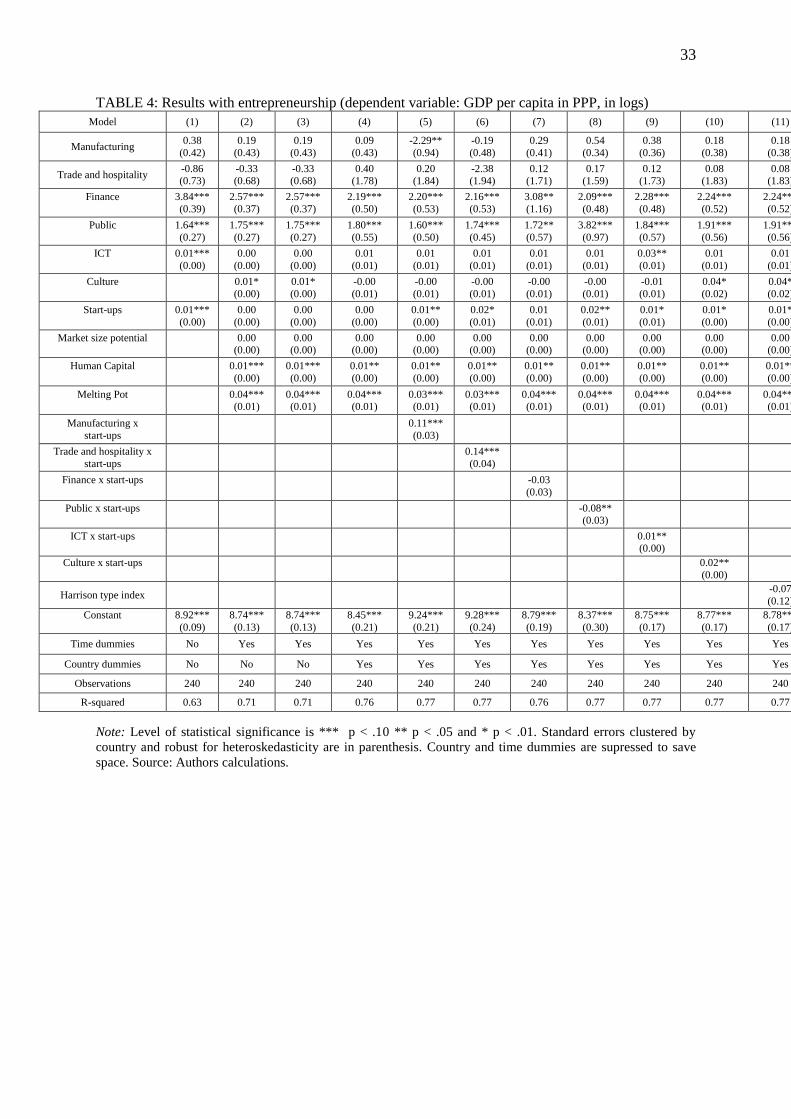