creating value in retailing for emerging consumers · · 2014-04-04creating value in retailing...
TRANSCRIPT
1
Creating Value in Retailing for Emerging Consumers Breaking the Myths about Emerging Consumers – Learning from Small Scale Retailers
An Exploratory Study Conducted for the Coca-Cola Retailing Research Council – Latin America by Booz Allen Hamilton
OVERVIEW Creating value in serving consumer products to Latin America’s sizeable lower income segment, or “emerging” consumer base is a tempting opportunity – or perhaps even a necessity—for retailers in search of new customers. Although their buying power may be less significant when compared to the ones of upper social levels, their share in the consumer products markets is very relevant. Yet, and after a decade of significant growth of the “modern” retail sector in the region, smaller scale retailers supply a significant portion of fast-moving consumer goods to these segments. Is this the natural order for retailing in this region? Is the continued success of small-scale retail in Latin America attributable to market inefficiencies? Can large chain retailers create value for emerging consumers? To answer these and other questions the Coca-Cola Retailing Research Council – Latin America commissioned Booz-Allen Hamilton to research across Latin American markets, examining the mindset of emerging consumers and lessons that could be learned from the small-scale retail trade. Our research found that many elements of the conventional wisdom about lower income consumers are unfounded. In spite of being “poor,” emerging consumers have substantial purchasing power as a group—and they exercise their buying power in some quite surprising, yet rational ways. For one thing, it is not a given that these consumers are attracted to low prices or whatever is “low cost.” They exhibit a very specific set of product, category, and store format needs that distinguish them as consumers from the middle and higher income segments that have typically been the focus for many of the large supermarket retailers. These distinct needs imply that it is not “just a matter of money and time” for them to change their purchasing patterns. One should be careful about falling into the “informality trap” and losing sight of these consumers’ needs, and how small retailers effectively address them. In fact, the evidence shows that smaller scale retailers fit the needs of emerging consumers quite well. Furthermore, small retailers manage to offset scale disadvantages (in areas such as purchasing) and show a sustainable business model—even before the effects of any informality in taxes and labor contributions. Despite perceptions that the small retail sector draws its resilience from informality, we conclude that there is much more to small-scale retailers’ value proposition and business model—and that the sector can be surprisingly efficient.
“About this Report” This project set out to explore ways for supermarket retailers to: • Understand the emerging consumer mindset—product & category needs, retail format needs,
and purchasing behavior and its drivers • Profile the value proposition and business model of key retail formats • Examine the “fit” between retailers’ value proposition and emerging consumer needs • Articulate key issues to consider for those retailers who wish to better serve the emerging
consumer population The findings are the result of a structured market research effort across six Latin American countries: Argentina, Brazil, Chile, Colombia, Costa Rica, and Mexico. Project scope focused on the types of goods that represent the bulk of emerging consumers’ day-to-day expenditures: off-premise food and beverage, household cleaning products, and personal care items. Naturally, this report synthesizes findings across a rather diverse set of geographies and issues. Readers seeking more detail are encouraged to access the full report.
2
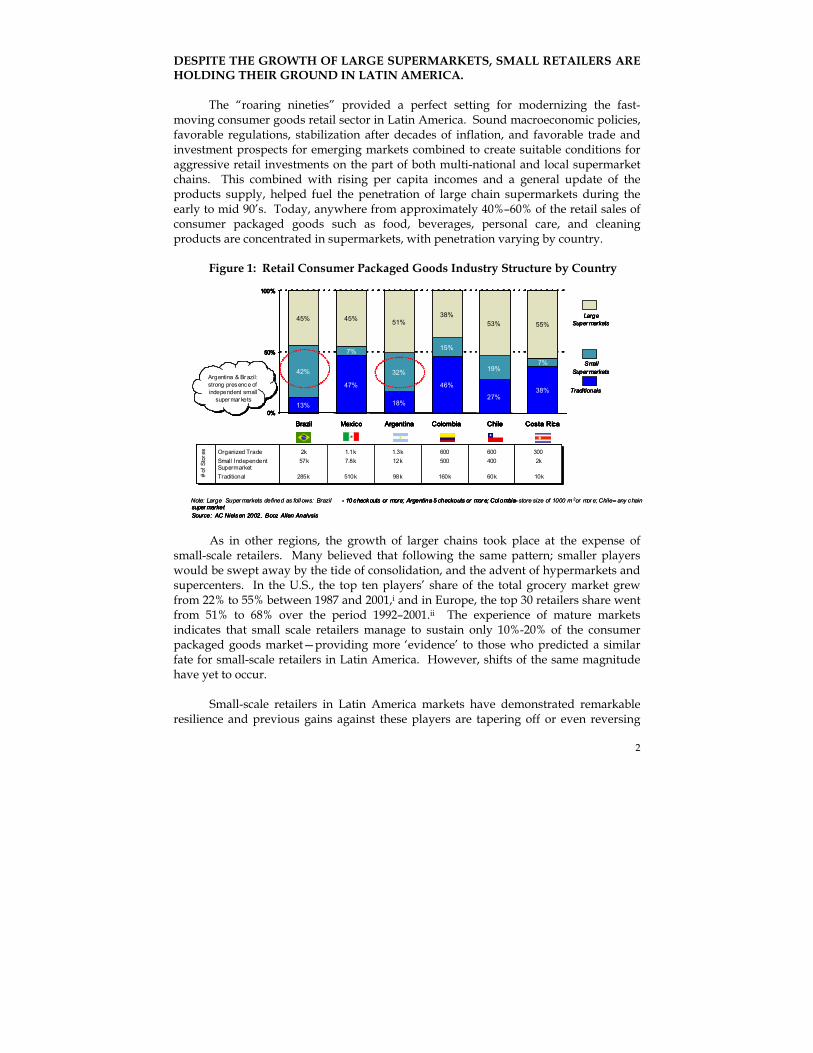
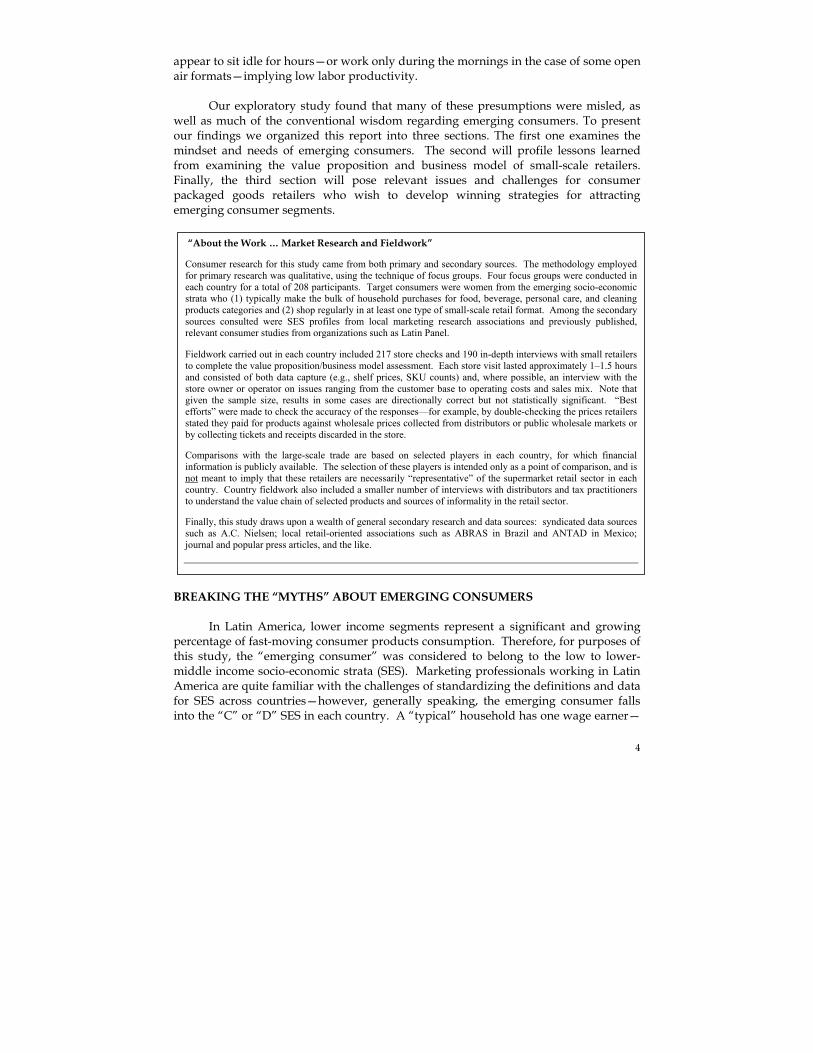
DESPITE THE GROWTH OF LARGE SUPERMARKETS, SMALL RETAILERS ARE HOLDING THEIR GROUND IN LATIN AMERICA. The “roaring nineties” provided a perfect setting for modernizing the fast-moving consumer goods retail sector in Latin America. Sound macroeconomic policies, favorable regulations, stabilization after decades of inflation, and favorable trade and investment prospects for emerging markets combined to create suitable conditions for aggressive retail investments on the part of both multi-national and local supermarket chains. This combined with rising per capita incomes and a general update of the products supply, helped fuel the penetration of large chain supermarkets during the early to mid 90’s. Today, anywhere from approximately 40%–60% of the retail sales of consumer packaged goods such as food, beverages, personal care, and cleaning products are concentrated in supermarkets, with penetration varying by country.
Figure 1: Retail Consumer Packaged Goods Industry Structure by Country
As in other regions, the growth of larger chains took place at the expense of
small-scale retailers. Many believed that following the same pattern; smaller players would be swept away by the tide of consolidation, and the advent of hypermarkets and supercenters. In the U.S., the top ten players’ share of the total grocery market grew from 22% to 55% between 1987 and 2001,i and in Europe, the top 30 retailers share went from 51% to 68% over the period 1992–2001.ii The experience of mature markets indicates that small scale retailers manage to sustain only 10%-20% of the consumer packaged goods market—providing more ‘evidence’ to those who predicted a similar fate for small-scale retailers in Latin America. However, shifts of the same magnitude have yet to occur.
Small-scale retailers in Latin America markets have demonstrated remarkable
resilience and previous gains against these players are tapering off or even reversing
# of
Sto
res
# of
Sto
res Organized Trade
Small Independent Supermarket Traditional
Organized TradeSmall Independent Supermarket Traditional
13%
47%
18%
46%
27%38%
42%
7%
32%
15%
19%7%
45% 45% 51%38%
53% 55%
0%
50%
100%
Brazil Mexico Argentina Colombia Chile Costa Rica
- 10 checkouts or more; Argentina - 5 checkouts or mor e; Col ombia – store size of 1000 m 2or mor e; Chile – any chain super marketSource: AC Nielsen 2002, Booz Allen Analysis
Argentina & Br azil: strong presence of independent small
super mar kets
Argentina & Br azil: strong presence of independent small
super mar kets
2k57k
285k
2k57k
285k
1.1k7.8k
510k
1.1k7.8k
510k
1.3k12k
98k
1.3k12k
98k
600500
160k
600500
160k
600400
60k
600400
60k
3002k
10k
3002k
10k
Large Super markets
Small Super markets
Traditionals
# of
Sto
res
# of
Sto
res Organized Trade
Small Independent Supermarket Traditional
Organized TradeSmall Independent Supermarket Traditional
13%
47%
18%
46%
27%38%
42%
7%
32%
15%
19%7%
45% 45% 51%38%
53% 55%
0%
50%
100%
Brazil Mexico Argentina Colombia Chile Costa Rica
Note: Large Super markets defined as foll ows: Brazil - 10 checkouts or more; Argentina - 5 checkouts or mor e; Col ombia – –super marketSource: AC Nielsen 2002, Booz Allen Analysis
Argentina & Br azil: strong presence of independent small
super mar kets
Argentina & Br azil: strong presence of independent small
super mar kets
2k57k
285k
2k57k
285k
1.1k7.8k
510k
1.1k7.8k
510k
1.3k12k
98k
1.3k12k
98k
600500
160k
600500
160k
600400
60k
600400
60k
3002k
10k
3002k
10k
Large Super markets
Small Super markets
Traditionals
# of
Sto
res
# of
Sto
res Organized Trade
Small Independent Supermarket Traditional
Organized TradeSmall Independent Supermarket Traditional
13%
47%
18%
46%
27%38%
42%
7%
32%
15%
19%7%
45% 45% 51%38%
53% 55%
0%
50%
100%
Brazil Mexico Argentina Colombia Chile Costa Rica
13%
47%
18%
46%
27%38%
42%
7%
32%
15%
19%7%
45% 45% 51%38%
53% 55%
0%
50%
100%
Brazil Mexico Argentina Colombia Chile Costa Rica
- 10 checkouts or more; Argentina - 5 checkouts or mor e; Col ombia – store size of 1000 m 2or mor e; Chile – any chain super marketSource: AC Nielsen 2002, Booz Allen Analysis
Argentina & Br azil: strong presence of independent small
super mar kets
Argentina & Br azil: strong presence of independent small
super mar kets
2k57k
285k
2k57k
285k
1.1k7.8k
510k
1.1k7.8k
510k
1.3k12k
98k
1.3k12k
98k
600500
160k
600500
160k
600400
60k
600400
60k
3002k
10k
3002k
10k
Large Super markets
Small Super markets
Traditionals
# of
Sto
res
# of
Sto
res Organized Trade
Small Independent Supermarket Traditional
Organized TradeSmall Independent Supermarket Traditional
13%
47%
18%
46%
27%38%
42%
7%
32%
15%
19%7%
45% 45% 51%38%
53% 55%
0%
50%
100%
Brazil Mexico Argentina Colombia Chile Costa Rica
13%
47%
18%
46%
27%38%
42%
7%
32%
15%
19%7%
45% 45% 51%38%
53% 55%
0%
50%
100%
Brazil Mexico Argentina Colombia Chile Costa Rica
Note: Large Super markets defined as foll ows: Brazil - 10 checkouts or more; Argentina - 5 checkouts or mor e; Col ombia – –super marketSource: AC Nielsen 2002, Booz Allen Analysis
Argentina & Br azil: strong presence of independent small
super mar kets
Argentina & Br azil: strong presence of independent small
super mar kets
2k57k
285k
2k57k
285k
1.1k7.8k
510k
1.1k7.8k
510k
1.3k12k
98k
1.3k12k
98k
600500
160k
600500
160k
600400
60k
600400
60k
3002k
10k
3002k
10k
Large Super markets
Small Super markets
Traditionals
3
slightly in some cases. In Argentina and Brazil, small-scale retailers have been particularly successfully in staving off the large chains. Many smaller players in these and other countries improved capabilities and responded to changing consumer preferences by converting over-the-counter formats into self-service stores. New small-scale formats such as bulk or door-to-door sales are emerging—or reappearing—in some countries. Times of economic crisis have also helped traditional stores and small self-service shops to re-gain share (as in Argentina, where small scale retailers increased share of total food sales by 2% during the beginning of 2003).iii
To be fair, many chain retailers never made emerging consumers their primary
focus. The growth of large supermarkets was successfully targeted at middle and high-income consumers, while lower income consumers still purchased at the traditional retail trade. However, small scale retailers are not only attracting “emerging” consumers, but also customers from upper levels—particularly in the “fresh” categories that make up an important part of the diet. Other open air or street retail formats are part of the cultural fabric of each country, appealing to lower and higher income segments alike—particularly in categories such as vegetables and fruits. Recognizing the importance of these channels, manufacturers are providing increased attention to what are often referred to as “traditional” or “up and down the street” retail formats. Small players are holding their ground, and they continue to supply a significant portion of the consumer packaged goods market in Latin America. ARE MARKETS IN LATIN AMERICA IMPERFECT OR ‘DYSFUNCTIONAL’?
The market presence that small-scale retailers maintain is often attributed to market dysfunction and other presumptions about emerging consumers. From the demand side, lower income consumers are often seen as poor, with little money to spend, and as unsophisticated buyers who shop in dirty, unpleasant stores—sometimes trapped into credit relationships that are the modern day equivalent of debt peonage. Another presumption is that their lower incomes drive emerging consumers to whatever is “low price” or “low cost”, “value” or “second tier” brands, discount retail formats, etc. Yet another presumption is that emerging consumers are “junior” versions of middle and high-income groups—and that they should naturally flock to the modern infrastructure, shopping experience and value that large supermarkets provide once incomes rise or they are able to afford a car.
On the supply side, some would conclude that small-scale retailers’ success must
be due to market inefficiencies, since they offer a fundamentally inferior value proposition. They stock fewer products to choose from, and the stores themselves when perceived through the lens of the “modern” retailer are seen as dirty, cluttered, and generally less attractive. Additionally, conventional wisdom holds that small-scale retailers rely excessively on informality (e.g., labor, social, VAT, and sales tax evasion) to artificially prop up a generally unproductive business model. Shopkeepers and staff
4
appear to sit idle for hours—or work only during the mornings in the case of some open air formats—implying low labor productivity.
Our exploratory study found that many of these presumptions were misled, as well as much of the conventional wisdom regarding emerging consumers. To present our findings we organized this report into three sections. The first one examines the mindset and needs of emerging consumers. The second will profile lessons learned from examining the value proposition and business model of small-scale retailers. Finally, the third section will pose relevant issues and challenges for consumer packaged goods retailers who wish to develop winning strategies for attracting emerging consumer segments.
BREAKING THE “MYTHS” ABOUT EMERGING CONSUMERS In Latin America, lower income segments represent a significant and growing percentage of fast-moving consumer products consumption. Therefore, for purposes of this study, the “emerging consumer” was considered to belong to the low to lower-middle income socio-economic strata (SES). Marketing professionals working in Latin America are quite familiar with the challenges of standardizing the definitions and data for SES across countries—however, generally speaking, the emerging consumer falls into the “C” or “D” SES in each country. A “typical” household has one wage earner—
“About the Work … Market Research and Fieldwork” Consumer research for this study came from both primary and secondary sources. The methodology employed for primary research was qualitative, using the technique of focus groups. Four focus groups were conducted in each country for a total of 208 participants. Target consumers were women from the emerging socio-economic strata who (1) typically make the bulk of household purchases for food, beverage, personal care, and cleaning products categories and (2) shop regularly in at least one type of small-scale retail format. Among the secondary sources consulted were SES profiles from local marketing research associations and previously published, relevant consumer studies from organizations such as Latin Panel. Fieldwork carried out in each country included 217 store checks and 190 in-depth interviews with small retailers to complete the value proposition/business model assessment. Each store visit lasted approximately 1–1.5 hours and consisted of both data capture (e.g., shelf prices, SKU counts) and, where possible, an interview with the store owner or operator on issues ranging from the customer base to operating costs and sales mix. Note that given the sample size, results in some cases are directionally correct but not statistically significant. “Best efforts” were made to check the accuracy of the responses—for example, by double-checking the prices retailers stated they paid for products against wholesale prices collected from distributors or public wholesale markets or by collecting tickets and receipts discarded in the store. Comparisons with the large-scale trade are based on selected players in each country, for which financial information is publicly available. The selection of these players is intended only as a point of comparison, and is not meant to imply that these retailers are necessarily “representative” of the supermarket retail sector in each country. Country fieldwork also included a smaller number of interviews with distributors and tax practitioners to understand the value chain of selected products and sources of informality in the retail sector. Finally, this study draws upon a wealth of general secondary research and data sources: syndicated data sources such as A.C. Nielsen; local retail-oriented associations such as ABRAS in Brazil and ANTAD in Mexico; journal and popular press articles, and the like.
5
usually the male—who earns anywhere from $US 80 to $US 300 per month in a working class profession. Many emerging consumer households have stay-at-home mothers, who are responsible for making the bulk (but not all) of the household purchases.
Our focus was to understand not only what and where these consumers buy, but
why they make these choices. While there are many salient differences between emerging consumers across the six countries in this study, several common themes emerged that contradict the conventional wisdom about these consumers. Next we will look at the “truth” about emerging consumers, in relation to six common myths/preconceptions about lower income segments.
Myth #1: Low Income Consumers Have Little Money to Spend In spite of being perceived as “poor,” emerging consumers in fact have a considerable amount of money as a group to spend on consumer products. And, while incomes are indeed lower and less stable, these consumers dedicate a larger portion of their income to household purchases.
Consumer products are the #1 consumption category across Latin American countries, with housing/rent, transportation, and communication typically absorbing a large part of the remainder. However, while consumer products make up roughly 30%-35% of consumption for the “average consumer” in a given country, emerging segments spend a disproportionately bigger share on these products—anywhere from 50%-75%, with the lowest SES claiming to spend nearly all income on these purchases. Hence, while it is true that their incomes are lower and overall they buy less, the net effect is that household purchases can still amount to substantial sums over time,iv and therefore represent a significant share of the consumer goods markets. Furthermore, the vast majority of lower-income consumers can hardly be described as “destitute.” It is true that Latin America has its share of poverty, and that there are social classes who have the misfortunate circumstances so as to earn the descriptive label of “marginal” or “indigent.” But many households today have running water, electricity, and basic appliances that have an impact on purchasing behavior. Nearly all “C” and “D” households have a television, radio, and refrigerator
“A Word About Socio-economic Strata (SES)” In this report, socio-economic strata (SES) are often referred to in the conventional letter format: A, B, C, D, and E. These letters roughly translate into “upper class” (A), “middle to upper class” (B), “lower middle to middle class” (C), “lower class” (D), and “subsistence level” (E). These ratings are typically based on a number of variables including asset ownership, occupation, and education. Income does not usually enter into the SES rating since this information is notoriously difficult to verify. It is important to note that SES ratings are relative to each country—and an affluent household in one country can have quite different purchasing power and characteristics when compared to an affluent household in another country. Many countries have multiple methods for classifying consumers into SES. And some countries (like Colombia and Costa Rica) use numbers rather than letters to designate strata.
6
(e.g., 90%–100% household penetration)—and in countries like Mexico and Costa Rica, penetration of washing machines, VCRs, and access to cars in urban areas is relatively high.v Beyond the rather large fraction of the budget these purchases represent, household expenditures have a much greater meaning to emerging consumers. For the women that control the majority of these purchases, consumer products are a key mechanism by which they fulfill the overlapping roles of “wife,” “mother,” “economist” and “self.” Our discussion groups revealed that considerable self-esteem is derived from managing this spend in the best way possible to care for the family—a task that, as we next observe, can be rather complex. Myth #2: At the “Bottom of the Pyramid,” Needs are Simple and the Lowest Cost Prevails Their lower and less stable incomes mean emerging consumers need simple, affordable products and low cost retail formats. Yet emerging consumer product and format needs are better described as “basic” rather than “simple.” These consumers overwhelmingly purchase more basic foodstuffs and perishables, but they are willing to pay for intermediate and leading brands in basic categories. And they also may shun low cost retail formats such as hard discount stores.vi
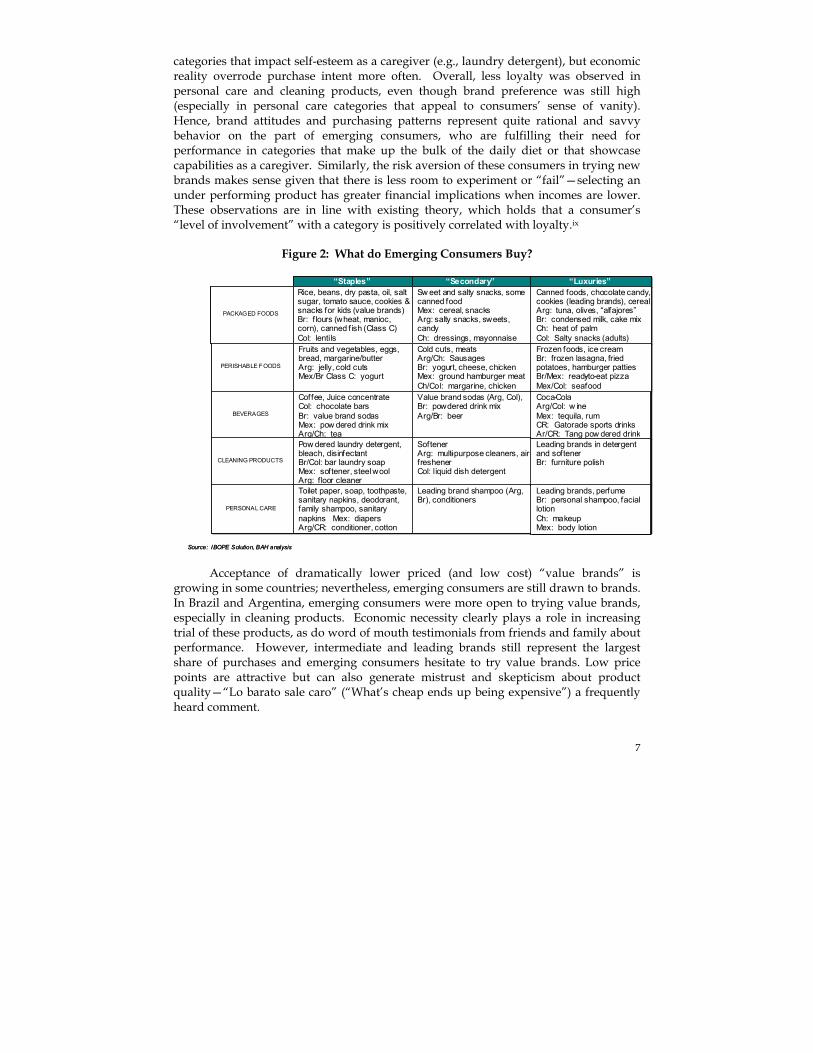
Certainly, there is a well-established link between affordability and category penetration of consumer products in low-income households. The shopping basket of these consumers is weighted towards staple products—some of which are common across countries while others are not. Typically the more expensive, higher value added categories like frozen foods, ready-to-eat meals, yogurt or flavored milk drinks, and fabric softener have lower penetration in these households, driven in part by the low penetration of household appliances like freezers and microwaves.vii
In looking at emerging consumer attitudes towards brands, there is tension
between brand preference and consumers’ economic reality. We found that these consumers have a strong preference for intermediate and leading brands and not buying them can generate frustration. Overall, discussion group participants stated that they regularly purchase intermediate and leading brands; we also noted an unwillingness to try new brands.viii However, these attitudes towards brands are not a lemming-like response to advertising campaigns or blindly ignoring economic constraints—consumers are keenly aware that leading brands carry a price premium. But perhaps more importantly, brands embody backing, confidence, and quality for these consumers as a group.
It is worth noting that brand loyalty (for purposes of this study, defined as
purchasing a brand as opposed to just preference or purchase intent) differs by category. Interestingly enough, we found the highest loyalty to brands on staples like rice and cooking oil. Loyalty was also high for aspirational categories like soft drinks, or
7
categories that impact self-esteem as a caregiver (e.g., laundry detergent), but economic reality overrode purchase intent more often. Overall, less loyalty was observed in personal care and cleaning products, even though brand preference was still high (especially in personal care categories that appeal to consumers’ sense of vanity). Hence, brand attitudes and purchasing patterns represent quite rational and savvy behavior on the part of emerging consumers, who are fulfilling their need for performance in categories that make up the bulk of the daily diet or that showcase capabilities as a caregiver. Similarly, the risk aversion of these consumers in trying new brands makes sense given that there is less room to experiment or “fail”—selecting an under performing product has greater financial implications when incomes are lower. These observations are in line with existing theory, which holds that a consumer’s “level of involvement” with a category is positively correlated with loyalty.ix
Figure 2: What do Emerging Consumers Buy?
PACKAGED FOODS PACKAGED FOODS
PERISHABLE FOODS PERISHABLE F OODS
BEVERAGES BEVERAGES
CLEANING PRODUCTS CLEANING PRODUCTS
PERSONAL CARE PERSONAL CARE
Source: IBOPE Solution, BAH analysis
“Staples”“Staples”Rice, beans, dry pasta, oil, salt sugar, tomato sauce, cookies & snacks for kids (value brands)Br: f lours (wheat, manioc, corn), canned fish (Class C)Col: lentils
Rice, beans, dry pasta, oil, salt sugar, tomato sauce, cookies & snacks for kids (value brands)Br: f lours (wheat, manioc, corn), canned f ish (Class C)Col: lentilsFruits and vegetables, eggs, bread, margarine/butterArg: jelly, cold cutsMex/Br Class C: yogurt
Fruits and vegetables, eggs, bread, margarine/butterArg: jelly, cold cutsMex/Br Class C: yogurt
Coffee, Juice concentrateCol: chocolate barsBr: value brand sodasMex: pow dered drink mixArg/Ch: tea
Coffee, Juice concentrateCol: chocolate barsBr: value brand sodasMex: pow dered drink mixArg/Ch: teaPow dered laundry detergent, bleach, disinfectantBr/Col: bar laundry soapMex: softener, steel woolArg: f loor cleaner
Pow dered laundry detergent, bleach, disinfectantBr/Col: bar laundry soapMex: softener, steel woolArg: f loor cleanerToilet paper, soap, toothpaste, sanitary napkins, deodorant, family shampoo, sanitary napkins Mex: diapersArg/CR: conditioner, cotton
Toilet paper, soap, toothpaste, sanitary napkins, deodorant, family shampoo, sanitary napkins Mex: diapersArg/CR: conditioner, cotton
“Secondary”“Secondary”Sw eet and salty snacks, some canned foodMex: cereal, snacksArg: salty snacks, sweets, candy Ch: dressings, mayonnaise
Sw eet and salty snacks, some canned foodMex: cereal, snacksArg: salty snacks, sweets, candy Ch: dressings, mayonnaiseCold cuts, meatsArg/Ch: SausagesBr: yogurt, cheese, chickenMex: ground hamburger meatCh/Col: margarine, chicken
Cold cuts, meatsArg/Ch: SausagesBr: yogurt, cheese, chickenMex: ground hamburger meatCh/Col: margarine, chickenValue brand sodas (Arg, Col),Br: powdered drink mixArg/Br: beer
Value brand sodas (Arg, Col),Br: powdered drink mixArg/Br: beer
SoftenerArg: multi-purpose cleaners, air freshenerCol: liquid dish detergent
SoftenerArg: multi-purpose cleaners, air freshenerCol: liquid dish detergent
Leading brand shampoo (Arg, Br), conditionersLeading brand shampoo (Arg, Br), conditioners
“Luxuries” “Luxuries” Canned foods, chocolate candy, cookies (leading brands), cereal Arg: tuna, olives, “alfajores” Br: condensed milk, cake mix Ch: heat of palm Col: Salty snacks (adults)
Canned foods, chocolate candy, cookies (leading brands), cereal Arg: tuna, olives, “alfajores” Br: condensed milk, cake mix Ch: heat of palm Col: Salty snacks (adults) Frozen foods, ice cream Br: frozen lasagna, fried potatoes, hamburger patties Br/Mex: ready - to - eat pizza Mex/Col: seafood
Frozen foods, ice cream Br: frozen lasagna, fried potatoes, hamburger patties Br/Mex: ready - to - eat pizza Mex/Col: seafood Coca-cola Arg/Col: w ine Mex: tequila, rum CR: Gatorade sports drinks Ar/CR: Tang pow dered drink
Coca-cola Arg/Col: w ine Mex: tequila, rum CR: Gatorade sports drinks Ar/CR: Tang pow dered drink Leading brands in detergent and softener Br: furniture polish
Leading brands in detergent and softener Br: furniture polish
Leading brands, perfume Br: personal shampoo, facial lotionCh: makeup Mex: body lotion
Leading brands, perfume Br: personal shampoo, facial lotionCh: makeup Mex: body lotion
PACKAGED FOODS PACKAGED FOODS
PERISHABLE FOODS PERISHABLE F OODS
BEVERAGES BEVERAGES
CLEANING PRODUCTS CLEANING PRODUCTS
PERSONAL CARE PERSONAL CARE
Source: IBOPE Solution, BAH analysis
“Staples”“Staples”Rice, beans, dry pasta, oil, salt sugar, tomato sauce, cookies & snacks for kids (value brands)Br: f lours (wheat, manioc, corn), canned fish (Class C)Col: lentils
Rice, beans, dry pasta, oil, salt sugar, tomato sauce, cookies & snacks for kids (value brands)Br: f lours (wheat, manioc, corn), canned f ish (Class C)Col: lentilsFruits and vegetables, eggs, bread, margarine/butterArg: jelly, cold cutsMex/Br Class C: yogurt
Fruits and vegetables, eggs, bread, margarine/butterArg: jelly, cold cutsMex/Br Class C: yogurt
Coffee, Juice concentrateCol: chocolate barsBr: value brand sodasMex: pow dered drink mixArg/Ch: tea
Coffee, Juice concentrateCol: chocolate barsBr: value brand sodasMex: pow dered drink mixArg/Ch: teaPow dered laundry detergent, bleach, disinfectantBr/Col: bar laundry soapMex: softener, steel woolArg: f loor cleaner
Pow dered laundry detergent, bleach, disinfectantBr/Col: bar laundry soapMex: softener, steel woolArg: f loor cleanerToilet paper, soap, toothpaste, sanitary napkins, deodorant, family shampoo, sanitary napkins Mex: diapersArg/CR: conditioner, cotton
Toilet paper, soap, toothpaste, sanitary napkins, deodorant, family shampoo, sanitary napkins Mex: diapersArg/CR: conditioner, cotton
“Secondary”“Secondary”Sw eet and salty snacks, some canned foodMex: cereal, snacksArg: salty snacks, sweets, candy Ch: dressings, mayonnaise
Sw eet and salty snacks, some canned foodMex: cereal, snacksArg: salty snacks, sweets, candy Ch: dressings, mayonnaiseCold cuts, meatsArg/Ch: SausagesBr: yogurt, cheese, chickenMex: ground hamburger meatCh/Col: margarine, chicken
Cold cuts, meatsArg/Ch: SausagesBr: yogurt, cheese, chickenMex: ground hamburger meatCh/Col: margarine, chickenValue brand sodas (Arg, Col),Br: powdered drink mixArg/Br: beer
Value brand sodas (Arg, Col),Br: powdered drink mixArg/Br: beer
SoftenerArg: multi-purpose cleaners, air freshenerCol: liquid dish detergent
SoftenerArg: multi-purpose cleaners, air freshenerCol: liquid dish detergent
Leading brand shampoo (Arg, Br), conditionersLeading brand shampoo (Arg, Br), conditioners
“Luxuries” “Luxuries” Canned foods, chocolate candy, cookies (leading brands), cereal Arg: tuna, olives, “alfajores” Br: condensed milk, cake mix Ch: heat of palm Col: Salty snacks (adults)
Canned foods, chocolate candy, cookies (leading brands), cereal Arg: tuna, olives, “alfajores” Br: condensed milk, cake mix Ch: heat of palm Col: Salty snacks (adults) Frozen foods, ice cream Br: frozen lasagna, fried potatoes, hamburger patties Br/Mex: ready - to - eat pizza Mex/Col: seafood
Frozen foods, ice cream Br: frozen lasagna, fried potatoes, hamburger patties Br/Mex: ready - to - eat pizza Mex/Col: seafood Coca-cola Arg/Col: w ine Mex: tequila, rum CR: Gatorade sports drinks Ar/CR: Tang pow dered drink
Coca-Cola Arg/Col: w ine Mex: tequila, rum CR: Gatorade sports drinks Ar/CR: Tang pow dered drink Leading brands in detergent and softener Br: furniture polish
Leading brands in detergent and softener Br: furniture polish
Leading brands, perfume Br: personal shampoo, facial lotionCh: makeup Mex: body lotion
Leading brands, perfume Br: personal shampoo, facial lotionCh: makeup Mex: body lotion
Acceptance of dramatically lower priced (and low cost) “value brands” is
growing in some countries; nevertheless, emerging consumers are still drawn to brands. In Brazil and Argentina, emerging consumers were more open to trying value brands, especially in cleaning products. Economic necessity clearly plays a role in increasing trial of these products, as do word of mouth testimonials from friends and family about performance. However, intermediate and leading brands still represent the largest share of purchases and emerging consumers hesitate to try value brands. Low price points are attractive but can also generate mistrust and skepticism about product quality—“Lo barato sale caro” (“What’s cheap ends up being expensive”) a frequently heard comment.

8
Another way in which the “lowest cost” myth does not play out relates to package sizes. Subsets of emerging consumers have lower or less stable incomes, and they prefer to smooth consumption over time rather than go without products. Lower incomes mean that larger sizes represent a much larger portion of available income, so consumers knowingly incur higher per unit costs (e.g., price per gram) on smaller sizes to keep ticket sizes down and in line with cash on hand. Myth #3: Emerging Consumers are Overwhelmingly Attracted to Low Shelf Prices Emerging consumers are certainly “price sensitive,” as evidenced by the meticulous tracking of price benchmarks, the exercise of self-constraint while shopping, and aversion to debt and credit when purchasing consumables. Their response to the recent deterioration in economic conditions shows that they do scale back spending in response to decreased incomes or increasing prices (if incomes do not also rise). However, purchasing decisions are more driven by a desire to minimize “total purchasing cost”–which is entirely different from retail shelf price.
“Total purchasing cost” represents a fully loaded cost for a basket of goods, and retail shelf prices naturally make up an important part of the equation. However, we found that emerging consumers mentally factor in transportation costs to arrive at a final price for the shopping basket—that is, the “total purchasing cost.” In addition, they have strong awareness of “hassle factors” (such as finding child care or policing / coping with children’s demands while in the store), logistical constraints for bringing purchases home, and time spent commuting or (to a lesser degree) standing in line. This makes the interplay of physical proximity and pricing a top criterion for selecting a retail format. Format needs do differ for “daily” and “large/stocking” purchases, [See Figure 3] but physical proximity is the first order determinant of store choice in both cases. Consumers do not like to travel very far and they consider the transportation costs of even round trip bus fare or a short taxi ride to be significant.x When asked to explain the difference between a store that is considered “close by” versus “far away,” most consumers define both of these extremes within a relatively small physical distance — “1 block” vs. “7 to 10 blocks away”, or “within a five minutes walk” vs. “three or four bus stops away.” Most emerging consumers in urban areas (by far the bulk of the population in these segments) have numerous store formats nearby and thus need travel only minutes to make daily or even stocking purchases. Usually the nearby stores are small-scale retail formats such as traditional, over-the-counter shops, small independent supermarkets, or street/open air formats.
9
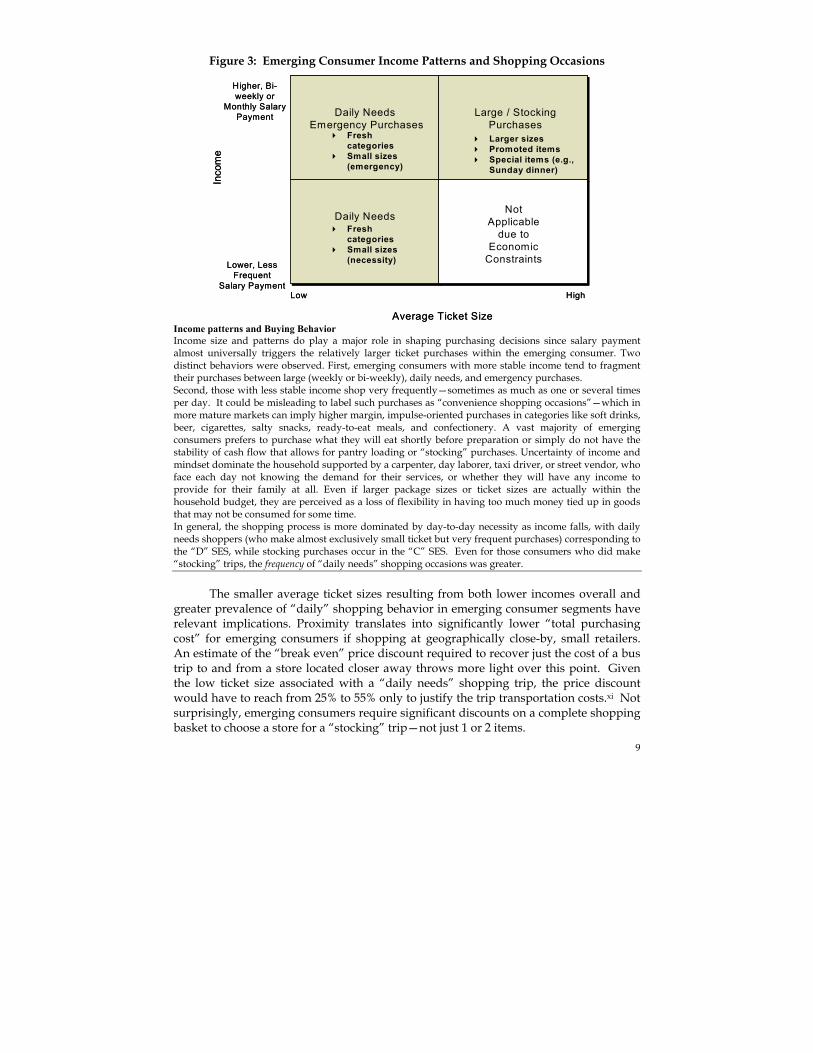
Figure 3: Emerging Consumer Income Patterns and Shopping Occasions
Daily NeedsEmergency Purchases
Large / Stocking Purchases
Low High
Lower, Less Frequent
Salary Payment
Higher, Bi-weekly or
Monthly Salary Payment
Inco
me
Average Ticket Size
Daily Needs
Fresh categoriesSmall sizes (emergency)
Fresh categoriesSmall sizes (necessity)
Larger sizesPromoted itemsSpecial items (e.g., Sunday dinner)
Not Applicable
due to Economic
Constraints
Income patterns and Buying Behavior Income size and patterns do play a major role in shaping purchasing decisions since salary payment almost universally triggers the relatively larger ticket purchases within the emerging consumer. Two distinct behaviors were observed. First, emerging consumers with more stable income tend to fragment their purchases between large (weekly or bi-weekly), daily needs, and emergency purchases. Second, those with less stable income shop very frequently—sometimes as much as one or several times per day. It could be misleading to label such purchases as “convenience shopping occasions”—which in more mature markets can imply higher margin, impulse-oriented purchases in categories like soft drinks, beer, cigarettes, salty snacks, ready-to-eat meals, and confectionery. A vast majority of emerging consumers prefers to purchase what they will eat shortly before preparation or simply do not have the stability of cash flow that allows for pantry loading or “stocking” purchases. Uncertainty of income and mindset dominate the household supported by a carpenter, day laborer, taxi driver, or street vendor, who face each day not knowing the demand for their services, or whether they will have any income to provide for their family at all. Even if larger package sizes or ticket sizes are actually within the household budget, they are perceived as a loss of flexibility in having too much money tied up in goods that may not be consumed for some time. In general, the shopping process is more dominated by day-to-day necessity as income falls, with daily needs shoppers (who make almost exclusively small ticket but very frequent purchases) corresponding to the “D” SES, while stocking purchases occur in the “C” SES. Even for those consumers who did make “stocking” trips, the frequency of “daily needs” shopping occasions was greater.
The smaller average ticket sizes resulting from both lower incomes overall and
greater prevalence of “daily” shopping behavior in emerging consumer segments have relevant implications. Proximity translates into significantly lower “total purchasing cost” for emerging consumers if shopping at geographically close-by, small retailers. An estimate of the “break even” price discount required to recover just the cost of a bus trip to and from a store located closer away throws more light over this point. Given the low ticket size associated with a “daily needs” shopping trip, the price discount would have to reach from 25% to 55% only to justify the trip transportation costs.xi Not surprisingly, emerging consumers require significant discounts on a complete shopping basket to choose a store for a “stocking” trip—not just 1 or 2 items.
10
Myth #4: The Fallacy of the “Modern Trade”: Emerging Consumers Should Prefer Supermarkets Emerging consumers are often looked at as junior versions of their higher income compatriots, who should naturally flock to the modern infrastructure, shopping experience, and the variety and value that large supermarkets provide. (This myth presupposes that there are specific barriers to this happening, as we will discuss in the next section) Emerging consumers may not be all that distinct from higher income segments in that all consumers tend to look for “good” prices at stores they consider to be within an acceptable distance.xii But the similarities probably stop there. Other distinct format characteristics beyond the proximity/price combination seem to distinguish emerging from higher income consumers.
Product assortment is certainly a relevant store choice criterion for all consumers, but in the emerging segments, product variety can be a double-edged sword. Emerging consumers do not like to feel their choice is restricted and consequently they value a wide assortment—although admittedly as a point of interest or form of entertainment. As an example, many emerging consumers described how they like to browse the wide variety of personal care and general merchandise items found in larger stores—but that they did not necessarily buy. Furthermore, the entertainment value of a wide assortment was clearly associated with “stocking” trips—which occur much less frequently in these segments. In fact, a wide assortment sometimes has a negative effect on because it is either too tempting, time consuming to shop, or because it reinforces feelings of restriction and having to do without. Thus, emerging consumers value the “right” product assortment—a mix that is carefully tailored to needs for performance, brands, economy, and feelings of validation. This is a decidedly more abstract concept than simply filling a store with thousands of SKUs.
“Operational Characteristics of Street Markets in Brazil” In Brazil, metropolitan street markets or “feiras" are quite common. They are licensed by the city governments and operate from Tuesday to Sunday. For each day of the week, several different feiras occur in different locations. The items sold to consumers at the feira are mostly fresh produce, beef, fish, and poultry. Within each category, it is common to find made grades of product or hard to find “local specialties.” There may also be a very limited selection of grocery items, housewares, clothing and shoes. In Sao Paulo, they are responsible for 70% of the overall supply of fresh food for the city. Feiras take place in pre-determined streets, which are closed for traffic, and later cleaned by city employees. They consist of portable stalls or modified vehicles, from which products are sold. Stalls are set up early in the morning—between 5:00 and 6:30 a.m. The public starts to arrive around 7:00 a.m., but customer movement peaks around 10:00 a.m. and by 1:00 p.m., most of the crowd is gone. At the early hours of the feira, prices tend to be higher, and no discounts are offered. As the morning progresses, prices are reduced and discounts are offered. Stall owners, or “feirantes,” seek to sell all their merchandise since in many cases product is fully ripe and highly perishable. Note: paraphrased from “The Structure of Sao Paulo Street Markets: Evolving Patterns of Retail Institutions,” Journal of Consumer Affairs, Vol 33, No. 1.

11
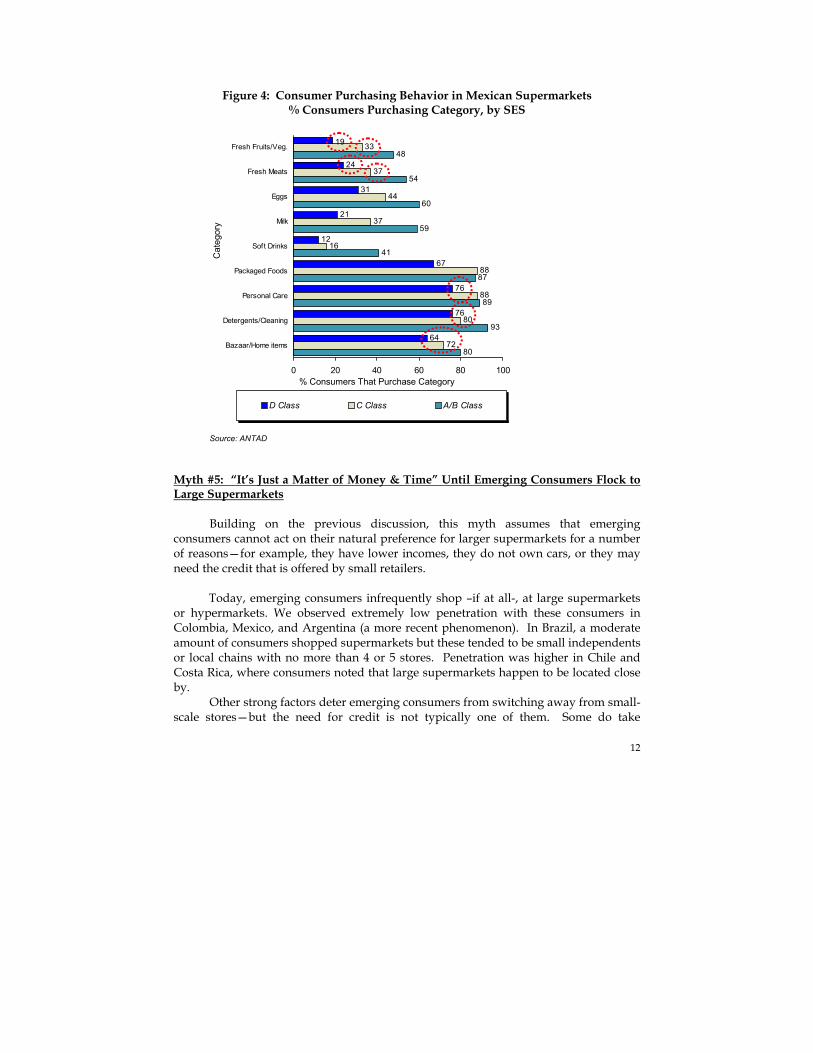
For some product categories like fresh fruits, vegetables, meats, breads, and milk, emerging consumers in fact do not prefer large chain supermarkets at all. Instead, there is a strong association of fresh categories with street and open air formats where quality is perceived to be higher, prices are substantially lower, products may be sampled, and the customers can actively manage the price/quality tradeoff by choosing the time of day at which they buy. It is important to note that for these consumers, the definition of “quality” in fresh categories is not necessarily consistent with the uniformly shaped and colored product typically offered for sale in large supermarkets.
Whereas there is a feeling that the stocking and ripening process employed at
large supermarkets is unnatural and even worsens the taste, street and open air formats are seen as wholesome and “farm fresh.” Incidentally, there is evidence that higher income consumers have similar attitudes since although they do purchase more “fresh” categories in large supermarkets than lower income SES, overall penetration is relatively low compared to other categories.
As it turns out, “modern” infrastructure is attractive to emerging consumers but
relatively unimportant as a store selection criterion when it comes to fresh produce. Aspects of store physical appearance are secondary, with infrastructure and hygiene used as a screen rather than a driver of choice. Services associated with the shopping experience at large chain supermarkets (e.g., promotional flyers, delivery with minimum purchase, loyalty cards, and extended operating hours) are similarly less important.
A portion of emerging consumers are attracted to large supermarkets, but by and
large, these large chain formats lack a key element: the emotional proximity and feeling of community that comes as a result of personal relationships with shop keepers or store personnel. Personal relationships are usually the top factor for differentiating between outlets with comparable prices and distance for this group. And it almost always enters into store choice when making daily purchases in small-scale retail stores. These relationships typically result from a history of positive interactions and experience—providing customers with a sense of familiarity and belonging. Personal relationships—rather than formal processes—are the mechanism by which this group generally resolves issues like exchanging a product, coming up short at the cash register, selecting a product during a stockout, or feeling confident that produce and meats are fairly weighted. In comparison, emerging consumers report poor treatment by staff while shopping at large chain stores.xiii Sometimes this is the result of extra scrutiny from security personnel, or clerks who show visible frustration when economizing consumers ask to weigh small purchases or inquire after promotions. The “cold” treatment is often said to come also from other customers in the store.
12
Figure 4: Consumer Purchasing Behavior in Mexican Supermarkets % Consumers Purchasing Category, by SES
19
24
31
21
12
67
76
76
64
33
37
44
37
16
88
88
80
72
48
54
60
59
41
87
89
93
80
0 20 40 60 80 100
Fresh Fruits/Veg.
Fresh Meats
Eggs
Milk
Soft Drinks
Packaged Foods
Personal Care
Detergents/Cleaning
Bazaar/Home items
D Class C Class A/B Class
% Consumers That Purchase Category
Source: ANTAD
Cat
egor
y
Myth #5: “It’s Just a Matter of Money & Time” Until Emerging Consumers Flock to Large Supermarkets
Building on the previous discussion, this myth assumes that emerging consumers cannot act on their natural preference for larger supermarkets for a number of reasons—for example, they have lower incomes, they do not own cars, or they may need the credit that is offered by small retailers.
Today, emerging consumers infrequently shop –if at all-, at large supermarkets or hypermarkets. We observed extremely low penetration with these consumers in Colombia, Mexico, and Argentina (a more recent phenomenon). In Brazil, a moderate amount of consumers shopped supermarkets but these tended to be small independents or local chains with no more than 4 or 5 stores. Penetration was higher in Chile and Costa Rica, where consumers noted that large supermarkets happen to be located close by.
Other strong factors deter emerging consumers from switching away from small-scale stores—but the need for credit is not typically one of them. Some do take
13
advantage of credit out of necessity on occasion, and consumers who rely on “fiado” credit do have strong barriers to switching stores. Yet, generally speaking, lower income segments are averse to spending beyond their means and they prefer to pay cash as a means of controlling expenditures. Credit is viewed as more appropriate for major purchases (e.g., appliances, back-to-school supplies and uniforms) rather than for funding day-to-day consumables.
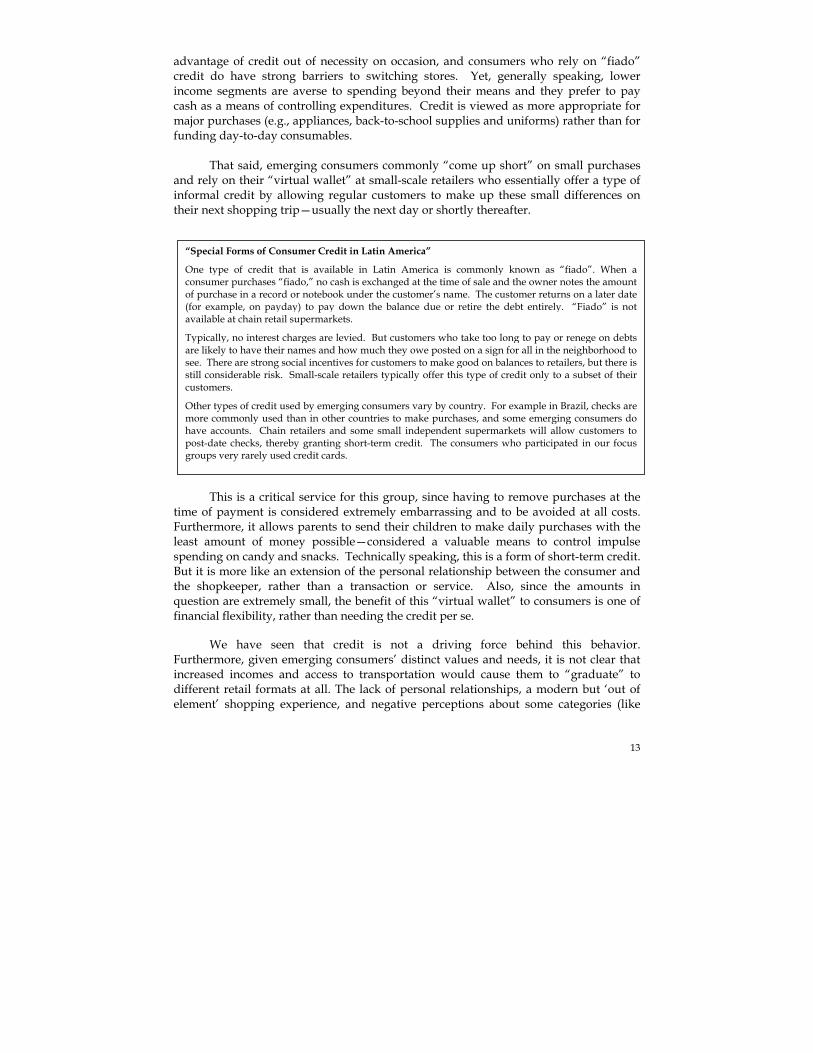
That said, emerging consumers commonly “come up short” on small purchases
and rely on their “virtual wallet” at small-scale retailers who essentially offer a type of informal credit by allowing regular customers to make up these small differences on their next shopping trip—usually the next day or shortly thereafter.
This is a critical service for this group, since having to remove purchases at the
time of payment is considered extremely embarrassing and to be avoided at all costs. Furthermore, it allows parents to send their children to make daily purchases with the least amount of money possible—considered a valuable means to control impulse spending on candy and snacks. Technically speaking, this is a form of short-term credit. But it is more like an extension of the personal relationship between the consumer and the shopkeeper, rather than a transaction or service. Also, since the amounts in question are extremely small, the benefit of this “virtual wallet” to consumers is one of financial flexibility, rather than needing the credit per se.
We have seen that credit is not a driving force behind this behavior. Furthermore, given emerging consumers’ distinct values and needs, it is not clear that increased incomes and access to transportation would cause them to “graduate” to different retail formats at all. The lack of personal relationships, a modern but ‘out of element’ shopping experience, and negative perceptions about some categories (like
“Special Forms of Consumer Credit in Latin America” One type of credit that is available in Latin America is commonly known as “fiado”. When a consumer purchases “fiado,” no cash is exchanged at the time of sale and the owner notes the amount of purchase in a record or notebook under the customer’s name. The customer returns on a later date (for example, on payday) to pay down the balance due or retire the debt entirely. “Fiado” is not available at chain retail supermarkets. Typically, no interest charges are levied. But customers who take too long to pay or renege on debts are likely to have their names and how much they owe posted on a sign for all in the neighborhood to see. There are strong social incentives for customers to make good on balances to retailers, but there is still considerable risk. Small-scale retailers typically offer this type of credit only to a subset of their customers. Other types of credit used by emerging consumers vary by country. For example in Brazil, checks are more commonly used than in other countries to make purchases, and some emerging consumers do have accounts. Chain retailers and some small independent supermarkets will allow customers to post-date checks, thereby granting short-term credit. The consumers who participated in our focus groups very rarely used credit cards.
14
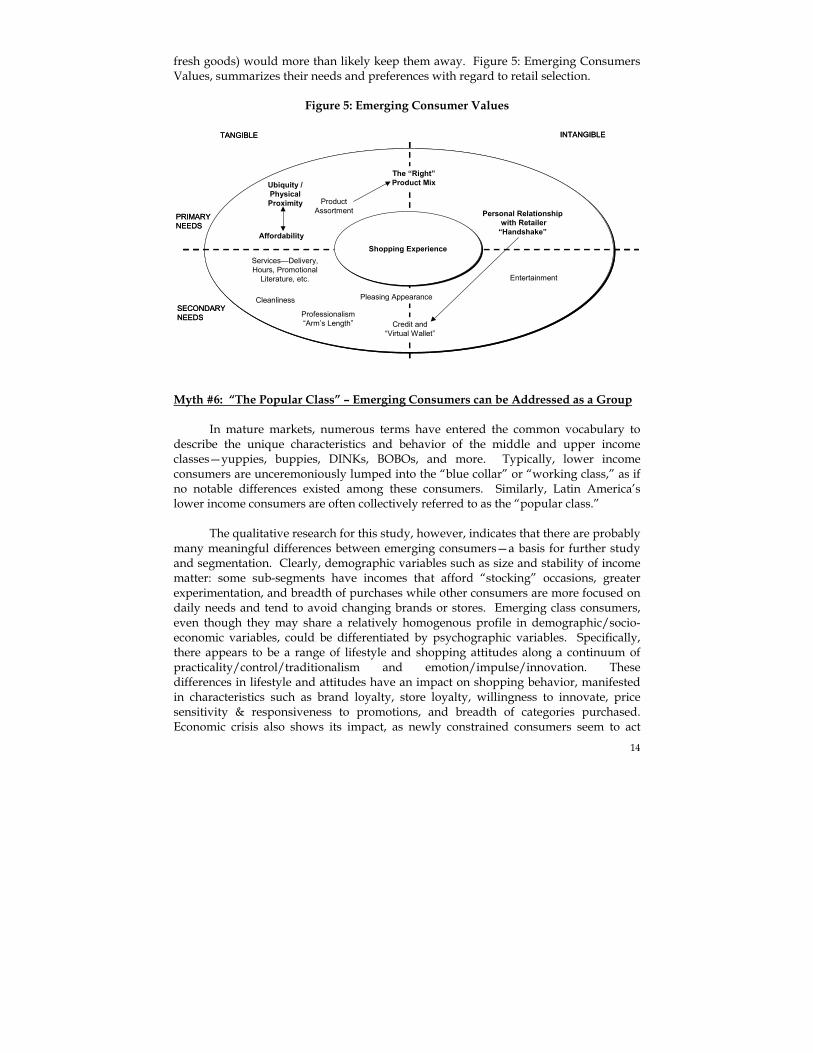
fresh goods) would more than likely keep them away. Figure 5: Emerging Consumers Values, summarizes their needs and preferences with regard to retail selection.
Figure 5: Emerging Consumer Values
Shopping ExperienceShopping Experience
TANGIBLE INTANGIBLE
PRIMARY NEEDS
SECONDARY NEEDS
Product Assortment
The “Right” Product Mix
Affordability
Ubiquity / Physical Proximity
Personal Relationshipwith Retailer
“Handshake”
Credit and “Virtual Wallet”
Pleasing AppearanceCleanliness
Professionalism“Arm’s Length”
Services—Delivery, Hours, Promotional
Literature, etc. Entertainment
Myth #6: “The Popular Class” – Emerging Consumers can be Addressed as a Group
In mature markets, numerous terms have entered the common vocabulary to describe the unique characteristics and behavior of the middle and upper income classes—yuppies, buppies, DINKs, BOBOs, and more. Typically, lower income consumers are unceremoniously lumped into the “blue collar” or “working class,” as if no notable differences existed among these consumers. Similarly, Latin America’s lower income consumers are often collectively referred to as the “popular class.”
The qualitative research for this study, however, indicates that there are probably
many meaningful differences between emerging consumers—a basis for further study and segmentation. Clearly, demographic variables such as size and stability of income matter: some sub-segments have incomes that afford “stocking” occasions, greater experimentation, and breadth of purchases while other consumers are more focused on daily needs and tend to avoid changing brands or stores. Emerging class consumers, even though they may share a relatively homogenous profile in demographic/socio-economic variables, could be differentiated by psychographic variables. Specifically, there appears to be a range of lifestyle and shopping attitudes along a continuum of practicality/control/traditionalism and emotion/impulse/innovation. These differences in lifestyle and attitudes have an impact on shopping behavior, manifested in characteristics such as brand loyalty, store loyalty, willingness to innovate, price sensitivity & responsiveness to promotions, and breadth of categories purchased. Economic crisis also shows its impact, as newly constrained consumers seem to act
15
differently from structurally low income groups—many of the “newly poor” are struggling with the ordeal of defining what they can do without.
In summary, research across six Latin American countries breaks six common myths about emerging consumers. Although “poor” relative to upper the SES, these consumers spend a great deal of money on consumer products and constitute a significant portion of these markets. When shopping, they follow a quite rational and sophisticated behavior as they seek to reconcile preferences with their economic reality. They have a distinct set of product and format needs—which does not necessarily include whatever is lowest cost, credit, or responding to shelf prices. The personal relationships and sense of community they seek is a strong incentive to shop in small-scale retail formats. Furthermore, differences within emerging consumers imply that retailers need a differentiated proposition to address the needs of this group LESSONS LEARNED FROM THE SMALL-SCALE RETAIL TRADE
In terms of sheer number of outlets, small-scale retailers dominate Latin American consumer products retailing, representing in some countries hundreds of thousands of points of sale. Small retailers reach every corner of the land, and make Latin America’s retail landscape unique in its composition. Diverse retail formats both between and within countries offer a sharp contrast to what is often unkindly referred to as the “cookie cutter commerce” of chain stores in more mature markets. Street and open air formats in particular, take on numerous forms in each country and are colorful hubs of both social and economic activity.
The list of names is diverse, but there are five basic service models. “Traditional”
stores tend to be quite small (25m2–50m2) and offer mostly behind the counter service. “Small supermarkets” are self-service businesses that usually have no more than 4 checkout lanes. In this category, stores can range from small self-service outlets with one cash register manned by the sole proprietor, to bustling, independent supermarkets that stock a broad range of products and have as many as 5 or 6 checkouts. “Street and Open Air” formats—by far the least homogeneous of all models—are characterized by semi-permanent or mobile infrastructure—for example, an easily moved cart or stall that may be mounted in the same location every day or in multiple locations which vary by day of the week. “Category Specialists” such as butchers, bakers, and greengrocers concentrate their business on limited fresh categories, usually sold from behind a counter—with some exceptions such as self-service fruit and vegetable stores (“sacalões”) in Brazil. Lastly, “Convenience” outlets sell primarily candy, gum, tobacco, and limited general merchandise (e.g., pens, newspapers) through small (less than 10 m2) but permanent kiosks.
Increasingly, lines are blurring between service models—for example, many
traditional stores sell dry goods across the counter but have some self-service racks for high velocity items like soft drinks, ice cream, packaged breads, cookies, and salty snacks (often these racks are placed in stores as the result of manufacturer direct

16
initiatives). Additionally, many countries have formats that combine the sale of on-premise ready-to-eat foods along with goods for future consumption—for example, bakeries (or “padarias”) in Brazil.
Figure 6: Retail Shopping Formats by Country
Research Scope
Format Type Brazil Mexico Argentina Colombia Chile Costa Rica Organized / Modern Discount Stores
Hypermarkets Large
Supermarkets Wholesalers
“Atacadistas”
Bodega Hyper/Megamarket
s Large
Supermarkets Retail club
Discount Stores Hypermarkets Large
Supermarkets Wholesalers
Hypermarkets Large
Supermarkets
Hypermarkets Large
Supermarkets Wholesalers (to
public) “Pre-Unic”
Hypermarts Large
Supermarkets Wholesale Clubs
(PriceSmart)
Small Supermarkets Small independents Self-service Less than 4 ckout
Self-service supermarkets
(small supermarkets and “Mercadinhos”)
Self-service supermarkets
Self-service supermarkets
Self-service supermarkets “Superetes” & Mini-mercados
Self-service supermarkets
Mini-Supers
“Traditional” Small independents Mostly behind the
counter service
Mercearias / Mercadinhos
Tienda de Abarrotes
“Almacenes” Todo Suelto
Tiendas Pequeñas Tiendas Medianas
“Abarrotes”
Pulperías
“Street” Formats Limited
infrastructure
Feira Livre Tianguis Ferias Mobiles Ferias de Barrio Barter Clubs Door-to-Door Street sellers
(“Bolivianas”)
Public Markets / Abastos
Plaza Mayoristas (sales to public)
“Ferias Mobiles” Casetas
Ambulantes Feria
Ambulantes Chinamos Feria
Category Specialist Açougue Sacolão Padaria
Carnecerías Cremarías Fruterías Pollerías
Carnecerías Fruterías Verdulerías
Carnecerías “Frutiver
Carnecerías Panadarías Verdulerías
Carnecerías Panadarías
Convenience Convenience Gas Bancas / Barracas
Convenience Gas Estanquillos
Maxikioscos Convenience Gas
Convenience Gas Cigarrarías
Convenience Gas Convenience Gas
Given the range and diversity of formats, we focused our research on a subset of small retailers that operate in relatively similar fashion across all six countries: traditional stores, small self service (a subset of “small supermarkets”), and open air street fairs.
Figure 7: Key Financial Ratios from the Strategic Resource Model
N e t s a l e s I n v e n t o r y
N e t s a le s I n v e n t o r y
I n v e n t o r yS e l l i n g f e e tI n v e n t o r y
S e l l i n g f e e t
N e t s a l e s S e l l i n g f e e tN e t s a le s
S e l l i n g f e e t
S e l l i n g f e e tE m p lo y e e s
S e l l i n g f e e tE m p l o y e e s
N e t s a l e s E m p lo y e e sN e t s a le s
E m p l o y e e s
G r o s s m a r g i nN e t s a l e s
G r o s s m a r g i nN e t s a l e s
=
=
=
x
x
x
x
x
=
=
G r o s s m a r g i nI n v e n t o r y
G r o s s m a r g i nI n v e n t o r y
G r o s s m a r g i nS e l l i n g f e e t
G r o s s m a r g i nS e l l i n g f e e t
G r o s s p r o f i tE m p l o y e e s
G r o s s p r o f i tE m p l o y e e s
G M R O IG M R O I
G M R O SG M R O S
G M R O LG M R O L
S a l e sS a l e s G r o s s M a r g i nG r o s s M a r g i n E m p l o y e e sE m p l o y e e s I n v e n t o r yI n v e n t o r y
N e t s a l e s I n v e n t o r y
N e t s a le s I n v e n t o r y
I n v e n t o r yS e l l i n g f e e tI n v e n t o r y
S e l l i n g f e e t
N e t s a l e s S e l l i n g f e e tN e t s a le s
S e l l i n g f e e t
S e l l i n g f e e tE m p lo y e e s
S e l l i n g f e e tE m p l o y e e s
N e t s a l e s E m p lo y e e sN e t s a le s
E m p l o y e e s
G r o s s m a r g i nN e t s a l e s
G r o s s m a r g i nN e t s a l e s
=
=
=
x
x
x
x
x
=
=
G r o s s m a r g i nI n v e n t o r y
G r o s s m a r g i nI n v e n t o r y
G r o s s m a r g i nS e l l i n g f e e t
G r o s s m a r g i nS e l l i n g f e e t
G r o s s p r o f i tE m p l o y e e s
G r o s s p r o f i tE m p l o y e e s
G M R O IG M R O I
G M R O SG M R O S
G M R O LG M R O L
S a l e sS a l e s G r o s s M a r g i nG r o s s M a r g i n E m p l o y e e sE m p l o y e e s I n v e n t o r yI n v e n t o r y
17
To understand the drivers behind these small-scale retailers’ collective success in the market, we developed and adapted standard frameworks for evaluating their value proposition and business model.
Customer-facing value drivers such as place, product assortment, price/value,
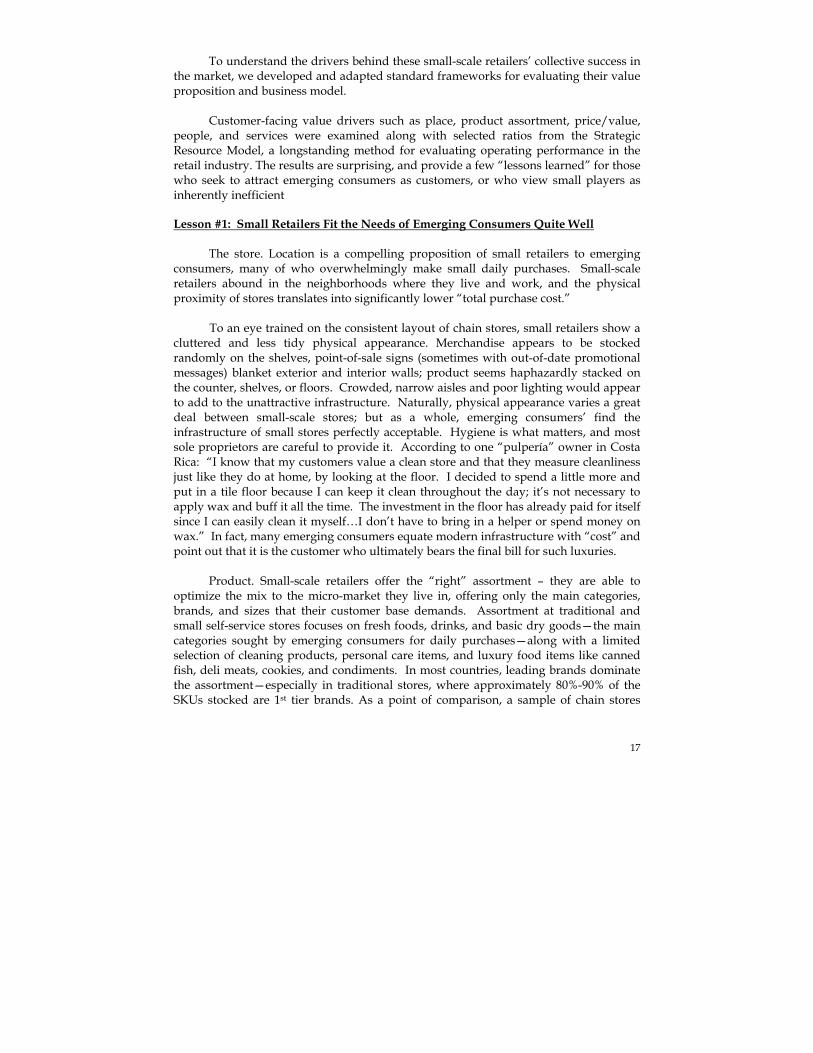
people, and services were examined along with selected ratios from the Strategic Resource Model, a longstanding method for evaluating operating performance in the retail industry. The results are surprising, and provide a few “lessons learned” for those who seek to attract emerging consumers as customers, or who view small players as inherently inefficient Lesson #1: Small Retailers Fit the Needs of Emerging Consumers Quite Well The store. Location is a compelling proposition of small retailers to emerging consumers, many of who overwhelmingly make small daily purchases. Small-scale retailers abound in the neighborhoods where they live and work, and the physical proximity of stores translates into significantly lower “total purchase cost.”
To an eye trained on the consistent layout of chain stores, small retailers show a cluttered and less tidy physical appearance. Merchandise appears to be stocked randomly on the shelves, point-of-sale signs (sometimes with out-of-date promotional messages) blanket exterior and interior walls; product seems haphazardly stacked on the counter, shelves, or floors. Crowded, narrow aisles and poor lighting would appear to add to the unattractive infrastructure. Naturally, physical appearance varies a great deal between small-scale stores; but as a whole, emerging consumers’ find the infrastructure of small stores perfectly acceptable. Hygiene is what matters, and most sole proprietors are careful to provide it. According to one “pulpería” owner in Costa Rica: “I know that my customers value a clean store and that they measure cleanliness just like they do at home, by looking at the floor. I decided to spend a little more and put in a tile floor because I can keep it clean throughout the day; it’s not necessary to apply wax and buff it all the time. The investment in the floor has already paid for itself since I can easily clean it myself…I don’t have to bring in a helper or spend money on wax.” In fact, many emerging consumers equate modern infrastructure with “cost” and point out that it is the customer who ultimately bears the final bill for such luxuries. Product. Small-scale retailers offer the “right” assortment – they are able to optimize the mix to the micro-market they live in, offering only the main categories, brands, and sizes that their customer base demands. Assortment at traditional and small self-service stores focuses on fresh foods, drinks, and basic dry goods—the main categories sought by emerging consumers for daily purchases—along with a limited selection of cleaning products, personal care items, and luxury food items like canned fish, deli meats, cookies, and condiments. In most countries, leading brands dominate the assortment—especially in traditional stores, where approximately 80%-90% of the SKUs stocked are 1st tier brands. As a point of comparison, a sample of chain stores
18
stocked comparably more “value” brands and private label products, with leading brands representing 60%-70% of SKUs.
Additionally, small-scale retailers serve daily purchase needs effectively by offering a higher proportion of smaller sizes and by ‘fractioning’ products. Consistently across the region, small-scale retailers offer an assortment with higher presence of small package sizes. In many countries the smallest size of powdered laundry detergent available in large chain supermarkets is 500g. Small retailers, on the other hand, commonly carry sizes as small as 150 or 250g. Storeowners will fraction products and break bulk on even the smallest standard manufacturer sizes—for example, in categories like dry pasta, cereals, sugar, cigarettes, and more. Open air markets, which typically carry only fresh goods (leaving aside general merchandise categories like clothing, footwear, music, and housewares), provide customers with exactly the quantity desired, no matter how small the amount. In comparison, consumers express feeling shame when asking for very small quantities in large chain supermarkets. Price. Despite a shelf-price disadvantage, “affordability” is not a major issue for many small retailers. Our survey of selected products found that shelf prices for exact substitutes (i.e., same SKUs) were anywhere from 5%-20% more expensive at traditional and small self-service stores (as compared to large supermarkets). Argentina was the only exception—shelf prices were 1%–3% lower.xiv This is not surprising, given that small retailers by definition lack the scale to earn the significant volume discounts or trade allowances granted to large chains. Interestingly, emerging consumers perceive a poor price/value tradeoff at large chain supermarkets, since they think in terms of total purchasing cost. Furthermore, street and open fairs do have a clear shelf price advantage in fresh product—product typically comes direct from farmers, their agents, or vast, wholesale markets. Besides lower prices overall, street and open-air retailers’ service model better matches the consumer demand curve. While chain supermarkets usually offer only 1st grade products, street and open-air formats offer several grades, at different stages of maturity. Stall operators have also the ability to change the prices of produce and fresh products throughout the day—according to demand and supply. People. Small-scale retailers benefit from the presence of the local owner-operator who can tailor their business model to local needs and provide a “personal touch.” Shopkeepers claim to recognize or know by name the majority of their customer base (over 60%). Local owners observed during store surveys made product recommendations, shared neighborhood news, inquired after family, or simply made a point to engage and greet close to every customer who entered the shop. The end result of this treatment is an emotional proximity that makes emerging consumers feel comfortable and in a familiar environment. Adding to this, owner operators may be actively involved in community activities. Service. Lastly, small-scale retailers offer limited services when compared to large chain supermarkets. A few of them accept credit cards, offer home delivery, state that they offer ‘extended operating hours,’ or run promotions such as temporary
19
discounts or free product with purchase (e.g., “buy one get one free”). Although promotional vehicles and merchandising activities are less prevalent, small-scale retailers’ techniques are simple yet appropriate. For example, many stock products in manufacturer supplied refrigerators and racks or make use of POS materials like banners and shelf-talkers to decorate the store and to communicate prices. A quantitative study conducted in Brazil found that small-scale stores were just as likely as large supermarkets to offer signs for price communication, albeit handwritten and “homemade.”xv Some independent supermarkets fund their own promotions, ranging from raffles to temporary price discounts, or even distribute one-page flyers in the neighborhood with prices and promotion information.
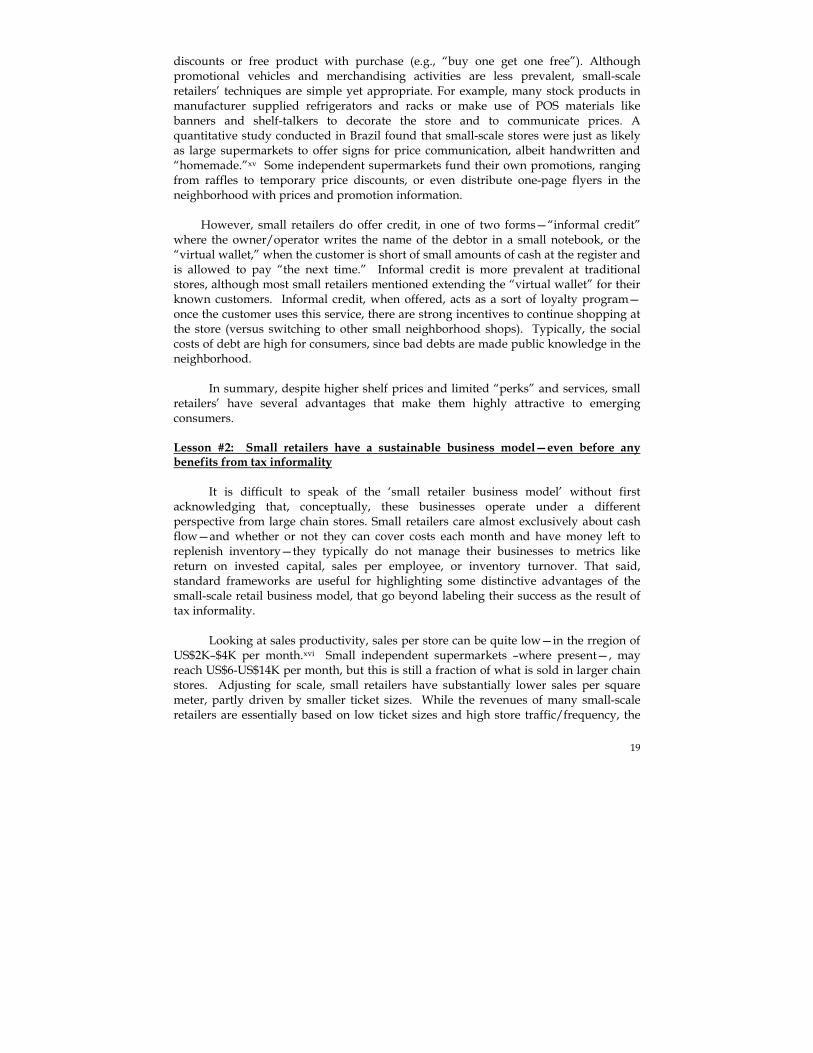
However, small retailers do offer credit, in one of two forms—“informal credit” where the owner/operator writes the name of the debtor in a small notebook, or the “virtual wallet,” when the customer is short of small amounts of cash at the register and is allowed to pay “the next time.” Informal credit is more prevalent at traditional stores, although most small retailers mentioned extending the “virtual wallet” for their known customers. Informal credit, when offered, acts as a sort of loyalty program—once the customer uses this service, there are strong incentives to continue shopping at the store (versus switching to other small neighborhood shops). Typically, the social costs of debt are high for consumers, since bad debts are made public knowledge in the neighborhood. In summary, despite higher shelf prices and limited “perks” and services, small retailers’ have several advantages that make them highly attractive to emerging consumers. Lesson #2: Small retailers have a sustainable business model—even before any benefits from tax informality It is difficult to speak of the ‘small retailer business model’ without first acknowledging that, conceptually, these businesses operate under a different perspective from large chain stores. Small retailers care almost exclusively about cash flow—and whether or not they can cover costs each month and have money left to replenish inventory—they typically do not manage their businesses to metrics like return on invested capital, sales per employee, or inventory turnover. That said, standard frameworks are useful for highlighting some distinctive advantages of the small-scale retail business model, that go beyond labeling their success as the result of tax informality. Looking at sales productivity, sales per store can be quite low—in the rregion of US$2K–$4K per month.xvi Small independent supermarkets –where present—, may reach US$6-US$14K per month, but this is still a fraction of what is sold in larger chain stores. Adjusting for scale, small retailers have substantially lower sales per square meter, partly driven by smaller ticket sizes. While the revenues of many small-scale retailers are essentially based on low ticket sizes and high store traffic/frequency, the
20
differences in Net Sales per Selling Area are striking. In Brazil, sales per square meter for a small supermarket is roughly half that of the large-scale trade. For the traditional stores surveyed, sales per square meter was only about 10% the amount for the large-scale trade.
Figure 8: Average Ticket Size and Monthly Sales per Square Meter (Small-scale vs. Large Chain Retailers)
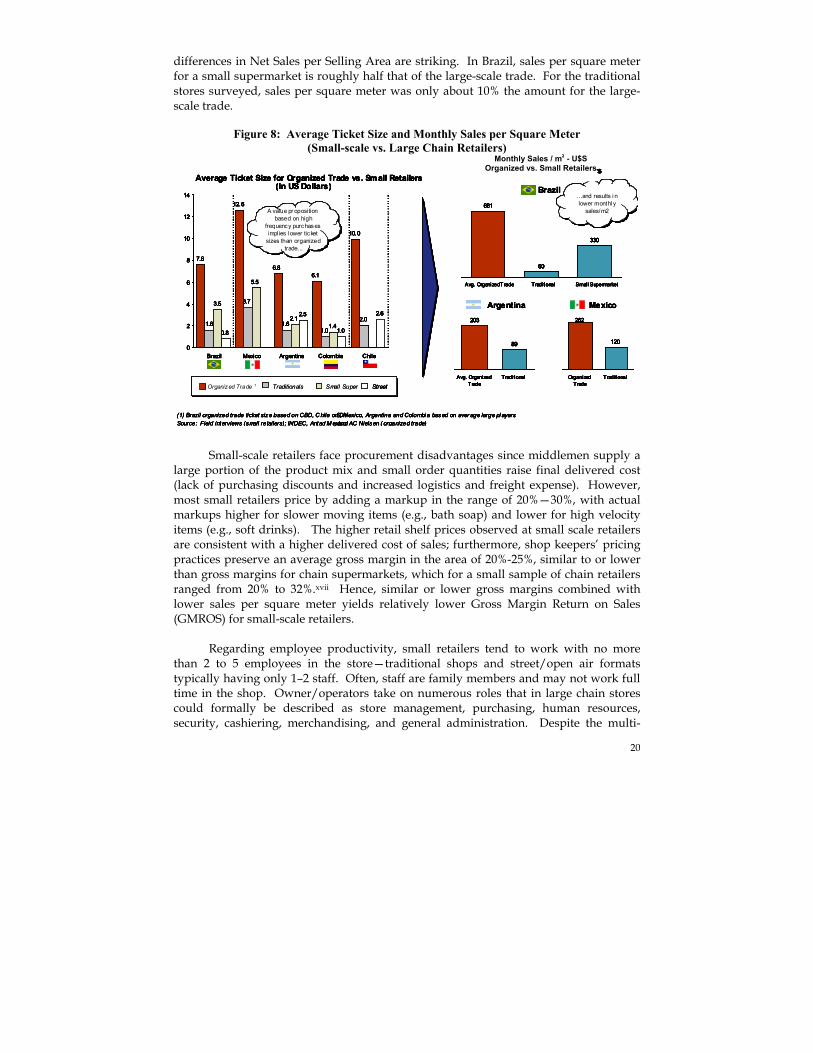
Small-scale retailers face procurement disadvantages since middlemen supply a large portion of the product mix and small order quantities raise final delivered cost (lack of purchasing discounts and increased logistics and freight expense). However, most small retailers price by adding a markup in the range of 20%—30%, with actual markups higher for slower moving items (e.g., bath soap) and lower for high velocity items (e.g., soft drinks). The higher retail shelf prices observed at small scale retailers are consistent with a higher delivered cost of sales; furthermore, shop keepers’ pricing practices preserve an average gross margin in the area of 20%-25%, similar to or lower than gross margins for chain supermarkets, which for a small sample of chain retailers ranged from 20% to 32%.xvii Hence, similar or lower gross margins combined with lower sales per square meter yields relatively lower Gross Margin Return on Sales (GMROS) for small-scale retailers. Regarding employee productivity, small retailers tend to work with no more than 2 to 5 employees in the store—traditional shops and street/open air formats typically having only 1–2 staff. Often, staff are family members and may not work full time in the shop. Owner/operators take on numerous roles that in large chain stores could formally be described as store management, purchasing, human resources, security, cashiering, merchandising, and general administration. Despite the multi-
7.6
12.6
6.86.1
10.0
1.6
3.7
1.61.0
2.0
3.5
5.5
2.11.4
0.8
2.5
1.0
2.6
0
2
4
6
8
10
12
14
Brazil Mexico Argentina Colombia Chile
Organized Trade 1 Traditionals Small Super Street
Average Ticket Size for Organized Trade vs. Small Retailers(In US Dollars)
Monthly Sales / m2 - U$SOrganized vs. Small Retailers
681
60
330
Avg. Organized Trade Traditional Small Supermarket
203
89
Avg. OrganizedTrade
Traditional
262
120
OrganizedTrade
Traditional
Brazil
Argentina Mexico
A value pr oposition based on high
frequency purchases implies l ower ticket
sizes than organized trade...
A value pr oposition based on high
frequency purchases implies l ower ticket
sizes than organized trade. ..
…and results i n lower monthl y
sales/m2
…and results i n lower monthl y
sales/m2
(1) Brazil organized trade ticket size based on CBD, C hile on DYS, Mexico, Argentina and Colombi a based on aver age large pl ayersSource: Field interviews (small retailers); INDEC, Antad M exico, and AC Nielsen ( organized trade)
7.6
12.6
6.86.1
10.0
1.6
3.7
1.61.0
2.0
3.5
5.5
2.11.4
0.8
2.5
1.0
2.6
0
2
4
6
8
10
12
14
Brazil Mexico Argentina Colombia Chile
Organized Trade 1 Traditionals Small Super StreetOrganized Trade 1 TraditionalsTraditionals Small SuperSmall Super StreetStreet
Average Ticket Size for Organized Trade vs. Small Retailers(In US Dollars)
Monthly Sales / m2 - U$SOrganized vs. Small Retailers
681
60
330
Avg. Organized Trade Traditional Small Supermarket
203
89
Avg. OrganizedTrade
Traditional
262
120
OrganizedTrade
Traditional
Brazil
Argentina Mexico
A value pr oposition based on high
frequency purchases implies l ower ticket
sizes than organized trade...
A value pr oposition based on high
frequency purchases implies l ower ticket
sizes than organized trade. ..
…and results i n lower monthl y
sales/m2
…and results i n lower monthl y
sales/m2
(1) Brazil organized trade ticket size based on CBD, C hile on DYS, Mexico, Argentina and Colombi a based on aver age large pl ayersSource: Field interviews (small retailers); INDEC, Antad M exico, and AC Nielsen ( organized trade)
7.6
12.6
6.86.1
10.0
1.6
3.7
1.61.0
2.0
3.5
5.5
2.11.4
0.8
2.5
1.0
2.6
0
2
4
6
8
10
12
14
Brazil Mexico Argentina Colombia Chile
7.6
12.6
6.86.1
10.0
1.6
3.7
1.61.0
2.0
3.5
5.5
2.11.4
0.8
2.5
1.0
2.6
0
2
4
6
8
10
12
14
Brazil Mexico Argentina Colombia Chile
Organized Trade 1 Traditionals Small Super StreetOrganized Trade 1 TraditionalsTraditionals Small SuperSmall Super StreetStreet
Average Ticket Size for Organized Trade vs. Small Retailers(In US Dollars)
Monthly Sales / m2 - U$SOrganized vs. Small Retailers
681
60
330
Avg. Organized Trade Traditional Small Supermarket
681
60
330
Avg. Organized Trade Traditional Small Supermarket
203
89
Avg. OrganizedTrade
Traditional
203
89
Avg. OrganizedTrade
Traditional
262
120
OrganizedTrade
Traditional
262
120
OrganizedTrade
Traditional
Brazil
Argentina Mexico
A value pr oposition based on high
frequency purchases implies l ower ticket
sizes than organized trade...
A value pr oposition based on high
frequency purchases implies l ower ticket
sizes than organized trade. ..
…and results i n lower monthl y
sales/m2
…and results i n lower monthl y
sales/m2
(1) Brazil organized trade ticket size based on CBD, C hile on DYS, Mexico, Argentina and Colombi a based on aver age large pl ayersSource: Field interviews (small retailers); INDEC, Antad M exico, and AC Nielsen ( organized trade)
7.6
12.6
6.86.1
10.0
1.6
3.7
1.61.0
2.0
3.5
5.5
2.11.4
0.8
2.5
1.0
2.6
0
2
4
6
8
10
12
14
Brazil Mexico Argentina Colombia Chile
7.6
12.6
6.86.1
10.0
1.6
3.7
1.61.0
2.0
3.5
5.5
2.11.4
0.8
2.5
1.0
2.6
0
2
4
6
8
10
12
14
Brazil Mexico Argentina Colombia Chile
Organized Trade 1 TraditionalsTraditionals Small SuperSmall Super StreetStreetOrganized Trade 1 TraditionalsTraditionals Small SuperSmall Super StreetStreet
Average Ticket Size for Organized Trade vs. Small Retailers(In US Dollars)
Monthly Sales / m2 - U$SOrganized vs. Small Retailers
681
60
330
Avg. Organized Trade Traditional Small Supermarket
203
89
Avg. OrganizedTrade
Traditional
262
120
OrganizedTrade
Traditional
Brazil
Argentina Mexico
A value pr oposition based on high
frequency purchases implies l ower ticket
sizes than organized trade...
A value pr oposition based on high
frequency purchases implies l ower ticket
sizes than organized trade. ..
…and results i n lower monthl y
sales/m2
…and results i n lower monthl y
sales/m2
(1) Brazil organized trade ticket size based on CBD, C hile on DYS, Mexico, Argentina and Colombi a based on aver age large pl ayersSource: Field interviews (small retailers); INDEC, Antad M exico, and AC Nielsen ( organized trade)
StreetStreet
Average Ticket Size for Organized Trade vs. Small Retailers(In US Dollars)
Monthly Sales / m2 - U$SOrganized vs. Small Retailers
681
60
330
Avg. Organized Trade Traditional Small Supermarket
681
60
330
Avg. Organized Trade Traditional Small Supermarket
203
89
Avg. OrganizedTrade
Traditional
203
89
Avg. OrganizedTrade
Traditional
262
120
OrganizedTrade
Traditional
262
120
OrganizedTrade
Traditional
Brazil
Argentina Mexico
A value pr oposition based on high
frequency purchases implies l ower ticket
sizes than organized trade...
A value pr oposition based on high
frequency purchases implies l ower ticket
sizes than organized trade. ..
…and results i n lower monthl y
sales/m2
…and results i n lower monthl y
sales/m2
(1) Brazil organized trade ticket size based on CBD, C hile on DYS, Mexico, Argentina and Colombi a based on aver age large pl ayersSource: Field interviews (small retailers); INDEC, Antad M exico, and AC Nielsen ( organized trade)
Monthly Sales / m2 - U$S Organized vs. Small Retailers
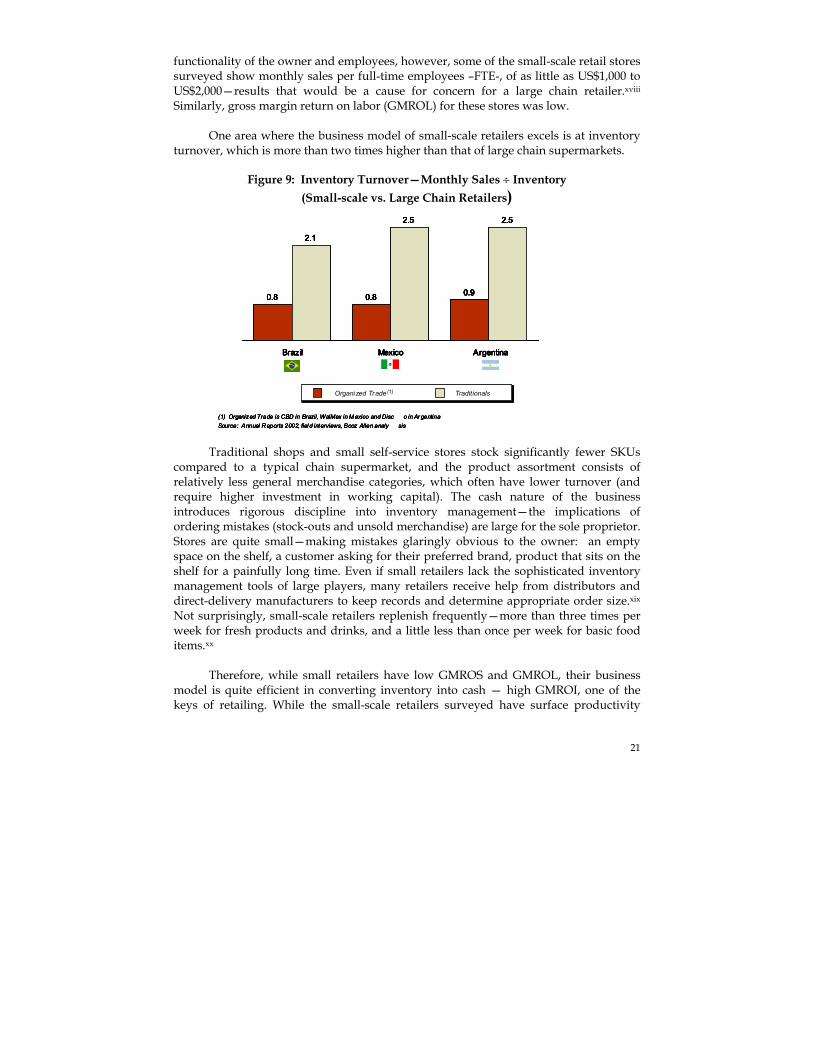
21
functionality of the owner and employees, however, some of the small-scale retail stores surveyed show monthly sales per full-time employees –FTE-, of as little as US$1,000 to US$2,000—results that would be a cause for concern for a large chain retailer.xviii Similarly, gross margin return on labor (GMROL) for these stores was low. One area where the business model of small-scale retailers excels is at inventory turnover, which is more than two times higher than that of large chain supermarkets.
Figure 9: Inventory Turnover—Monthly Sales ÷ Inventory (Small-scale vs. Large Chain Retailers)
Traditional shops and small self-service stores stock significantly fewer SKUs
compared to a typical chain supermarket, and the product assortment consists of relatively less general merchandise categories, which often have lower turnover (and require higher investment in working capital). The cash nature of the business introduces rigorous discipline into inventory management—the implications of ordering mistakes (stock-outs and unsold merchandise) are large for the sole proprietor. Stores are quite small—making mistakes glaringly obvious to the owner: an empty space on the shelf, a customer asking for their preferred brand, product that sits on the shelf for a painfully long time. Even if small retailers lack the sophisticated inventory management tools of large players, many retailers receive help from distributors and direct-delivery manufacturers to keep records and determine appropriate order size.xix Not surprisingly, small-scale retailers replenish frequently—more than three times per week for fresh products and drinks, and a little less than once per week for basic food items.xx Therefore, while small retailers have low GMROS and GMROL, their business model is quite efficient in converting inventory into cash — high GMROI, one of the keys of retailing. While the small-scale retailers surveyed have surface productivity
0.8 0.8 0.9
2.1
2.5 2.5
Brazil Mexico Argentina
(1) Organized Trade is CBD in Brazil, WalMex in M exico and Disc o in Ar gentinaSource: Annual R eports 2002, fiel d interviews, Booz Allen analy sis
Organized Trade(1) Traditionals
0.8 0.8 0.9
2.1
2.5 2.5
Brazil Mexico Argentina
(1) Organized Trade is CBD in Brazil, WalMex in M exico and Disc o in Ar gentinaSource: Annual R eports 2002, fiel d interviews, Booz Allen analy sis
Organized Trade(1) TraditionalsOrganized Trade(1) Traditionals
0.8 0.8 0.9
2.1
2.5 2.5
Brazil Mexico Argentina
0.8 0.8 0.9
2.1
2.5 2.5
Brazil Mexico Argentina
(1) Organized Trade is CBD in Brazil, WalMex in M exico and Disc o in Ar gentinaSource: Annual R eports 2002, fiel d interviews, Booz Allen analy sis
Organized Trade(1) TraditionalsOrganized Trade(1) TraditionalsOrganized Trade(1) TraditionalsOrganized Trade(1) Traditionals

22
(GMROS) that is only 25% to 30% that of large players, their return on inventory (GMROI) is double or triple the figure of large chain retailers.
Figure 10: Strategic Resource Model Ratios (Small-Scale vs. Large Scale Retailers)
Yet to really understand why small retailers have a sustainable business model, it
is necessary to dive deeper into their bottom line. A look at net operating profit holds some valuable lessons.
Going beyond gross margin, small retailers have reduced or non-existing operating costs that can be quite significant for a large chain supermarket retailer. Labor costs are generally lower and more variable than for the organized trade—most employees are family members who may receive lower pay since “non-cash” compensation may be the bulk or all of remuneration (for example, when a son or daughter lives at home). Leveraging on family members allows the small retailer greater flexibility to adapt hours worked to fluctuations in store traffic—and does make evasion of labor/social taxes easier since there is little threat of the employee filing a grievance or claim. Another benefit to having family members as employees is that it can lead to lower shrinkage from theft. Additionally, the small retailer has the ability to defer cash salaries in the event of a liquidity crisis. Small retailers also save on many general expenses items that can account from anywhere between 3.5% and 10% of sales for the large chain retailer. For example, security and cleaning services (often outsourced by chain retailers to a third party), maintenance, advertising & marketing expenditures, and corporate overhead are largely absent in the small-scale retail sector—owner/operators or store employees
Organized Trade (1) Traditionals
64.0
79.0 79.0
16.024.0 21.0
Brazil Mexico Argentina
1,078
1,8411,980
242 336 281
Brazil Mexico Argentina
22%17%
29%
59%
50%57%
Brazil Mexico Argentina
GMROSMonthly Gross Margin / m2
GMROLMonthly Gross Margin / FTEs
GMROIMonthly Gross Margin / Inventory
=
xxNet sales Inventor y
Net sales Inventor y
Net sales Selling feetNet sales Selling feet
Net sales Empl oyeesNet sales Empl oyees
Gross marginNet sales
Gross marginNet sales
x
= =
(1) Organized Trade is CBD in Brazil, WalMex in M exico and Disco in Ar gentinaSource: 2002 Annual R eports , fi eld interviews, Booz Allen analysis
Organized Trade (1) TraditionalsOrganized Trade (1) Traditionals
64.0
79.0 79.0
16.024.0 21.0
Brazil Mexico Argentina
1,078
1,8411,980
242 336 281
Brazil Mexico Argentina
22%17%
29%
59%
50%57%
Brazil Mexico Argentina
GMROSMonthly Gross Margin / m2
GMROLMonthly Gross Margin / FTEs
GMROIMonthly Gross Margin / Inventory
=
xxNet sales Inventor y
Net sales Inventor y
Net sales Selling feetNet sales Selling feet
Net sales Empl oyeesNet sales Empl oyees
Gross marginNet sales
Gross marginNet sales
x
= ==
xNet sales Inventor y
Net sales Inventor yNet sales Inventor y
Net sales Inventor y
Net sales Selling feetNet sales Selling feetNet sales Selling feetNet sales Selling feet
Net sales Empl oyeesNet sales Empl oyeesNet sales Empl oyeesNet sales Empl oyees
Gross marginNet sales
Gross marginNet sales
Gross marginNet sales
Gross marginNet sales
x
= =
(1) Organized Trade is CBD in Brazil, WalMex in M exico and Disco in Ar gentinaSource: 2002 Annual R eports , fi eld interviews, Booz Allen analysis
Organized Trade (1) TraditionalsOrganized Trade (1) Traditionals
64.0
79.0 79.0
16.024.0 21.0
Brazil Mexico Argentina
64.0
79.0 79.0
16.024.0 21.0
Brazil Mexico Argentina
1,078
1,8411,980
242 336 281
Brazil Mexico Argentina
1,078
1,8411,980
242 336 281
Brazil Mexico Argentina
22%17%
29%
59%
50%57%
Brazil Mexico Argentina
22%17%
29%
59%
50%57%
Brazil Mexico Argentina
GMROSMonthly Gross Margin / m2
GMROLMonthly Gross Margin / FTEs
GMROIMonthly Gross Margin / Inventory
=
xxNet sales Inventor y
Net sales Inventor y
Net sales Selling feetNet sales Selling feet
Net sales Empl oyeesNet sales Empl oyees
Gross marginNet sales
Gross marginNet sales
x
= ==
xxNet sales Inventor y
Net sales Inventor yNet sales Inventor y
Net sales Inventor y
Net sales Selling feetNet sales Selling feetNet sales Selling feetNet sales Selling feet
Net sales Empl oyeesNet sales Empl oyeesNet sales Empl oyeesNet sales Empl oyees
Gross marginNet sales
Gross marginNet sales
Gross marginNet sales
Gross marginNet sales
x
= =
(1) Organized Trade is CBD in Brazil, WalMex in M exico and Disco in Ar gentinaSource: 2002 Annual R eports , fi eld interviews, Booz Allen analysis
Organized Trade (1) TraditionalsOrganized Trade (1) Traditionals
64.0
79.0 79.0
16.024.0 21.0
Brazil Mexico Argentina
64.0
79.0 79.0
16.024.0 21.0
Brazil Mexico Argentina
1,078
1,8411,980
242 336 281
Brazil Mexico Argentina
1,078
1,8411,980
242 336 281
Brazil Mexico Argentina
22%17%
29%
59%
50%57%
Brazil Mexico Argentina
22%17%
29%
59%
50%57%
Brazil Mexico Argentina
GMROSMonthly Gross Margin / m2
GMROLMonthly Gross Margin / FTEs
GMROIMonthly Gross Margin / Inventory
=
xxNet sales Inventor y
Net sales Inventor yNet sales Inventor y
Net sales Inventor y
Net sales Selling feetNet sales Selling feetNet sales Selling feetNet sales Selling feet
Net sales Empl oyeesNet sales Empl oyeesNet sales Empl oyeesNet sales Empl oyees
Gross marginNet sales
Gross marginNet sales
Gross marginNet sales
Gross marginNet sales
x
= ==
xNet sales Inventor y
Net sales Inventor yNet sales Inventor y
Net sales Inventor y
Net sales Selling feetNet sales Selling feetNet sales Selling feetNet sales Selling feet
Net sales Empl oyeesNet sales Empl oyeesNet sales Empl oyeesNet sales Empl oyees
Gross marginNet sales
Gross marginNet sales
Gross marginNet sales
Gross marginNet sales
x
= =
(1) Organized Trade is CBD in Brazil, WalMex in M exico and Disco in Ar gentinaSource: 2002 Annual R eports , fi eld interviews, Booz Allen analysis
Gross marginNet sales
Gross marginNet sales
Gross marginNet sales
Gross marginNet sales
x
= =
(1) Organized Trade is CBD in Brazil, WalMex in M exico and Disco in Ar gentinaSource: 2002 Annual R eports , fi eld interviews, Booz Allen analysis
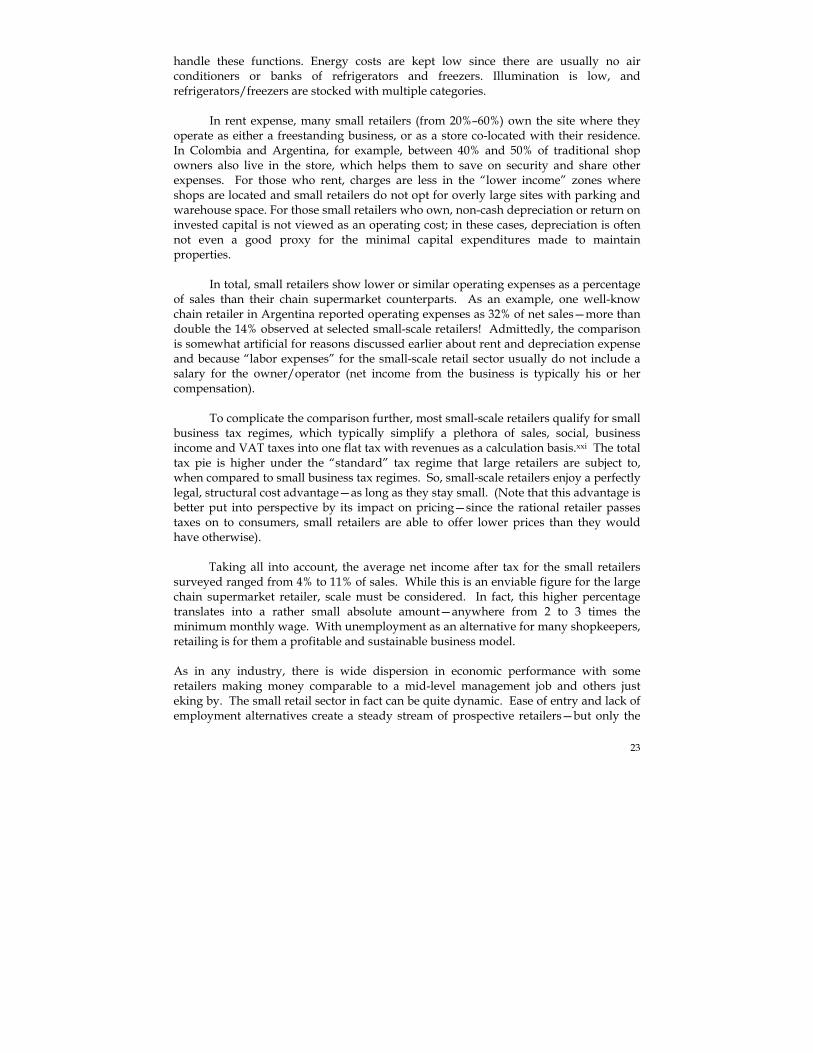
23
handle these functions. Energy costs are kept low since there are usually no air conditioners or banks of refrigerators and freezers. Illumination is low, and refrigerators/freezers are stocked with multiple categories.
In rent expense, many small retailers (from 20%–60%) own the site where they operate as either a freestanding business, or as a store co-located with their residence. In Colombia and Argentina, for example, between 40% and 50% of traditional shop owners also live in the store, which helps them to save on security and share other expenses. For those who rent, charges are less in the “lower income” zones where shops are located and small retailers do not opt for overly large sites with parking and warehouse space. For those small retailers who own, non-cash depreciation or return on invested capital is not viewed as an operating cost; in these cases, depreciation is often not even a good proxy for the minimal capital expenditures made to maintain properties.
In total, small retailers show lower or similar operating expenses as a percentage
of sales than their chain supermarket counterparts. As an example, one well-know chain retailer in Argentina reported operating expenses as 32% of net sales—more than double the 14% observed at selected small-scale retailers! Admittedly, the comparison is somewhat artificial for reasons discussed earlier about rent and depreciation expense and because “labor expenses” for the small-scale retail sector usually do not include a salary for the owner/operator (net income from the business is typically his or her compensation).
To complicate the comparison further, most small-scale retailers qualify for small
business tax regimes, which typically simplify a plethora of sales, social, business income and VAT taxes into one flat tax with revenues as a calculation basis.xxi The total tax pie is higher under the “standard” tax regime that large retailers are subject to, when compared to small business tax regimes. So, small-scale retailers enjoy a perfectly legal, structural cost advantage—as long as they stay small. (Note that this advantage is better put into perspective by its impact on pricing—since the rational retailer passes taxes on to consumers, small retailers are able to offer lower prices than they would have otherwise). Taking all into account, the average net income after tax for the small retailers surveyed ranged from 4% to 11% of sales. While this is an enviable figure for the large chain supermarket retailer, scale must be considered. In fact, this higher percentage translates into a rather small absolute amount—anywhere from 2 to 3 times the minimum monthly wage. With unemployment as an alternative for many shopkeepers, retailing is for them a profitable and sustainable business model. As in any industry, there is wide dispersion in economic performance with some retailers making money comparable to a mid-level management job and others just eking by. The small retail sector in fact can be quite dynamic. Ease of entry and lack of employment alternatives create a steady stream of prospective retailers—but only the
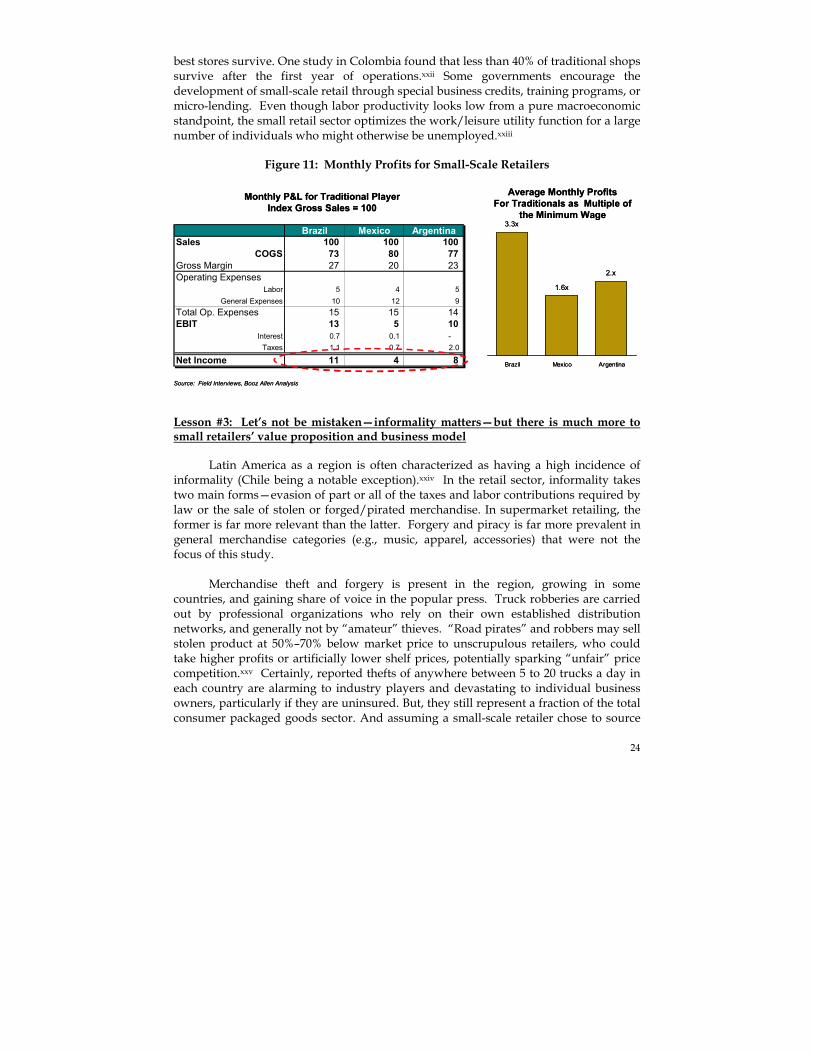
24
best stores survive. One study in Colombia found that less than 40% of traditional shops survive after the first year of operations.xxii Some governments encourage the development of small-scale retail through special business credits, training programs, or micro-lending. Even though labor productivity looks low from a pure macroeconomic standpoint, the small retail sector optimizes the work/leisure utility function for a large number of individuals who might otherwise be unemployed.xxiii
Figure 11: Monthly Profits for Small-Scale Retailers
Monthly P&L for Traditional Player
Index Gross Sales = 100
Brazil Mexico ArgentinaSales 100 100 100
COGS 73 80 77 Gross Margin 27 20 23 Operating Expenses
Labor 5 4 5 General Expenses 10 12 9
Total Op. Expenses 15 15 14 EBIT 13 5 10
Interest 0.7 0.1 - Taxes 1.1 0.7 2.0
Net Income 11 4 8
3.3x
1.6x
2.x
Brazil Mexico Argentina
Average Monthly Profits For Traditionals as Multiple of
the Minimum Wage
Source: Field Interviews, Booz Allen Analysis
Monthly P&L for Traditional PlayerIndex Gross Sales = 100
Brazil Mexico ArgentinaSales 100 100 100
COGS 73 80 77 Gross Margin 27 20 23 Operating Expenses
Labor 5 4 5 General Expenses 10 12 9
Total Op. Expenses 15 15 14 EBIT 13 5 10
Interest 0.7 0.1 - Taxes 1.1 0.7 2.0
Net Income 11 4 8
3.3x
1.6x
2.x
Brazil Mexico Argentina
Average Monthly Profits For Traditionals as Multiple of
the Minimum Wage
Source: Field Interviews, Booz Allen Analysis
Lesson #3: Let’s not be mistaken—informality matters—but there is much more to small retailers’ value proposition and business model Latin America as a region is often characterized as having a high incidence of informality (Chile being a notable exception).xxiv In the retail sector, informality takes two main forms—evasion of part or all of the taxes and labor contributions required by law or the sale of stolen or forged/pirated merchandise. In supermarket retailing, the former is far more relevant than the latter. Forgery and piracy is far more prevalent in general merchandise categories (e.g., music, apparel, accessories) that were not the focus of this study. Merchandise theft and forgery is present in the region, growing in some countries, and gaining share of voice in the popular press. Truck robberies are carried out by professional organizations who rely on their own established distribution networks, and generally not by “amateur” thieves. “Road pirates” and robbers may sell stolen product at 50%–70% below market price to unscrupulous retailers, who could take higher profits or artificially lower shelf prices, potentially sparking “unfair” price competition.xxv Certainly, reported thefts of anywhere between 5 to 20 trucks a day in each country are alarming to industry players and devastating to individual business owners, particularly if they are uninsured. But, they still represent a fraction of the total consumer packaged goods sector. And assuming a small-scale retailer chose to source

25
10% stolen merchandise at 60% of market price, the net impact would provide roughly a 3% discount to shelf prices that are already comparatively high. Hence, while present and important, theft and forgery cannot be said to significantly explain the dynamics of small-scale retailing. Regarding evasion, there are many creative means by which “informal” players reduce the VAT, sales, and business income tax burden. Informal players may understate revenues to take advantage of small business tax regimes, purchase from suppliers or sell to customers without invoices and tickets, generate mirror invoices (separate documents for tax and shipping purposes), re-use invoices, or sell with “half invoices” that list only a fraction of the volume delivered (prices are lower for “off-invoice” sales, and payment is usually made to a bank account that is not associated with the business). With labor taxes, employers can neglect to register all or some employees in an attempt to avoid paying social contributions and labor benefits like the “13th salary” that is standard practice in many Latin American countries. Registering employees but with artificially low salaries also generates less taxes since official salary is usually the calculation basis for these contributions and benefits. In these cases, employers may or may not pay additional monies on the side to placate employees—e.g. “commissions.”—and lower the probability of retribution.
Informality is present—and its relevance cannot be denied. Besides, the economic benefits of tax evasion can be significantly increased when “informal” practices are present along the whole value chain. Informality is probably more characteristic of categories like fresh produce and for “value brands” in general, where the selling practices of manufacturers can lend themselves to informality. Potential tax evasion could reach upwards of 20% of sales for completely informal value chains by one estimate.xxvi
Yet, complete evasion of these taxes by small-scale retailers is unlikely even in countries with higher prevalence of “informality.” For one, large companies and multi-national manufacturers—who sell formally—still supply the majority of consumer products in Latin America. When these companies sell through intermediaries, tax compliance tends to “travel” along the value chain since middlemen have strong incentives to also sell formally and recover VAT credits. Moreover, many of these companies are actively trying to sell direct to small retailers (e.g., candy, cookies, salty snacks, packaged breads, ice cream, soft drinks, and beer to name a few categories), introducing tax formality to a large portion of small retailers’ sales.
Once retailers purchase formally, it is more difficult for them to evade VAT, sales, and business income taxes—if they do not declare revenues they would have to justify why purchases exceed sales in the event of an inquiry. Second, in some countries, government agencies are improving capabilities and small retailers perceive a higher probability of being caught. Chile implemented an extensive information matching system that allows the collections agency to discover tax evaders with greater precision; in Brazil, the tax authorities are linking sales tax and financial operations information,
26
making it easier to identify inconsistencies. In most countries, cash registers with recording devices are being introduced (although some business owners have responded by “closing” the register early and tendering sales out of an open cash drawer).
Lastly, labor litigation risks introduce some self-policing with respect to labor
contributions. Recall that most small-scale retailers need few employees to operate their stores to begin with. Even for those retailers that require a small amount of staff and choose not to comply with the law, there is risk of a judicial process or claim. In most countries, labor law infractions are dealt with severely, and fines or litigation costs are high. To add to the risk, in some countries like Brazil, there is essentially no statute of limitations since employees can file a claim as much as 30 years after the alleged infraction.
We looked at the stated tax payments of the small-scale retailers’ surveyed and made two adjustments –simulating increased labor costs to include higher contributions and benefits, and applying the statutory rate under small business tax regimes. This presumes some degree of informality—not necessarily a correct assumption or fair judgment, given that effective and statutory tax rates may differ for perfectly legal reasons. If the difference between stated and statutory tax payments were evasion and full taxes were paid instead, then the retailers surveyed would need to increase prices by anywhere from 2%-8% above existing levels to recover the increased labor and tax expenses.xxvii For those “informal players” unable to raise prices (for example, because they were located close to a large chain retailer with a scale advantage), lower margins or business failure could be the result. Yet even with these “full taxes” simulated net income was still close to or slightly above one minimum salary—so informal players would not necessarily exit the retail business. Therefore, “informality” in Latin America is not the main driver of small-scale retailers’ continued presence: while it certainly impacts some players’ bottom line or their ability to price in the marketplace, the real strength of the small-scale retail trade rests in a strong value proposition to emerging consumers and a business model that centers on quick conversion of inventory into cash. Those who seek to capture emerging consumers as customers would be wise to avoid falling into the “informality trap,”—believing that over reliance on informal business practices is a necessary component of success for profitably serving low income consumers. EMERGING CONSUMER: OPPORTUNITIES AND CHALLENGES Emerging consumer segments in Latin America are a significant business opportunity but the current retailers’ business model may need adjustments or even realignment in order to properly address these segments’ needs.
27
Latin America designates a “region,” but presents striking socio-economic differences. Common measures of economic success such as GDP per capita differ significantly between countries, and these differences can range drastically even within each country of the region. Take the example of Brazil, where average GDP per capita is relatively high for the region at US$3,5381 per person. Within Brazil, this figure is US$4,796 in the more prosperous Southeast while GDP per capita in the Northeast states reaches only US$1,647—in line with the average for countries like Thailand, Egypt and Namibia. Historically, the region comprises countries with highly “unequal” income distribution—where a small percentage of the population holds a disproportionately large share of assets or purchasing power, but when analyzing consumer product markets, a different picture shows their relevance for marketers.
Given that in many countries growth has not translated equally into benefits for all members of the population, highly dualistic social structures still pervade the region. At the time this research was conducted, prospects for most Latin American economies were for zero to low single digit growth (in crisis economies, this growth was projected over a greatly reduced base). The outlook for GDP growth in the two economic engines of the region, Mexico and Brazil, was for less than 3% while populations continue to rise. In other words, current social structures are unlikely to change in the near term, making emerging consumer segments even more important to retailers and manufacturers of fast moving consumer goods.
Emerging consumers in Latin America represent roughly 50%–60% of the population and approximately 30%–40% of the purchasing power. Overall, “lower income” segments are increasing as economic conditions worsen. Furthermore, this segment in aggregate spends a significant amount on food, beverage, personal care, and cleaning products; individually, low-income households spend a much higher percentage of income on consumer goods. Despite significant barriers, these consumers are still drawn to large supermarkets, creating a potential opportunity for large-scale retailers to better serve these groups as customers.
However, the needs of this group are largely served by small-scale retailers—and
quite well at that. In comparison, large supermarket chains fall short in key areas in the minds of these consumers.
Often they are perceived of as “stocking” places or as too “tempting”—and the
product assortment is increasingly at odds with consumers’ economic situation: large sizes, large ticket items, promotions that lead to buying “too much”. Relatively longer distances are required to travel to them, which requires investing time and money in transportation. Quality is perceived to be low in perishable categories, and shelf prices are seen as high (even though the perception is not in line with reality in most cases). Further, emerging consumers report “cold” treatment by staff or other customers while shopping in large chain stores—when in fact they value personal relationships and emotional proximity when shopping.

28
Figure 12: Consumption and Socio-Economic Strata in Latin America (% Population; % Purchasing Power; % Consumption of basic food products)
In addition, while the opportunity is large, the shopping habits of emerging
consumers imply challenging economics for retailers. This group’s shopping behavior is characterized by small ticket sizes, comprised of lower-margin items; exercise of self-restraint and low purchase conversion; and focus on traffic building promotions which could mean low return on investment for promotional spending. Therefore, simply extending the current value proposition and formats of large chains to address physical proximity issues is likely to affect financial performance negatively. For one thing, retailers are likely to experience lower gross margins and higher costs. To add to that, investments in building or supplementing the store network to increase coverage might earn inadequate or even negative returns. At the same time, altering the current value proposition may alienate the existing customer base. Several options are available for retailers in this regard.
% Population
65.2%
22.4%
1.5%
10.9%B
C
D/E
A
Mexico% Buying Power
19.6%
28.0%
33.8%
18.7%
% Buying Power Set Aside for Consumer
Products
32%
31,4%
25.8%
11.3%
A/B/C1,2
C3
D/E
~20%
~30%
~50%
% Population
Argentina (1)
~18%
~29%
~53%
% Buying Power
62.7%
25.8%
11.5%
% Buying PowerSet Aside for Consumer Products
41.8%
49.9%
2.1%
6.2%
% Population
B
C
D/E
A
Chile
42.8%
23.3%
21.1%
12.8%
% Buying Power
% Buying PowerSet Aside for
Consumer Products
21.1%
48.4%
17.6%
12.9%
% Population
50.3%
36.2%
12%
1.6%
B
C
D/E
A
Costa Rica% Buying Power
36.6%
34.5%
11.9%
17.0%
% Buying PowerSet Aside for
Consumer Products
25.3%
40.3%
25.3%
7.1%
52.5%
28.9%
16%
2.6%
% Population
B
C
D/E
A
Brazil
24.9%
34.4%
29.4%
11.3%
% Buying Power
% Buying PowerSet Aside for Consumer Products (2)
31%
28.6%
19.8%
20.5%
% Population
52.9%
37.2%
2.2%
7.7%B
C
D/E
A
Colombia% Buying Power
33.0%
33.6%
24.0%
12.8%
% Buying PowerSet Aside for
Consumer Products
20.1%
38.1%
26.2%
14.8%
Note: (1) % of household income; A/B/C1 & C2 percentages reported together for 11/2002(2) % Buying power set aside for Consumer Products: Amount of the buying power addressed to Consumer Product
Source: Strategy Research Corporation; UN Demographic yearbook, UNCESCO statistical yearbook; CCR Latin Panel; Sigma
% Population
65.2%
22.4%
1.5%
10.9%B
C
D/E
A
Mexico% Buying Power
19.6%
28.0%
33.8%
18.7%
% Buying Power Set Aside for Consumer
Products
32%
31,4%
25.8%
11.3%
% Population
65.2%
22.4%
1.5%
10.9%B
C
D/E
A
Mexico% Buying Power
19.6%
28.0%
33.8%
18.7%
% Buying Power Set Aside for Consumer
Products
32%
31,4%
25.8%
11.3%
A/B/C1,2
C3
D/E
~20%
~30%
~50%
% Population
Argentina (1)
~18%
~29%
~53%
% Buying Power
62.7%
25.8%
11.5%
% Buying PowerSet Aside for Consumer Products
A/B/C1,2
C3
D/E
~20%
~30%
~50%
% Population
Argentina (1)
~18%
~29%
~53%
% Buying Power
62.7%
25.8%
11.5%
% Buying PowerSet Aside for Consumer Products
41.8%
49.9%
2.1%
6.2%
% Population
B
C
D/E
A
Chile
42.8%
23.3%
21.1%
12.8%
% Buying Power
% Buying PowerSet Aside for
Consumer Products
21.1%
48.4%
17.6%
12.9%
41.8%
49.9%
2.1%
6.2%
% Population
B
C
D/E
A
Chile
42.8%
23.3%
21.1%
12.8%
% Buying Power
% Buying PowerSet Aside for
Consumer Products
21.1%
48.4%
17.6%
12.9%
% Population
50.3%
36.2%
12%
1.6%
B
C
D/E
A
Costa Rica% Buying Power
36.6%
34.5%
11.9%
17.0%
% Buying PowerSet Aside for
Consumer Products
25.3%
40.3%
25.3%
7.1%
% Population
50.3%
36.2%
12%
1.6%
B
C
D/E
A
Costa Rica% Buying Power
36.6%
34.5%
11.9%
17.0%
% Buying PowerSet Aside for
Consumer Products
25.3%
40.3%
25.3%
7.1%
52.5%
28.9%
16%
2.6%
% Population
B
C
D/E
A
Brazil
24.9%
34.4%
29.4%
11.3%
% Buying Power
% Buying PowerSet Aside for Consumer Products (2)
31%
28.6%
19.8%
20.5%52.5%
28.9%
16%
2.6%
% Population
B
C
D/E
A
Brazil
24.9%
34.4%
29.4%
11.3%
% Buying Power
% Buying PowerSet Aside for Consumer Products (2)
31%
28.6%
19.8%
20.5%
% Population
52.9%
37.2%
2.2%
7.7%B
C
D/E
A
Colombia% Buying Power
33.0%
33.6%
24.0%
12.8%
% Buying PowerSet Aside for
Consumer Products
20.1%
38.1%
26.2%
14.8%
% Population
52.9%
37.2%
2.2%
7.7%B
C
D/E
A
Colombia% Buying Power
33.0%
33.6%
24.0%
12.8%
% Buying PowerSet Aside for
Consumer Products
20.1%
38.1%
26.2%
14.8%
Note: (1) % of household income; A/B/C1 & C2 percentages reported together for 11/2002(2) % Buying power set aside for Consumer Products: Amount of the buying power addressed to Consumer Product
Source: Strategy Research Corporation; UN Demographic yearbook, UNCESCO statistical yearbook; CCR Latin Panel; Sigma

29
Retailers who don’t want to wait for the theoretical and long term “trickle down” effects of rising overall incomes have several business options to consider. These options imply resolving several relevant issues. Selecting sub-segments of emerging consumers and geographic areas, developing a distinct value proposition supported by a sustainable business model. Finally, the new skills should leverage and show synergies with the current business.
Although there are several important issues to resolve, retailers may find it worthwhile to think through their potential response to the emerging consumer opportunity—in advance of channel necessities to do so.
30
ABOUT THE AUTHORS The Coca-Cola Retailing Research Council – Latin America (CCRRC - LA) is dedicated to developing a better understanding of the food retailing and allied merchandise distribution business in Latin America. It concentrates in identifying and then studying selected relevant issues, presenting its findings to the manufacturing and retailing communities, in order to assist in the development and enhancement of the food retailing business in the region.
• Members
Ana Maria Diniz Grupo Pao de Acucar Brazil Jonathan Berger CIES USA
Roberto Britto Bompreco Brazil Howard Butt III HEB Mexico Antonio Coto Gutierrez Dia Internacional Argentina Eduardo Castro Wright Wal*Mart Mexico Paulo Goelzer IGA, Inc. Brazil Tim Hammonds FMI USA Nicolas Ibañez D&S Chile Angel Losada Moreno Gigante Mexico Sergio Maia Sonae Distribucao Brazil Gonzalo Restrepo Éxito Colombia
• Director of Research Guillermo D’Andrea, IAE, Universidad Austral, Argentina
• Booz Allen Hamilton is a global management and technology consulting firm serving the world's leading industrial, service and governmental organizations. The project’s team was formed by the following consultants.
• José Gregorio Baquero • Jorge Héctor Forteza • Francis Liu • Alonso Martinez • E. Alejandro Stengel • Carlos Navarro • Anne Goebel-Krstelj • Alejandro Frenkel
31
References and Footnotes i Progressive Grocer ii Standard & Poors iii INDEC and Industry Chambers iv Two separate studies by AC Nielsen and ANTAD suggest that average tickets for emerging segments may reach up to 50% of what middle class and higher income consumers spend in supermarkets. It should be noted that the reported average ticket sizes by SES do not take into account frequency of shopping and that emerging consumers shop much less frequently in large supermarkets. v According to Napoleon Franco & Cia., Colombia is one exception for televisions, stoves, and radios—with penetration lower at 65%–85%. vi Overall, very few of the focus group participants stated they shopped at Hard Discount supermarkets (especially in Mexico and Colombia, where almost all participants claimed they “never shopped” at discount supermarkets—in Argentina, shopping incidences were the highest observed for this format). It should be noted that sample size is not sufficient to make a quantitative assessment and that many consumers interviewed may not happen to live or work near these stores. That said, issues with this format were expressed in each country, indicating that there is some dissatisfaction with this store format for at least a subset of emerging consumers. vii Undoubtedly, relatively low penetration of freezers and microwave ovens in emerging segments drive low penetration of ready-to-eat meals and frozen foods—in part. Many of the group participants enjoy preparing meals from “scratch” as an extension of caring for the family and it is not clear that they would “panty load” frozen meal components (e.g., chicken, meat, vegetables) even if they owned freezers and enjoyed incomes that permitted stocking. viii In many categories, emerging consumers are more loyal to “brands” in general than to a single, preferred name. The consumer will have a relatively small set of brands that are considered acceptable substitutes, and switching does occur within this set. In many cases, this switching is driven by promotional price points. ix Consumption Values and Market Choices, Theory and Applications. Sheth, Newman and Gross, South-Western Publishing Co. 1991 x Most discussion group participants did not consider public buses and subways to be a viable means of transport for bringing purchases back home when heavy or numerous packages/bundles were involved; instead, consumers tended to reference the price of a pirate taxi ride, “collective” or shared van/taxi service when referring to the transport expenses they were factored into the ” total purchase cost.” xi Based on average ticket sizes as noted from the store checks/interviews with small-scale retailers. xii Car ownership and wages undoubtedly impact a consumer’s definition of what is considered an “acceptable” distance. However, out-of-pocket transportation costs are probably more salient for emerging social strata (absent a dramatic increase in income). xiii In large chain stores, treatment was usually described as “professional” when seen in a positive light, but not “personal” or “caring”—words that were used to positively describe small-scale retailers. xiv One potential explanation for higher shelf prices in Argentine chain supermarkets and hypermarkets is that large retailers are raising markups while small retailers are selling at or just above final delivered cost of product to weather the economic crisis. Additionally, large self-service wholesalers are growing in importance in the area where retail surveys were conducted—which may lead to sharing of purchasing scale benefits with small retailers. xv Popai Brasil xvi Figures in local currency converted to US$ with February 2003 exchange rates xvii Gross Margins for large supermarkets vary considerably by individual retailer, geographic location, and format (e.g., Hard Discount, Supercenter/Hypermarket, high-end specialty grocery). For a small sample of chain retailers, we observed gross margins for large chain retailers of 20% to 32% of Net Sales (per financial statements available during 1Q’03). xviii Recognizing again the small size of our sample for large chain retailers and the variety of formats, Monthly sales per FTE for the large players ranged from approximately US$4,000 to $9,000.

32
xix Distributors and direct-delivery manufacturers do not literally keep records for small-scale retailers, but their tracking of historical purchases and/or purchase quantity suggestions are a good proxy for more formal practices. xx Note that surveys were conducted in major metropolitan markets, where there is relatively high concentration of retail outlets per square kilometer and multiple distributors. Both of these factors facilitate small retailers’ frequent replenishment. xxi All of the countries in this study levy VAT taxes, and large-scale retailers’ reported figures naturally exclude this tax as an income statement expense since it is ultimately passed on to consumers. VAT debits and credits do appear in balance sheet accounts—e.g., as tax related receivables and payables. Care must therefore be taken when comparing tax expenses in the published income statements of chain retailers (exclude VAT) with small-scale retailers’ tax expenses (a flat tax which in many cases ‘includes’ VAT). Adjusting for this, the total tax pie (with VAT) is higher under the “standard” tax regime that large retailers face, when compared to small business tax regimes. xxii Put source for Colombia small retailer failure rate here xxiii Studies that criticize low labor productivity in the Latin American small retail/business sector usually cite low revenue per employee numbers. Anecdotal evidence put forward usually describes how workers sit idle for parts of the day, or work only part-time—as is the case for street markets, which in many countries close down by mid-afternoon. xxiv According to The Global Competitiveness Report for 2001–2002, Chile’s level of tax evasion and “informality” is at or close to par with countries like the U.K., Canada, and the U.S. The other countries in this study had ratings for level of evasion and informality that were approximately double that of Chile. xxv Estimate based on interviews with small distributors xxvi Assumes 18% VAT tax and 3% sales tax; actual numbers vary by country. xxvii Recall that tax informality is likely to differ by value chain—for example with little to no informality for leading brands sold direct from manufacturers.