crack width and load-carrying capacity of rc elements...
TRANSCRIPT
Research ArticleCrack Width and Load-Carrying Capacity of RC ElementsStrengthened with FRP
Justas Slaitas , Mykolas Daugevičius, Juozas Valivonis, and Tatjana Grigorjeva
Department of Reinforced Concrete Structures and Geotechnics, Vilnius Gediminas Technical University,LT-10223 Vilnius, Lithuania
Correspondence should be addressed to Justas Slaitas; [email protected]
Received 7 March 2018; Revised 16 May 2018; Accepted 7 June 2018; Published 11 July 2018
Academic Editor: Young Hoon Kim
Copyright © 2018 Justas Slaitas et al. This is an open access article distributed under the Creative Commons Attribution License,which permits unrestricted use, distribution, and reproduction in any medium, provided the original work is properly cited.
The present study focuses on a prediction of crack width and load-carrying capacity of flexural reinforced concrete (RC) elementsstrengthened with fibre-reinforced polymer (FRP) reinforcements. Most studies on cracking phenomena of FRP-strengthened RCstructures are directed to empirical corrections of crack-spacing formula given by design norms. Contrary to the design norms, acrack model presented in this paper is based on fracture mechanics of solids and is applied for direct calculation of flexural crackparameters. At the ultimate stage of crack propagation, the load-carrying capacity of the element is achieved; therefore, it isassumed that the load-carrying capacity can be estimated according to the ultimate crack depth (directly measuring concrete’scompressive zone height). An experimental program is presented to verify the accuracy of the proposed model, taking intoaccount anchorage and initial strain effects. The proposed analytical crack model can be used for more precise predictions offlexural crack propagation and load-carrying capacity.
1. Introduction
Retrofitting of existing structures is one of the main chal-lenges for civil engineers today. One of the most advanta-geous material types for strengthening is fibre-reinforcedpolymers (FRP) due to their corrosion resistance and highstrength to low weight ratio [1–5]. Anticorrosion propertiesare particularly relevant in aggressive environments, forexample, bridge structures [6]. Strength properties could beused even more efficiently and economically by prestressingthe FRP material [7, 8]. However, the effectiveness ofstrengthening can be compromised by loss of compositeaction, which can be delayed by using the additional anchor-age [9]. There is a large quantity of researches made onthe behaviour of the joint of concrete and FRP material[10–14], and the bond stiffness-reduction techniques areproposed [15–17], but none of the researches analysed bythe authors was applied for prediction of concrete crackpropagation. In accordance with design provisions [18, 19],the cracks in concrete open when a limiting tensile strain of
concrete is reached; therefore, the crack width can be calcu-lated by multiplying the mean values of a difference betweentensile reinforcement and concrete strains with crack spac-ing. The researchers working on cracking phenomena ofFRP-strengthened structures are trying to correct the empir-ical formulas to calculate crack spacing given by the designnorms [20–22]. A different approach is proposed in thispaper, that is, a crack model for direct calculation of flexuralcrack parameters which neglect the crack spacing. At the ulti-mate stage of crack propagation, the load-carrying capacityof the element is achieved. Therefore, it is assumed that theload-carrying capacity can be estimated according to ulti-mate crack depth (directly measuring concrete’s compressivezone height). The experimental program is presented to ver-ify the accuracy of proposed crack propagation model, takinginto account anchorage and initial strain effects. An extendeddatabase is used for comparison of numerical and experi-mental results of crack width under service load and load-carrying capacity of the element. In total, 98 RC beams,strengthened with externally bonded (EBR) and near
HindawiInternational Journal of Polymer ScienceVolume 2018, Article ID 6274287, 14 pageshttps://doi.org/10.1155/2018/6274287

surface-mounted (NSM) carbon fibre-reinforced polymer(CFRP) and glass fibre-reinforced polymer (GFRP) sheets,plates, strips, and rods were tested. The experimental resultswere collected from different scientific publications.
2. Analytical Model
2.1. CrackWidth according to Design Standards. In this chap-ter, the estimation methods of the crack width and the meancrack spacing proposed in design standards [18, 19] are pre-sented. The crack width of a RC structure can be calculatedby following equation proposed in EC2 [18].
wEC2 = sr max εsm − εcm , 1
where sr max is the maximum crack spacing and εsm and εcmare the mean strains in reinforcement and in concretebetween cracks, respectively.
The mean value of crack spacing can be defined asfollows [18]:
sr m = Sr max1 7 = 2c + 0 25k1k2ϕ
ρp ef f, 2
where k1 is a coefficient which evaluates the bond propertiesof the bonded reinforcement: 0.8 for high bond bars and 1.6for bars with an effectively plain surface (e.g., prestressingtendons); k2 is a coefficient which takes into account the dis-tribution of strain: 0.5 for bending and 1.0 for pure tension.
Assuming stabilized cracking, the characteristic value ofthe crack width of FRP-strengthened RC structures is calcu-lated according to fib bulletin 14 [19] recommendations:
wFIB = 1 7sr mζε2, 3
where ζ is a tension-stiffening coefficient and ε2 is thereinforcement strain in the fully cracked state.
The mean crack spacing, taking into account the effect ofboth the internal and the external reinforcement, can becalculated as [19]
sr m = 2f ctmAc ef fτsmus1
Es1As1Es1As1 + ξbEf Af
= 2f ctmAc ef fτfmuf
ξbEf Af
Es1As1 + ξbEf Af,
4
where f ctm is a mean value of concrete tensile strength; Ac ef fis an effective area of concrete’s tensile zone; As1 and Af arethe areas of steel and FRP reinforcements, respectively; Es1and Ef are the elasticity modules of steel and FRP reinforce-ments, respectively; us1 and uf are the bond perimeters ofsteel and FRP reinforcement, respectively; τsm = 1 8f ctm andτfm = 1 25f ctm are the mean bond stresses of steel and FRPreinforcement; and ξb is a bond parameter given as
ξb =τfmEs1As1uf
τsmEf Af us15
Neglecting the tension-stiffening effect and initial strain,the characteristic crack width is as follows [19]:
wFIB2 = 2 1ρc ef fMa
Es1dρeq
1us1 + 0 694uf
, 6
where Ma is the acting moment in a cross-section, ρc ef f is aratio of the effective area in tension, and ρeq is the equivalentreinforcement ratio.
Hence, a denser cracking and the smaller crack widths areobtained for RC beams strengthened with FRP; the crackwidths estimated by the methodology proposed in [19] wereused for further analysis.
2.2. Proposed Methodology
2.2.1. Crack Width. In accordance with Jokūbaitis and Jukne-vičius and Jokūbaitis et al.’s [23, 24] proposed crack develop-ment model for RC structures, a flexural reinforced concreteelement crack has two peaks; one leads to the crack spreadtoward the beam neutral axis, and the other refers to the ten-sile reinforcement. The width of the crack apex closer to theneutral axis is critical for further crack spread. The bondstrength of concrete and reinforcements, which is equal tothe tensile strength of concrete (f ct), stresses of FRP, and steelreinforcements (σs and σf , respectively), resist crack propa-gation. Parts of the element separated by the crack rotatesabout the intersection point of the crack surface and neutralaxis (see Figure 1(a)).
The proposed crack model is presented in Figure 1(a),whereAs1,As2, andAf are the inner tensile, compressive steel,and external FRP reinforcements, respectively; d1 and d2 arethe distances to centroids of inner reinforcements; hcr andhct are the crack depth and the depth of tensile zone above it,respectively; and wcr and δcr are the crack width and the crit-ical width of a normal crack tip, respectively. Strain distribu-tion in a cross-section is reflected in Figure 1(b), where xe isa depth of compression zone of concrete; εctu and εf are theultimate tensile strain of concrete and the FRP strain, respec-tively. The crack depth and width dependence can beexpressed from a condition of similarity of triangles:
δcrwcr
≈hcthcr
≈εctuεf
7
General expression of ultimate value of concrete’s tensilestrain is used for analysis:
εctu =f ctm
νplEcm≈2f ctmEcm
, 8
where νpl is concrete plasticity factor (νpl ≈ 0 5); Ecm is asecant modulus of elasticity.
The mean value of concrete’s tensile strength and secantmodulus of elasticity are estimated in accordance withEC2 [18]:
f ctm = 0 30 f cm − 8 23 ,
Ecm = 22 f cm10
0 3 9
The ratio of ultimate strain of concrete in tension and thestrain of FRP reinforcement can be calculated as follows:
2 International Journal of Polymer Science

where αs1, αs2 , and αf are the ratios of elasticity modules ofsteel reinforcements and FRP reinforcement, respectively;εp is the FRP prestressing strain and ε0 is the initial strain;Mp and M0 are the bending moment caused by the preten-sioning force and the initial bending moment, respectively;and x0 is the initial depth of the concrete compressive zone.
A wide range of experimental research was conducted byJokūbaitis et al. [23–28], and the empirical expression of thecritical width of a normal crack tip was derived for flexuralRC elements:
δcr 0 ≈ 0 00012d1 ϕ3 μ, 13
where d1 is the distance to the tensile steel reinforcementresultant (see Figure 1), ϕ is the diameter of tensile steel rein-forcement, and μ is the parameter, which evaluates the influ-ence of different factors (cross-section, bond betweenconcrete and reinforcement, and reinforcement ratio) onthe relation between the crack parameters.
Below is the same expression with some modificationswhich could be used for FRP-strengthened structures:
δcr ≈ 0 00012d1 ef f ϕeq3 μ, 14
where ϕeq is the equivalent factor of tensile zone; μ is theparameter evaluating the influence of the cross-section ofthe element and bond between concrete and FRP
reinforcement (the reinforcement ratio is already taken intoaccount estimating the equivalent factor of the tensile zone):
μ = βϑ b, hψf
, 15
where β = 2 and 1 for long-term and short-term loading,respectively; ϑ b, h is the empirical function of cross-sectional parameters; and ψf is the reduction factor of stiff-ness in the interface between the RC member and FRP basedon the built-up-bar theory [12, 16, 17]:
ψf = 1 − sh λ ⋅ Ls ⋅ ch λ ⋅ L/2 − Lsλ ⋅ Ls ⋅ ch λ ⋅ L /2 16
Factor λ evaluates the stiffness of the interface and couldbe calculated as follows:
λ = ξ ⋅ γ 17
Stiffness of the interface between separate members:
ξ =uf Gef f
a, 18
where a is the distance between the centroids of the RC beamand FRP; Geff is the effective shear modulus [12]:
Gef f = 0 001 ⋅ K ⋅ Ecm, 19
εctuεf
≈2f ctm αs1As1 d − xe / df − xe d − xe/3 + αf Af df − xe/3 + αs2As2 xe − d2 / df − xe xe/3 − d2
Ma − Af Ef εp − ε0 df − xe/3, 10
xe =B2e + 2 b − 2αf Af Mp −M0 /Max0 αs2As2d2 + αs1As1d + αf Af df − Be
b − 2αf Af Mp −M0 /Max0, 11
Be = αs2As2 + αs1As1 + αf Af , 12
hct
hcr𝛿cr
𝜎s
𝜎f
d2
d1
Wcr
Ma Ma
Neutralaxis
Geometricalaxis
As1
Af
As2
fct
ddf
(a)
hct
hcr
𝜀f
𝜀ctu
xe
(b)
Figure 1: The model for calculation of normal crack propagation: (a) crack model; (b) strain distribution.
3International Journal of Polymer Science

where K is the coefficient evaluating the anchorage of FRP.K = 1 when FRP is not anchored, K = 1 5 when steel platesare used for the anchorage, and K = 2 0 when FRP wraps orinterlocking grooves are used for the anchorage.
Factor γ could be calculated as follows:
γ = 1EcmAc ef f
+ 1Ef Af
+ a2
EcmIc ef f, 20
where Ac ef f and Ic ef f are the area and the moment of inertiaof a cracked concrete cross-section, respectively. For rectan-gular cross-sections
Ac ef f = bxe, 21
Ic ef f =bx3e3
22
The distance to tensile steel and FRP-reinforcementresultant (in mm) (see Figure 2) is as follows:
d1 ef f = d1 −Afσf df − d
Afσf + As1σs1
= d1 −Af Ef df − d
Af Ef + As1Es1 d − xe / df − xe
23
In EC2, the effective reinforcement ratio of tensile zone ofconcrete is expressed as follows:
ρt ef f =As1 + ξ1Ap
Act ef f, 24
where Ap is the area of pre- or posttensioned tendonswithin Act ef f and ξ1 is the adjusted ratio of bond strengthtaking into account the different diameters of prestressingand reinforcing steel.
As proposed in [21] for FRP-strengthened RC structures,Ap = Af and ξ1 = Ef /Es1; then the effective reinforcementratio of the tensile zone of concrete will be as follows:
ρt ef f =As1 + Af Ef /Es1
Act ef f, 25
where Act ef f is the effective area of concrete in tension:
Act ef f = bhct ef f = min
2 5bd1 ef f ,b h − xe
3 ,
h2
26
The equivalent factor of the tensile zone, taking intoaccount both steel and FRP reinforcements, can be derivedfrom (2) and (4):
ϕeq =8ρt ef fAct ef f f ctmξbEf Af
τfmuf EsAs + ξbEf Af k1k2, 27
where the bond perimeter of FRP reinforcement uf is deter-mined from Figure 3.
Subsequently, the crack width is derived from (7)and (10):
h
b
bf
d1
dt f
df
d1.ef
f
hct.eff
(a)
Grooves filledwith epoxy resin
b
h
d1
d
df
d1.ef
f
hct.eff
(b)
Figure 2: Effective tension area: (a) EBR; (b) NSM.
wcr f =δcr Ma − Af Ef εp − ε0 df − xe/3
2f ctm αs1As1 d − xe / df − xe d − xe/3 + αf Af df − xe/3 + αs2As2 xe − d2 / df − xe xe/3 − d2, 28
4 International Journal of Polymer Science

where d and df are the depths of inner and external rein-forcements, respectively. If the structure was already crackedat the strengthening moment, the initial crack width shouldbe added to calculation:
wcr =wcr f +wcr 0, 29
wcr 0 =δcr 0M0
2f ctm αs1As1 d − x0/3 + αs2As2 x0 − d2 / d − x0 x0/3 − d2
30
2.2.2. Relation between Crack Depth and Load-CarryingCapacity. The same relation in (7) relates the crack depthwith the acting bending moment and the depth of the con-crete tensile zone, whose relation with crack parameters canbe expressed as follows:
hct ≈δcrwcr
hcr 31
Furthermore, there will always be a retained condition:
h = hcr +δcrwcr
hcr + xe 32
Therefore, the crack depth can be expressed as follows:
hcr =h − xe
1 + δcr/wcr= h − xe1 + εctu/εf
33
When the load of the RC element strengthened with FRPis close to its ultimate value, the strain in tensile steel
𝜆(h
- hcr.u)
d
Fc
Mu
𝜎fAf
t f As1 Af
fyAs1
h
b
bf
d2
As2
𝜂fcm
df
d1
(a)
𝜆(h
− hcr.u)
Mu
d1
dGrooves filled
with epoxy resindg
h
b
As1 Af 𝜎fAf
fyAs1
Fc
As2
d2
𝜂fcm
df
(b)
Figure 4: State of stress in RC beam strengthened with (a) EB FRP reinforcement and (b) NSM FRP reinforcement.
u1 u2
uf = 𝛴ui
(a)
uf = 𝛴bi
b 1 b 3 b 4 b 6
b2 b5
(b)
uf = bf
bf
(c)
Figure 3: Bond perimeter of FRP reinforcement: (a) FRP rods; (b) FRP strips; (c) EBR.
𝜀f.i
𝜀fe.i
𝜀sl
𝜀cu
𝜀p
𝜀0
df
− h
+ hcr.u.i
Figure 5: Limit state of strain in the flexural member.
5International Journal of Polymer Science

reinforcement, in most cases, shall exceed the yield strengthand large plastic deformations will occur in the element(δcr/wcr → 0, εctu/εf → 0, and hct → 0). Therefore, the tensilezone of concrete above the crack can be disregarded, andthe ultimate crack depth of the element could be evaluatedaccording to Figure 4, by using the equivalent rectangularconcrete compressive stress diagram.
Although FRP stress is unknown, the equilibrium condi-tion between the ultimate crack depth and the FRP stress canbe reached iteratively. This way, the ultimate crack depthcould be evaluated by the following:
hcr u i ≈ h −As1 f y + Afσf i
ηλf cmb, 34
where f y and f cm are the yield strength of tensile steel rein-forcement and the mean value of concrete compressivestrength, respectively, and η and λ are the reduction factorsof concrete compressive strength and compressive zoneheight, respectively (in accordance with EC2 [18]: η = 1 0,λ = 0 8 for concrete strength f ck < 50MPa). The FRP stressof ith iteration can be found, assuming the linear elasticstress-strain relationship, but it must be lower than thedesign strength:
σf i = Ef εf i ≤ f f , 35
where εf.i is a FRP strain, which could be determined fromFigure 5.
In accordance with EC2 [18], the ultimate strain of thecompressive concrete εcu could be taken as 3.5‰, whenf ck < 50MPa. Iterations are repeated until equilibriumcondition is achieved:
σf n ≈ σf n−1 36
Afterwards, the compressive reinforcement stress is cal-culated and the ultimate crack depth is revised, evaluatingthe impact of compressive reinforcement and reduced stiff-ness in the interface between the RC member and the FRPreinforcement.
σs2 = Es2ψf εfeh − hcr u − d2df − h + hcr u
≤ f y s2, 37
hcr u = h −As1 f y + Afψfσf − As2σs2
2
ηλf cmb As1 f y + Afψfσf
, 38
where the reduction factor ψf is taken from (16), (17), (18),(19), (20), (21), and (22), only that Ac ef f = b h − hcr u andIc ef f = b h − hcr u
3/3.Real reduction coefficients of a concrete compressive
zone stress diagram can be determined using the modifiedtechnique proposed by Dulinskas et al. [29] (see Figure 6).
The areas of separate parts and the whole curvilinear con-crete’s compressive zone diagram [30]:
Aasc =12 2xasc
23 f cm = 2
3 f cm h − hcr uεc1εc2
, 39
Adesc2 = f cmxdesc = f cm 1 − εc1εc2
h − hcr u , 40
Adesc3 = Asum − Aasc − Adesc2, 41
Asum =As1 f y + Afψfσf − As2σs2
b, 42
where the concrete strain at peak stress [18] is εc1 = 0 7f 0 31cm
≤ 2 8 and the concrete ultimate strain εc2 = εfe h − hcr u /df − h − hcr u .
When Adesc3 < 0, the descending part of concrete’s com-pressive zone diagram exists and it is possible to calculateits parameters.
λ = 2xch − hcr u
≤ 1 0, 43
η = Asum
f cmλ h − hcr u≤ 1, 0 ; 44
where xc is a coordinate of centroid of curvilinear concrete’scompressive zone stress diagram:
xc =〠AixciAsum
45
If εc2< εc1, there will not be any descending part and thearea of the ascending part would be equal to the area of thewhole curvilinear concrete compressive zone diagram. Thestrength of compressive concrete will not be reached (seeFigure 7), and maximum stress in the most compressed fibrecan be determined by stress-strain relation for nonlinearstructural analysis proposed in EC2 [18]:
σc = f cmkεc2/εc1 − εc2/εc1 2
1 + k − 2 εc2/εc1, 46
k = 1 05Ec εc1f cm
47
Next, the ascending part of the concrete stress diagram isdivided into the simpler figures, and the parameters of equiv-alent stress diagram are calculated by (43) and (44).
Subsequently, the flexural strength of the strengthenedmember can be expressed as
Mu calc = ηf cmbλ h − hcr u h −λ h − hcr u
2+ As2σs2 h − d2
48
A simplified methodology proposed by Slaitas et al.[31] could be used for nonstrengthened RC structures,using a triangular concrete compressive zone stressdiagram.
6 International Journal of Polymer Science

The analytical model proposed above could be used formore reliable prediction of concrete crack parameters andflexural strength for FRP-strengthened RC structures.
2.3. Analysed Beams. Four-point bending tests were carriedout on seven full-scale beams (see Figure 8). The experi-mental beams varied by length, material properties,
c1
c
1 2
fcm
c2
c3
fcm
.min
fcm
h - hcr.u
fcm.min
fcm
fcm
c3
c2
c1
c
xasc
xdesc
xrect
𝜂fcm
𝜂𝜆fcm
𝜆(h
- hcr.u)/2
c
Asum
xc1
xc xc2
xc3
(a)
(b) (c) (d)
3
4
𝜀c2
𝜀c1
𝜀c1
𝜀cu
𝜀cu𝜀
Figure 6: Stress distribution diagrams for concrete in compression: (a) curvilinear: 1—ascending part, 2—descending part; (b) strains in thecross-section; (c) curvilinear concrete’s compressive zone stress diagram and centroids of its parts: c—whole stress diagram, c1—ascendingpart, c2—constant (rectangular) part, c3—separated part from rectangular by curved descending line, and xc, xc1, xc2, and xc3—thecoordinates of centroids of stress diagram parts; and (d) rectangular stress diagrams: 3—equivalent and 4—inequivalent [30].
h −
hcr.u
c1
c2
c xasc xrect
𝜂𝜆𝜎c
𝜂𝜎c𝜆(h
− hcr.u)/2
c
Asum
xc1 xc xc2
𝜀c2 < 𝜀c2
𝜎c < fcm
(a) (b) (c)
Figure 7: Stress distribution diagrams for concrete in compression, when mean value of concrete compressive strength is not reached:(a) strains in cross-section; (b) curvilinear concrete compressive zone stress diagram; (c) rectangular stress diagram.
7International Journal of Polymer Science

reinforcement ratio, and strengthening. Beam CB served asa control beam. Beams B1-0 and B2-P were strengthened,and the CFRP layer was additionally anchored with steelclumps. Beams B5-7 and B6-7 were strengthened underan external load action. Beams B3-0 and B4-0 were
strengthened without an external load action. The CFRPlayer of beams B3-0, B4-0, B5-7, and B6-7 was unanchored.The properties of tested beams are listed in Table 1.
Additionally, an extended database of 27 beams totalwas used for comparison of numerical and experimental
L
F/2 F/2
h
b
As1 As1
Afbf
As2
As2
Af
L/3 L/3 L/3
Figure 8: Loading scheme of tested beams.
Table 1: Properties of specimens and materials.
Beam ID b (m) h (m) L (m) As1 (mm2) fy (MPa) Af (mm2) ff (MPa) As2 (mm2) M0 (kNm) fcm (MPa) Anchored
CB 0.15 0.3 2.7 308 569 — — 226 0 25.40 —
B1-0 0.15 0.3 2.7 308 569 144 2334 226 0 25.40 Yes
B2-P∗ 0.15 0.3 2.7 308 569 144 2334 226 0 25.40 Yes
B3-0 0.1 0.2 1.2 226 318 16.7 4800 100 0 28.70 No
B4-0 0.1 0.2 1.2 226 318 16.7 4800 100 0 28.70 No
B5-7 0.1 0.2 1.2 226 318 16.7 4800 100 7 28.70 No
B6-7 0.1 0.2 1.2 226 318 16.7 4800 100 7 28.70 No∗FRP was prestressed, σp = 120MPa.
Table 2: Properties of additional beams for serviceability stage [21].
Beam ID b × h (mm) L (mm) As1 (mm2) fy (MPa) Af (mm2) ff (MPa) As2 (mm2) Ms∗ (kNm) Anchored
1-A2 180× 100 2000 157 456 16.70 3450 100 10.63 No
1-A3 180× 100 2000 157 456 33.40 3450 100 11.90 No
1-A4 180× 100 2000 157 456 33.40 3450 100 11.05 No
1-A5 180× 100 2000 157 456 16.70 3450 100 12.33 No
1-A7 180× 100 2000 157 456 16.70 3450 100 12.75 No
1-A8 180× 100 2000 100 513 16.70 3450 157 7.86 No
1-B2 180× 100 1800 226 432 16.70 3450 100 12.75 No
1-B3 180× 100 1800 226 432 33.40 3450 100 12.00 No
1-B4 180× 100 1800 226 432 33.40 3450 100 10.50 No
1-B5 180× 100 1800 226 432 16.70 3450 100 12.75 No
1-B7 180× 100 1800 226 432 16.70 3450 100 13.13 No
2-A2 150× 100 1800 100 530 18.15 3450 100 4.61 No
2-A3 150× 100 1800 100 530 18.15 3450 100 4.80 No
2-A4 150× 100 1800 100 530 16.50 3450 100 4.91 No
2-B2 150× 100 1800 157 570 18.15 3450 157 6.45 No
2-B3 150× 100 1800 157 570 18.15 3450 157 6.45 No
2-B4 150× 100 1800 157 570 33.00 3450 157 6.19 No
2-C3 100× 150 1800 100 530 13.20 3450 100 4.46 No
2-C4 100× 150 1800 100 530 13.20 3450 100 4.01 No
2-D3 100× 150 1400 157 570 13.20 3450 157 7.34 No
2-E3 100× 150 1800 314 570 33.00 3450 157 10.01 No∗Crack width checking moment.
8 International Journal of Polymer Science

results. Additional 21 beams were taken from a researchconducted in [21]. The properties of extra beams are listedin Table 2.
A number of additional RC beams, strengthened withcarbon fibre-reinforced polymer (CFRP) and glass fibre-reinforced polymer (GFRP) sheets, plates, strips, and rods,tested by different researchers, were analysed in a compari-son of numerical and experimental results of load-carryingcapacity (sample size: 98 beams). The properties of extra 71beams are listed in Table 3.
3. Results and Discussion
3.1. Crack Pattern. The crack pattern of the higher beams(B1-0 and B2-P) is presented in Figure 9. It can be seen in
both beams that the spacing of primary cracks was similar(sr m P B1‐0 ≈ sr m P B2‐P ≈ 130mm), but the spacing of sec-ondary cracks was denser in beam B1-0, although thecrack widths were smaller in the prestressed beam (B2-P),taking into account secondary cracks: sr m P‐S B1‐0 ≈ 56mmand sr m P‐S B2‐P ≈ 71mm, and crack widths under serviceload: wcr B1‐0 ≈ 0 200mm and wcr B2‐P ≈ 0 075mm. The max-imum crack width was reduced by 2.67 times by prestressingthe external reinforcement. This was evaluated in the pro-posed method (calculated crack width of B1-0 was 2.55 timesbigger than B2-P).
The crack pattern of smaller beams (B3-0, B4-0, B5-7,and B6-7) is presented in Figure 10.
In beams without initial strain, the crack distribution wasdenser, because from the start the beams had higher
Table 3: Properties of additional beams for load-carrying capacity.
Ref. As1/bd (%) fy (MPa) Af /bdf (%) ff (MPa) Ef (GPa) σp (MPa) EBR/NSM
[32] 0.85 400 0.11 3100 165 1000 EBR
[32] 0.85 400 0.13 ÷ 0.14 2068 131 0 ÷ 1000 NSM
[33] 0.40 426 0.04 ÷ 0.12 2453 ÷ 3479 165 ÷ 230 0 EBR
[33] 0.40 426 0.04 ÷ 0.11 1878 ÷ 2453 121 ÷ 165 0 NSM
[34] 0.45 436 0.04 ÷ 0.22 1500 ÷ 2483 100 ÷ 167 0 NSM
[35] 0.29 ÷ 1.19 466 ÷ 501 0.08 2850 165 0 ÷ 1323 EBR
[36] 0.50 ÷ 0.75 525 ÷ 531 0.11 3263 251 0 EBR
[37] 0.58 545 0.12 ÷ 0.26 1350 ÷ 2350 64 ÷ 170 0 NSM
[38] 0.58 540 0.13 ÷ 0.26 1350 ÷ 2500 64 ÷ 170 0 NSM
[39] 0.77 475 0.08 2167 130 0 ÷ 1241 NSM
[40] 0.54 ÷ 0.94 730 0.16 ÷ 0.24 2740 159 0 NSM
[41] 0.39 585 0.06 1922 164 0 ÷ 823 NSM
Primary cracksSecondary cracks
Figure 9: Experimental crack pattern of beams B1-0 and B2-P.
9International Journal of Polymer Science
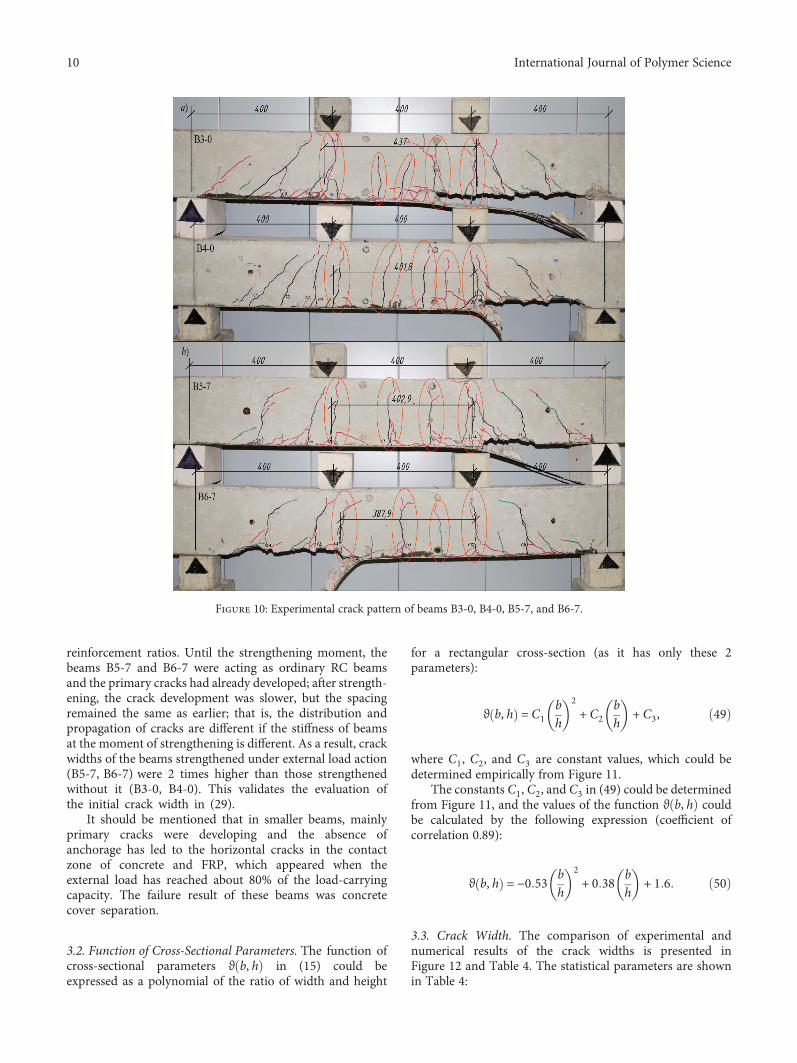
reinforcement ratios. Until the strengthening moment, thebeams B5-7 and B6-7 were acting as ordinary RC beamsand the primary cracks had already developed; after strength-ening, the crack development was slower, but the spacingremained the same as earlier; that is, the distribution andpropagation of cracks are different if the stiffness of beamsat the moment of strengthening is different. As a result, crackwidths of the beams strengthened under external load action(B5-7, B6-7) were 2 times higher than those strengthenedwithout it (B3-0, B4-0). This validates the evaluation ofthe initial crack width in (29).
It should be mentioned that in smaller beams, mainlyprimary cracks were developing and the absence ofanchorage has led to the horizontal cracks in the contactzone of concrete and FRP, which appeared when theexternal load has reached about 80% of the load-carryingcapacity. The failure result of these beams was concretecover separation.
3.2. Function of Cross-Sectional Parameters. The function ofcross-sectional parameters ϑ b, h in (15) could beexpressed as a polynomial of the ratio of width and height
for a rectangular cross-section (as it has only these 2parameters):
ϑ b, h = C1bh
2+ C2
bh
+ C3, 49
where C1, C2, and C3 are constant values, which could bedetermined empirically from Figure 11.
The constants C1, C2, and C3 in (49) could be determinedfrom Figure 11, and the values of the function ϑ b, h couldbe calculated by the following expression (coefficient ofcorrelation 0.89):
ϑ b, h = −0 53 bh
2+ 0 38 b
h+ 1 6 50
3.3. Crack Width. The comparison of experimental andnumerical results of the crack widths is presented inFigure 12 and Table 4. The statistical parameters are shownin Table 4:
Figure 10: Experimental crack pattern of beams B3-0, B4-0, B5-7, and B6-7.
10 International Journal of Polymer Science

xi =wexp iwcalc i
,
x = 1n〠n
i=1xi,
s = 1n − 1〠
n
i=1xi − x 2,
cv =sx⋅ 100%,
ci = x ± 1 96 s
n
51
Crack widths calculated by design provisions while eval-uating the tension-stiffening effect and without it were over-estimated with up to 85% (mean 32%) and 86% (mean 40%)errors (Δ = 1 −wexp/wcalc ⋅ 100%), respectively. Besides, thecoefficient of variation was very high, over 100%; its scatter is2 times higher than in the proposed method by the authorswithout evaluation of the influence of cross-sectional param-eters and 5 times higher with it. Moreover, the proposed
method in comparison with the design norms had a low aver-age error (3%, 0%), low standard deviation (0.53 and 0.22),and low coefficient of variation (51.44% and 21.62%), whichled to the much better confidence intervals (ci). It means thatthe FRP-strengthened RC elements could be designed withmore rational cross-sections and reinforcement ratios if theproposed methodology is being used.
3.4. Load-Carrying Capacity. Generally, the numerical cal-culations of the load-carrying capacity without reduction
0.000.250.500.751.001.251.501.752.002.252.50
0.00 0.25 0.50 0.75 1.00 1.25 1.50 1.75 2.00 2.25
ϑ (b,h)
b,h
ϑ b,h = −0.53 b/h2 + 0.38 b/h + 1.6
R = 0.89
Figure 11: The function of cross-sectional parameters ϑ b, h .
0.00
0.10
0.20
0.30
0.40
0.50
0.60
0.70
0.80
0.90
0.00 0.10 0.20 0.30 0.40 0.50 0.60 0.70 0.80 0,90
Proposedϑ b,h = 1
FIBFIB2
wcalc
wexp
(a)
Proposedϑ b,h ≠ 1
FIBFIB2
0.00
0.10
0.20
0.30
0.40
0.50
0.60
0.70
0.80
0.90
0.00 0.10 0.20 0.30 0.40 0.50 0.60 0.70 0.80 0,90
wcalc
wexp
(b)
Figure 12: Comparison of the crack width estimation results with experimental ones at service load: (a) ϑ b, h = 1; (b) ϑ b, h from (50).
Table 4: Statistical parameters of crack width estimation.
wcalc(Eq. (29),ϑ b, h = 1)
wcalc(Eq. (29),ϑ b, hEq. (50))
wFIB(Eq. (3))
wFIB2(Eq. (6))
x 1.03 1.00 0.68 0.60
s 0.53 0.22 0.70 0.64
cv (%) 51.44 21.62 103.59 107.50
ci 0 83,… ,1 23 0 92,… ,1 08 0 41,… ,0 95 0 36,… ,0 84
11International Journal of Polymer Science

of FRP stress (due to the slippage between concrete andFRP, ψf = 1 0) had lower mean error (0% to 14%) buthigher scatter (coefficient of variation cv 24.07% to 20.84%).However, it should be noted that in some cases, the beamsactually failed at loads close to 60% of the calculated ones(marked red in Figure 13) which is critically unsafe. Thus,it is vital to choose the correct calculation method. Themain statistical parameters of the analysis are presentedin Table 5.
The statistical parameters in Table 5:
xi =Mu exp iMu calc i
,
x = 1n〠n
i=1xi,
s = 1n − 1〠
n
i=1xi − x 2,
cv =sx⋅ 100%,
ci = x ± 1 96 s
n
52
The analysis of experimental and numerical resultsproves that this calculation method allows the accurateevaluation of the load-carrying capacity of the normal sectionof flexural RC beams strengthened with FRP.
The proposed calculation method could be treated asappropriate for practical application when choosing themost effective strengthening material and when determin-ing the crack width and load-carrying capacity of thestrengthened member.
4. Conclusions
A crack width propagation and load-carrying capacity pre-diction model was presented in this paper. The conclusions
of the analysis of experimental and numerical results arepresented below.
(i) The crack width calculation techniques proposed inthe design recommendations overestimate the crackwidth with up to 86% (average 32% and 40%) errorand very high scatter (coefficient of variation morethan 100%).
(ii) The predicted crack widths by the proposed modelagreed very well with experimental results (with 0%average error and a rather low coefficient of varia-tion: 21.62%), even for beams without additionalanchorage and with initial strain (common situationin practice).
(iii) The crack propagation analysis revealed that pre-stressing of the strengthening material reduced themaximum crack width 2.67 times. This was evalu-ated in the proposed calculation method (calculatedcrack width of the non-prestressed beam was 2.55times bigger than that of the prestressed one).
(iv) The propagation of cracks differs if the stiffness ofthe beams at the moment of strengthening is differ-ent. In the beams strengthened under external loadaction (with initial strain), the cracks had developedas in RC beams. After strengthening, further devel-opment of the cracks has slowed down, but the spac-ing remained the same. As a result, the crack widthsof the beams strengthened under external loadaction (B5-7, B6-7) were 2 times higher than thosestrengthened without it (B3-0, B4-0). This validatesthe evaluation of the initial crack width in (29).
(v) The results of numerical calculations of the load-carrying capacity without reduction of FRP stress(due to the slippage between concrete and FRP,ψf = 1 0) had lower mean error (0% comparingto 14%) but higher scatter (coefficient of variationcv equals to 24.07% and 20.84%, resp.) than thosewith it. However, it should be noted that in somecases, the beams actually failed at loads close to60% of the calculated ones which is critically unsafe.Thus, a calculation method with reduced FRP stressand a rather low (average 14%) reserve could betreated as appropriate for the practical applicationwhen choosing the most effective strengtheningmaterial and when determining the load-carryingcapacity of strengthened member.
020406080
100120140160180200220240260
0 20 40 60 80 100 120 140 160 180 200 220 240 260𝜓f = 1.0𝜓f < 1.0
Mu.calc
Mu.exp
Figure 13: Comparison of experimental and numerical results ofload-carrying capacity.
Table 5: Statistical parameters of load-carrying capacity.
Mu.calc (Eq. (48), ψf = 1 0) Mu.calc (Eq. (48), ψf< 1.0)x 1.00 1.14
s 0.24 0.24
cv (%) 24.07 20.84
ci 0 95,… ,1 05 1 09,… ,1 19
12 International Journal of Polymer Science

Data Availability
All data and results of a research are provided in themanuscript.
Conflicts of Interest
The authors declare that there is no conflict of interestregarding the publication of this paper.
References
[1] C. E. Bakis, L. C. Bank, V. L. Brown et al., “Fiber-reinforcedpolymer composites for construction—state-of-the-artreview,” Journal of Composites for Construction, vol. 6, no. 2,pp. 73–87, 2002.
[2] J. Valivonis, M. Budvytis, M. Atutis, E. Atutis, andL. Juknevičius, “Study on shear resistance of fiber-reinforcedpolymer-reinforced concrete beams,” Advances in MechanicalEngineering, vol. 7, no. 7, 2015.
[3] M. Panjehpour, N. Farzadnia, R. Demirboga, and A. A. A. Ali,“Behavior of high-strength concrete cylinders repaired withCFRP sheets,” Journal of Civil Engineering and Management,vol. 22, no. 1, pp. 56–64, 2015.
[4] L. Torres, I. A. Sharaky, C. Barris, and M. Baena, “Experimen-tal study of the influence of adhesive properties and bondlength on the bond behaviour of NSM FRP bars in concrete,”Journal of Civil Engineering and Management, vol. 22, no. 6,pp. 808–817, 2016.
[5] M. Aktas and Y. Sumer, “Nonlinear finite element analysis ofdamaged and strengthened reinforced concrete beams,” Jour-nal of Civil Engineering and Management, vol. 20, no. 2,pp. 201–210, 2014.
[6] T. Skuturna, J. Valivonis, P. Vainiunas, G. Marciukaitis, andM. Daugevicius, “Analysis of deflections of bridge girdersstrengthened by carbon fibre reinforcement,” The BalticJournal of Road and Bridge Engineering, vol. 3, no. 3,pp. 145–151, 2008.
[7] M. Atutis, J. Valivonis, and E. Atutis, “Analysis of serviceabil-ity limit state of GFRP prestressed concrete beams,” CompositeStructures, vol. 134, pp. 450–459, 2015.
[8] Y. J. Kim, M. F. Green, and R. Gordon Wight, “Prestressedfiber-reinforced polymer (FRP) composites for concrete struc-tures in flexure: fundamentals to applications,” in AdvancedComposites in Bridge Construction and Repair, Y. J. Kim, Ed.,pp. 30–60, Woodhead Publishing, 2014.
[9] T. Skuturna and J. Valivonis, “Experimental study on the effectof anchorage systems on RC beams strengthened using FRP,”Composites Part B Engineering, vol. 91, pp. 283–290, 2016.
[10] S. T. Smith and J. G. Teng, “FRP-strengthened RC beams. I:review of debonding strength models,” Engineering Structures,vol. 24, no. 4, pp. 385–395, 2002.
[11] J. G. Teng, S. T. Smith, J. Yao, and J. F. Chen, “Intermediatecrack-induced debonding in RC beams and slabs,” Construc-tion and BuildingMaterials, vol. 17, no. 6-7, pp. 447–462, 2003.
[12] J. Valivonis and G. Marčiukaitis, “Technological-structuralpeculiarities of reinforced concrete structures strengthenedwith carbon fiber-reinforced polymer,” Technological andEconomic Development of Economy, vol. 12, no. 2, pp. 77–83,2006.
[13] G. Marchukaitis, Y. Valivonis, and J. Bareishis, “An analysis ofthe joint operation of a CFRP concrete in flexural elements,”Mechanics of Composite Materials, vol. 43, no. 5, pp. 467–478, 2007.
[14] M. Daugevicius, J. Valivonis, and G. Marciukaitis, “Deflectionanalysis of reinforced concrete beams strengthened withcarbon fibre reinforced polymer under long-term load action,”Journal of Zhejiang University SCIENCE A, vol. 13, no. 8,pp. 571–583, 2012.
[15] J. Valivonis and T. Skuturna, “Cracking and strength of rein-forced concrete structures in flexure strengthened with carbonfibre laminates,” Journal of Civil Engineering and Manage-ment, vol. 13, no. 4, pp. 317–323, 2007.
[16] T. Skuturna, Research of flexural reinforced concrete membersstrengthened with external carbon fibre, PhD Thesis, VilniusGediminas Technical University, Lithuania, 2009.
[17] T. Skuturna and J. Valivonis, “Design method for calculatingload-carrying capacity of reinforced concrete beams strength-ened with external FRP,” Construction and Building Materials,vol. 50, pp. 577–583, 2014.
[18] EN 1992–1-1:2004, “Eurocode 2: Design of concrete struc-ture—part 1-1: general rules and rules for buildings,” Euro-pean standard, European Committee for Standardization(CEN), 2004.
[19] Fib bulletin 14, “Externally bonded FRP reinforcement for RCstructures,” Technical report, 2001.
[20] C. Miàs, L. Torres, M. Guadagnini, and A. Turon, “Short andlong-term cracking behaviour of GFRP reinforced concretebeams,” Composites Part B: Engineering, vol. 77, pp. 223–231,2015.
[21] F. Ceroni and M. Pecce, “Design provisions for crack spacingand width in RC elements externally bonded with FRP,” Com-posites: Part B, vol. 40, no. 1, pp. 17–28, 2009.
[22] M. Zomorodian, G. Yang, A. Belarbi, and A. Ayoub, “Crackingbehavior and crack width predictions of FRP strengthened RCmembers under tension,” Engineering Structures, vol. 125,pp. 313–324, 2016.
[23] V. Jokūbaitis and L. Juknevičius, “Critical depth of normalcracks in reinforced concrete beams of rectangular cross-section,” Journal of Civil Engineering and Management,vol. 19, no. 4, pp. 583–590, 2013.
[24] V. Jokūbaitis, L. Juknevičius, and R. Šalna, “Conditions forfailure of normal section in flexural reinforced concrete beamsof rectangular cross-section,” Procedia Engineering, vol. 57,pp. 466–472, 2013.
[25] V. Jokūbaitis and Z. Kamaitis, Gelžbetoninių konstrukcijųpleišėjimas ir remontas [Cracking and repair of reinforcedconcrete structures], p. 156, Technika, Vilnius, Lithuania, 2000.
[26] V. Jokūbaitis, Statybinių medžiagų ir konstrukcijų irimomechanikos pagrindai [Basics of fracture mechanics of build-ing materials and constructions], p. 92, Technika, Vilnius,Lithuania, 2001.
[27] V. Jokūbaitis, “Peculiarities of methods for calculation ofnormal crack width in reinforced concrete members,” inSelected Papers of Conference “Statybinės konstrukcijos”,vol. 6, pp. 73–84, Vilnius, Lithuania, February 2009.
[28] V. Jokūbaitis and L. Juknevičius, “Gelžbetoninių konstrukcijųnormalinių plyšių pločio skaičiavimo metodų analizė-Analysis of methods for calculating the width of normal cracksin reinforced concrete structures,” Statybinės konstrukcijos irtechnologijos, vol. 1, no. 1, pp. 23–29, 2009.
13International Journal of Polymer Science

[29] E. Dulinskas, D. Zabulionis, and R. Balevičius, “A compositionof equivalent compressive stress diagrams for strength analysisof flexural reinforced concrete elements,” in Selected Papers ofConference “Statybinės konstrukcijos”, vol. 6, pp. 5–11, Vilnius,Lithuania, February 2009.
[30] J. Slaitas, J. Valivonis, L. Juknevičius, and R. Šalna, “Load-bear-ing capacity of flexural reinforced concrete members strength-ened with fiber-reinforced polymer in fracture stage,”Advances in Mechanical Engineering, vol. 10, no. 5, 2018.
[31] J. Slaitas, Z. Hlavac, and A. Šneideris, “Flexural reinforced con-crete elements normal section bearing capacity evaluation infracture stage,” Engineering Structures and Technologies,vol. 9, no. 2, pp. 70–78, 2017.
[32] H. Peng, J. Zhang, C. S. Cai, and Y. Liu, “An experimentalstudy on reinforced concrete beams strengthened with pre-stressed near surface mounted CFRP strips,” EngineeringStructures, vol. 79, pp. 222–233, 2014.
[33] W.-T. Jung, Y.-H. Park, J.-S. Park, J.-Y. Kang, and Y.-J. You,“Experimental investigation on flexural behavior of RC beamsstrengthened by NSM CFRP reinforcements,” in SP-230: 7thInternational Symposium on Fiber-Reinforced (FRP) PolymerReinforcement for Concrete Structure, pp. 795–806, KansasCity, Missouri, November 2005.
[34] W. T. Jung, J. S. Park, J. Y. Kang, and M. S. Keum, “Flexuralbehavior of concrete beam strengthened by near-surfacemounted CFRP reinforcement using equivalent sectionmodel,” Advances in Materials Science and Engineering,vol. 2017, Article ID 9180624, 16 pages, 2017.
[35] S. K. Woo, J. W. Nam, J. H. J. Kim, S. H. Han, and K. J. Byun,“Suggestion of flexural capacity evaluation and prediction ofprestressed CFRP strengthened design,” Engineering Struc-tures, vol. 30, no. 12, pp. 3751–3763, 2008.
[36] B. Fu, G. M. Chen, and J. G. Teng, “Mitigation of interme-diate crack debonding in FRP-plated RC beams usingFRP U-jackets,” Composite Structures, vol. 176, pp. 883–897,2017.
[37] I. A. Sharaky, L. Torres, J. Comas, and C. Barris, “Flexuralresponse of reinforced concrete (RC) beams strengthened withnear surface mounted (NSM) fibre reinforced polymer (FRP)bars,” Composite Structures, vol. 109, pp. 8–22, 2014.
[38] I. A. Sharaky, L. Torres, and H. E. M. Sallam, “Experimentaland analytical investigation into the flexural performance ofRC beams with partially and fully bonded NSM FRP bars/strips,” Composite Structures, vol. 122, pp. 113–126, 2015.
[39] R. El-Hacha and M. Gaafar, “Flexural strengthening ofreinforced concrete beams using prestressed, near-surface-mounted CFRP bars,” PCI Journal, vol. 56, no. 4, pp. 134–151, 2011.
[40] J. A. O. Barros and A. S. Fortes, “Flexural strengthening ofconcrete beams with CFRP laminates bonded into slits,”Cement and Concrete Composites, vol. 27, no. 4, pp. 471–480,2005.
[41] M. Rezazadeh, I. Costa, and J. Barros, “Influence of prestresslevel on NSM CFRP laminates for the flexural strengtheningof RC beams,” Composite Structures, vol. 116, pp. 489–500,2014.
14 International Journal of Polymer Science

CorrosionInternational Journal of
Hindawiwww.hindawi.com Volume 2018
Advances in
Materials Science and EngineeringHindawiwww.hindawi.com Volume 2018
Hindawiwww.hindawi.com Volume 2018
Journal of
Chemistry
Analytical ChemistryInternational Journal of
Hindawiwww.hindawi.com Volume 2018
Scienti�caHindawiwww.hindawi.com Volume 2018
Polymer ScienceInternational Journal of
Hindawiwww.hindawi.com Volume 2018
Hindawiwww.hindawi.com Volume 2018
Advances in Condensed Matter Physics
Hindawiwww.hindawi.com Volume 2018
International Journal of
BiomaterialsHindawiwww.hindawi.com
Journal ofEngineeringVolume 2018
Applied ChemistryJournal of
Hindawiwww.hindawi.com Volume 2018
NanotechnologyHindawiwww.hindawi.com Volume 2018
Journal of
Hindawiwww.hindawi.com Volume 2018
High Energy PhysicsAdvances in
Hindawi Publishing Corporation http://www.hindawi.com Volume 2013Hindawiwww.hindawi.com
The Scientific World Journal
Volume 2018
TribologyAdvances in
Hindawiwww.hindawi.com Volume 2018
Hindawiwww.hindawi.com Volume 2018
ChemistryAdvances in
Hindawiwww.hindawi.com Volume 2018
Advances inPhysical Chemistry
Hindawiwww.hindawi.com Volume 2018
BioMed Research InternationalMaterials
Journal of
Hindawiwww.hindawi.com Volume 2018
Na
nom
ate
ria
ls
Hindawiwww.hindawi.com Volume 2018
Journal ofNanomaterials
Submit your manuscripts atwww.hindawi.com