cpuc csi workshop cpuc csi stakeholder workshop san francisco, ca february 15, 2012
TRANSCRIPT
CPUC CSI Workshop
CPUC CSI Stakeholder WorkshopSan Francisco, CAFebruary 15, 2012
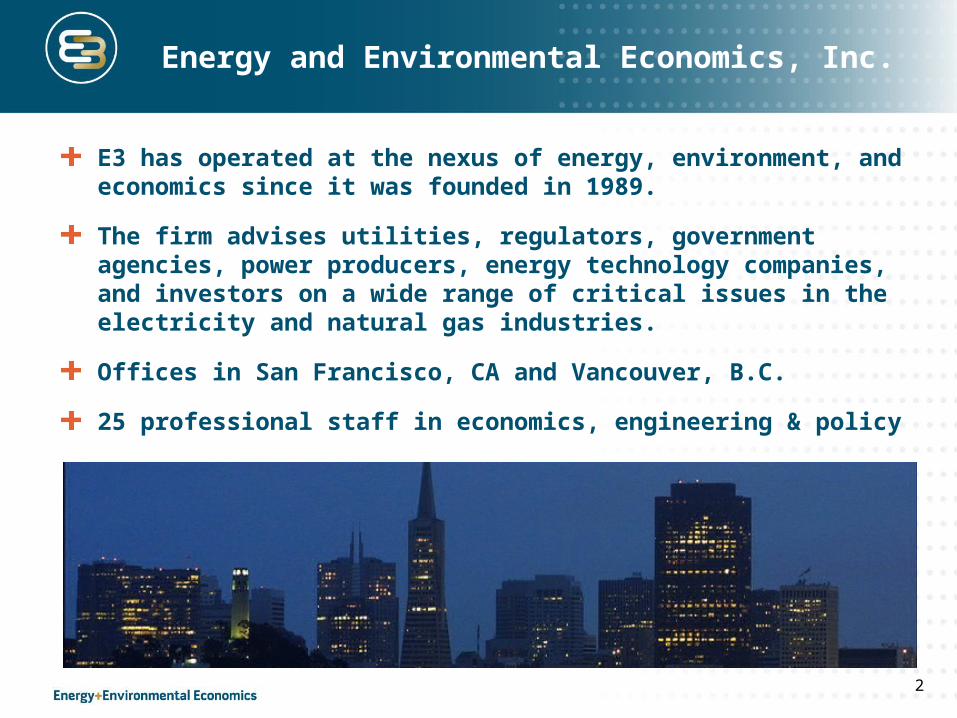
Energy and Environmental Economics, Inc.
E3 has operated at the nexus of energy, environment, and economics since it was founded in 1989.
The firm advises utilities, regulators, government agencies, power producers, energy technology companies, and investors on a wide range of critical issues in the electricity and natural gas industries.
Offices in San Francisco, CA and Vancouver, B.C.
25 professional staff in economics, engineering & policy
2
About E3
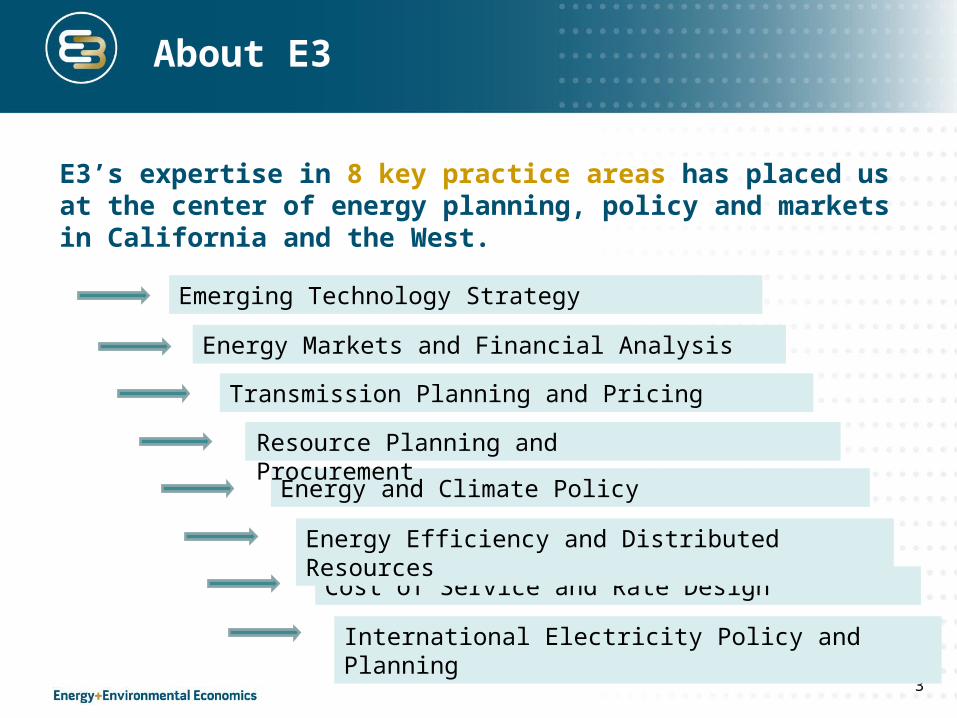
E3’s expertise in 8 key practice areas has placed us at the center of energy planning, policy and markets in California and the West.
3
Emerging Technology Strategy
Energy Markets and Financial Analysis
Transmission Planning and Pricing
Energy and Climate Policy
Cost of Service and Rate Design
International Electricity Policy and Planning
Energy Efficiency and Distributed Resources
Resource Planning and Procurement
E3 Support of CSI
Self-Generation Incentive Program (2007)
CPUC DG Cost-effectiveness Protocols (2009)
Net energy metering cost-effectiveness study (2009)
• Detailed bill calculations and load research data to isolate the difference between bill savings and wholesale value across all of the customer classes
Overall CSI Cost-effectiveness (2010)
• Evaluation of trajectory of standard cost tests including the Total Resource Cost, Program Administrator Cost test, and Ratepayer Impact Measure.
4
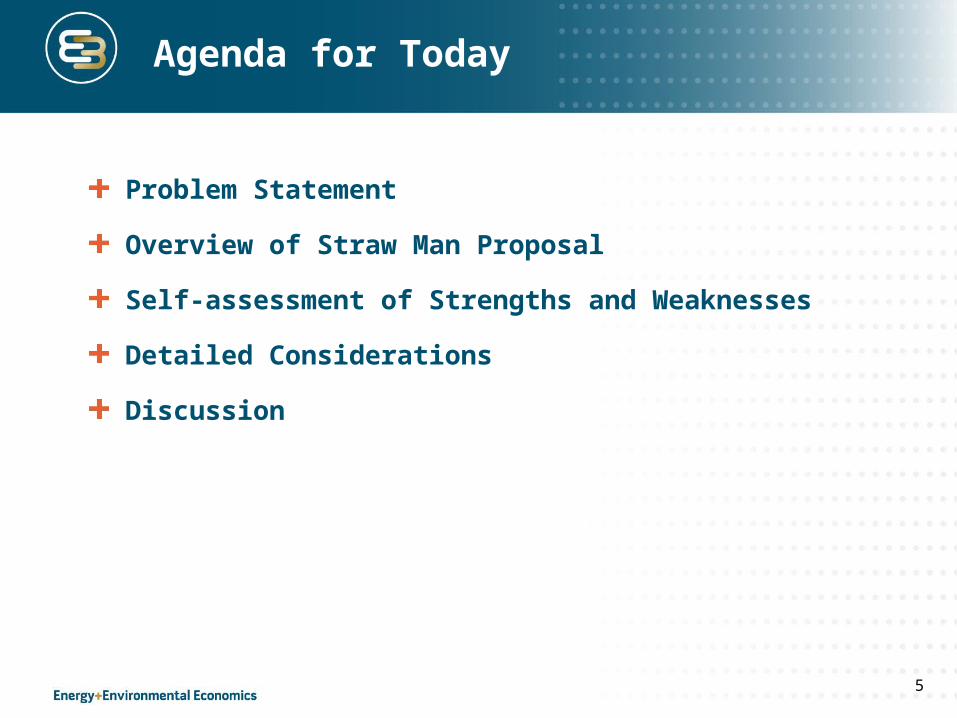
Agenda for Today
Problem Statement
Overview of Straw Man Proposal
Self-assessment of Strengths and Weaknesses
Detailed Considerations
Discussion
5

Original Problem Statement
Problem Statement
• It is difficult to make the cost reporting of total installed cost ($/watt) meaningful to a broad audience
Proposed Solution
• Translate the reported costs ($/watt) into levelized cost of energy (LCOE) ($/kWh) that is more broadly understood
6
Evaluating the reported cost data reveals a more foundational problem in standardizing reported cost figures
for 3rd party owned and leased systems.
However,
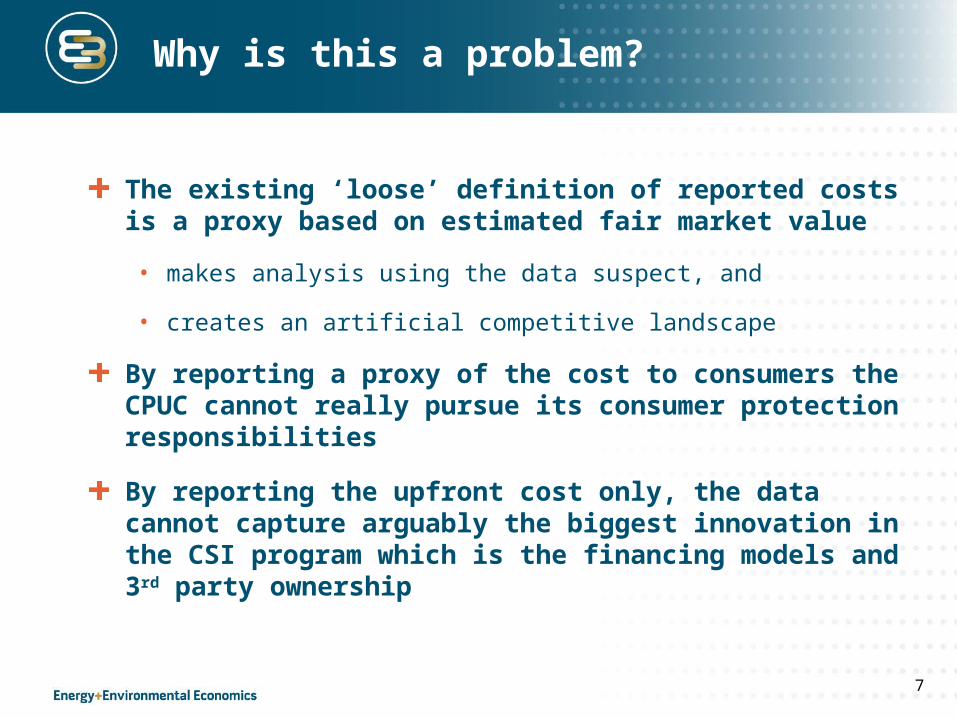
Why is this a problem?
The existing ‘loose’ definition of reported costs is a proxy based on estimated fair market value
• makes analysis using the data suspect, and
• creates an artificial competitive landscape
By reporting a proxy of the cost to consumers the CPUC cannot really pursue its consumer protection responsibilities
By reporting the upfront cost only, the data cannot capture arguably the biggest innovation in the CSI program which is the financing models and 3rd party ownership
7

Straw Man Solution
Step 1: Create a standardized reporting metric for 3rd party and leased systems that is conducive to calculating LCOE, the NPV of customer payments
• Update powerclerk and reporting vehicles for 3rd parties
Step 2: Calculate the estimated LCOE resulting from systems using the NPV and standard assumptions
• Could be either included in the CA Solar Statistics or developed through a ‘study’ that was released with regular CSI reports
Repeat Step 1 and 2 to provide an approach to calculate comparable NPV $ and LCOE for self-financed systems
8
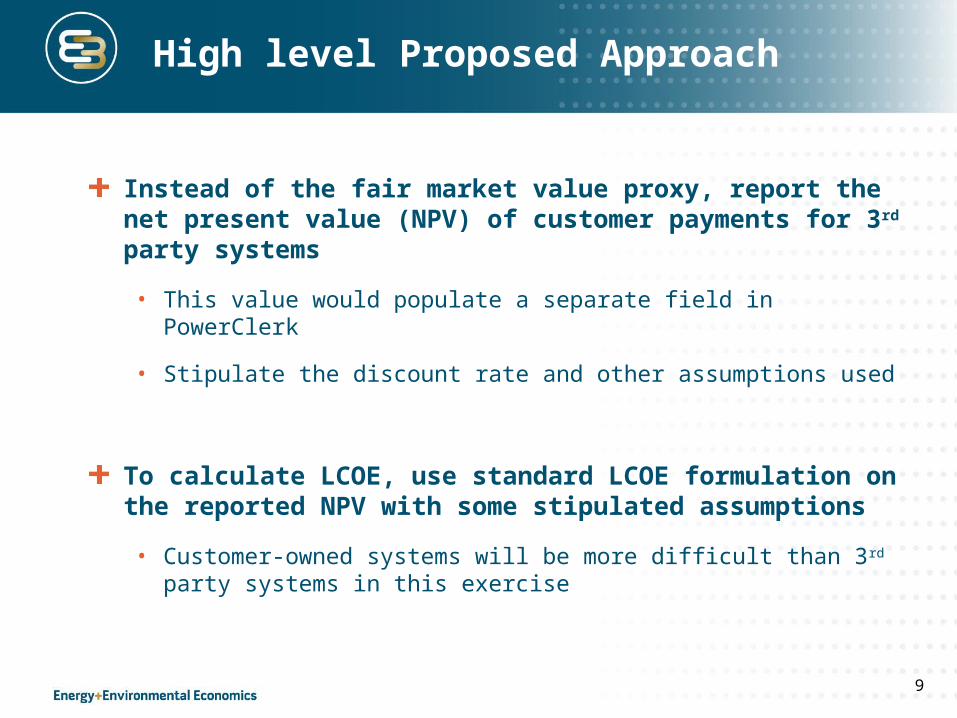
High level Proposed Approach
Instead of the fair market value proxy, report the net present value (NPV) of customer payments for 3rd party systems
• This value would populate a separate field in PowerClerk
• Stipulate the discount rate and other assumptions used
To calculate LCOE, use standard LCOE formulation on the reported NPV with some stipulated assumptions
• Customer-owned systems will be more difficult than 3rd party systems in this exercise
9
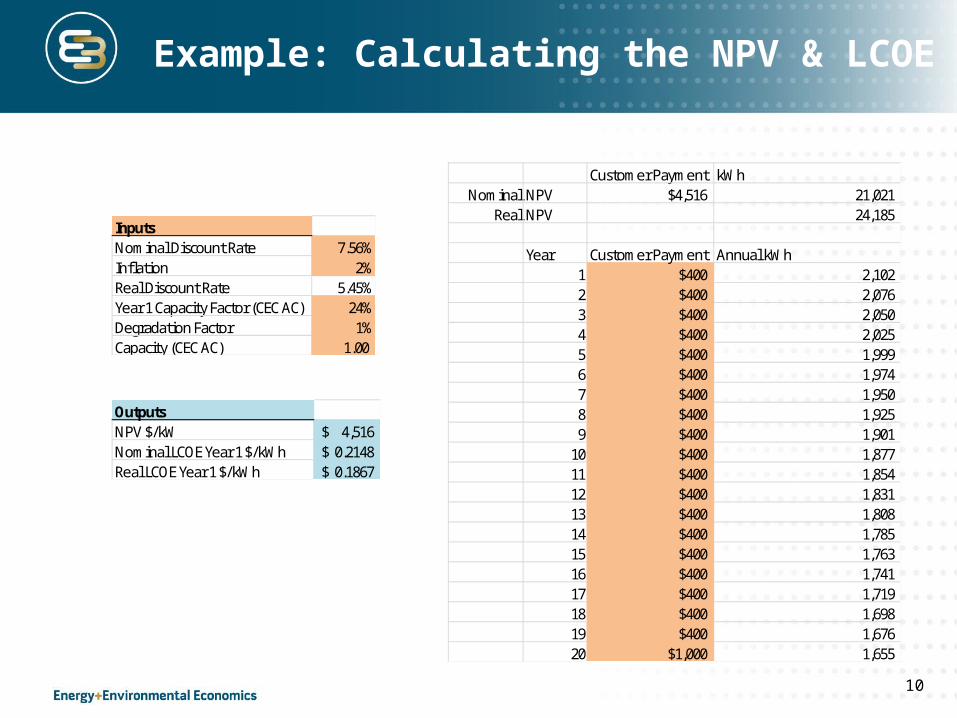
Example: Calculating the NPV & LCOE
10
InputsNominal Discount Rate 7.56%Inflation 2%Real Discount Rate 5.45%Year 1 Capacity Factor (CEC AC) 24%Degradation Factor 1%Capacity (CEC AC) 1.00
Customer Payment kWhNominal NPV $4,516 21,021
Real NPV 24,185
Year Customer Payment Annual kWh1 $400 2,102 2 $400 2,076 3 $400 2,050 4 $400 2,025 5 $400 1,999 6 $400 1,974 7 $400 1,950 8 $400 1,925 9 $400 1,901
10 $400 1,877 11 $400 1,854 12 $400 1,831 13 $400 1,808 14 $400 1,785 15 $400 1,763 16 $400 1,741 17 $400 1,719 18 $400 1,698 19 $400 1,676 20 $1,000 1,655
OutputsNPV $/kW 4,516$ Nominal LCOE Year 1 $/kWh 0.2148$ Real LCOE Year 1 $/kWh 0.1867$
Key Input Assumptions for NPV
Proposal for input assumptions
• Use the average utility after-tax weighted average cost of capital for the discount rate in the NPV
• Current value is 7.56%
• Use standardized degradation factor
• For example 1% per year
• Calculate the full stream customer payments to the end of the available , and then assume customer exercises buy-out option
• Puts everyone on same basis with system ownership at the end
• No assumptions about early buy-out
11
Comparison to Customer-owned
How do we make customer-owned systems comparable?
• Using standardized finanical pro-forma tool calculate ratios of NPV $ to upfront cost
• Use same assumptions on degradation and system life to calculate LCOE
• Assume inverter replacement and O&M costs
Self Financing Models
• Assume self-financed residential is 100% home equity loan
• Assume self-financed commercial is financed with some debt and some equity, and is a taxable entity
12
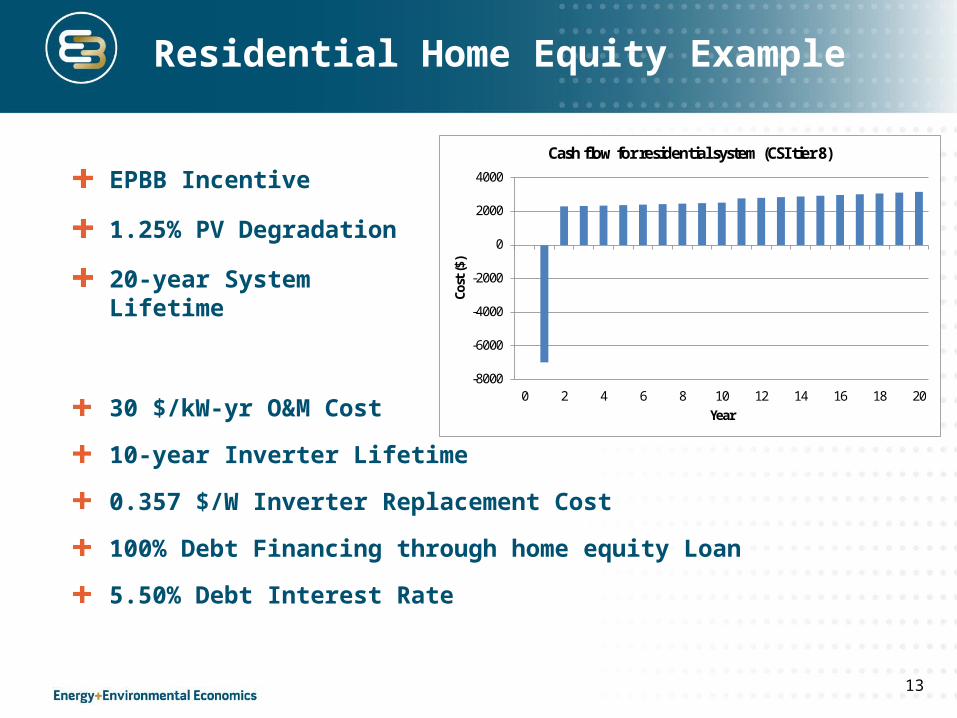
Residential Home Equity Example
EPBB Incentive
1.25% PV Degradation
20-year System Lifetime
13
-8000
-6000
-4000
-2000
0
2000
4000
0 2 4 6 8 10 12 14 16 18 20
Cost
($)
Year
Cash flow for residential system (CSI tier 8)
30 $/kW-yr O&M Cost
10-year Inverter Lifetime
0.357 $/W Inverter Replacement Cost
100% Debt Financing through home equity Loan
5.50% Debt Interest Rate
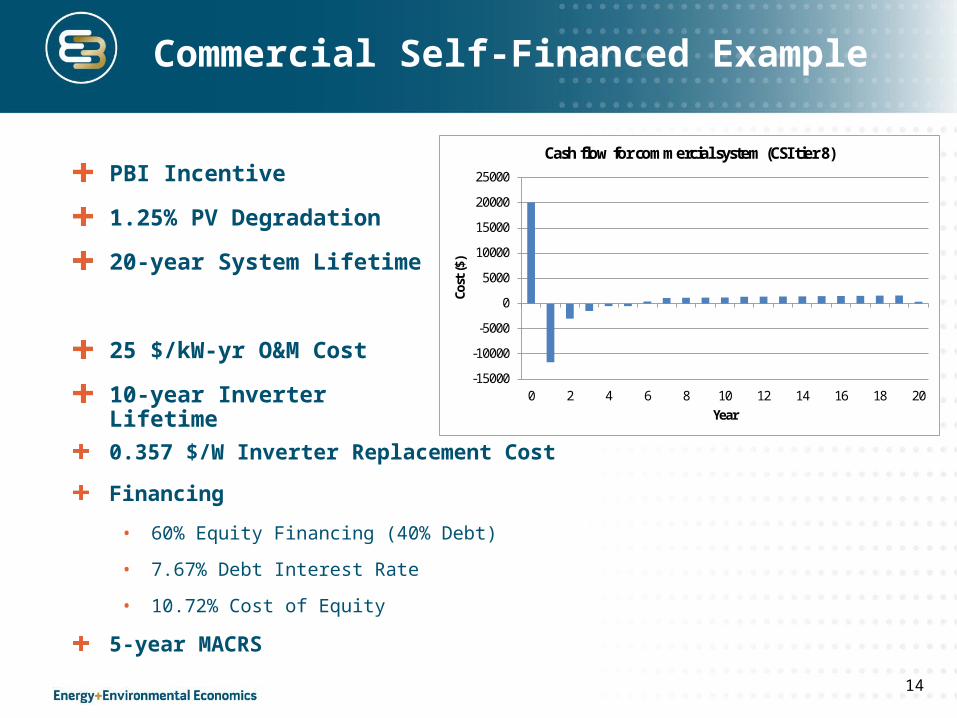
Commercial Self-Financed Example
PBI Incentive
1.25% PV Degradation
20-year System Lifetime
25 $/kW-yr O&M Cost
10-year Inverter Lifetime
14
-15000
-10000
-5000
0
5000
10000
15000
20000
25000
0 2 4 6 8 10 12 14 16 18 20
Cost
($)
Year
Cash flow for commercial system (CSI tier 8)
0.357 $/W Inverter Replacement Cost
Financing
• 60% Equity Financing (40% Debt)
• 7.67% Debt Interest Rate
• 10.72% Cost of Equity
5-year MACRS

Converting Upfront Cost to NPV$
Ratios to Estimate NPV $ from Installed Cost
Example for Step 1 in Estimating LCOE for Self-financed systems without 3rd Party Ownership
• Installed Cost = $8/W, 1kW, Residential Tier 10
• $8/W * 0.59 = NPV $ 4.72/W
15
Residential Home EquityCSI Tier NPV / Installed Cost
2 0.463 0.474 0.495 0.516 0.547 0.568 0.589 0.58
10 0.59
Commercial Self-FinancedCSI Tier NPV / Installed Cost
2 0.163 0.204 0.255 0.286 0.327 0.378 0.409 0.41
10 0.41
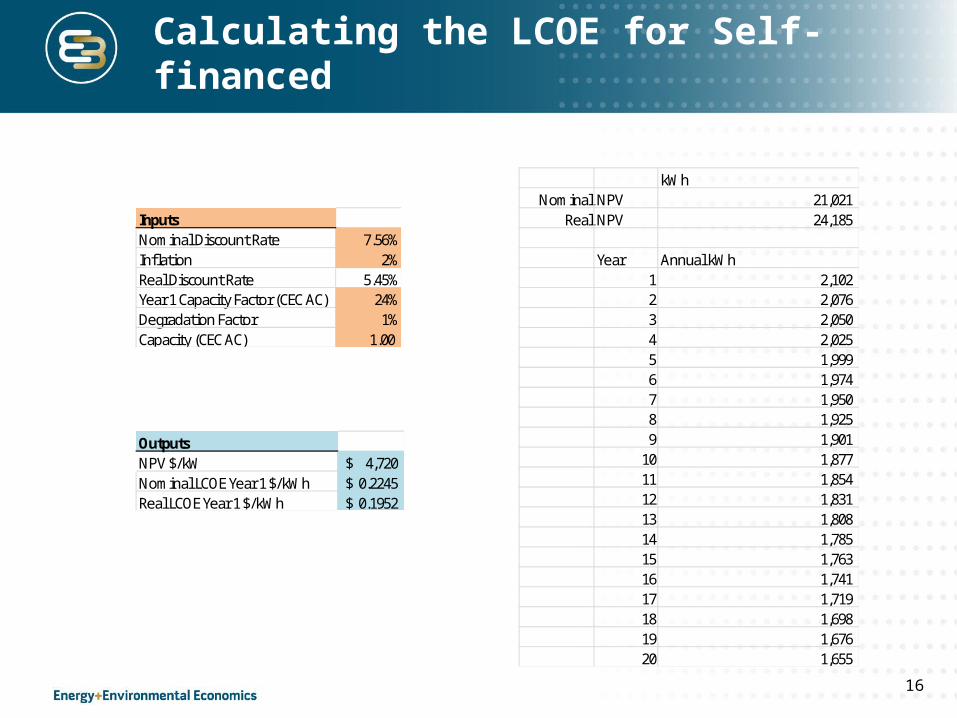
Calculating the LCOE for Self-financed
16
kWhNominal NPV 21,021
Real NPV 24,185
Year Annual kWh1 2,102 2 2,076 3 2,050 4 2,025 5 1,999 6 1,974 7 1,950 8 1,925 9 1,901
10 1,877 11 1,854 12 1,831 13 1,808 14 1,785 15 1,763 16 1,741 17 1,719 18 1,698 19 1,676 20 1,655
OutputsNPV $/kW 4,720$ Nominal LCOE Year 1 $/kWh 0.2245$ Real LCOE Year 1 $/kWh 0.1952$
InputsNominal Discount Rate 7.56%Inflation 2%Real Discount Rate 5.45%Year 1 Capacity Factor (CEC AC) 24%Degradation Factor 1%Capacity (CEC AC) 1.00
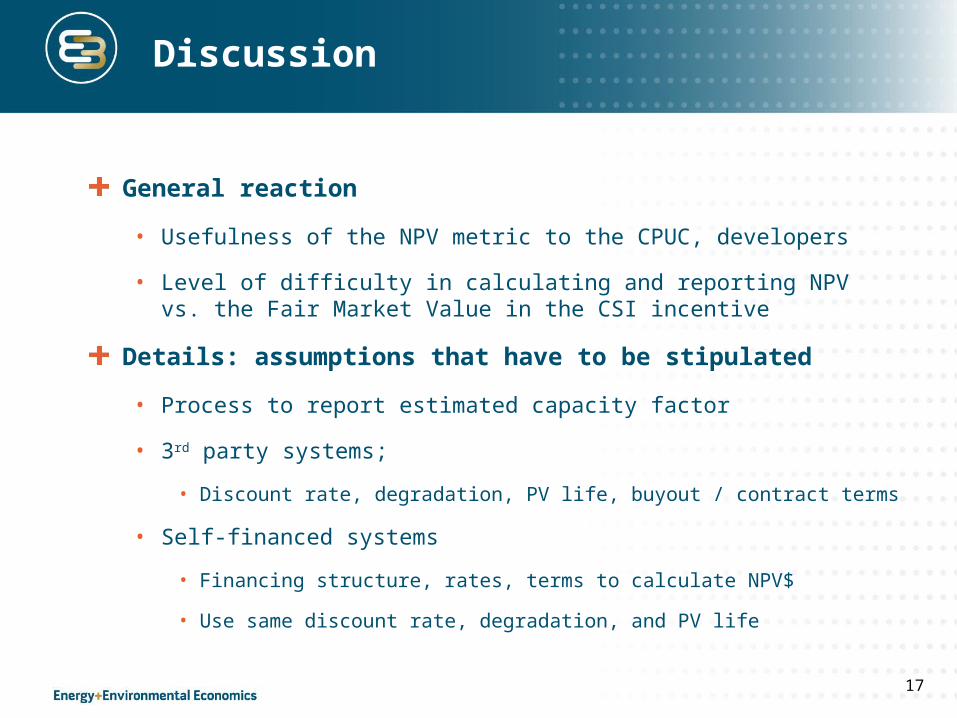
Discussion
General reaction
• Usefulness of the NPV metric to the CPUC, developers
• Level of difficulty in calculating and reporting NPV vs. the Fair Market Value in the CSI incentive
Details: assumptions that have to be stipulated
• Process to report estimated capacity factor
• 3rd party systems;
• Discount rate, degradation, PV life, buyout / contract terms
• Self-financed systems
• Financing structure, rates, terms to calculate NPV$
• Use same discount rate, degradation, and PV life
17
Thank you
Contact:
Snuller Price, [email protected]
Michael King, Senior [email protected]
Energy and Environmental Economics, Inc.101 Montgomery Street, San Francisco, CA 94104(415) 391 – 5100