cowen and company 5th annual ultimate energy...
TRANSCRIPT

Jenniffer Deckard, President and Chief Executive Officer
Mark Barrus, Interim Chief Financial Officer
Sharon VanZeeland, Vice President, Investor Relations & Business Development
Cowen and Company
5th Annual Ultimate Energy Conference
December 2, 2015
Forward-Looking Statements and Non-GAAP Financial Measures
This presentation contains forward-looking statements. These statements can be identified by the use of forward-looking terminology including “will,”
“may,” “believe,” “expect,” “anticipate,” “estimate,” “continue,” or other similar words. These statements discuss future expectations including company
growth expectations, demand for our products, capacity expansion plans, market trends, commercial product launches and research and development
plans and may contain projections of financial condition or of results of operations, or state other “forward-looking” information. These forward-looking
statements involve risks and uncertainties. Many of these risks are beyond management’s control. When considering these forward-looking
statements, you should keep in mind the risk factors, Management’s Discussion and Analysis of Financial Condition and Results of Operations, and
other cautionary statements in the company’s SEC filings. Forward-looking statements are not guarantees of future performance or an assurance that
our current assumptions or projections are valid. Our actual results and plans could differ materially from those expressed in any forward-looking
statements. We undertake no obligation to publicly update any forward-looking statements, whether as a result of new information or future events,
except as required by law.
This presentation includes certain non-GAAP financial measures, including EBITDA, Adjusted EBITDA and Adjusted EPS, and Adjusted Diluted EPS.
These non-GAAP financial measures are used as supplemental financial measures by our management to evaluate our operating performance and
compare the results of our operations from period to period without regard to the impact of our financing methods, capital structure or non-operating
income and expenses. Adjusted EBITDA is also used by our lenders to evaluate our compliance with covenants. We believe that these measures are
meaningful to our investors to enhance their understanding of our financial performance. These measures should be considered supplemental to and
not a substitute for financial information prepared in accordance with GAAP and may differ from similarly titled measures used by other companies. For
a reconciliation of such measures to the most directly comparable GAAP term, please see the slides 21-23 of this presentation.
2
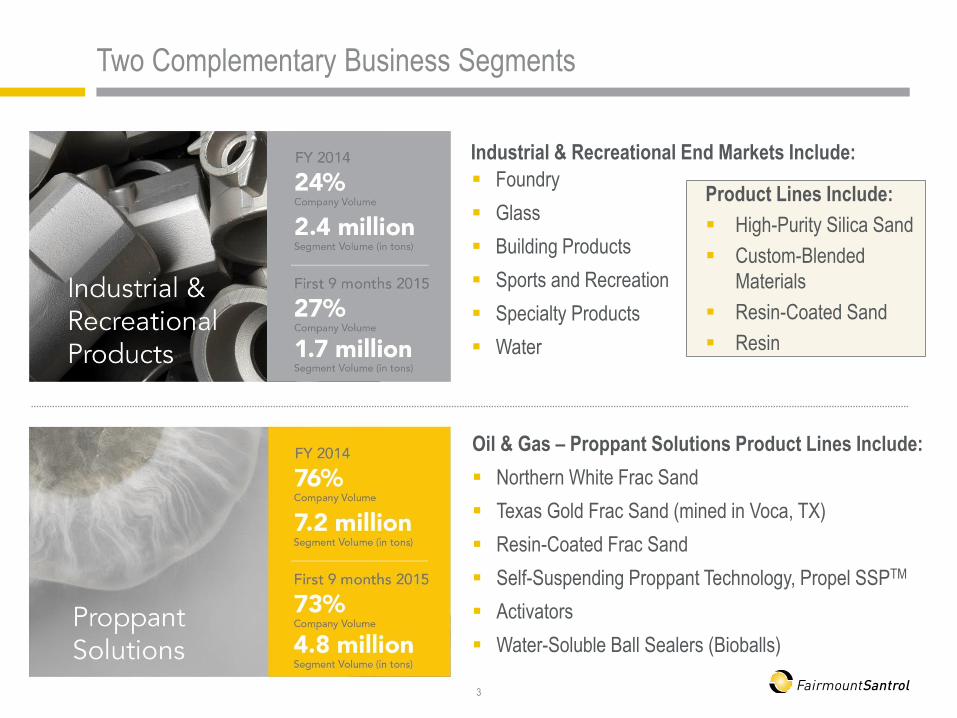
Two Complementary Business Segments
Oil & Gas – Proppant Solutions Product Lines Include:
Northern White Frac Sand
Texas Gold Frac Sand (mined in Voca, TX)
Resin-Coated Frac Sand
Self-Suspending Proppant Technology, Propel SSPTM
Activators
Water-Soluble Ball Sealers (Bioballs)
Industrial & Recreational End Markets Include:
Foundry
Glass
Building Products
Sports and Recreation
Specialty Products
Water
Product Lines Include:
High-Purity Silica Sand
Custom-Blended
Materials
Resin-Coated Sand
Resin
3
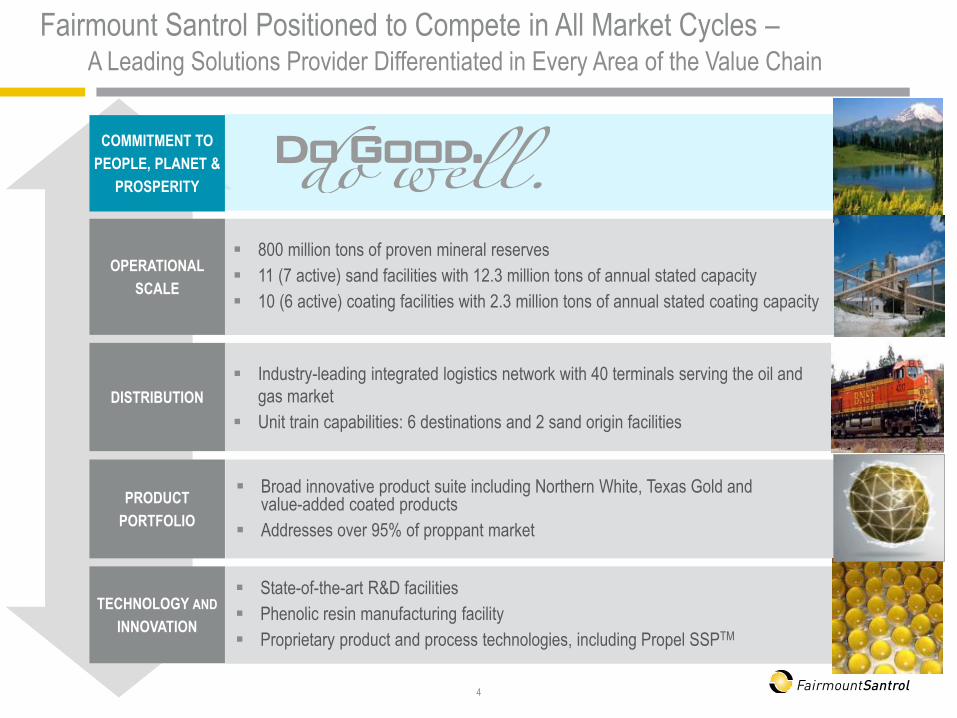
Industry-leading integrated logistics network with 40 terminals serving the oil and
gas market
Unit train capabilities: 6 destinations and 2 sand origin facilities
State-of-the-art R&D facilities
Phenolic resin manufacturing facility
Proprietary product and process technologies, including Propel SSPTM
800 million tons of proven mineral reserves
11 (7 active) sand facilities with 12.3 million tons of annual stated capacity
10 (6 active) coating facilities with 2.3 million tons of annual stated coating capacity
Broad innovative product suite including Northern White, Texas Gold and value-added coated products
Addresses over 95% of proppant market
Fairmount Santrol Positioned to Compete in All Market Cycles – A Leading Solutions Provider Differentiated in Every Area of the Value Chain
OPERATIONAL
SCALE
PRODUCT
PORTFOLIO
TECHNOLOGY AND
INNOVATION
COMMITMENT TO
PEOPLE, PLANET &
PROSPERITY
DISTRIBUTION
4
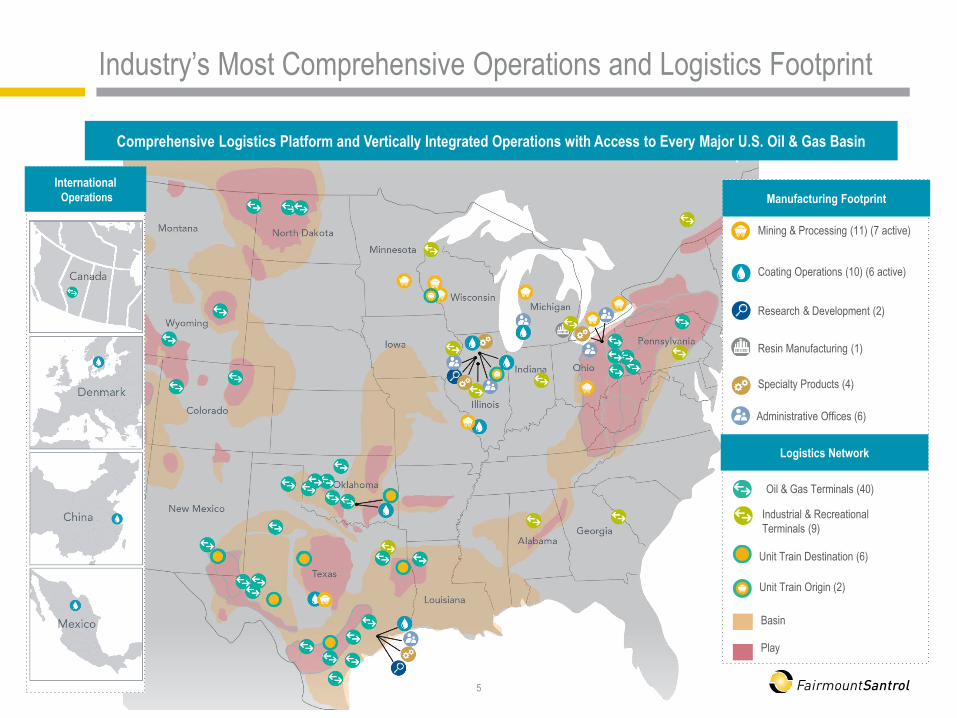
Industry’s Most Comprehensive Operations and Logistics Footprint
5
Comprehensive Logistics Platform and Vertically Integrated Operations with Access to Every Major U.S. Oil & Gas Basin
Coating Operations (10) (6 active)
Mining & Processing (11) (7 active)
Research & Development (2)
Resin Manufacturing (1)
Specialty Products (4)
Basin
Play
Oil & Gas Terminals (40)
Unit Train Destination (6)
Manufacturing Footprint
Logistics Network
Industrial & Recreational
Terminals (9)
Unit Train Origin (2)
Administrative Offices (6)
International Operations
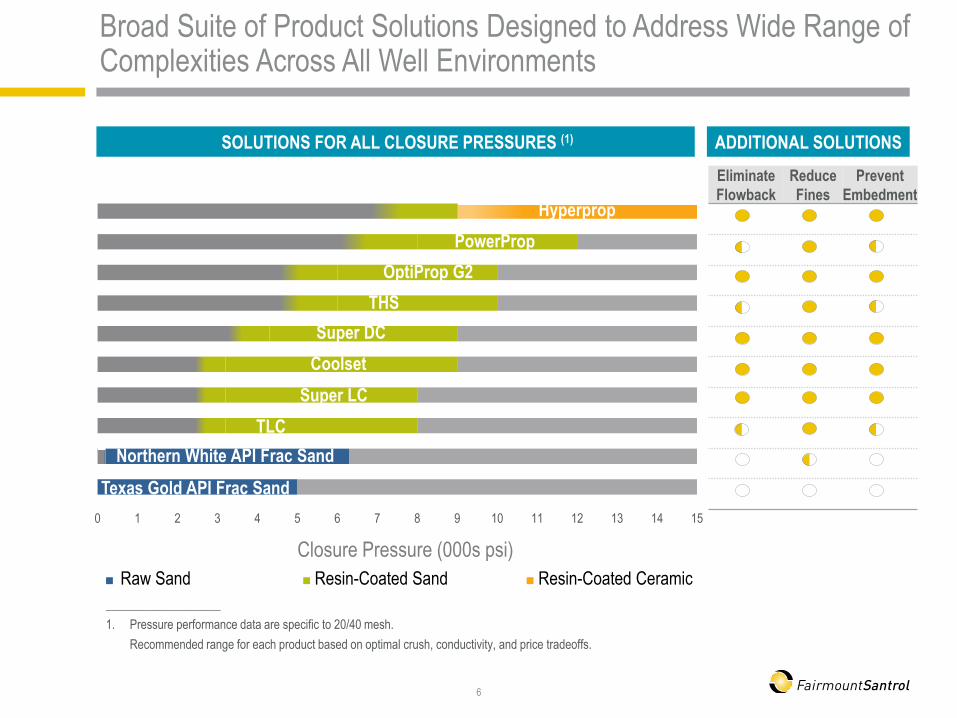
Super LC
Coolset
OptiProp G2
PowerProp
Hyperprop
0 1 2 3 4 5 6 7 8 9 10 11 12 13 14 15
Closure Pressure (000s psi)
THS
Super DC
SOLUTIONS FOR ALL CLOSURE PRESSURES (1)
_____________________
1. Pressure performance data are specific to 20/40 mesh.
Recommended range for each product based on optimal crush, conductivity, and price tradeoffs.
Northern White API Frac Sand
Texas Gold API Frac Sand
Raw Sand Resin-Coated Sand Resin-Coated Ceramic
ADDITIONAL SOLUTIONS
Eliminate
Flowback
Reduce
Fines
Prevent
Embedment
Broad Suite of Product Solutions Designed to Address Wide Range of Complexities Across All Well Environments
6
TLC

2015-2016: Proppant Intensity Continues to Increase
7
___________________________
Sources Include public E&P presentations, internal estimates and order flow analysis
PacWest Consulting Partners The Freedonia Group
Stages Per Foot ~+10%
Proppant Per Stage ~+10%
Lateral Length
Wells per Rig
Proppant
Intensity
+20-25%
Rig Efficiencies Drilling Hours/Rig
Proppant Driver Expectations:
Lower rig counts
Greater rig efficiencies offset by
fewer hours per rig
= Flat wells per rig… but when market
rebounds, expect increasing well
count and proppant per rig as rig
utilization increases
Flat lateral length
Increased stages/foot (up ~10%)
Increased proppant/stage (up ~10%)
= Proppant intensity up 20 to 25%
2,300
2,700
3,400
4,300
Average Proppant Tons/ US Horizontal Well
1Q 2014 4Q 2014
4Q 2015 4Q 2016
+26% additional
anticipated increase
7
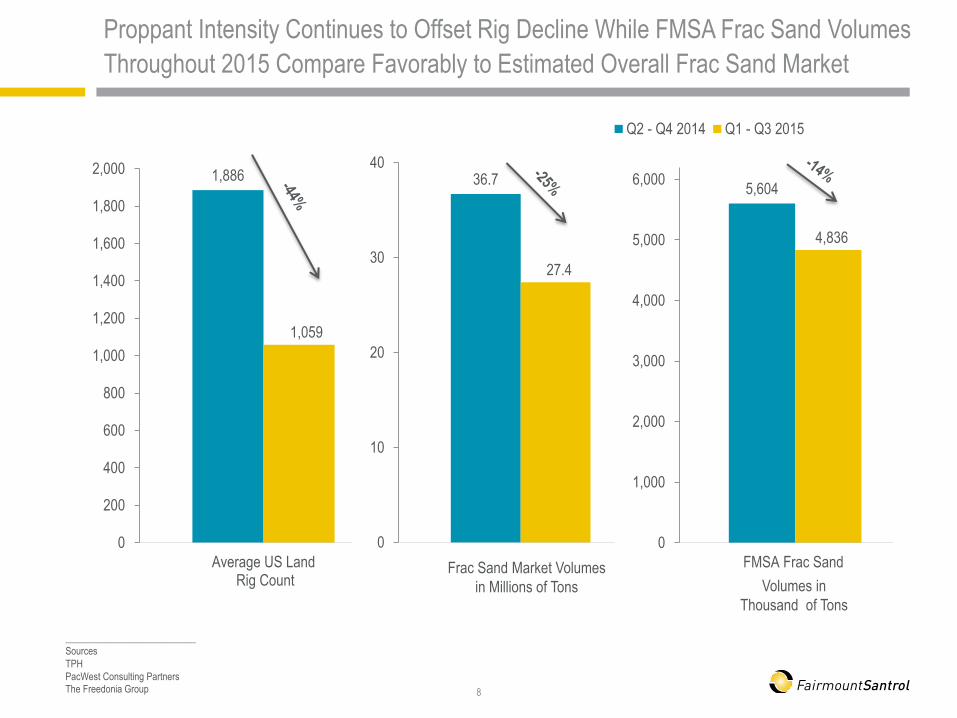
1,886
1,059
0
200
400
600
800
1,000
1,200
1,400
1,600
1,800
2,000
Average US Land Rig Count
Q2 - Q4 2014 Q1 - Q3 2015
36.7
27.4
0
10
20
30
40
5,604
4,836
0
1,000
2,000
3,000
4,000
5,000
6,000
FMSA Frac Sand
Proppant Intensity Continues to Offset Rig Decline While FMSA Frac Sand Volumes
Throughout 2015 Compare Favorably to Estimated Overall Frac Sand Market
Frac Sand Market Volumes
in Millions of Tons
___________________________
Sources
TPH
PacWest Consulting Partners
The Freedonia Group 8
Volumes in
Thousand of Tons
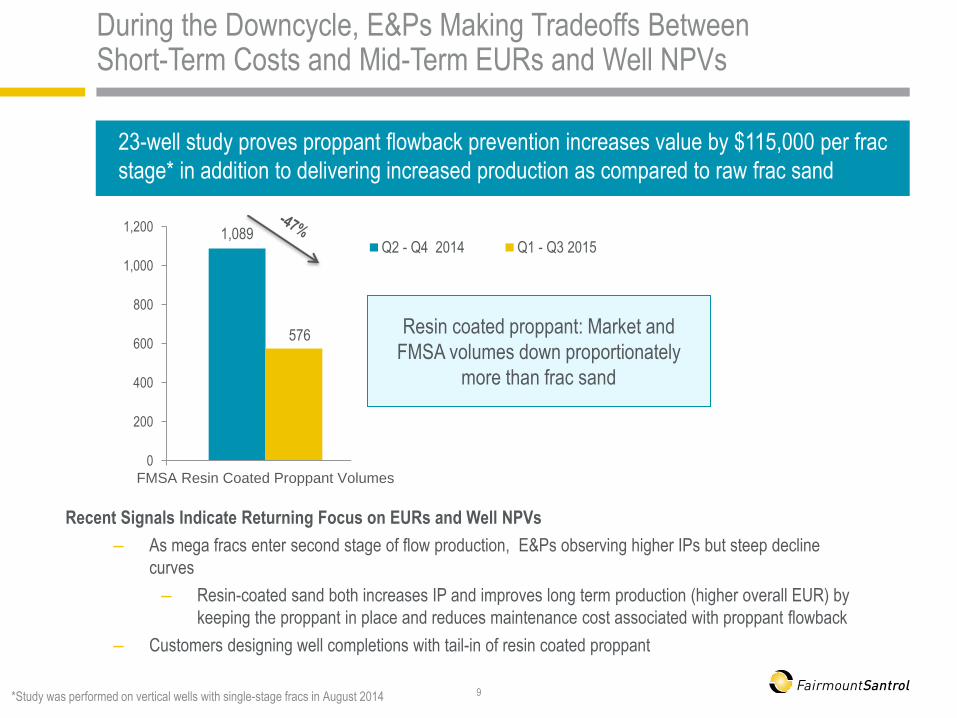
*Study was performed on vertical wells with single-stage fracs in August 2014
Resin coated proppant: Market and
FMSA volumes down proportionately
more than frac sand
During the Downcycle, E&Ps Making Tradeoffs Between Short-Term Costs and Mid-Term EURs and Well NPVs
Recent Signals Indicate Returning Focus on EURs and Well NPVs
– As mega fracs enter second stage of flow production, E&Ps observing higher IPs but steep decline
curves
– Resin-coated sand both increases IP and improves long term production (higher overall EUR) by
keeping the proppant in place and reduces maintenance cost associated with proppant flowback
– Customers designing well completions with tail-in of resin coated proppant
1,089
576
0
200
400
600
800
1,000
1,200
FMSA Resin Coated Proppant Volumes
Q2 - Q4 2014 Q1 - Q3 2015
23-well study proves proppant flowback prevention increases value by $115,000 per frac
stage* in addition to delivering increased production as compared to raw frac sand
9
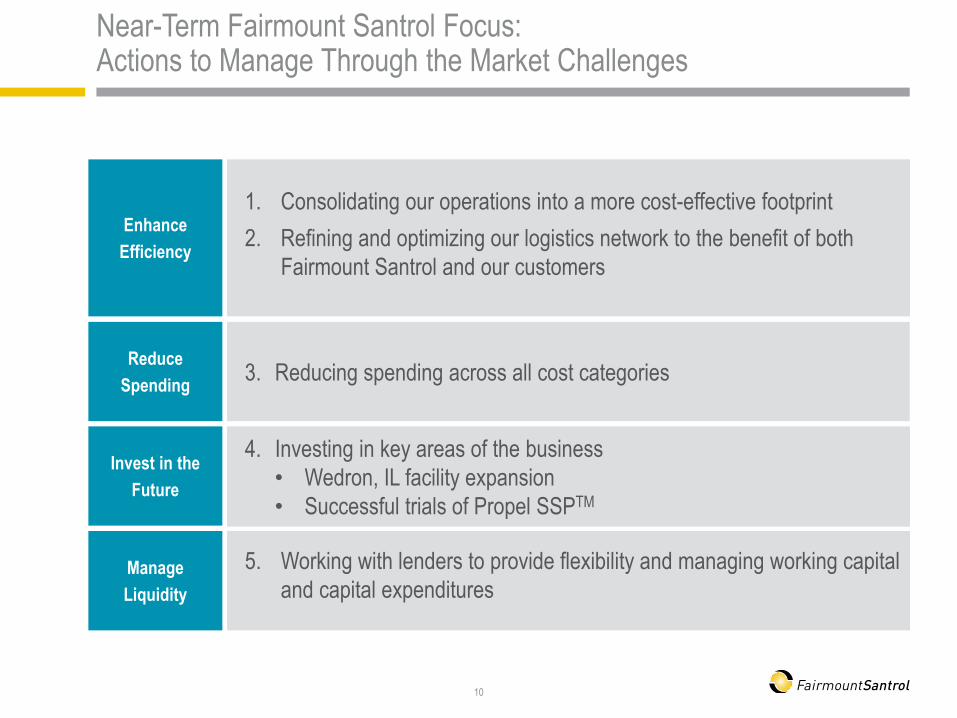
Near-Term Fairmount Santrol Focus: Actions to Manage Through the Market Challenges
10
1. Consolidating our operations into a more cost-effective footprint
2. Refining and optimizing our logistics network to the benefit of both
Fairmount Santrol and our customers
3. Reducing spending across all cost categories
4. Investing in key areas of the business
• Wedron, IL facility expansion
• Successful trials of Propel SSPTM
5. Working with lenders to provide flexibility and managing working capital
and capital expenditures
Enhance
Efficiency
Reduce
Spending
Invest in the
Future
Manage
Liquidity
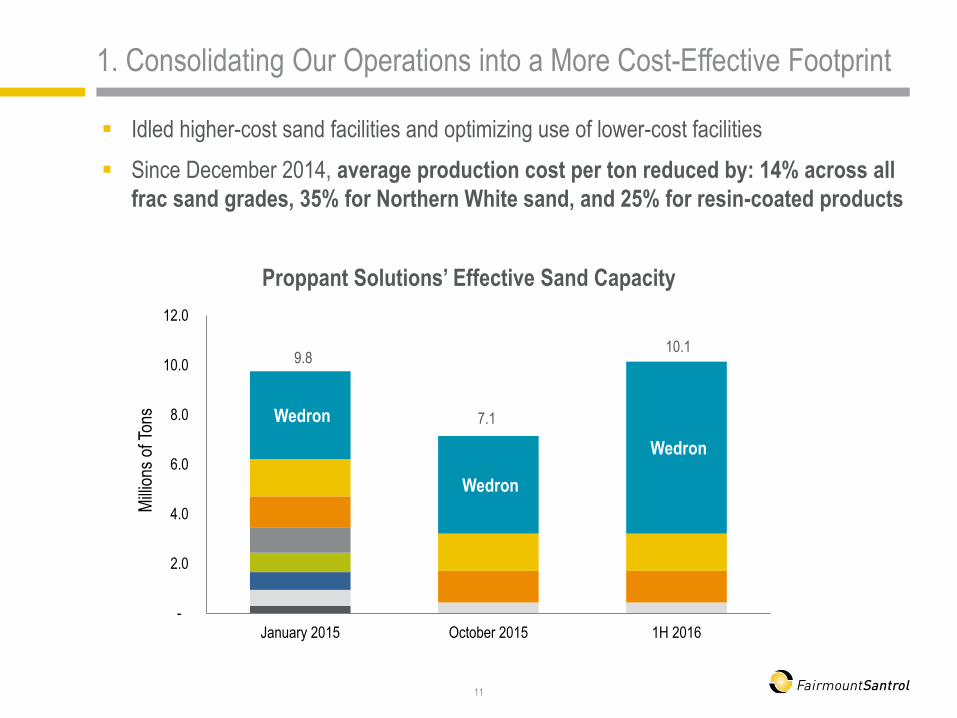
1. Consolidating Our Operations into a More Cost-Effective Footprint
Idled higher-cost sand facilities and optimizing use of lower-cost facilities
Since December 2014, average production cost per ton reduced by: 14% across all
frac sand grades, 35% for Northern White sand, and 25% for resin-coated products
11
Wedron
Wedron
Wedron
-
2.0
4.0
6.0
8.0
10.0
12.0
January 2015 October 2015 1H 2016
Mill
ions
of T
ons
9.8
7.1
10.1
Proppant Solutions’ Effective Sand Capacity
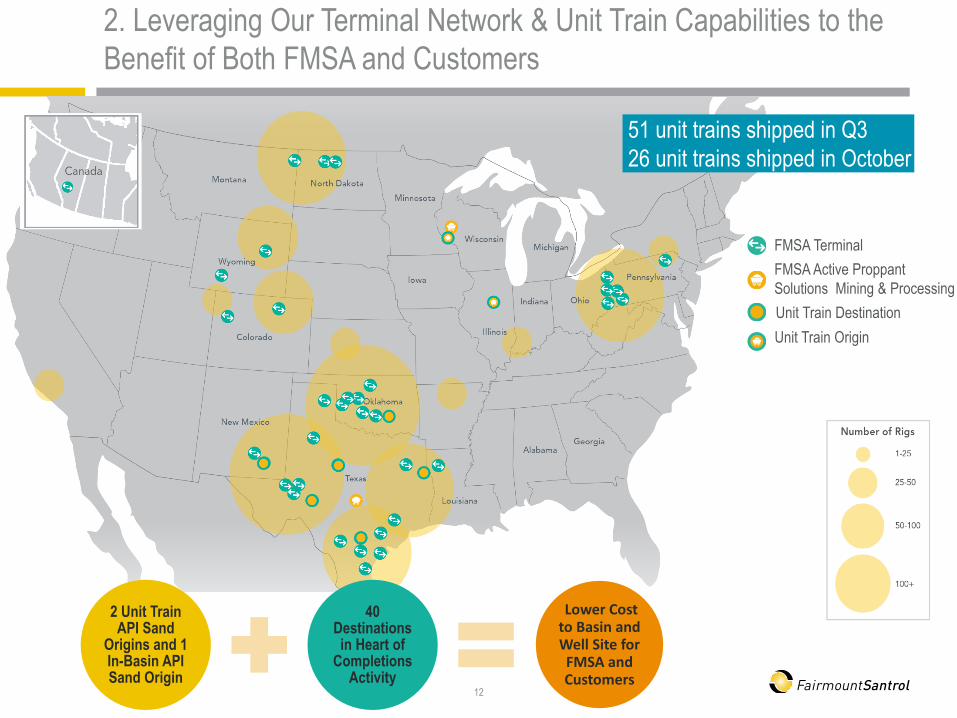
FMSA Terminal
FMSA Active Proppant
Solutions Mining & Processing
Unit Train Destination
Unit Train Origin
2 Unit Train API Sand
Origins and 1 In-Basin API Sand Origin
40 Destinations in Heart of
Completions Activity
Lower Cost to Basin and Well Site for FMSA and Customers
2. Leveraging Our Terminal Network & Unit Train Capabilities to the
Benefit of Both FMSA and Customers
12
51 unit trains shipped in Q3
26 unit trains shipped in October
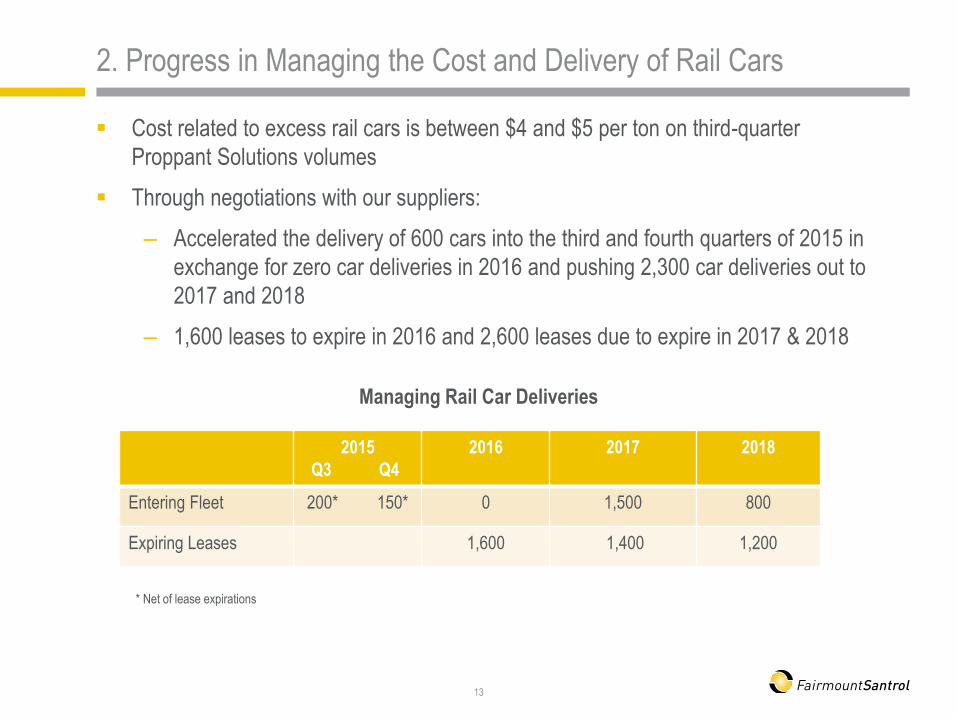
2. Progress in Managing the Cost and Delivery of Rail Cars
Cost related to excess rail cars is between $4 and $5 per ton on third-quarter
Proppant Solutions volumes
Through negotiations with our suppliers:
– Accelerated the delivery of 600 cars into the third and fourth quarters of 2015 in
exchange for zero car deliveries in 2016 and pushing 2,300 car deliveries out to
2017 and 2018
– 1,600 leases to expire in 2016 and 2,600 leases due to expire in 2017 & 2018
13
Managing Rail Car Deliveries
2015
Q3 Q4
2016 2017 2018
Entering Fleet 200* 150* 0 1,500 800
Expiring Leases 1,600 1,400 1,200
* Net of lease expirations
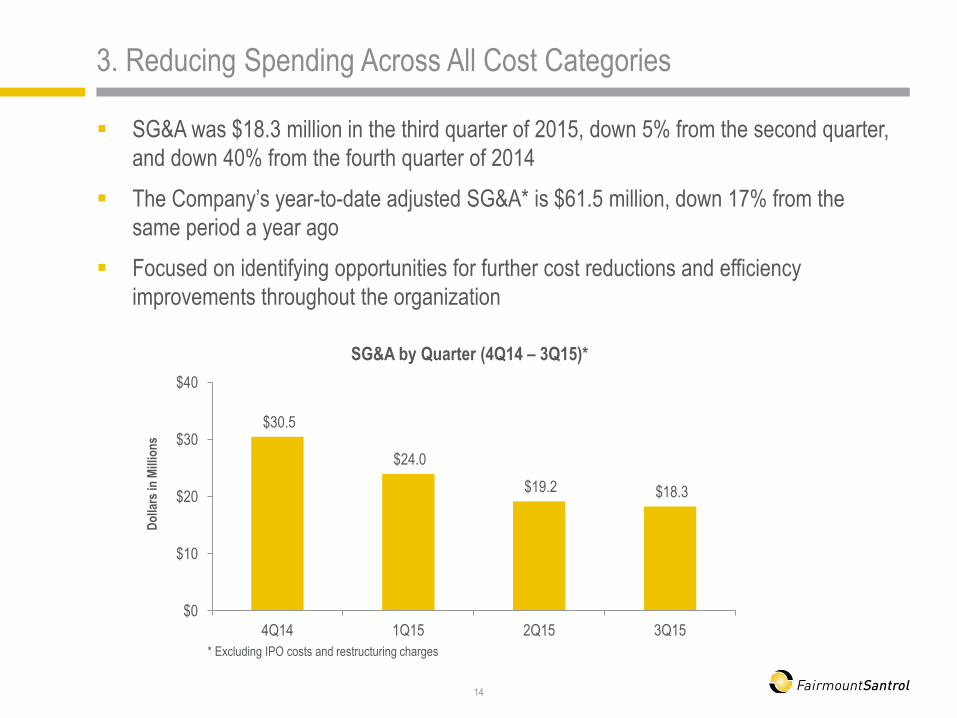
3. Reducing Spending Across All Cost Categories
SG&A was $18.3 million in the third quarter of 2015, down 5% from the second quarter,
and down 40% from the fourth quarter of 2014
The Company’s year-to-date adjusted SG&A* is $61.5 million, down 17% from the
same period a year ago
Focused on identifying opportunities for further cost reductions and efficiency
improvements throughout the organization
14
$30.5
$24.0
$19.2 $18.3
$0
$10
$20
$30
$40
4Q14 1Q15 2Q15 3Q15
SG&A by Quarter (4Q14 – 3Q15)*
Do
llars
in M
illio
ns
* Excluding IPO costs and restructuring charges
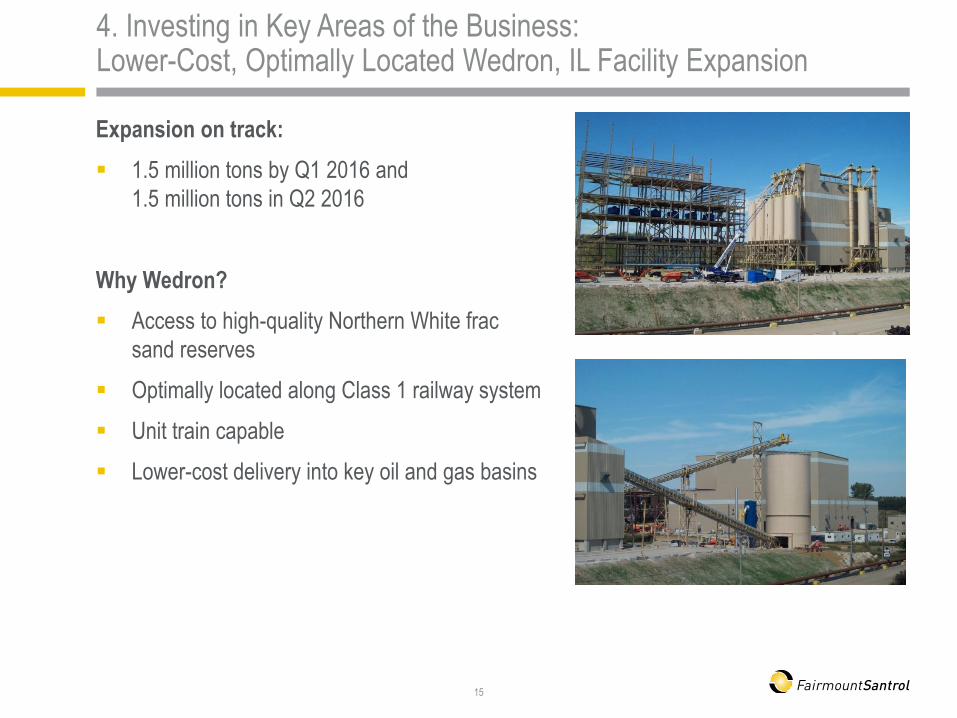
4. Investing in Key Areas of the Business: Lower-Cost, Optimally Located Wedron, IL Facility Expansion
Expansion on track:
1.5 million tons by Q1 2016 and
1.5 million tons in Q2 2016
Why Wedron?
Access to high-quality Northern White frac
sand reserves
Optimally located along Class 1 railway system
Unit train capable
Lower-cost delivery into key oil and gas basins
15
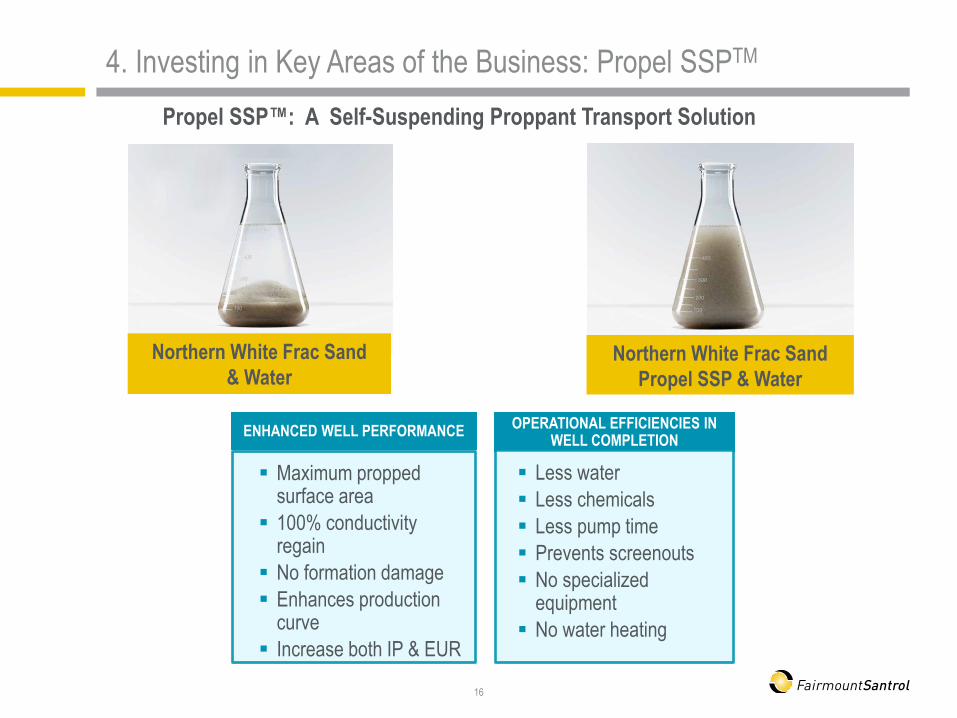
ENHANCED WELL PERFORMANCE
Maximum propped surface area
100% conductivity regain
No formation damage
Enhances production curve
Increase both IP & EUR
OPERATIONAL EFFICIENCIES IN WELL COMPLETION
Less water
Less chemicals
Less pump time
Prevents screenouts
No specialized equipment
No water heating
4. Investing in Key Areas of the Business: Propel SSPTM
16
Propel SSP™: A Self-Suspending Proppant Transport Solution
Northern White Frac Sand
& Water Northern White Frac Sand
Propel SSP & Water

Customer Adoption
Multiple customers plan to continue use of Propel SSP™ through 2016
Backed by Results of Recent Six-Well Field Trial in North Dakota’s Williston Basin
Increased 90-day cumulative oil production 39% compared with the geologic
offset wells
Specifically, in areas with lower porosity and permeability, production improved
more than 80%
Improved efficiency by not requiring fluid heating at 35° F and above
4. Increased Production and Operational Efficiency Drive Customer Adoption of Propel SSP™
17
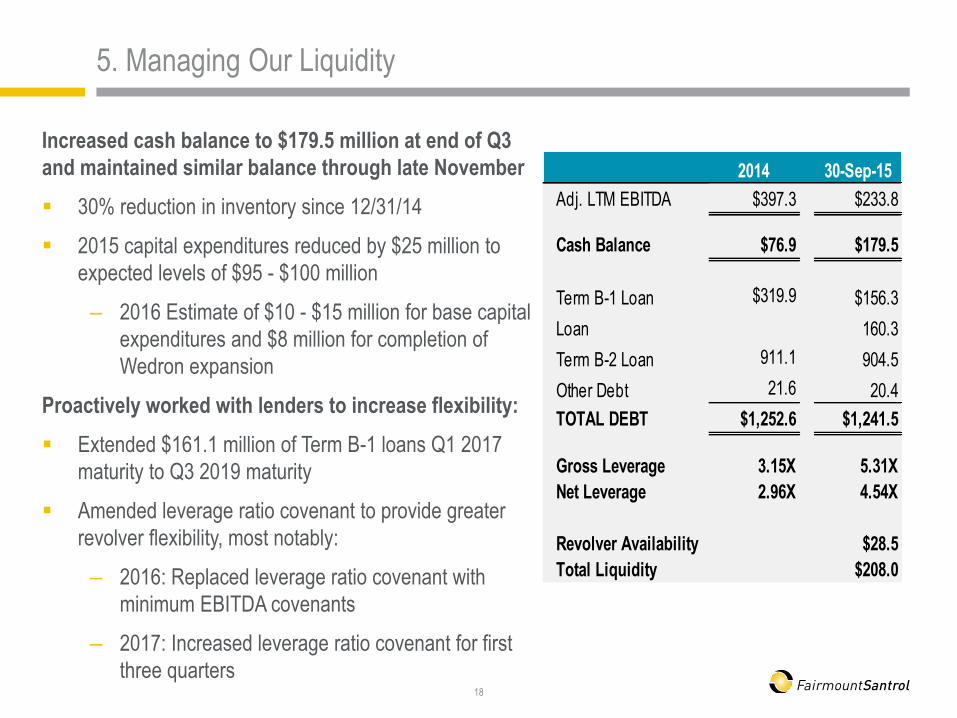
5. Managing Our Liquidity
Increased cash balance to $179.5 million at end of Q3
and maintained similar balance through late November
30% reduction in inventory since 12/31/14
2015 capital expenditures reduced by $25 million to
expected levels of $95 - $100 million
– 2016 Estimate of $10 - $15 million for base capital
expenditures and $8 million for completion of
Wedron expansion
Proactively worked with lenders to increase flexibility:
Extended $161.1 million of Term B-1 loans Q1 2017
maturity to Q3 2019 maturity
Amended leverage ratio covenant to provide greater
revolver flexibility, most notably:
– 2016: Replaced leverage ratio covenant with
minimum EBITDA covenants
– 2017: Increased leverage ratio covenant for first
three quarters
18
2014 30-Sep-15
Adj. LTM EBITDA $397.3 $233.8
Cash Balance $76.9 $179.5
Term B-1 Loan $319.9 $156.3 Extended Term B-1
Loan 160.3
Term B-2 Loan 911.1 904.5
Other Debt 21.6 20.4
TOTAL DEBT $1,252.6 $1,241.5
Gross Leverage 3.15X 5.31X
Net Leverage 2.96X 4.54X
Revolver Availability $28.5
Total Liquidity $208.0

Scalability and flexibility of
sand and valued added
coated product offerings to
match market needs
Advantaged distribution
network with key unit train
origins and destinations
Fairmount Santrol Positioned to Compete in All Market Cycles – A Leading Solutions Provider Differentiated in Every Area of the Value Chain
19
OPERATIONAL
SCALE
PRODUCT
PORTFOLIO
TECHNOLOGY AND
INNOVATION
COMMITMENT TO
PEOPLE, PLANET &
PROSPERITY
DISTRIBUTION
Tightly managing costs
and efficiencies in the
near-term
Selectively investing in
key areas that will best
position us today and for
the eventual recovery
Proactively managing
our liquidity and debt
structure
Enhance
Efficiency
Reduce
Spending
Invest in the
Future
Manage
Liquidity
Short to Mid-term Focus in Downcycle Customers Value our
Differentiated Business Model

Thank You & Questions
www.FairmountSantrol.com
20

Appendix: Reconciliation of Non-GAAP Financial Measures
21

Appendix: Reconciliation of Non-GAAP Financial Measures
22
Appendix: Reconciliation of Non-GAAP Financial Measures
23
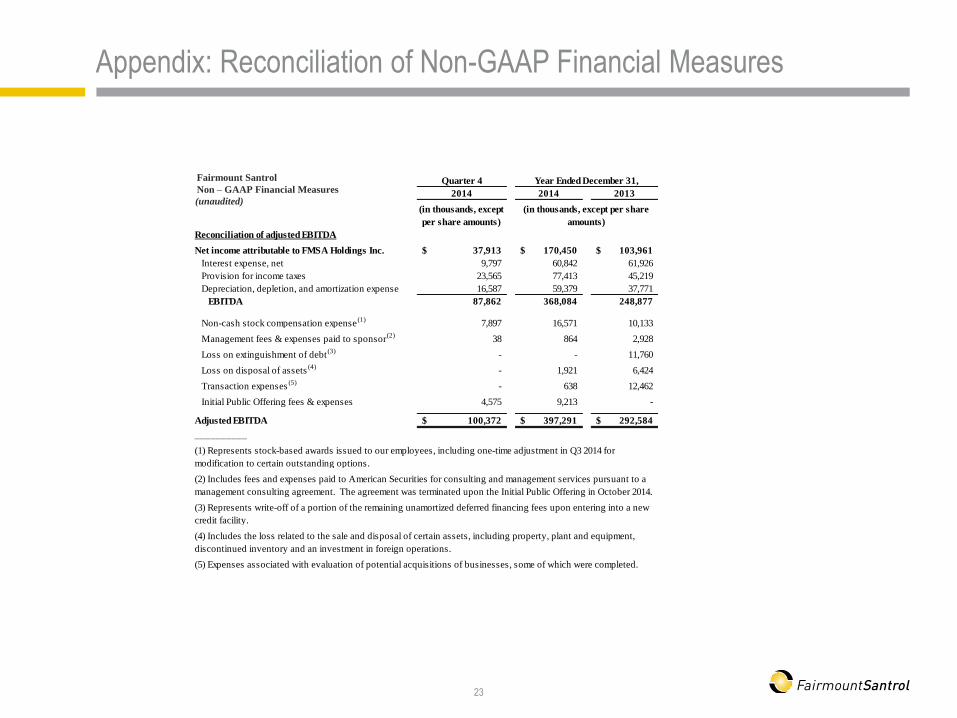
Quarter 4
2014 2014 2013
Reconciliation of adjusted EBITDA
Net income attributable to FMSA Holdings Inc. 37,913$ 170,450$ 103,961$
Interest expense, net 9,797 60,842 61,926
Provision for income taxes 23,565 77,413 45,219
Depreciation, depletion, and amortization expense 16,587 59,379 37,771
EBITDA 87,862 368,084 248,877
Non-cash stock compensation expense(1)
7,897 16,571 10,133
Management fees & expenses paid to sponsor(2)
38 864 2,928
Loss on extinguishment of debt(3)
- - 11,760
Loss on disposal of assets(4)
- 1,921 6,424
Transaction expenses(5)
- 638 12,462
Initial Public Offering fees & expenses 4,575 9,213 -
Adjusted EBITDA 100,372$ 397,291$ 292,584$
__________
(5) Expenses associated with evaluation of potential acquisitions of businesses, some of which were completed.
(4) Includes the loss related to the sale and disposal of certain assets, including property, plant and equipment,
discontinued inventory and an investment in foreign operations.
(in thousands, except
per share amounts)
(in thousands, except per share
amounts)
Year Ended December 31,
(3) Represents write-off of a portion of the remaining unamortized deferred financing fees upon entering into a new
credit facility.
(1) Represents stock-based awards issued to our employees, including one-time adjustment in Q3 2014 for
modification to certain outstanding options.
(2) Includes fees and expenses paid to American Securities for consulting and management services pursuant to a
management consulting agreement. The agreement was terminated upon the Initial Public Offering in October 2014.
(unaudited)
Fairmount Santrol
Non – GAAP Financial Measures