cover photograph courtesy of lionel kinadjian · cover photograph courtesy of lionel kinadjian....
TRANSCRIPT
FAO SmartFish Publication 09
Lionel Kinadjian
BIOECONOMIC ANALYSIS OF THE KAPENTA FISHERIES
LAKE KARIBA - ZIMBABWE & ZAMBIA

Cover photograph courtesy of Lionel Kinadjian
REPORT/RAPPORT: SF-FAO/2012/09
Bioeconomic Analysis of the Kapenta Fisheries
Lake Kariba
Zimbabwe & Zambia
GCP/RAF/466/EC SmartFish Project
The designations employed and the presentation of material in this
information product do not imply the expression of any opinion
whatsoever on the part of the Food and Agriculture Organization of the
United Nations (FAO) concerning the legal or development status of any
country, territory, city or area or of its authorities, or concerning the
delimitation of its frontiers or boundaries. The mention of specific
companies or products of manufacturers, whether or not these have
been patented, does not imply that these have been endorsed or
recommended by FAO in preference to others of a similar nature that
are not mentioned.
The views expressed in this information product are those of the
author(s) and do not necessarily reflect the views or policies of FAO.
The contents of this publication are the sole responsibility of the
author(s) and can in no way be taken to reflect the views of the
European Union
© FAO 2012
FAO encourages the use, reproduction and dissemination of material in
this information product. Except where otherwise indicated, material
may be copied, downloaded and printed for private study, research and
teaching purposes, or for use in non-commercial products or services,
provided that appropriate acknowledgement of FAO as the source and
copyright holder is given and that FAO’s endorsement of users’ views,
products or services is not implied in any way.
All requests for translation and adaptation rights, and for resale and
other commercial use rights should be made via www.fao.org/contact-
us/licence-request or addressed to [email protected].
FAO information products are available on the FAO website
(www.fao.org/publications) and can be purchased through publications-
For more information, please contact [email protected].
Kinadjian, Lionel 2012. Bioeconomic Analysis of the Kapenta Fisheries. Mission Report
No.1. Report/Rapport: SF-FAO/2012/09. FAO-SmartFish Programme of the Indian Ocean
Commission, Ebene, Mauritius.
3
Executive summary
FAO supports a joint management process and the development of fisheries on Lake
Kariba between Zimbabwe and Zambia. The 4th Technical Consultation Meeting, held in
Kariba in 2010, recommended the development of bioeconomic modelling of Kapenta
fishery (Limnothrissa miodon).
In support of this recommendation, a first field mission was conducted in November 2012
with the support of the SmartFish project. The objective of this mission was to meet with
key stakeholders in the public and private sectors involved in the Kapenta fishery in the
two countries in order to:
inform them about the bioeconomic assessment exercise to be carried out on the
Kapenta fishery;
underline the importance of their collaboration, in particular the provision of
reliable data to fit the model;
find out more about the Kapenta fishery and current challenges;
gather key documents and information required for the bioeconomic modelling;
assess the quality of information requested for the bioeconomic modelling and
identify any gaps;
draft the Terms of Reference for National Consultants who will be responsible for
the collection of additional information after the mission.
Based on meetings with key officials in charge of the management of the fisheries and
with leaders of fishing enterprises in the two countries, the main results of the mission
indicate that:
The fishing capacities in the Kapenta fishery have greatly increased since the
early 2000s, from approximately 600 rigs allowed on the lake in 1999 to 1,098 in
2012 (5th Technical Consultation Meeting, 2012). There are also an unknown
number of unregistered and unlicensed rigs (illegal, unreported and unregulated
fishing);
The fishing effort, reported by the fishing companies, has subsequently increased
dramatically (40 percent increase between 2000 and 2011);
The management system in the two countries is based on a licensing system and
the payment of an annual fee for access to the fishery, as well as several technical
management measures (mesh size, zoning, and brief closures based on the lunar
calendar). The industry is also obliged to record and transfer to the management
authorities monthly data on their catch and fishing effort. In practice, it seems
that there are no real access controls and poor enforcement of regulations. Thus,
the fishery currently appears to be open and free for all.
4
The harvesting systems and the technical productivity of fleets in the two
countries are relatively homogeneous. Catches per unit of effort have fallen by 35
to 50 percent since 2005;
Qualitative indicators based on the situation of fishing enterprises show that the
Kapenta fishery is overfished and revenue from resources is widely dissipated;
Statistical data available on effort, catch and CPUE, as well as scientific knowledge
on biological parameters of the Kapenta stock suggest that only a biological
modelling based on a surplus production model (such as Schaeffer, Fox, etc.) is
possible;
There is an important shortage of economic data on time series concerning ex-
vessel prices, costs related to the activities of fishing enterprises, their
investment, and their profitability. Consequently, the work of two national
consultants to support this process will mainly be focused on the collection of
economic data in order to estimate an average cost per unit of effort (night fished
per rig) in each country and for each fishing zone.
Key documents for the bioeconomic modelling were collected before and during the
mission (or just after). A complete list of these documents can be found in Annex C.
These key documents and references will form the basis of bibliographical references for
the modelling exercise.
A questionnaire was developed to collect missing information for the bioeconomic
modelling exercise (Annex E). This information was obtained from a field survey and
from a sample of fishing companies of different sizes and operating in different fishing
areas (Basin/Stratum) in the two countries. A sampling plan was made on the basis of
data from the frame survey undertaken with FAO support in 2011. However, it is strongly
suggested that this economic fieldwork will be conducted in close cooperation with those
responsible for the Kapenta producer organizations in Zambia and Zimbabwe; on one
hand for the selection of those companies to be interviewed and to facilitate contacts,
and on the other hand, to ensure the quality of data to be collected and transmitted.
Forthcoming steps for the continuation of the process leading to the bio economic
modeling workshop were also defined, as well the format of the workshop.
5
Résumé exécutif
La FAO appuie un processus de développement et de gestion conjoint des pêcheries sur
le Lac Kariba entre le Zimbabwe et la Zambie. La 4ème réunion de Consultation technique
tenue à Kariba en 2010, a recommandé de réaliser un exercice de modélisation
bioéconomique de la pêcherie de Kapenta (Limnothrissa miodon).
En appui à cette recommandation, une première mission de terrain a été réalisée en
novembre 2012 avec le support du Projet SmartFish. L’objectif de cette mission était de
rencontrer les principales parties prenantes des secteurs public et privé impliqués dans la
pêcherie du Kapenta au niveau des deux pays afin de :
les informer de l'exercice d'évaluation bioéconomique qui sera réalisée sur les
pêches Kapenta ;
souligner l'importance de leur collaboration, en particulier la mise à disposition de
données fiables pour développer et ajuster un modèle ;
prendre connaissance de la situation de la pêcherie et de ses enjeux ;
recueillir les documents de référence et qui seront nécessaire pour la modélisation
bioéconomique clés ;
évaluer la qualité des informations demandées pour la modélisation
bioéconomique et d'identifier les lacunes ;
enfin rédiger les termes de référence des consultants nationaux qui seront
chargés de la collecte d'informations complémentaires après la mission
Sur la base des rencontres avec les principaux responsables en charge de la gestion de la
pêcherie et avec des dirigeants des entreprises de pêche dans les deux pays, les
principaux résultats de la mission indiquent que :
La pêcherie de Kapenta a connu un très fort niveau développement des capacités
de pêche depuis le début des années 2000, passant d’environ 600 plates-formes
autorisées sur le Lac en 1999 à environ 1098 en 2012 (5ième Consultation
technique). Il y a, par ailleurs, un nombre inconnu de plates-formes non
enregistrées et sans permis (pêche illicite, non déclarée et non réglementée
(INN)) ;
L’effort de pêche déclaré a consécutivement énormément augmenté (+ 40
pourcent entre 2000 et 2011) ;
Le système de gestion est basé dans les deux pays sur un système de licence et
le paiement d’une redevance annuelle pour l’accès à la pêcherie, ainsi que
plusieurs mesures techniques de gestion (maillage, zonage, et période de
fermeture avec le calendrier lunaire), y compris l’obligation de transmission
mensuelle des données de captures et d’effort de pêche.
6
Dans les faits, il n’y a plus de de véritable régulation de l’accès et de respect de la
réglementation : la pêcherie se trouve actuellement dans une situation de quasi
accès libre et gratuit ;
Les systèmes d’exploitation et la productivité technique des flottilles au niveau
des deux Pays sont relativement homogènes. Les rendements dans la pêcherie
ont chuté de 35 à 50 % depuis 2005 ;
Des indicateurs qualitatifs sur la situation des entreprises de pêche montre que la
pêcherie est surexploité sur le plan économique et que la rente de la ressources
est largement dissipée ;
Les données statistiques disponibles (effort, captures et CPUE) et les
connaissances sur les paramètres biologiques de Kapenta permettent d’envisager
une modélisation biologique sur la base d’un modèle de surplus de production (du
type Shaeffer, Fox, etc.)
Il y a un déficit important en données économique sur les séries des prix au
débarquement, sur les coûts liés à l’activité des entreprises de pêche, et donc sur
leur rentabilité. En conséquence les travaux des deux Consultants nationaux en
appui à ce processus devront principalement être centrés sur la collecte des
données économiques afin de pouvoir estimer un coût moyen par unité d’effort
(nuit pêchée par ponton) dans chacun des deux Pays et pour chaque zone de
pêche.
Les documents de référence pour la modélisation bioéconomique ont été collectés avant
et pendant la mission (ou juste après). La liste complète de ces documents est présentée
dans le rapport (annexe C). Ces documents clés seront la base des références
bibliographiques pour l'exercice de modélisation bioéconomique.
Un questionnaire a été élaboré afin de recueillir les informations manquantes et
nécessaires à la modélisation bio économique (annexe E). Ces informations seront
obtenues lors d’une enquête de terrain auprès d’un échantillon d’entreprise de pêche de
différentes tailles, opérant au niveau des différentes zones de pêche (Bassin/Strate)
dans les deux Pays. Un plan d’échantillonnage sera effectué sur la base des données de
l’enquête cadre réalisée avec l’appui de la FAO en 2011 ; il est fortement suggéré que
cette enquête économique de terrain soit réalisée cependant en étroite collaboration avec
les responsables des Organisations de Producteurs de Kapenta en Zambie et au
Zimbabwe pour, d’une part effectuer le choix des entreprises à interviewer et faciliter les
contacts, et d’autres part, pour s’assurer de la qualité des données qui seront
transmises.
Les éléments pour la poursuite du processus devant conduire à l’atelier de modélisation
bio économique ont également été définis, ainsi que le format de cet atelier.
7
Contents
Executive summary _______________________________________________________________________ 3
Résumé exécutif __________________________________________________________________________ 5
Contents _________________________________________________________________________________ 7
List of tables ______________________________________________________________________________ 8
List of figures _____________________________________________________________________________ 8
List of Photos _____________________________________________________________________________ 8
Acronyms and abbreviations ______________________________________________________________ 9
1. Background ________________________________________________________________________ 10
2. Mission details ______________________________________________________________________ 10
2.1 Objectives_______________________________________________________________________ 10
2.2 Itinerary _________________________________________________________________________ 11
2.3 Persons met _____________________________________________________________________ 11
2.4 Documents collected ____________________________________________________________ 12
3. Overview and recent trends of the Kapenta Fishery in Zimbabwe and Zambia __________ 12
3.1 Catches, fishing effort and catch per unit of effort _________________________________ 12
3.2 Harvesting system ________________________________________________________________ 13
3.3 Management system ____________________________________________________________ 14
3.3.1 Access: a quasi-open access system __________________________________________ 14
3.3.2 Monitoring, control and surveillance: poor enforcement and
significant illegal, unreported and unregulated fishing __________________________ 15
3.4 Rapid assessment of the Fishery’s economic situation: several
indicators show that the rent of the resource is rapidly disappearing ________________ 16
4. Data available for bioeconomic modelling and rapid quality assessment ______________ 17
4.1 Biological and environmental data _______________________________________________ 17
4.1.1 Biological data _______________________________________________________________ 17
4.1.2 Environmental data __________________________________________________________ 18
4.2 Fishing statistics (catches, effort and CPUE) ________________________________________ 18
4.3 Economic data __________________________________________________________________ 20
4.3.1 Prices ________________________________________________________________________ 21
4.3.2 Costs ________________________________________________________________________ 22
4.3.3 Other economic data ________________________________________________________ 23
5. Conclusion and the way forward ____________________________________________________ 23
5.1 Conclusion ______________________________________________________________________ 23
5.2 The way forward _________________________________________________________________ 24
5.2.1 National Consultants: Terms of Reference ______________________________________ 24
5.2.2 Bioeconomic Working Group _________________________________________________ 25
5.2.3 Other ________________________________________________________________________ 28
8
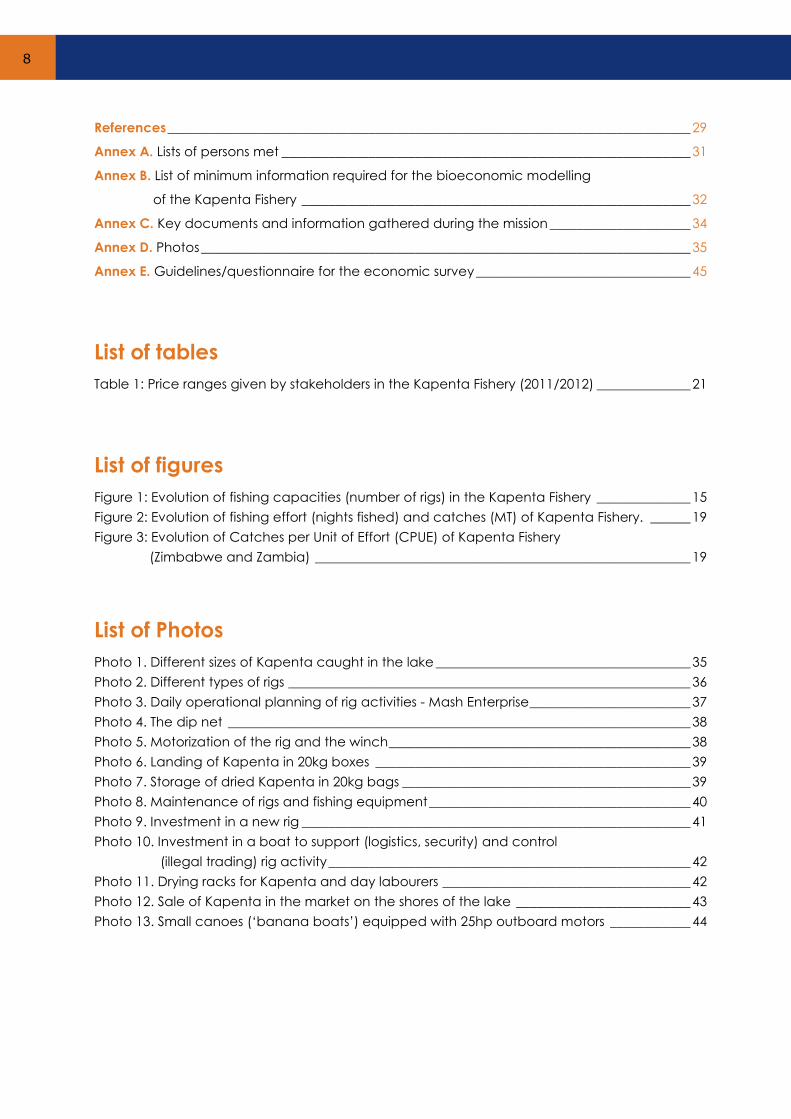
References ______________________________________________________________________________ 29
Annex A. Lists of persons met _____________________________________________________________ 31
Annex B. List of minimum information required for the bioeconomic modelling
of the Kapenta Fishery __________________________________________________________ 32
Annex C. Key documents and information gathered during the mission _____________________ 34
Annex D. Photos _________________________________________________________________________ 35
Annex E. Guidelines/questionnaire for the economic survey ________________________________ 45
List of tables
Table 1: Price ranges given by stakeholders in the Kapenta Fishery (2011/2012) ______________ 21
List of figures
Figure 1: Evolution of fishing capacities (number of rigs) in the Kapenta Fishery ______________ 15
Figure 2: Evolution of fishing effort (nights fished) and catches (MT) of Kapenta Fishery. ______ 19
Figure 3: Evolution of Catches per Unit of Effort (CPUE) of Kapenta Fishery
(Zimbabwe and Zambia) ________________________________________________________ 19
List of Photos
Photo 1. Different sizes of Kapenta caught in the lake ______________________________________ 35
Photo 2. Different types of rigs ____________________________________________________________ 36
Photo 3. Daily operational planning of rig activities - Mash Enterprise ________________________ 37
Photo 4. The dip net _____________________________________________________________________ 38
Photo 5. Motorization of the rig and the winch _____________________________________________ 38
Photo 6. Landing of Kapenta in 20kg boxes _______________________________________________ 39
Photo 7. Storage of dried Kapenta in 20kg bags ___________________________________________ 39
Photo 8. Maintenance of rigs and fishing equipment _______________________________________ 40
Photo 9. Investment in a new rig __________________________________________________________ 41
Photo 10. Investment in a boat to support (logistics, security) and control
(illegal trading) rig activity ______________________________________________________ 42
Photo 11. Drying racks for Kapenta and day labourers _____________________________________ 42
Photo 12. Sale of Kapenta in the market on the shores of the lake __________________________ 43
Photo 13. Small canoes (‘banana boats’) equipped with 25hp outboard motors ____________ 44
9
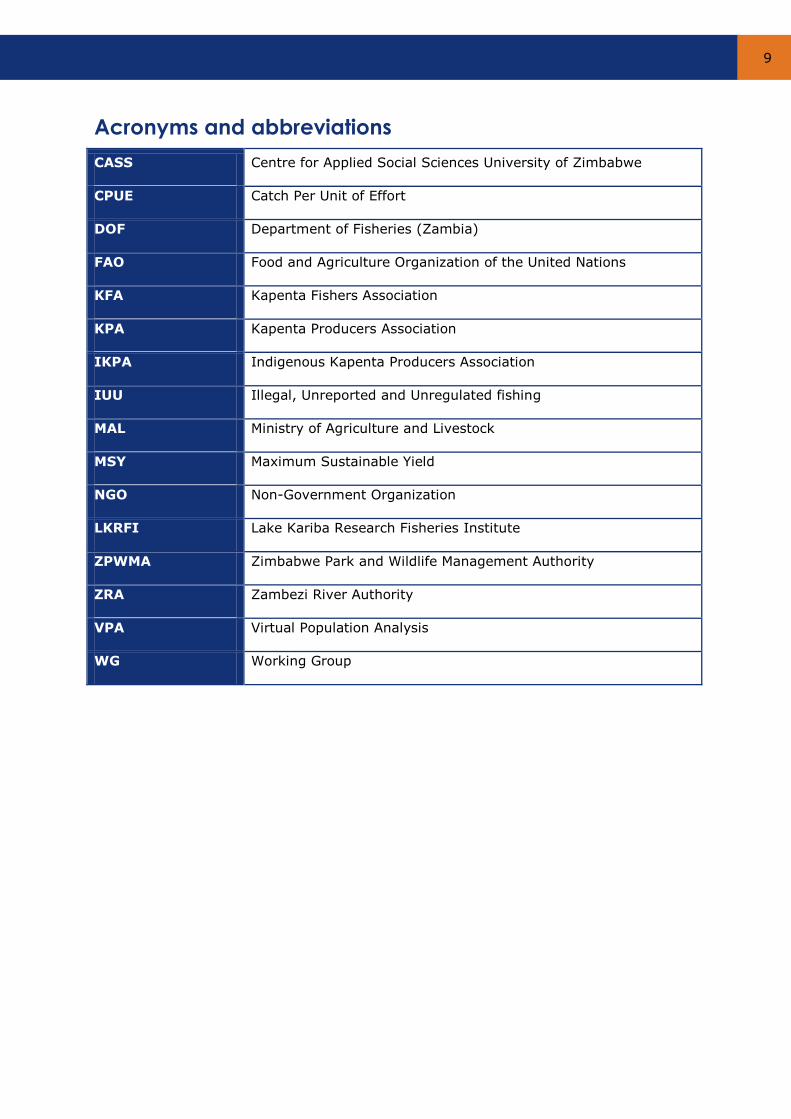
Acronyms and abbreviations
CASS Centre for Applied Social Sciences University of Zimbabwe
CPUE Catch Per Unit of Effort
DOF Department of Fisheries (Zambia)
FAO Food and Agriculture Organization of the United Nations
KFA Kapenta Fishers Association
KPA Kapenta Producers Association
IKPA Indigenous Kapenta Producers Association
IUU Illegal, Unreported and Unregulated fishing
MAL Ministry of Agriculture and Livestock
MSY Maximum Sustainable Yield
NGO Non-Government Organization
LKRFI Lake Kariba Research Fisheries Institute
ZPWMA Zimbabwe Park and Wildlife Management Authority
ZRA Zambezi River Authority
VPA Virtual Population Analysis
WG Working Group
Bioeconomic Analysis of the Kapenta Fisheries, Lake Kariba 10
1. Background
For several years, the FAO has been supporting a joint process of fisheries management
between Zimbabwe and Zambia on Lake Kariba. In this context, regular technical
consultation meetings have been held between the two riparian countries. In addition, a
Technical Committee for Fishery Management, created under Article 3 of the Economic and
Technical Cooperation Protocol between Zimbabwe and Zambia concerning the
management and development of fisheries resources on Lake Kariba and the
transboundary waters of the Zambezi River, was set up in October 2012.
During recent consultation meetings between the two riparian countries, the development
of a bioeconomic modelling of the Kapenta Fishery was recommended. This bioeconomic
modelling exercise will be developed through a process involving the various public and
private stakeholders of this fishery. The main objective of this bioeconomic modelling will
be to examine some distinct scenarios regarding fishing effort allocation and to provide
advice on the optimum number of rigs that should be licensed in Zambia and Zimbabwe.
It will be also an opportunity for the various stakeholders to discuss general issues
concerning the management of this fishery.
As part of this process, an initial field mission was held from 12 to 23 November 2012 in
both Zambia and Zimbabwe. This document is the report of this first field mission, which
was carried out by Mr Lionel Kinadjian.
2. Mission details
2.1 Objectives
The main objective of this first mission was to meet the key stakeholders (public and
private sector) involved in the Kapenta Fishery in order to:
inform them about the bioeconomic assessment exercise that will be carried out on
the Kapenta fisheries;
underline the importance of their collaboration, in particular the provision of
reliable data to fit the model;
find out more about the Kapenta Fishery and its current situation from their point
of view;
gather key documents and information which will be necessary for the bioeconomic
modelling;
assess the quality of information requested for the bioeconomic modelling and
identify any gaps;
draft the Terms of Reference for National Consultants who will be responsible for
the collection of additional information after the mission.
Mission details 11
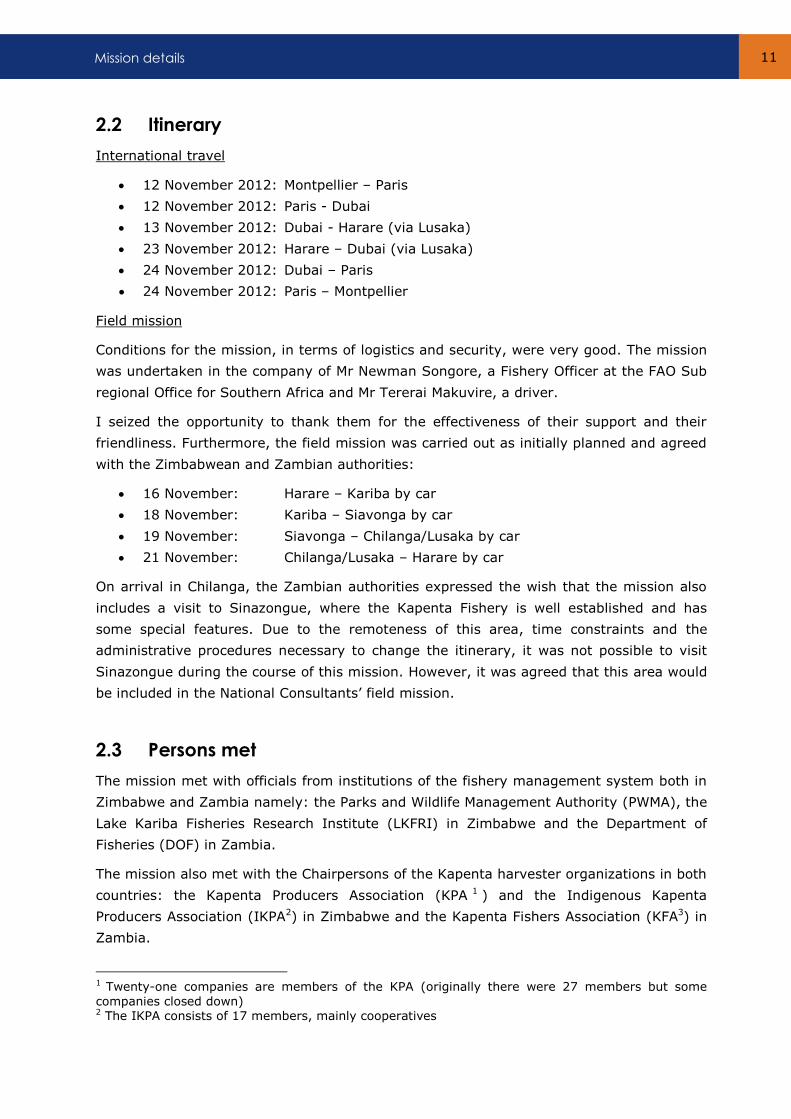
2.2 Itinerary
International travel
12 November 2012: Montpellier – Paris
12 November 2012: Paris - Dubai
13 November 2012: Dubai - Harare (via Lusaka)
23 November 2012: Harare – Dubai (via Lusaka)
24 November 2012: Dubai – Paris
24 November 2012: Paris – Montpellier
Field mission
Conditions for the mission, in terms of logistics and security, were very good. The mission
was undertaken in the company of Mr Newman Songore, a Fishery Officer at the FAO Sub
regional Office for Southern Africa and Mr Tererai Makuvire, a driver.
I seized the opportunity to thank them for the effectiveness of their support and their
friendliness. Furthermore, the field mission was carried out as initially planned and agreed
with the Zimbabwean and Zambian authorities:
16 November: Harare – Kariba by car
18 November: Kariba – Siavonga by car
19 November: Siavonga – Chilanga/Lusaka by car
21 November: Chilanga/Lusaka – Harare by car
On arrival in Chilanga, the Zambian authorities expressed the wish that the mission also
includes a visit to Sinazongue, where the Kapenta Fishery is well established and has
some special features. Due to the remoteness of this area, time constraints and the
administrative procedures necessary to change the itinerary, it was not possible to visit
Sinazongue during the course of this mission. However, it was agreed that this area would
be included in the National Consultants’ field mission.
2.3 Persons met
The mission met with officials from institutions of the fishery management system both in
Zimbabwe and Zambia namely: the Parks and Wildlife Management Authority (PWMA), the
Lake Kariba Fisheries Research Institute (LKFRI) in Zimbabwe and the Department of
Fisheries (DOF) in Zambia.
The mission also met with the Chairpersons of the Kapenta harvester organizations in both
countries: the Kapenta Producers Association (KPA 1 ) and the Indigenous Kapenta
Producers Association (IKPA2) in Zimbabwe and the Kapenta Fishers Association (KFA3) in
Zambia.
1 Twenty-one companies are members of the KPA (originally there were 27 members but some
companies closed down) 2 The IKPA consists of 17 members, mainly cooperatives
Bioeconomic Analysis of the Kapenta Fisheries, Lake Kariba 12
Meetings were also organized with Kapenta harvesters, affiliated and/or non-affiliated to
these organizations.
The mission also had the opportunity to meet two economists, Mr. Kefasi Nyikahadzoi,
(Senior Lecturer, Economist, Centre for Applied Social Sciences) in Zimbabwe and Mr
Charles Mwula, (Principal Planner, Economist, Ministry of Agriculture and Livestock) in
Zambia who have been assigned as focal points by their respective countries to support
the bioeconomic modelling process. These economists have been identified as potential
consultants for the collection of additional information as part of future missions (see
5.2.1. Terms of Reference for National Consultants).
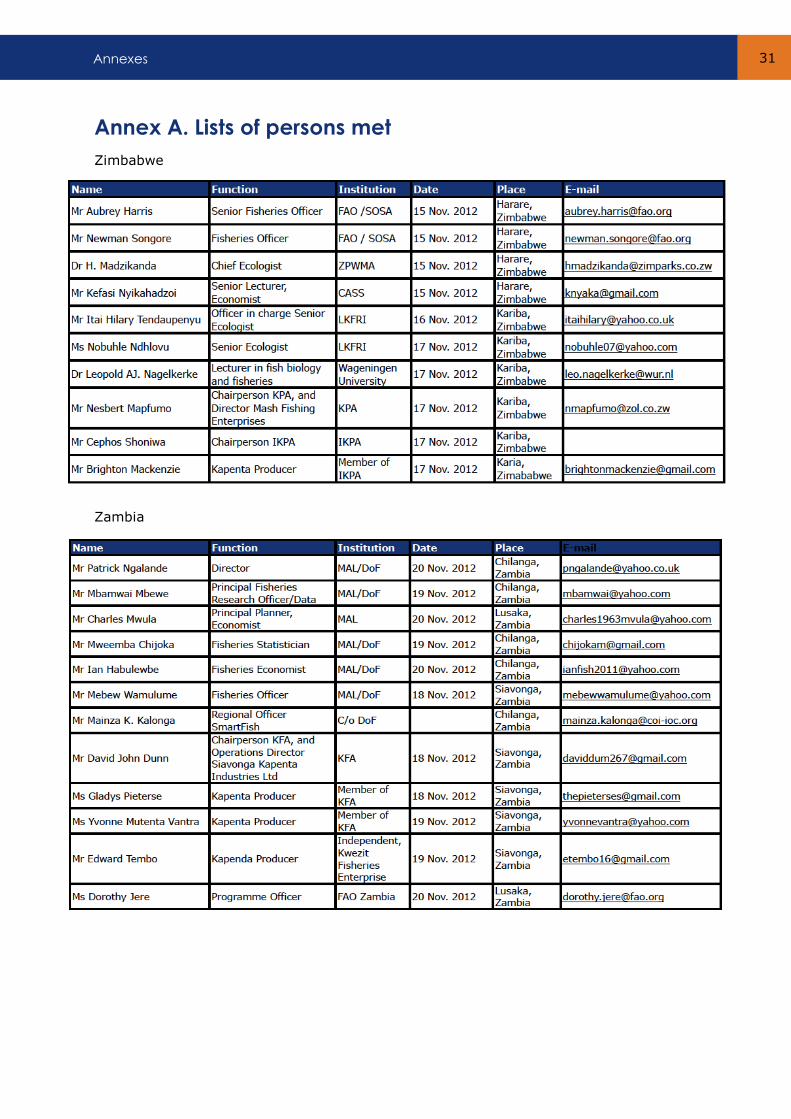
A complete list of all persons met can be found in Annex A.
The mission would like to thank all the people in Zimbabwe and Zambia who gave up their
time to provide information, which led to a thorough understanding of the realities of the
Kapenta Fishery in a relatively short period of time.
2.4 Documents collected
A list of the necessary information and data for the bioeconomic modelling performance
had been prepared before the mission (Annex B). This list was transmitted to the
stakeholders prior to the mission.
Key documents for the bioeconomic modelling were collected during the mission (or just
after). A complete list of these documents can be found in Annex C. These key documents
and the references indicated in this present report will form the basis of bibliographical
references for the modelling exercise.
The mission also collected other data for the bioeconomic modelling process. Data
collected are presented and analysed in section four.
3. Overview and recent trends of the Kapenta Fishery in
Zimbabwe and Zambia
3.1 Catches, fishing effort and catch per unit of effort
Discussions with private operators in Kariba and Siavonga indicated a decrease in catches,
over the last 5 years. The catch per unit of effort (CPUE) has seen a decline of 35 to 50
percent since 2005.
All operators mentioned that 2012 has been a very bad year (for all stakeholders -
old/new - in both countries).
3 Twenty-two members were registered in 1990; nowadays the number of member companies
stands at around 31. A total of 151 companies operating under the Kapenta Fishery are registered in Zambia (frame survey, 2011).
Overview and recent trends of the Kapenta Fishery in Zimbabwe and Zambia 13
During the mission (mid-November 2012), the CPUE in Zimbabwe was approximately 50
kg/night/boat and the yield in Zambia was about 30 – 35 kg/night/boat. Apparently there
is a difference in yield of about 30 to 40 percent between Zimbabwean and Zambian rigs.
These figures do not appear to be consistent with statistical trends on the CPUE of recent
years. In fact, according to the national statistics, yields from rigs in Zambia should be
higher than those in Zimbabwe. Further basin analysis needs to be carried out by the
National Consultants on this issue.
Another observation is the dramatic increase of nominal fishing effort mainly due to the
appearance of new players in the fishery over these last 5 years (increased number of
registered and licensed boats). In 2012, there were more than 1,000 rigs operating on the
lake; the number of rigs in 2005 was around 600 and in 1990 they numbered 470;
additionally, there are an unknown number of unregistered and unlicensed rigs (Illegal,
Unreported and Unregulated fishing (IUU)).
Private operators indicated that a rig operates between 21 to 26 nights per month (i.e.
between 252 and 312 nights per year). This figure is consistent with the information in
previous Kapenta Fishery studies. The fishing effort was 240 nights fished per year in 1992
(bioeconomic workshop, 1992) and 236 nights per year in 1997 (bioeconomic working
group, 1997). However, there are a number of rigs that only operate occasionally due to
management issues (insufficient cash flow) and/or low catch levels.
It is worth noting that there are a lot of other parameters that should also be taken into
consideration in order to properly assess fishing effort such as those that help detect fish
(boat and engine characteristics, fish finding devices...) and catch them (number of bulbs
used to attract fish, size of the lift net, number of fishing operations per night...). For more
detailed information on the evaluation of increased effective fishing power due to
technological development, see the work of Chifamba, 1991.
3.2 Harvesting system
In the Kariba and Siavonga areas, fleet characteristics and fishing techniques are, for the
most part, homogenous. The harvesting system consists of rigs operating with dip net (see
photos in Annex D). The main factors that can have an effect on the efficiency of fishing
operations and their costs are:
concentration and type of fishing rigs/companies and type of landing site;
the size of the crew per rig (usually 2 crew in Zimbabwe versus 3 to 4 crew in
Zambia);
type of remuneration (mainly incentives in Zimbabwe and fixed salary + incentive
in Zambia);
the level of investment in the fishing boat (including engine). It appears that new
players invest in the cheapest rigs and engines (less powerful);
Bioeconomic Analysis of the Kapenta Fisheries, Lake Kariba 14
mechanization (hydraulic winch for the dip net versus manual);
number of bulbs to attract fish;
specific equipment to detect fish.
These factors need to be verified for the other main fishing areas in the lake both in
Zambia and Zimbabwe.
3.3 Management system
The management system in both countries mainly consists of:
A fishing licence system to regulate access to the fishery. Licences are allocated
to fishing companies to operate a limited number of rigs. Licence fees are paid
annually by the fishing companies when licenses are issued;
Various conservation measures related to prohibited fishing areas (shallow waters
to protect breeding grounds or close to holiday resorts); as well as the minimum
net mesh size (net mesh size should not be less than 8 mm when stretched);
Monitoring of catch and effort: data collection with regards to the Kapenta Fishery
is carried out with the collaboration of the Kapenta operators. In fact, licence
holders are required to submit monthly catch and effort returns to the respective
management authorities in Zimbabwe and Zambia.
3.3.1 Access: a quasi-open access system
Although there is a licensing system in place, it appears nowadays that the Kapenta
Fishery operates as a quasi-open access system.
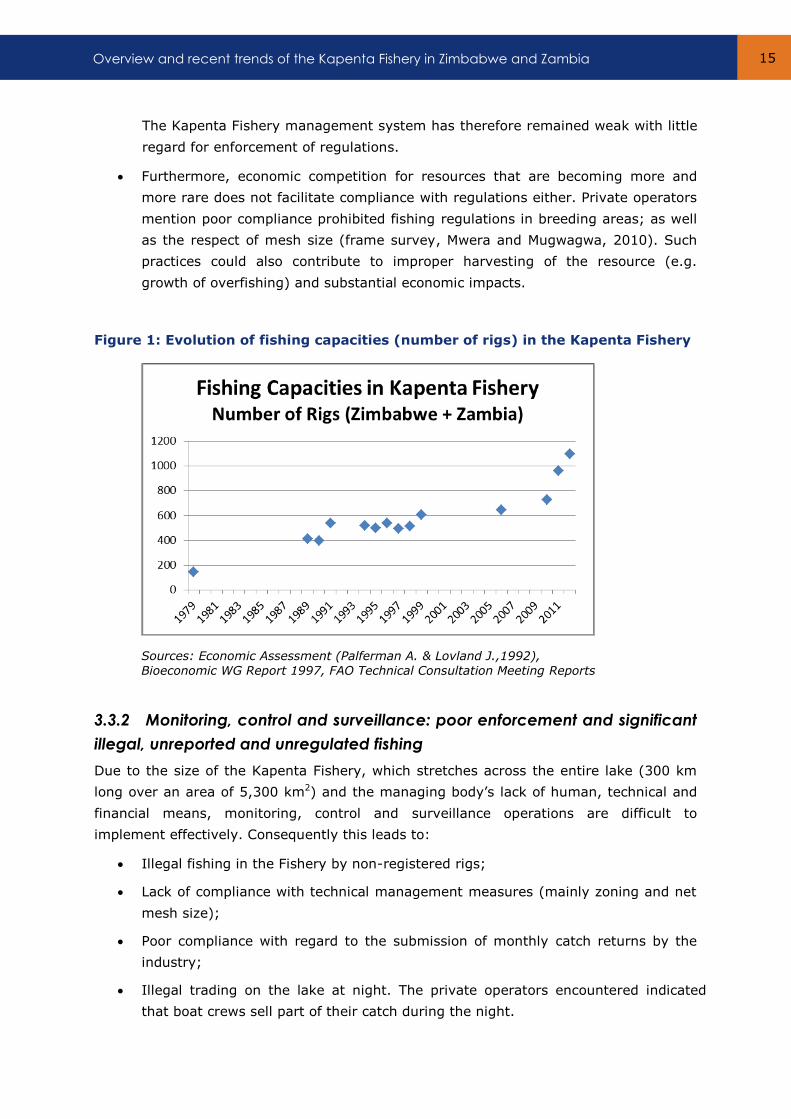
There has been a drastic increase in fishing capacities over the past 5 years.
Figure 1. below shows the trend in fishing capacities of the Kapenta Fishery since
the early 1980’s (number of rigs registered by the fisheries management
authorities). In the 1990’s the number of registered rigs remained stable,
between 400 and 600, however, nowadays, the number of officially registered
rigs totals over 1,000.
In addition, an unknown number of unregistered, unlicensed rigs are operating in
the fishery (frame surveys, 2010). It should be noted that operating with a
distinct lack of security and exclusivity encourages greater exploitation of
resources by private operators.
Previously, licence fees for access to the fishery were very low compared to the
wealth of the resource (Kapenta). As a result, it has not been possible to limit
overcapitalization in the Kapenta Fishery (rent extraction), or to ensure an
appropriate/equitable share of the fishery’s wealth between the public and private
sectors (in particular to cover fishery management costs).
Overview and recent trends of the Kapenta Fishery in Zimbabwe and Zambia 15
The Kapenta Fishery management system has therefore remained weak with little
regard for enforcement of regulations.
Furthermore, economic competition for resources that are becoming more and
more rare does not facilitate compliance with regulations either. Private operators
mention poor compliance prohibited fishing regulations in breeding areas; as well
as the respect of mesh size (frame survey, Mwera and Mugwagwa, 2010). Such
practices could also contribute to improper harvesting of the resource (e.g.
growth of overfishing) and substantial economic impacts.
Figure 1: Evolution of fishing capacities (number of rigs) in the Kapenta Fishery
Sources: Economic Assessment (Palferman A. & Lovland J.,1992),
Bioeconomic WG Report 1997, FAO Technical Consultation Meeting Reports
3.3.2 Monitoring, control and surveillance: poor enforcement and significant
illegal, unreported and unregulated fishing
Due to the size of the Kapenta Fishery, which stretches across the entire lake (300 km
long over an area of 5,300 km2) and the managing body’s lack of human, technical and
financial means, monitoring, control and surveillance operations are difficult to
implement effectively. Consequently this leads to:
Illegal fishing in the Fishery by non-registered rigs;
Lack of compliance with technical management measures (mainly zoning and net
mesh size);
Poor compliance with regard to the submission of monthly catch returns by the
industry;
Illegal trading on the lake at night. The private operators encountered indicated
that boat crews sell part of their catch during the night.
Bioeconomic Analysis of the Kapenta Fisheries, Lake Kariba 16
These operators estimate that at least 50 percent of their boats’ catch is sold
illegally on the lake at night, either to other rigs or to operators in small dug-out
canoes that come out specifically to buy Kapenta on the lake at night. These canoes
are equipped with 25 hp outboard motors (Picture 13, Annex D).
It should be noted that this is not a recent phenomenon; this was already reported
in the 1990’s in the 2nd Working Group Assessment Report and in the Economic
Assessment of the Kapenta Fishery. However, illegal sales of 50 percent represent
a very large volume that does not appear in the catch declarations made by the
industry. This could lead to a significant underestimate of the real volume of
catches in the lake. It is necessary to explore this issue further in the context of
economic surveys that will be carried out by National Consultants, or within the
framework of any other work4 on monitoring, control and surveillance systems for
fishing activities on Lake Kariba.
Within this same context, some large operators in the Kapenta Fishery have developed
their own strategy to fight against IUU fishing and illegal trading by providing their own
boats to patrol and control their rigs; this obviously comes at a cost.
3.4 Rapid assessment of the Fishery’s economic situation: several indicators show that the rent of the resource is rapidly disappearing
Several indicators show that rent of the resource is rapidly disappearing meaning that the
Kapenta Fishery is over exploited from an economic point of view. These indicators are
primarily:
The quasi-open access system to the Kapenta Fishery over the few last years,
consequently doubling the fishing capacities;
The increase in IUU fishing (fishing in prohibited areas (breeding grounds), use of
illegal net mesh size…). This reflects, among other things, greater competition on
resources that are becoming increasingly scarce;
A lack of means to pay for the licence fees in full (in both Zimbabwe and Zambia);
arrangements are sometimes made for licence fees to be paid quarterly;
Poor management of capital and difficulties even to repair the rigs when damaged
(insufficient cash flow for some small-scale operators);
Insufficient remuneration: it sometimes happens that remuneration for fishing
activities is less than the opportunity cost of labour.
4 The 2nd and 3rd Technical Consultation Meetings in 2004 and 2006 discussed the issue of IUU fishing
and recommended the development of a Regional Plan of Action (RPOA-IUU) for Lake Kariba. It was also noted and recommended during these meeting that each member country (Zimbabwe and Zambia) need to develop a National Plan of Action (NPOA) for IUU.
Overview and recent trends of the Kapenta Fishery in Zimbabwe and Zambia 17
Some operators mentioned that this happens when the catch is so poor that the
wages of the fishing crew are below that of day labourers;
Bankruptcy, closure or the withdrawal of some fishing companies;
Rental opportunities: some operators prefer to rent out their fishing licence and rigs
instead of fishing themselves. Rental costs are approximately US $500 to $800 per
month. The last frame survey (2010) highlighted that 13 percent of rigs in
Zimbabwe are rented. This gives an overall idea of the amount of rent that remains
in the Kapenta Fishery.
At present (2012), not only the rent of the resource is disappearing, but also it is clear
that most operators will not generate sufficient profits to ensure the sustainability of their
business over the long term. The Kapenta Fishery is currently in a situation where
potential wealth creation is largely mortgaged.
4. Data available for bioeconomic modelling and rapid
quality assessment
Over the course of stakeholder meetings during the mission, it was emphasized that
modelling would be a simplified representation of reality (situation of the Kapenta Fishery).
It was also stressed that if the quality of input data is poor, the output (results) will never
be useful or relevant for decision-making for whatever model is developed. Particular
emphasis was placed on economic data that will be collected from the industry to feed the
model.
4.1 Biological and environmental data
Kapenta was introduced in Lake Kariba in 1967 and was able to colonize the whole lake in
a very short time from a very limited parental stock. The main scientific knowledge
available concludes that the Kapenta stock is distributed equally between Zimbabwe and
Zambia and is not limited by distance or depth.
The productivity of the Kapenta stock is primarily influenced by environmental factors.
Additionally, it is recognized that the risk of recruitment overfishing is very low due to the
bio ecological characteristics of Kapenta (a species with very high fecundity, rapid growth,
a short lifespan, and the capacity to colonize the whole lake from a very limited parental
stock).
4.1.1 Biological data
Several projects have supported fisheries management activities on Lake Kariba. Research
work was conducted as part of these projects to estimate key biological parameters for
stock assessment and modelling.
Bioeconomic Analysis of the Kapenta Fisheries, Lake Kariba 18
Key biological parameters include estimates of growth parameters (linear and weight) and
mortality rates. Mortality rates have been estimated from the last biomass assessment
that was conducted in 1994. Uncertainties however, still remain as to the estimation of
total mortality (and thus natural mortality).
However, these parameters have not been updated since the last working group
assessment of Kapenta in 1996. There is no regular monitoring of length frequencies in the
fishery and no accurate data exists on the catches, size and age structure. Therefore it is
not possible to estimate the recruitment rate through virtual population analysis (VPA). It
was noted that work on size frequency is currently being undertaken at the Lake Kariba
Research Fisheries Institute (LKFRI).
4.1.2 Environmental data
During the working groups held in 1992 and 1996, for the assessment of Kapenta, it was
demonstrated that there are important links between environmental factors and CPUE.
Recent research (Hill, T.; Mashonjowa, E.; Ndebele-Murisa, M.R., 2011) suggests that both
climate (maximum temperature in particular) and nutrients, which are influenced by water
levels, are the primary determinants of Lake Kariba's Kapenta production.
Indeed, all the private operators encountered recognized the influence of environmental
factors on the fishery. Above all else, they all cited climatic factors as having a significant
impact on the Kapenta Fishery.
The results from such analyses are important for bioeconomic evaluation and for the
management of the fishery, which will have to take into account risk evaluation and the
impact of abiotic factors on the productivity of the Kapenta stock.
The Zambezi River Authority (ZRA) regularly collects environmental data on the lake level,
catchment inflows… The availability such data will be key in assessing the correlation
between environmental factors and Kapenta productivity.
It might be useful to find a way to request the ZRA to kindly supply the time series of
environmental parameters they collect. To this end, the Lake Kariba Fishery Research
Institute could send an official request to the ZRA.
4.2 Fishing statistics (catches, effort and CPUE)
The Kapenta Fishery is subject to regular monitoring of the level of fishing effort and
catches through voluntary declarations of fishing companies authorized to harvest. From
the data of catch and effort (in nights fished), a cpue can be easily calculated. These CPUE
can be considered as an index of abundance of Kapenta in the Lake.
The fishery started in 1974 in Zimbabwe and 1982 in Zambia.
The mission was able to collect the time series of catches, fishing effort and CPUE since
the start of the fishery in both countries up until 2011. Figures 2 and 3 below show the
evolution of total catches, fishing effort and the evolution of the CPUE in both countries.
Data available for bioeconomic modelling and rapid quality assessment 19
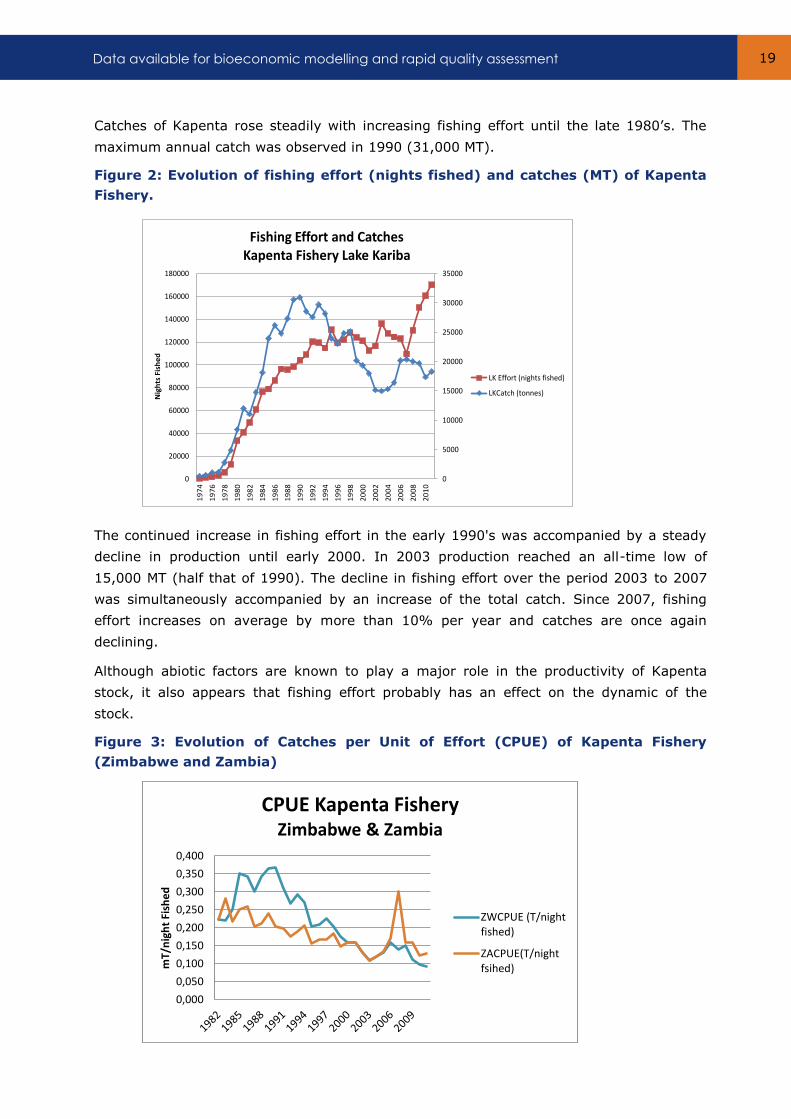
Catches of Kapenta rose steadily with increasing fishing effort until the late 1980’s. The
maximum annual catch was observed in 1990 (31,000 MT).
Figure 2: Evolution of fishing effort (nights fished) and catches (MT) of Kapenta
Fishery.
The continued increase in fishing effort in the early 1990's was accompanied by a steady
decline in production until early 2000. In 2003 production reached an all-time low of
15,000 MT (half that of 1990). The decline in fishing effort over the period 2003 to 2007
was simultaneously accompanied by an increase of the total catch. Since 2007, fishing
effort increases on average by more than 10% per year and catches are once again
declining.
Although abiotic factors are known to play a major role in the productivity of Kapenta
stock, it also appears that fishing effort probably has an effect on the dynamic of the
stock.
Figure 3: Evolution of Catches per Unit of Effort (CPUE) of Kapenta Fishery
(Zimbabwe and Zambia)
0
5000
10000
15000
20000
25000
30000
35000
0
20000
40000
60000
80000
100000
120000
140000
160000
180000
19
74
19
76
19
78
19
80
19
82
19
84
19
86
19
88
19
90
19
92
19
94
19
96
19
98
20
00
20
02
20
04
20
06
20
08
20
10
Nig
hts
Fis
he
d
Fishing Effort and Catches Kapenta Fishery Lake Kariba
LK Effort (nights fished)
LKCatch (tonnes)
0,000
0,050
0,100
0,150
0,200
0,250
0,300
0,350
0,400
mT/
nig
ht
Fish
ed
CPUE Kapenta Fishery Zimbabwe & Zambia
ZWCPUE (T/nightfished)
ZACPUE(T/nightfsihed)
Bioeconomic Analysis of the Kapenta Fisheries, Lake Kariba 20
At the beginning of the Kapenta Fishery, the yields of the Zimbabwean fleet were
significantly higher than those of Zambia. However, the gap between the CPUE of the two
fleets has gradually reduced over time.
In the early 2000s, the two fleets had exactly the same fishing yields. Since 2006 however
the trend reversed, with the Zambian fleet having a higher CPUE than Zimbabwe. These
trends will need to be discussed in more detail during the Bio Economic Working Group,
particularly possible explanatory factors such as:
biomass distribution in the lake;
improved efficiency of the Zambian fleet;
any other factors.
The issue of grossly underestimated catch quantities (main species and bycatches5) and
fishing effort was also raised in discussions with Kapenta Fishery stakeholders. The main
causes, as previously mentioned are:
under-reporting of the fishing activities of registered and licensed vessels by fishing
companies (an estimated 40 percent of companies in Zambia and 20 percent in
Zimbabwe do not provide any statistical records);
illegal catch sales on the lake at night which are not included in the catch estimates
of registered companies;
IUU fishing in both countries.
The National Consultants should try to estimate the order of magnitude of the total
production of Kapenta caught from lake and compare this estimate with current reported
catches.
If necessary, the statistical series of catches, fishing effort and CPUE will be corrected and
approved by the working group to feed the model with data that is as consistent as
possible.
4.3 Economic data
Most of the work on the Kapenta Fishery shows that this fishery is driven mainly by
financial incentives, namely the profitability of fishing vessels operating in the fishery.
However, despite the importance of the economic dimension of the management of this
fishery, it seems that there is little economic data routinely collected on ex-vessel prices or
regular monitoring of the costs of production and the profitability of fishing units.
5 Based on discussions with stakeholders, it appears that Tigerfish, which are the main predators of
Kapenta (along side human beings), are the main bycatch of the fishery. Currently, there are no
detailed statistics on this issue, however, historical data indicates that at the beginning of the fishery
in Zimbabwe in the mid 1970's, Tigerfish represented up to 10% of the total catch of rigs in the
Kapenta Fishery.
Data available for bioeconomic modelling and rapid quality assessment 21
Through discussions with private operators, it was possible to collect some economic data
during the mission.
4.3.1 Prices
As ex-vessel prices are not regularly recorded, there are no official statistics for ex-vessel
prices of Kapenta. The prices known correspond to dried Kapenta, which is usually sold by
harvesters in 20 kg bags. To estimate the ex-vessel price of fresh fish, a ratio of three is
usually used; the ex-vessel price is obtained by dividing the price of dried Kapenta by
three.
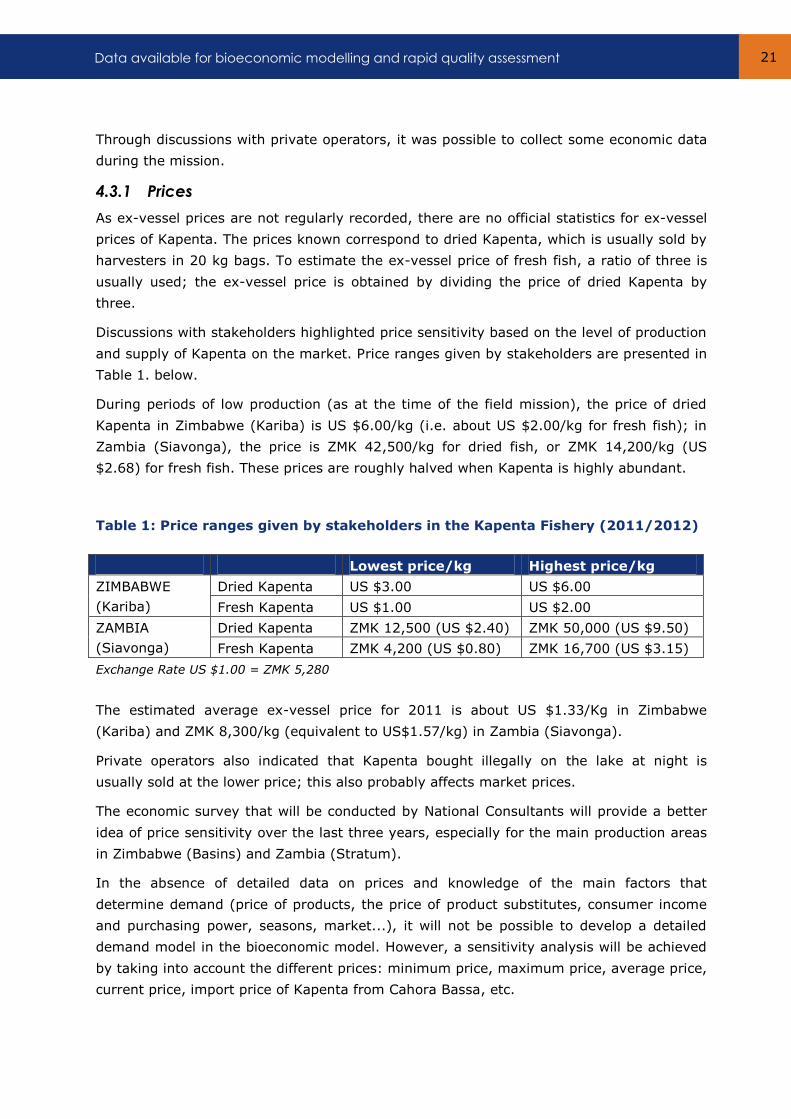
Discussions with stakeholders highlighted price sensitivity based on the level of production
and supply of Kapenta on the market. Price ranges given by stakeholders are presented in
Table 1. below.
During periods of low production (as at the time of the field mission), the price of dried
Kapenta in Zimbabwe (Kariba) is US $6.00/kg (i.e. about US $2.00/kg for fresh fish); in
Zambia (Siavonga), the price is ZMK 42,500/kg for dried fish, or ZMK 14,200/kg (US
$2.68) for fresh fish. These prices are roughly halved when Kapenta is highly abundant.
Table 1: Price ranges given by stakeholders in the Kapenta Fishery (2011/2012)
Lowest price/kg Highest price/kg
ZIMBABWE
(Kariba)
Dried Kapenta US $3.00 US $6.00
Fresh Kapenta US $1.00 US $2.00
ZAMBIA
(Siavonga)
Dried Kapenta ZMK 12,500 (US $2.40) ZMK 50,000 (US $9.50)
Fresh Kapenta ZMK 4,200 (US $0.80) ZMK 16,700 (US $3.15)
Exchange Rate US $1.00 = ZMK 5,280
The estimated average ex-vessel price for 2011 is about US $1.33/Kg in Zimbabwe
(Kariba) and ZMK 8,300/kg (equivalent to US$1.57/kg) in Zambia (Siavonga).
Private operators also indicated that Kapenta bought illegally on the lake at night is
usually sold at the lower price; this also probably affects market prices.
The economic survey that will be conducted by National Consultants will provide a better
idea of price sensitivity over the last three years, especially for the main production areas
in Zimbabwe (Basins) and Zambia (Stratum).
In the absence of detailed data on prices and knowledge of the main factors that
determine demand (price of products, the price of product substitutes, consumer income
and purchasing power, seasons, market...), it will not be possible to develop a detailed
demand model in the bioeconomic model. However, a sensitivity analysis will be achieved
by taking into account the different prices: minimum price, maximum price, average price,
current price, import price of Kapenta from Cahora Bassa, etc.
Bioeconomic Analysis of the Kapenta Fisheries, Lake Kariba 22
This will enable the impact of price sensibility on the economic performance of the fishery
and fishing companies to be assessed.
4.3.2 Costs
The main production costs revealed by stakeholders during the mission are the following:
Variable costs:
Fuel and lubrication;
Maintenance and repairs;
Supplies;
Crew wages;
Taxes (import, property).
Fixed costs:
Depreciation;
Interest;
Insurance;
Administration salaries, administration supplies (management costs);
Licence fees.
Investment costs:
Boat/rigs including hull, engine (drive unit), generator for lighting, fishing
equipment (dip net);
Drying racks.
Fishing operators in the Kapenta Fishery only use rigs equipped with dip nets. Although
harvesting operations seem quite homogeneous, some differences in costs can come from
other factors, namely:
The country where fishing is practiced: it seems that fishing in Zimbabwe is more
mechanized (two man crew per rig with hydraulic winch to lift the gear) compared
to Zambia (3-4 man crew per rig who haul in the fishing gear manually);
Shore location within a given country: there are five basins on the Zimbabwean
side and IV stratum on the Zambian side. The difference between fishing activities
in remote areas compared to neighbouring the cities of Siavonga in Zambia and
Kariba in Zimbabwe could have an impact on operating costs;
Scale of activities: on one hand, there are operating costs which are shared
according to the number of rigs owned by a fishing company, e.g. transportation
costs on the lake for crews, fish and fuel.
Data available for bioeconomic modelling and rapid quality assessment 23
On the other hand, a company that owns several rigs might have management
costs that a small company with only a few rigs would not have. According to the
industry, the scale effect starts with the ownership of four rigs;
Power of the boat: the power of the engine has a significant impact on fuel
consumption. Fuel consumption is one of the major costs of fishing operations. The
trend seems to be to invest in smaller engines (one cylinder versus four cylinders).
One of the main objectives of the economic survey, which will be carried out by
National Consultants, will be to estimate the above-mentioned production costs.
This will enable standard operating costs to be established alongside estimates of the
average cost of fishing per night (unit of effort). Particular attention will be given to
estimated costs for fuel and payroll, which probably represent the bulk of operating
costs. The diversity of the above-mentioned situations will be taken into account in the
sampling plan of the economic survey (See Annex E).
Discussions with stakeholders confirmed that there are currently no subsidies in the
Kapenta Fishery.
4.3.3 Other economic data
Other economic data were collected during the mission: guaranteed minimum wage,
interest rates, risk-free rate, depreciation rates, etc. These data will be validated with the
National Consultants and some of the macro economic data (time series of exchange rate,
inflation rate...) will be completed.
5. Conclusion and the way forward
5.1 Conclusion
This first mission was very helpful; it took place under very good conditions and allowed
most of the stakeholders of the Kapenta Fishery to be met. Thanks to the rich discussions
and information gathered, it has also allowed for a better understanding of the status of
the fishery and its challenges.
It appears that the Kapenta Fishery is very important both for Zimbabwe and Zambia in
terms of food security issues and local economic development (creation of employment,
revenue and wealth). However, statistics show that the level of production in recent years
is now an average of 36 percent lower than that of the late 1980s - early 1990s, the level
of fishing capacities has increased by 100 percent over the same time interval. Moreover,
a rapid assessment indicates that the fishery rent seems to disappear quite fast.
Bioeconomic Analysis of the Kapenta Fisheries, Lake Kariba 24
Analysis of the data available for bioeconomic modelling indicates that:
In terms of the biological component of the model: it will be possible to use the
Global Production Model (type Schaeffer, Fox...). Data that will be used for the
biological component include the time series of fishing effort, catches, and CPUE.
If necessary, these data will be corrected and validated by the Working Group.
An important assumption of these models is that the stock dynamic is mainly
driven by fishing mortality (fishing affects biomass in proportion to the effort
expended). However, previous biological work and stock assessment on Kapenta
showed that abiotic factors also influenced the productivity of the stock. If data
on the environmental factors that potentially affect stock productivity are
available, it will be possible to develop a Global Production Model in order to test
the effects of the environment. These models will allow us to estimate some
management targets (e.g. the Maximum Sustainable Yield (MSY)) and to also
determine various production levels at equilibrium according to different levels of
fishing effort. These production levels will be then used to estimate the Kapenta
Fishery’s revenue (turnover).
In terms of the economic component of the model: this will be a simple input-
output microeconomic model. The prices of Kapenta will be used to calculate the
value of the catch (fishery turnover). Different prices could be entered in the
model to carry out a sensitivity analysis (e.g. minimum price, maximum price,
average price, current price, import price of Kapenta from Cahora Bassa...). The
average cost per rig, per night of fishing, will be estimated from the data
collected through the economic survey. The main outputs will be the estimate of
value added and rent of the fishery (and per rig). Other outputs could be
developed if required (employment estimates, estimated value of fishing
rights...).
The model will be developed in an Excel file in order to facilitate use and enable further
changes and improvements if necessary.
5.2 The way forward
5.2.1 National Consultants: Terms of Reference
This first field mission allowed some information that will be needed for bioeconomic
modelling to be collected and identified gaps.
In order to collect additional useful information after this mission, it is proposed that two
consultants, experienced in fisheries economics, be recruited to lead economic field
surveys in Zambia and Zimbabwe.
Conclusion and the way forward 25
Two people, assigned by their respective countries as focal points for economic issues
were met during the mission and were identified as potential consultants:
Mr. Kefasi Nyikahadzoi, Senior Lecturer, Economist, Centre of Applied Social
Sciences, University of Zimbabwe (CASS), in Zimbabwe ([email protected]). As a
scholar, Mr. Nyikahadzoi has already carried out economic studies on the Kapenta
Fishery in the past. He is experienced in investigative fieldwork particularly in this
fishery and knows the major stakeholders, namely the fishing companies. Finally,
Mr. Nyikahadzoi also participated in the last bioeconomic Working Group, which was
held in 1997 in Zambia.
Mr. Charles Mwula, Principal Planner, Economist at the Ministry of Agriculture and
Livestock (MAL) in Zambia ([email protected]). Previously, Mr. Mwula
was the Fishery Economist at the Department of Fisheries in Zambia. His current
position as Principal Planner would no doubt be of assistance in advocating for a
strengthening of the economic approach in fisheries management within the
Ministry of Agriculture and Livestock.
When the two National Consultants are appointed, regular communication will take place
by email or Skype in order to prepare the field survey (validation of the questionnaire) and
to analyse the results. Within this framework, an Excel file will be designed to input the
data from the economic survey and to provide a pre-analysis of the main results.
In order to facilitate access to information, the National Consultants should first
make contact with the Chairpersons of Harvester Organizations in both countries
and to ensure their full collaboration with this work (organizing meetings with
producers, awareness of the importance of providing reliable data…). Mr.
Newman Songore, Fishery Officer at the FAO Sub regional Office for Southern
Africa, who participated in this first field mission, could also play an important
role in supporting the work of the two consultants.
The results of this economic survey will be presented at the bioeconomic Working Group.
The main data collected on prices and costs in the Kapenta Fishery will be used to feed the
bioeconomic model that will be developed.
5.2.2 Bioeconomic Working Group
Appointments taken during the mission with the fishery management Authorities in
Zambia and Zimbabwe, gave us the opportunity to discuss the design of the forthcoming
Working Group on bioeconomic modelling of the Kapenta Fishery.
The objectives of the Working Group were discussed and agreed upon during the Fifth
Technical Consultation Meeting (5TCM) held in Siavonga in September 2012 (see Report of
Fifth TCM and Working Document SFS/DM/KARIBA/12/ 5, Bioeconomic analysis of the
Lake Kariba Kapenta Fishery).
Bioeconomic Analysis of the Kapenta Fisheries, Lake Kariba 26
The agenda will include the following items:
Introduction to bioeconomic modelling and methods;
The Kapenta Fishery: current situation, a review of biological and economic data
and their validation;
Presentation of the bioeconomic model and development of the various scenarios of
fishing effort allocation;
Evaluation and discussion on results obtained;
Recommendations and the way forward.
A provisional detailed agenda and a prospectus for the workshop will be prepared.
The workshop is planned for early 2013. A date needs to be fixed in accordance with the
development of the work of the National Consultants.
The location for the workshop has not yet been decided; this has to be done in accordance
with the practices followed by the two countries as part of the joint management process
of the Lake Kariba Fishery.
The Working Group is expected to take place over one week. It is suggested that the
workshop is split into two phases:
First phase (3 days): a Technical Committee Meeting with selected resource people. The
mandate of this Committee will be to:
discuss and validate the data and information on the Kapenta Fishery that will be
used to run the bioeconomic model. Some additional data might need processing.
fit and run the model in order to develop the different scenarios; if necessary,
refine the model;
discuss the results and provide recommendations.
Second phase (2 days): a Management Meeting where:
the interest of bioeconomic modelling as a tool for fishery management will be
presented (with specific focus on the Kapenta Fishery)
the previous bioeconomic assessments of the Kapenta Fishery and the preliminary
results of the current assessment and its potential uses for fisheries management
will be presented and discussed.
Conclusion and the way forward 27
Participants
The Technical Committee Meeting will involve technical staff and industry representatives
(Professional Harvester Organizations). An indicative list is given below:
LKRFI: 2 people (Officer in Charge, LKFRI + one other scientist);
One person from the Zimbabwe Park and Wildlife Management Authority in Kariba;
One Economist from the Centre of Applied Social Sciences University of Zimbabwe
(CASS) designated as focal point and National Consultant (to be confirmed);
The two professional Harvester Organizations (IKPA and KPA);
One person from the Research Institute in Sinazongwe, DOF/MAL;
One Statistician, DOF/MAL
One Planner Economist, from the MAF designated as focal point and National
Consultant (to be confirmed);
One person from Siavonga DOF;
The two professional Harvester Organizations (KFA and KAMIDA);
One person in charge of information systems/statistics at the Zambezi River
Authority (ZRA)6;
One resource person from Harvest Help (NGO), Zambia7;
FAO staff.
The Management Meeting will involve participants of the Technical Committee Meeting as
well the fisheries managers and relevant decision makers concerned by the management
of the fishery. An indicative list is given below:
One person from ZPWMA Headquarters;
The Director of the Department of Fisheries/MAL;
Local authorities (Councils);
Traditional leaders;
The Ministry of Finance;
The Lake Navigation Control, Zimbabwe;
Ministry of Works (maritime), Zambia.
6 The ZRA collects data and provides statistics on certain environmental parameters which potentially
affect the productivity of the Kapenta resource. Thus, the ZRA is considered an important stakeholder in the support of the management process of the fishery. The participation of this institution at both the Technical Committee and Management Meetings is therefore important.
7 This NGO was primarily established to help with the resettlement of migrant people after the flooding of the Gwembe Valley for the construction of the dam. Harvest Help has been increasingly active in the Kapenta Fishery; its experience and knowledge could be very useful for the Working Group.
Bioeconomic Analysis of the Kapenta Fisheries, Lake Kariba 28
The participation of the Ministries of Finance of both countries is important for several
reasons. Firstly, it is widely recognized that the Kapenta Fishery is primarily driven by
economic factors. Secondly, a rapid assessment suggests that this fishery has significant
economic potential in terms of wealth creation if managed with such a vision. Finally,
procedures in Zimbabwe are being put in place to increase the cost of licence fees in
Kapenta Fishery, to cover some of the management costs. The Zimbabwean Ministry of
Finance is directly involved in this process alongside the ZPWMA and stakeholders in the
industry; the bioeconomic modelling could serve as a useful tool for decision-making
support on such issues.
5.2.3 Other
During the coming weeks, communication will be maintained by Skype or email with Mr.
Newman Songore, Fishery Officer at the FAO Sub regional Office for Southern Africa,
Harare, for additional documents and pending data.
There will also be regular contact with Mr. Itai H. Tendaupenyu, the Officer in Charge and
Senior Ecologist at LKFRI in Zimbabwe and Mr. Mweemba Chijoka, Fisheries Statistician,
DOF/MAL in Zambia, to discuss any questions regarding the data required for modelling.
This concerns, in particular, catch and effort data and CPUE, but also the needs for data on
environmental factors that could be obtained from other institutions (e.g. Zambezi River
Authority).
References 29
References
FAO Technical Consultation
Report of the Fifth Technical Consultation on Development and Management of the
Fisheries of Lake Kariba (pre-publication). FAO sub regional Office for Southern Africa.
Siavonga, Zambia 11–13 September 2012. FAO, 2012.
Report of the Fourth Technical Consultation on Development and Management of the
Fisheries of Lake Kariba (pre-publication). FAO subregional Office for Southern Africa.
Kariba, Zimbabwe 18–20 May 2010. FAO, 2010.
Report of the Third Technical Consultation on Development and Management of the
Fisheries of Lake Kariba. FAO Fisheries Report No. 824 SFS/R824 (En). ISSN 0429-9337.
Siavonga, Zambia, 26–27 October 2006. FAO, 2006.
Report of the Second Technical Consultation on Development and Management of the
Fisheries of Lake Kariba. FAO Fisheries Report No. 766 SAFR/R766 (En). ISSN 0429-
9337. Kariba, Zimbabwe, 30 November–1 December 2004. FAO, 2004.
Report of the Ad Hoc Technical Consultation on the Development and Management of the
Fisheries of Lake Kariba. (Fao Fisheries Report n° 720). Siavonga, Republic of Zambia,
19-20 Nov 2002. FAO, 2002.
Frame Surveys
Lake Kariba Fishery Frame Survey Report Zambia (draft). Ministry of Agriculture and
Livestock & Department of Fisheries. Compiled by: Mbamwai Mbewe, Chijoka Mweemba,
Ian Habulembe, Emmanuel Silwimba. FAO, 2011.
Lake Kariba Fishery Frame Survey Report, Zimbabwe. FAO, 2011.
Bioeconomic modelling
Report of the Sub regional Workshop on Fishery Bioeconomic modelling. RAF/87/099-
TD/43/92 (En). 17-21 February 1992, Kariba, Zimbabwe, Benoît Horemans, Economist,
IFP Project. IFIP Project, 1992.
Working Group on Bioeconomic Assessment of Kapenta (Limnothrissa miodon) in Lake
Kariba and Zimbabwe. Report N°50. Kafu River Hotel, 11-19 July 1997.
Zambia/Zimbabwe SADCC Fisheries Project, 1997.
An Economic Assessment of the Lake Kariba Fishery in Zambia and Zimbabwe.
Zambia/Zimbabwe SADCC Fisheries Project Report N°14. 1992. Andrew Palfreman &
Jarle Lovland.
Bioeconomic Analysis of the Kapenta Fisheries, Lake Kariba 30
The Economic Development of the Kapenta Fishery, Lake Kariba (Zimbabwe/Zambia).
Thesis submitted in partial fulfilment of the requirements for the degree of Master of
Science in International Fisheries Management. Norwegian College of Fishery Science
University of Tromso. Loveness Madamombe, 2002.
Sustainability and Management of Lake Kariba, the Institute for Policy Studies (IPS). A
report submitted to the Zambia National Farmers Union (ZNFU). Funded by KFA H. G.
Mudenda, 2010.
Other documents on Lake Kariba Fishery
The Kapenta Fishery of Lake Kariba and its Contributions to Food Security in Zimbabwe
(technical paper to be published by the FAO). Zimbabwe Parks and Wildlife Management
Authority. Lake Kariba Fisheries Research Institute. Nobuhle Ndhlovu & Itai Hilary
Tendaupenyu.
The Status and Management of the Lake Kariba Fisheries (Zambia and Zimbabwe)
UNDP/FO Regional Project for Inland Fisheries and Planning (IFIP). Machena C, 1990.
Annexes 31
Annex A. Lists of persons met
Zimbabwe
Zambia
Bioeconomic Analysis of the Kapenta Fisheries, Lake Kariba 32
Annex B. List of minimum information required for the
bioeconomic modelling of the Kapenta Fishery
Minimum data and information required for the theme: Biology and Production
Catches (time series since the start of the fishery if possible) in both Zimbabwe
and Zambia;
CPUE (time series since the start of the fishery if possible) and catch composition
by boat (main species and bycatch if any) in both Zimbabwe and Zambia;
Fishing effort (time series since the beginning of the fishery if possible): number of
registered and licensed rigs; fleet characteristics; number of nights fished both in
Zimbabwe and Zambia;
The largest time series of abundance indices (e.g. results of acoustic surveys);
Parameters of linear growth (Von Bertalanffy) and weight gain. For the equation of
linear growth: size range of the sample that was used to determine the equation of
Von Bertalanffy and number of individuals used;
Length frequencies of annual catches by fleet and year;
Estimated mortality rates (Fishing Mortality and Natural Mortality);
Biological modelling already undertaken in Kapenta Fishery as well as existing work
on the bioeconomic modelling on this fishery;
Time series of abiotic factors (rainfall patterns, lake levels, catchment inflow…).
Minimum data and information required for the theme: Economic Structural
Analysis of the Fleets
Prices and quantities (monthly time series), price per size (if different prices exist
according to the size of the product) in both countries;
The market, export and destination;
Employment (total and by boat) in both countries and by nationality (national,
expatriate);
Fleet characteristics (description) including property of the boats, in both
countries;
Number of fishing nights per boat per annum in both countries;
Remuneration system in the fishery in both countries (fixed salary or sharing
system of the added value between fishermen and boat owners);
Some anonymous (without the name of the company for confidentiality reasons)
operating accounts of some Zimbabwean and Zambian boats over recent years
(last three years);
Estimation of production costs: (i) variable costs (fuel and lubrication, supplies,
maintenance and repairs, crew wages, taxes (import tax, land property tax…), (ii)
fixed costs (depreciation, interest, insurance, administration salaries,
administration supplies, licence fees, other costs);
Estimation of investment (boat, including engine, fishing equipment…);
Annexes 33
Minimum wage guarantee, interest rate, risk-free rate of return of capital,
inflation rate, exchange rate (US $), etc.
Minimum data and information for the theme: Regulatory Systems, in both
countries
Description of the management system (political, institutional and legal
frameworks);
Review of technical conservation measures (fishing equipment, net mesh size,
closing periods, prohibited areas…);
Review of the fishing rights allocation system (licensing system) and amount of
royalties paid for access;
Subsidies (fuel, others…) if any;
Royalties, taxes on profits (or income), licence fees paid for access, are licence
fees used to support the management system? (e.g. control/surveillance,
research, etc.).
Bioeconomic Analysis of the Kapenta Fisheries, Lake Kariba 34
Annex C. Key documents and information gathered during
the mission
Policy, regulation, management
Protocol on the economic and technical cooperation between the Government of
the Republic of Zimbabwe and the Government of the Republic of Zambia
concerning the management and development of fisheries on Lake Kariba and the
transboundary waters of the Zambezi River;
Zimbabwean and Zambian Fisheries policy documents (drafts);
Fisheries regulations, Zimbabwe (Licence) and Zambia (Fisheries Act);
Experiences in Research and Management of Shared Inland Fisheries Resources.
Workshop proceedings 12 – 14 July 1999. Cutty Sark Hotel, Zimbabwe.
Biology and stock assessment
A Comprehensive Analysis of Maximum Entropy and Analytical Models for
Assessing Kapenta Stocks in Lake Kariba, Itai Hilary Tendaupenyu, Hee-Dong Pyo
& Chang-ik Zhang (draft);
Working Group on the Assessment of Kapenta in Lake Kariba. Zambia/Zimbabwe
SADCC Fisheries Project Report N°41.
Economy and bioeconomic modelling
2008 Statistical and Economic Analysis of Kapenta Catches in Lake Kariba, Itai
H. Tendaupenyu, LKRFI;
Standardized operating account from KPA operators, prepared within the
framework of the on-going process to revise licence fees, Zimbabwe, 2013;
An Economic Assessment of the Lake Kariba Fishery in Zambia and Zimbabwe.
Zambia/Zimbabwe SADCC Fisheries Project Report N°14. 1992. Andrew
Palfreman & Jarle Lovland;
Working Group on the Bioeconomic Assessment of Kapenta (Limnothrissa
miodon) in Lake Kariba and Zimbabwe. Zambia/Zimbabwe SADCC Fisheries
Project Report N°50. 11-19 July 1997, Kafu River Hotel;
Sustainability and management of Lake Kariba. H. G. Mudenda, Institute for
Policy Studies (IPS). A report submitted to the Zambia National Farmers Union
(ZNFU), funded by KFA.
Annexes 35
Annex D. Photos
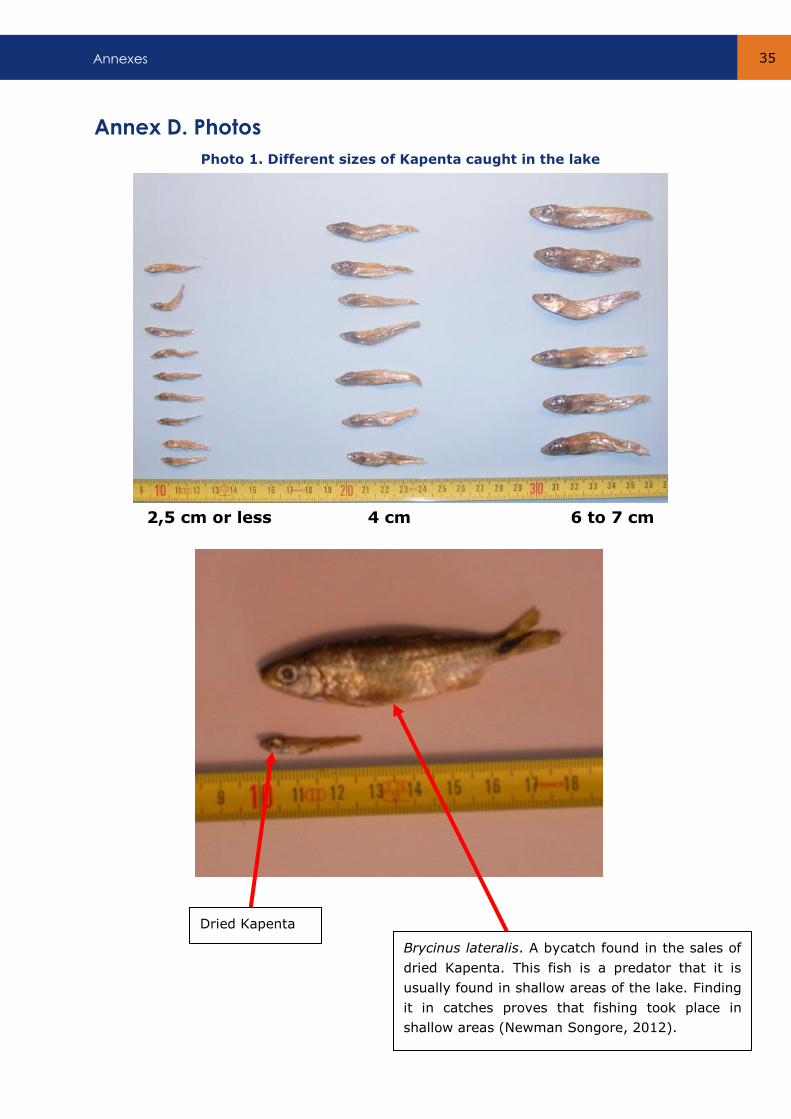
Photo 1. Different sizes of Kapenta caught in the lake
2,5 cm or less 4 cm 6 to 7 cm
Dried Kapenta
Brycinus lateralis. A bycatch found in the sales of
dried Kapenta. This fish is a predator that it is
usually found in shallow areas of the lake. Finding
it in catches proves that fishing took place in
shallow areas (Newman Songore, 2012).
Bioeconomic Analysis of the Kapenta Fisheries, Lake Kariba 36
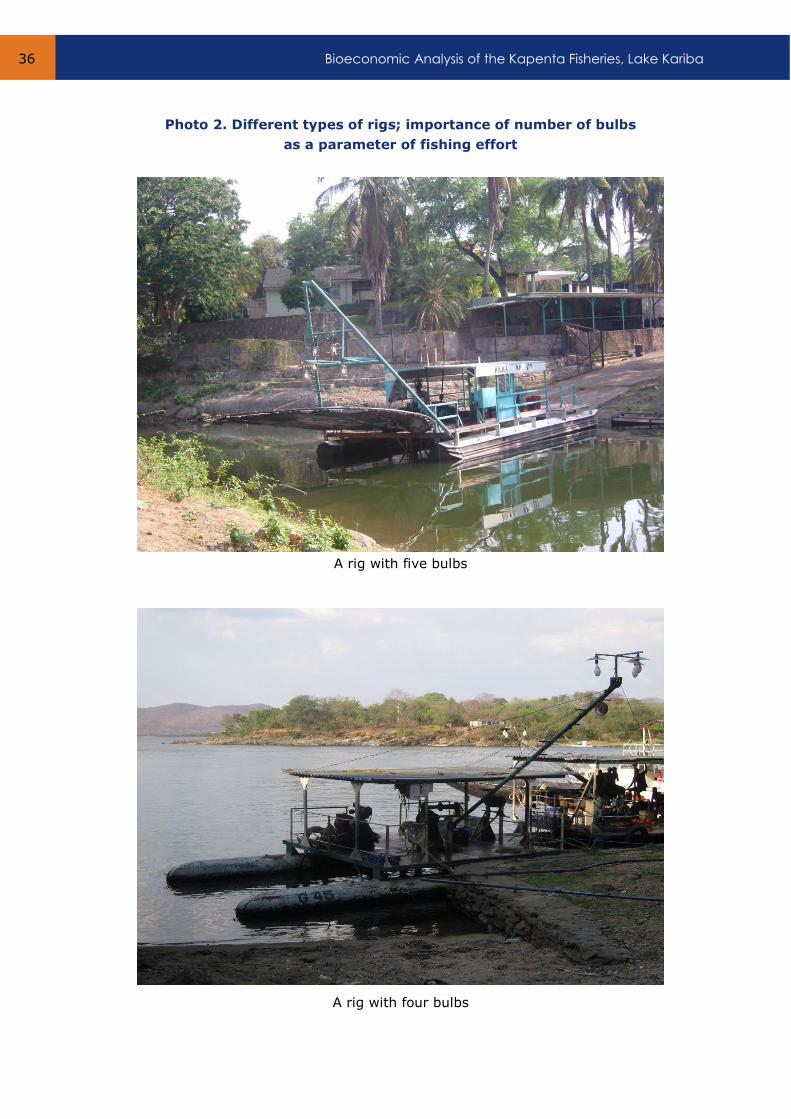
Photo 2. Different types of rigs; importance of number of bulbs
as a parameter of fishing effort
A rig with five bulbs
A rig with four bulbs
Annexes 37
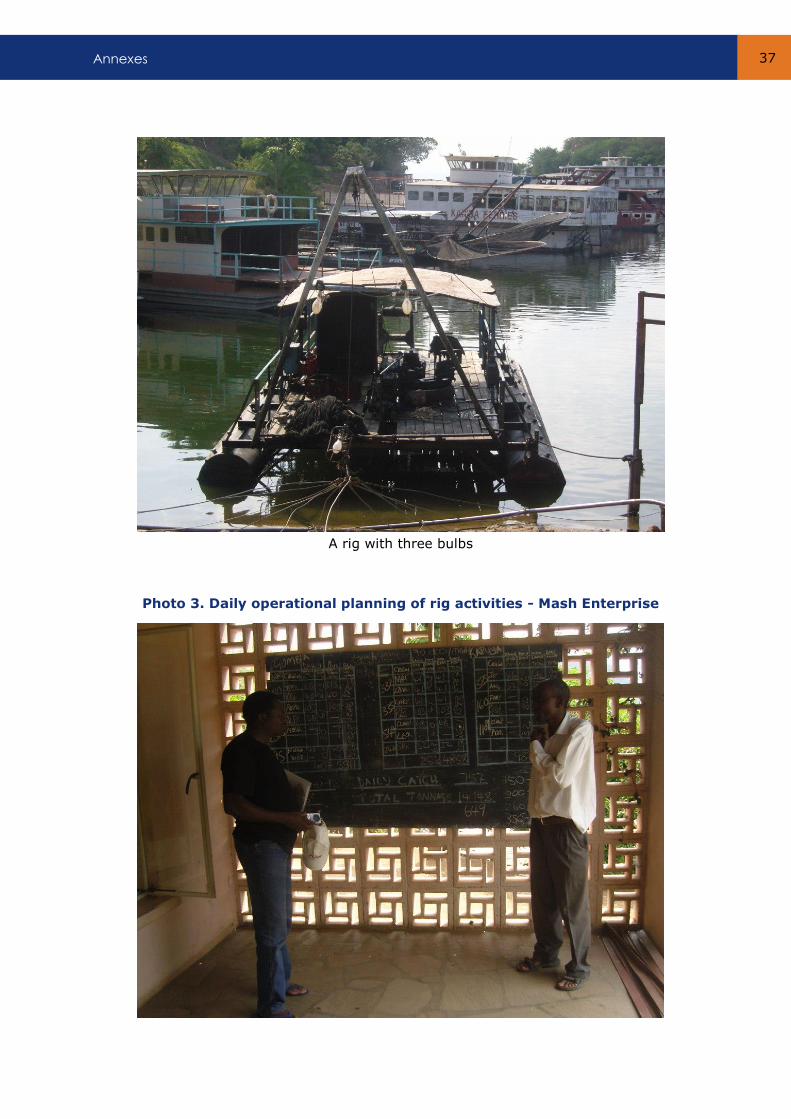
A rig with three bulbs
Photo 3. Daily operational planning of rig activities - Mash Enterprise

Bioeconomic Analysis of the Kapenta Fisheries, Lake Kariba 38
Photo 4. The dip net
Photo 5. Motorization of the rig and the winch
Annexes 39
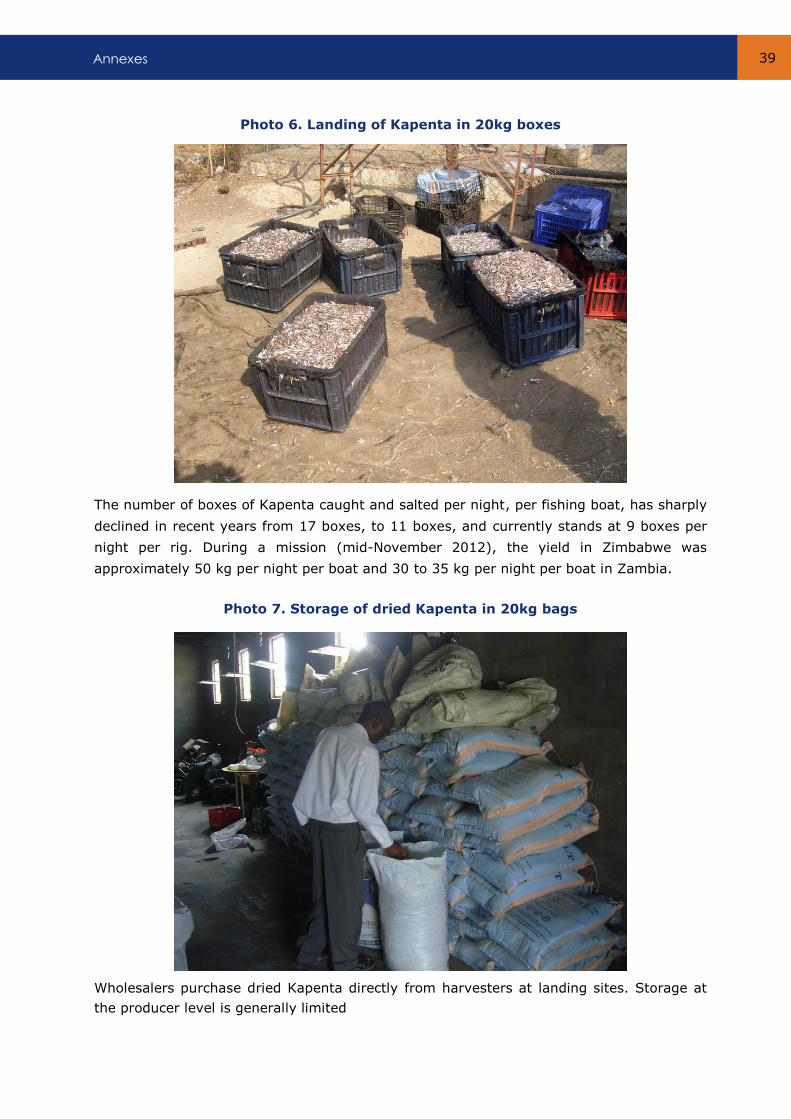
Photo 6. Landing of Kapenta in 20kg boxes
The number of boxes of Kapenta caught and salted per night, per fishing boat, has sharply
declined in recent years from 17 boxes, to 11 boxes, and currently stands at 9 boxes per
night per rig. During a mission (mid-November 2012), the yield in Zimbabwe was
approximately 50 kg per night per boat and 30 to 35 kg per night per boat in Zambia.
Photo 7. Storage of dried Kapenta in 20kg bags
Wholesalers purchase dried Kapenta directly from harvesters at landing sites. Storage at
the producer level is generally limited
Bioeconomic Analysis of the Kapenta Fisheries, Lake Kariba 40
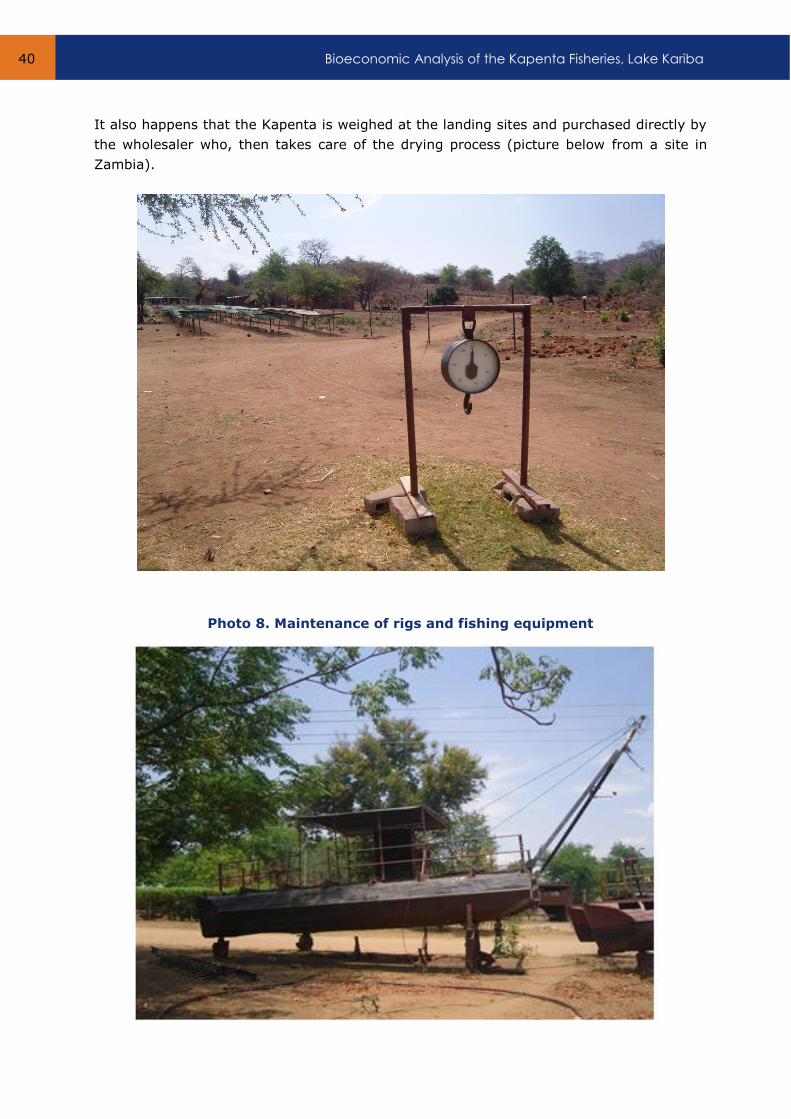
It also happens that the Kapenta is weighed at the landing sites and purchased directly by
the wholesaler who, then takes care of the drying process (picture below from a site in
Zambia).
Photo 8. Maintenance of rigs and fishing equipment
Annexes 41
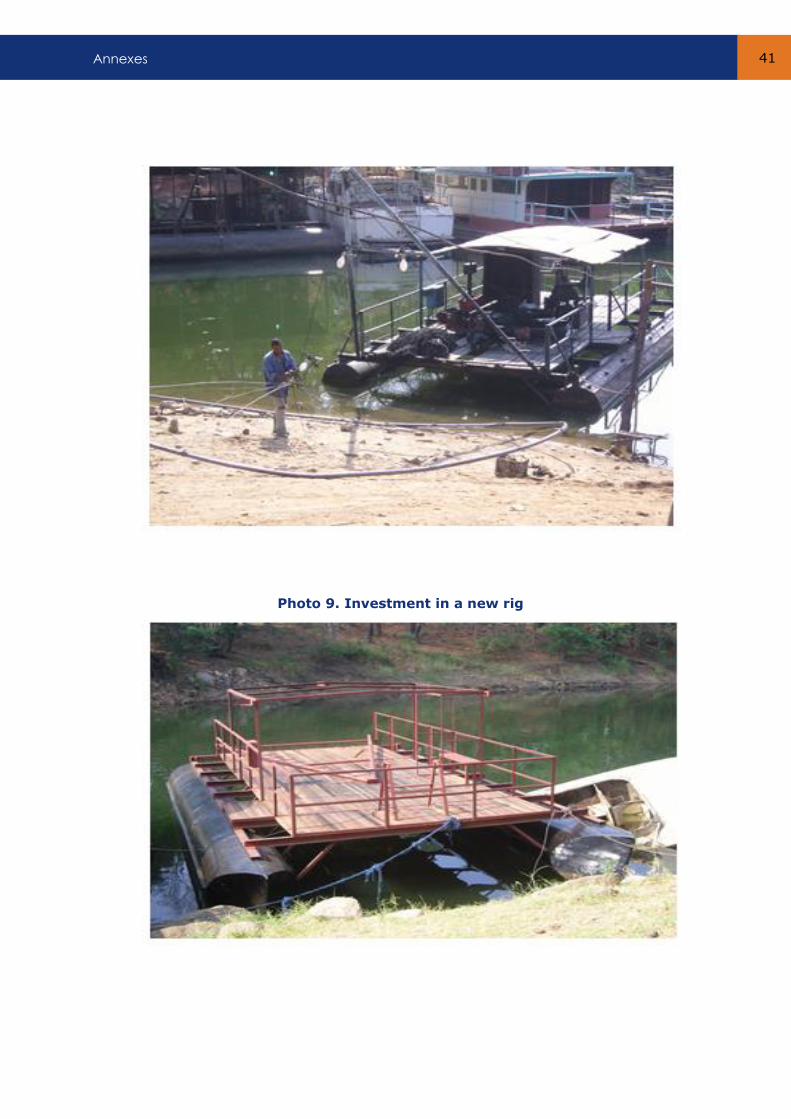
Photo 9. Investment in a new rig
Bioeconomic Analysis of the Kapenta Fisheries, Lake Kariba 42
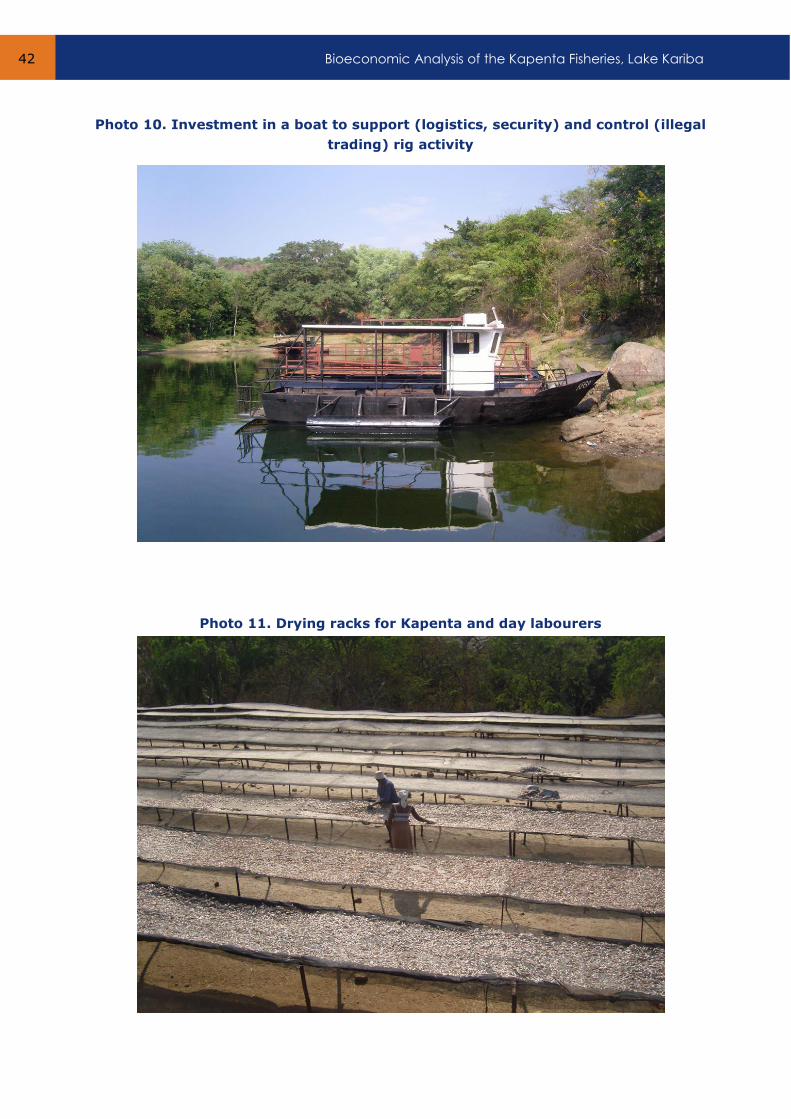
Photo 10. Investment in a boat to support (logistics, security) and control (illegal
trading) rig activity
Photo 11. Drying racks for Kapenta and day labourers
Annexes 43
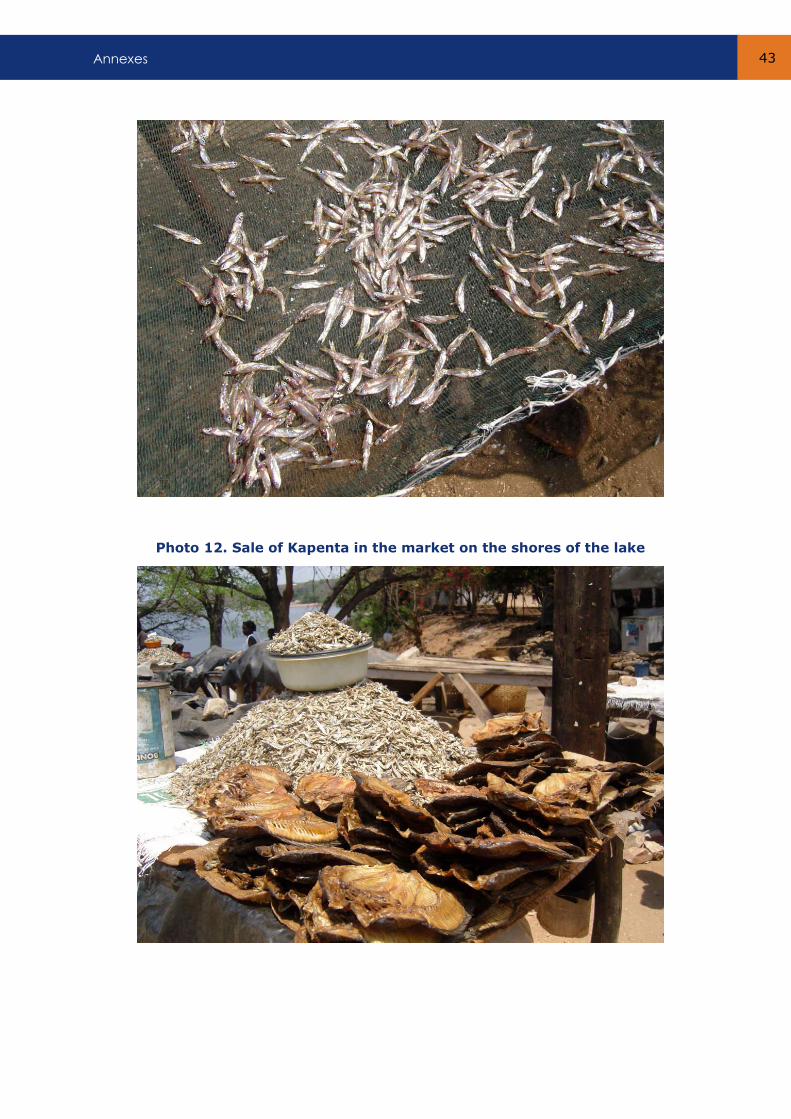
Photo 12. Sale of Kapenta in the market on the shores of the lake
Bioeconomic Analysis of the Kapenta Fisheries, Lake Kariba 44
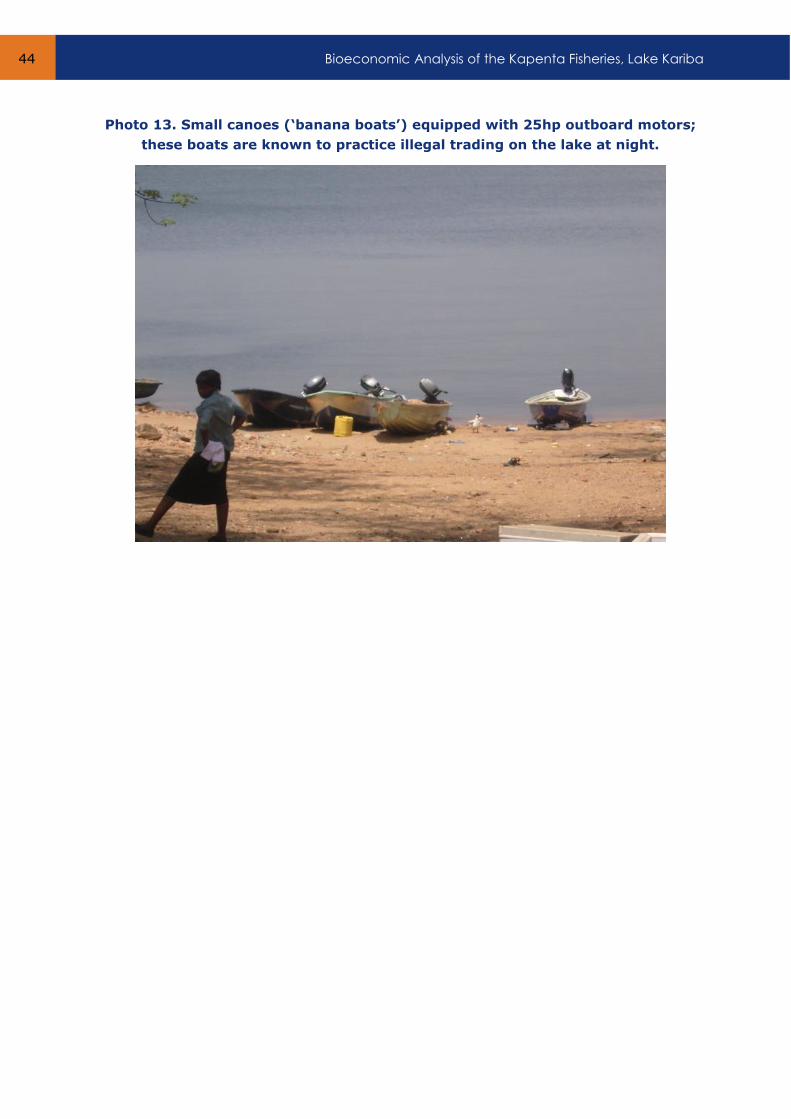
Photo 13. Small canoes (‘banana boats’) equipped with 25hp outboard motors;
these boats are known to practice illegal trading on the lake at night.
Annexes 45
Annex E. Guidelines/questionnaire for the economic survey
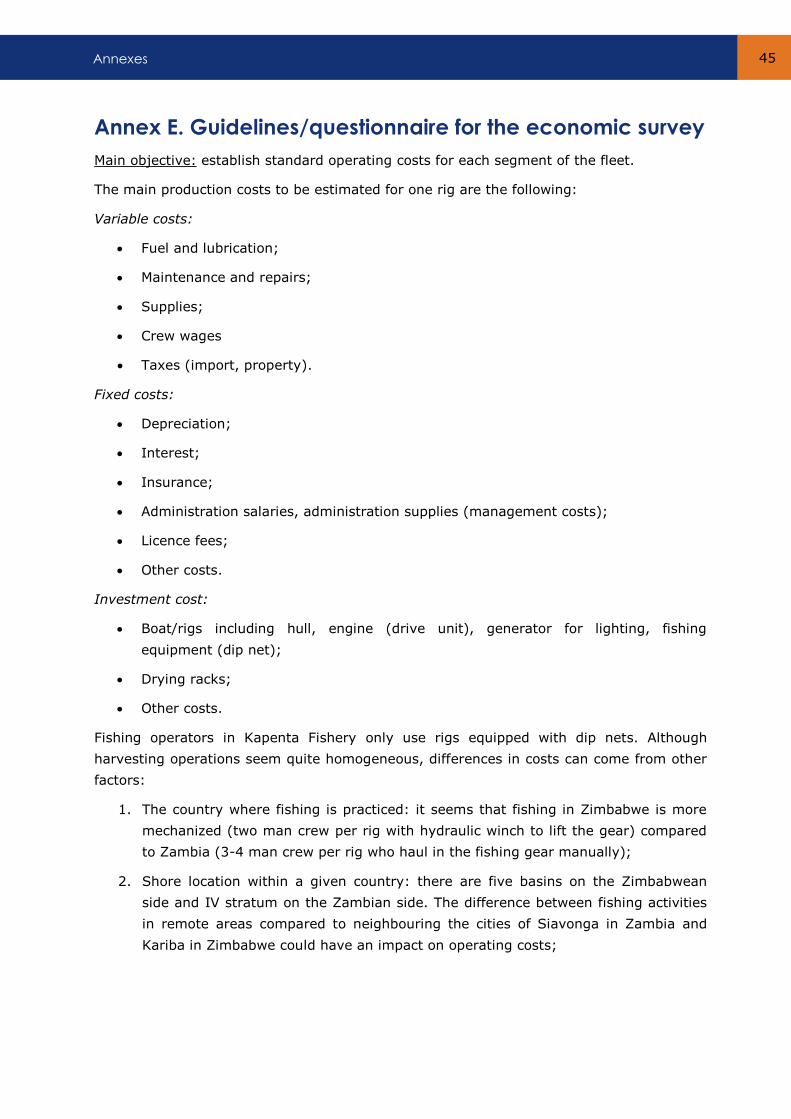
Main objective: establish standard operating costs for each segment of the fleet.
The main production costs to be estimated for one rig are the following:
Variable costs:
Fuel and lubrication;
Maintenance and repairs;
Supplies;
Crew wages
Taxes (import, property).
Fixed costs:
Depreciation;
Interest;
Insurance;
Administration salaries, administration supplies (management costs);
Licence fees;
Other costs.
Investment cost:
Boat/rigs including hull, engine (drive unit), generator for lighting, fishing
equipment (dip net);
Drying racks;
Other costs.
Fishing operators in Kapenta Fishery only use rigs equipped with dip nets. Although
harvesting operations seem quite homogeneous, differences in costs can come from other
factors:
1. The country where fishing is practiced: it seems that fishing in Zimbabwe is more
mechanized (two man crew per rig with hydraulic winch to lift the gear) compared
to Zambia (3-4 man crew per rig who haul in the fishing gear manually);
2. Shore location within a given country: there are five basins on the Zimbabwean
side and IV stratum on the Zambian side. The difference between fishing activities
in remote areas compared to neighbouring the cities of Siavonga in Zambia and
Kariba in Zimbabwe could have an impact on operating costs;
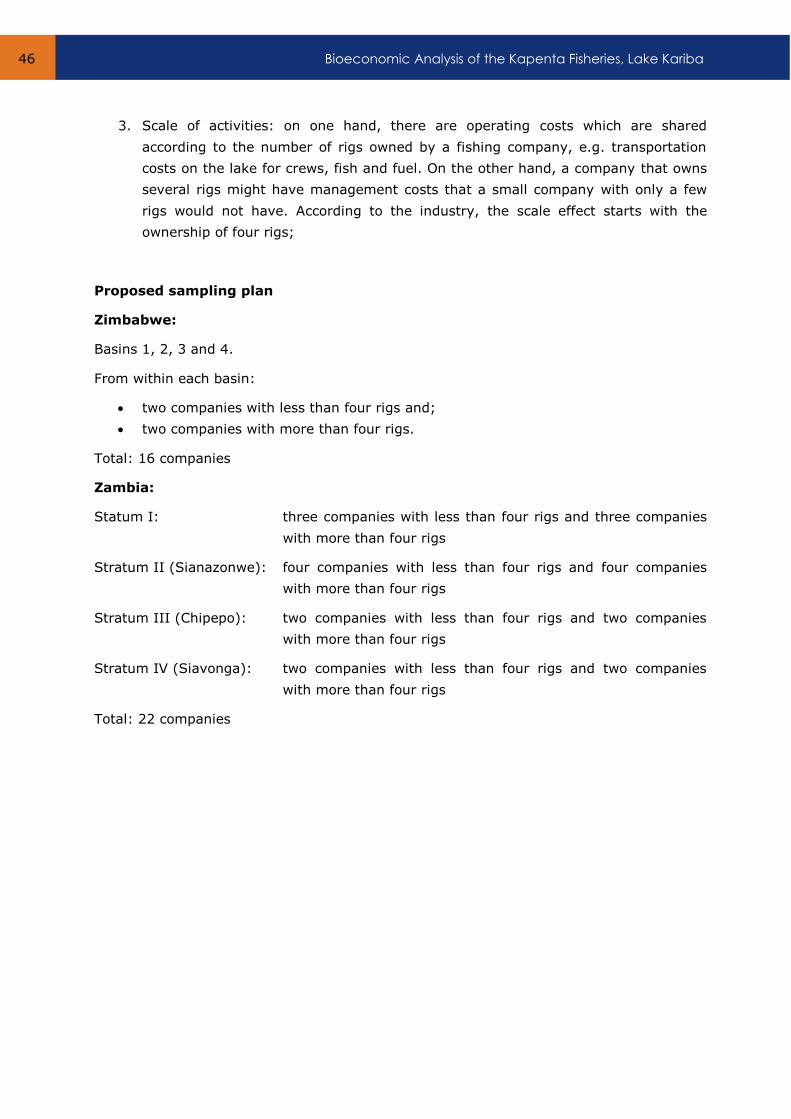
Bioeconomic Analysis of the Kapenta Fisheries, Lake Kariba 46
3. Scale of activities: on one hand, there are operating costs which are shared
according to the number of rigs owned by a fishing company, e.g. transportation
costs on the lake for crews, fish and fuel. On the other hand, a company that owns
several rigs might have management costs that a small company with only a few
rigs would not have. According to the industry, the scale effect starts with the
ownership of four rigs;
Proposed sampling plan
Zimbabwe:
Basins 1, 2, 3 and 4.
From within each basin:
two companies with less than four rigs and;
two companies with more than four rigs.
Total: 16 companies
Zambia:
Statum I: three companies with less than four rigs and three companies
with more than four rigs
Stratum II (Sianazonwe): four companies with less than four rigs and four companies
with more than four rigs
Stratum III (Chipepo): two companies with less than four rigs and two companies
with more than four rigs
Stratum IV (Siavonga): two companies with less than four rigs and two companies
with more than four rigs
Total: 22 companies
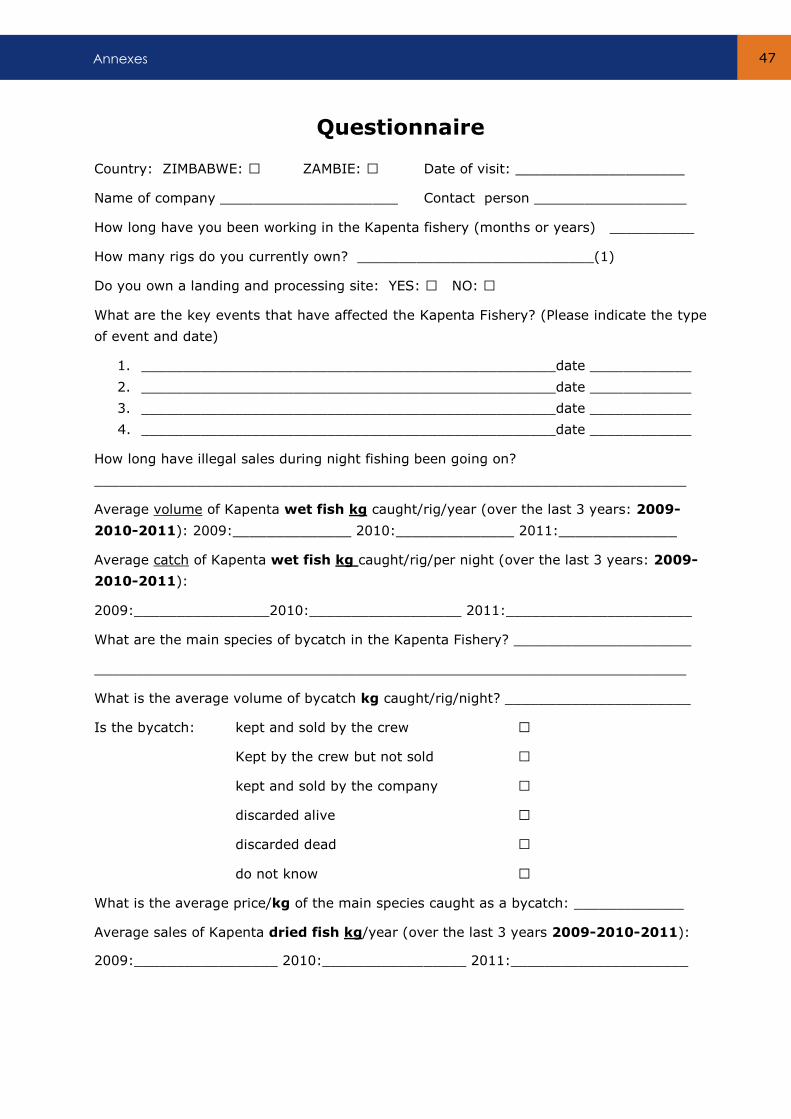
Annexes 47
Questionnaire
Country: ZIMBABWE: □ ZAMBIE: □ Date of visit: ____________________
Name of company _____________________ Contact person __________________
How long have you been working in the Kapenta fishery (months or years) __________
How many rigs do you currently own? ____________________________(1)
Do you own a landing and processing site: YES: □ NO: □
What are the key events that have affected the Kapenta Fishery? (Please indicate the type
of event and date)
1. _________________________________________________date ____________
2. _________________________________________________date ____________
3. _________________________________________________date ____________
4. _________________________________________________date ____________
How long have illegal sales during night fishing been going on?
______________________________________________________________________
Average volume of Kapenta wet fish kg caught/rig/year (over the last 3 years: 2009-
2010-2011): 2009:______________ 2010:______________ 2011:______________
Average catch of Kapenta wet fish kg caught/rig/per night (over the last 3 years: 2009-
2010-2011):
2009:________________2010:__________________ 2011:______________________
What are the main species of bycatch in the Kapenta Fishery? _____________________
______________________________________________________________________
What is the average volume of bycatch kg caught/rig/night? ______________________
Is the bycatch: kept and sold by the crew □
Kept by the crew but not sold □
kept and sold by the company □
discarded alive □
discarded dead □
do not know □
What is the average price/kg of the main species caught as a bycatch: _____________
Average sales of Kapenta dried fish kg/year (over the last 3 years 2009-2010-2011):
2009:_________________ 2010:_________________ 2011:_____________________
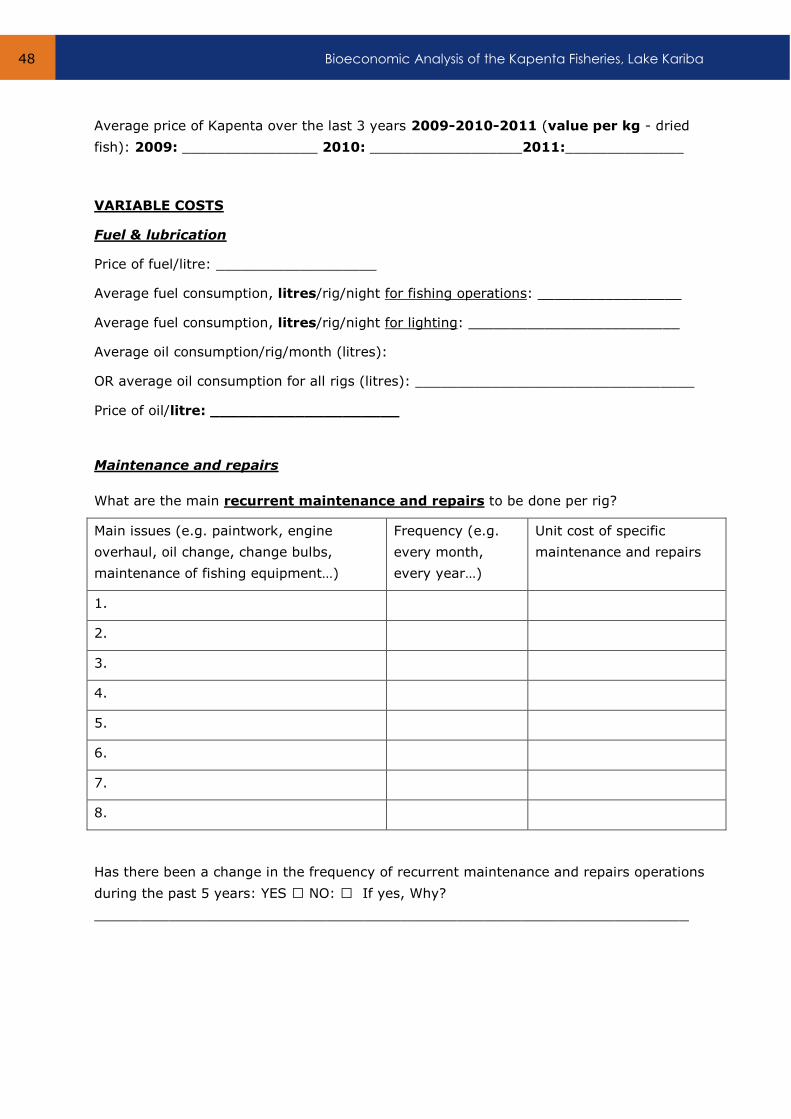
Bioeconomic Analysis of the Kapenta Fisheries, Lake Kariba 48
Average price of Kapenta over the last 3 years 2009-2010-2011 (value per kg - dried
fish): 2009: ________________ 2010: __________________2011:______________
VARIABLE COSTS
Fuel & lubrication
Price of fuel/litre: ___________________
Average fuel consumption, litres/rig/night for fishing operations: _________________
Average fuel consumption, litres/rig/night for lighting: _________________________
Average oil consumption/rig/month (litres):
OR average oil consumption for all rigs (litres): _________________________________
Price of oil/litre: ____________________
Maintenance and repairs
What are the main recurrent maintenance and repairs to be done per rig?
Main issues (e.g. paintwork, engine
overhaul, oil change, change bulbs,
maintenance of fishing equipment…)
Frequency (e.g.
every month,
every year…)
Unit cost of specific
maintenance and repairs
1.
2.
3.
4.
5.
6.
7.
8.
Has there been a change in the frequency of recurrent maintenance and repairs operations
during the past 5 years: YES □ NO: □ If yes, Why?
________________________________________________________________
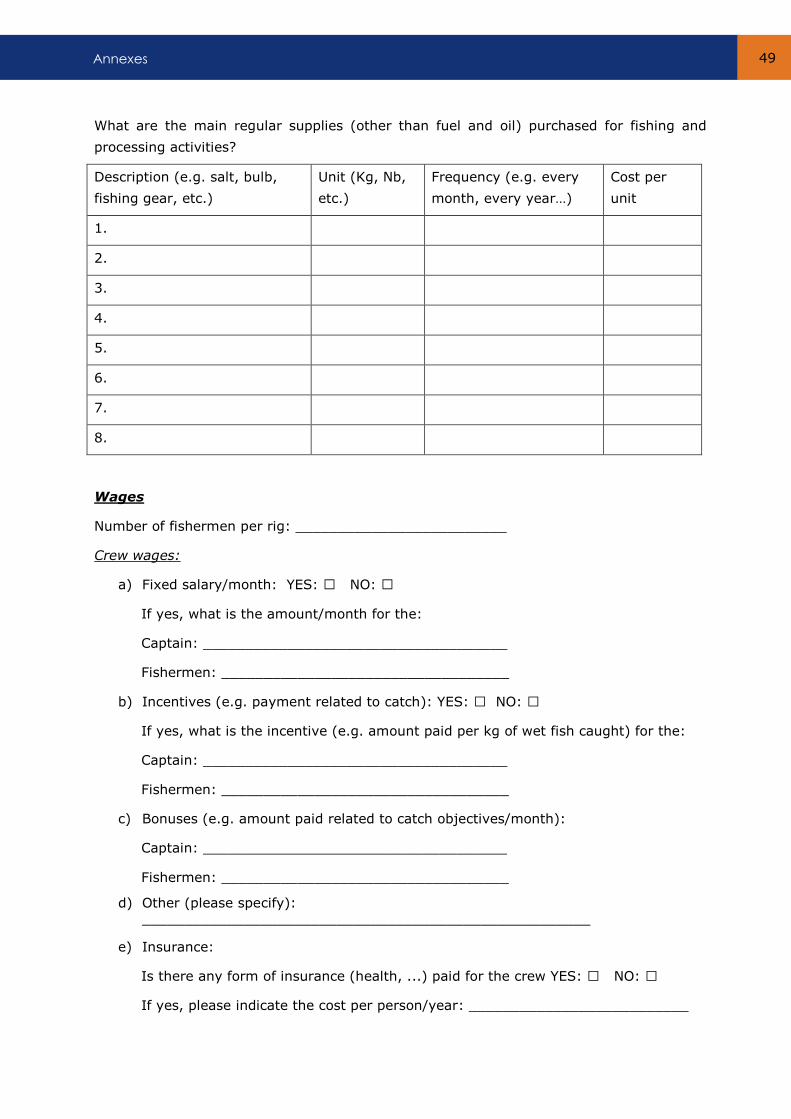
Annexes 49
What are the main regular supplies (other than fuel and oil) purchased for fishing and
processing activities?
Description (e.g. salt, bulb,
fishing gear, etc.)
Unit (Kg, Nb,
etc.)
Frequency (e.g. every
month, every year…)
Cost per
unit
1.
2.
3.
4.
5.
6.
7.
8.
Wages
Number of fishermen per rig: _________________________
Crew wages:
a) Fixed salary/month: YES: □ NO: □
If yes, what is the amount/month for the:
Captain: ____________________________________
Fishermen: __________________________________
b) Incentives (e.g. payment related to catch): YES: □ NO: □
If yes, what is the incentive (e.g. amount paid per kg of wet fish caught) for the:
Captain: ____________________________________
Fishermen: __________________________________
c) Bonuses (e.g. amount paid related to catch objectives/month):
Captain: ____________________________________
Fishermen: __________________________________
d) Other (please specify):
_____________________________________________________
e) Insurance:
Is there any form of insurance (health, ...) paid for the crew YES: □ NO: □
If yes, please indicate the cost per person/year: __________________________
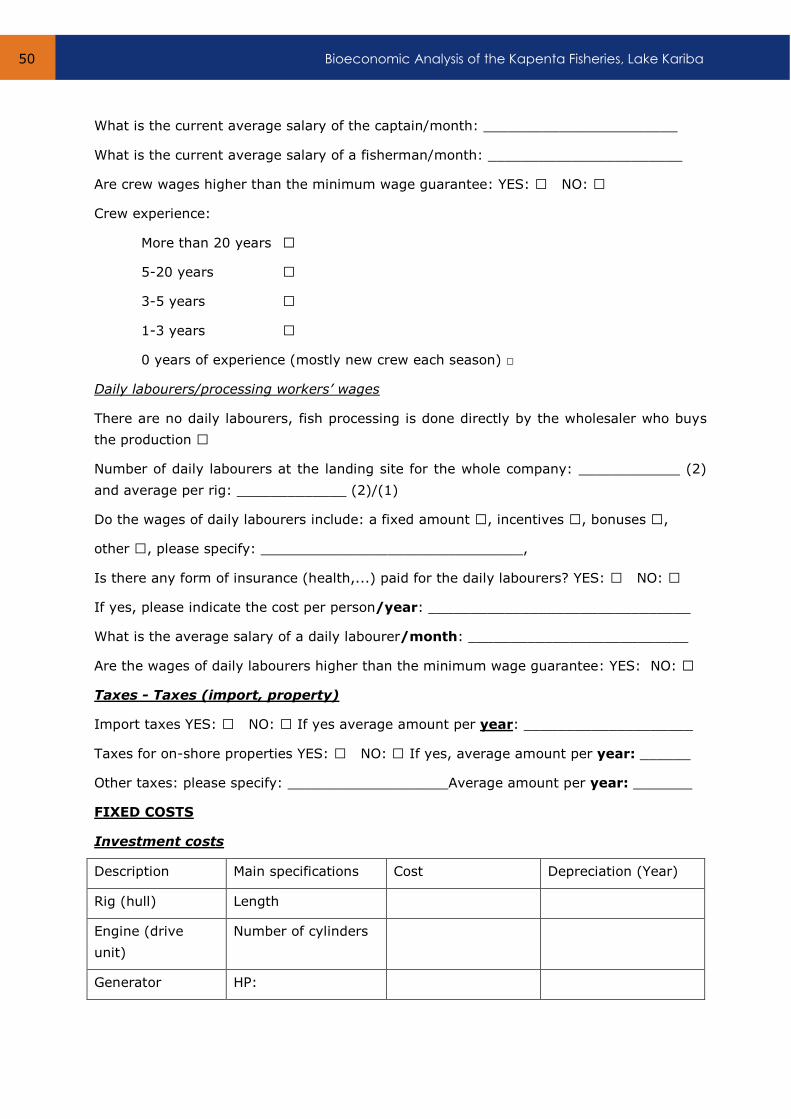
Bioeconomic Analysis of the Kapenta Fisheries, Lake Kariba 50
What is the current average salary of the captain/month: _______________________
What is the current average salary of a fisherman/month: _______________________
Are crew wages higher than the minimum wage guarantee: YES: □ NO: □
Crew experience:
More than 20 years □
5-20 years □
3-5 years □
1-3 years □
0 years of experience (mostly new crew each season) □
Daily labourers/processing workers’ wages
There are no daily labourers, fish processing is done directly by the wholesaler who buys
the production □
Number of daily labourers at the landing site for the whole company: ____________ (2)
and average per rig: _____________ (2)/(1)
Do the wages of daily labourers include: a fixed amount □, incentives □, bonuses □,
other □, please specify: _______________________________,
Is there any form of insurance (health,...) paid for the daily labourers? YES: □ NO: □
If yes, please indicate the cost per person/year: _______________________________
What is the average salary of a daily labourer/month: __________________________
Are the wages of daily labourers higher than the minimum wage guarantee: YES: NO: □
Taxes - Taxes (import, property)
Import taxes YES: □ NO: □ If yes average amount per year: ____________________
Taxes for on-shore properties YES: □ NO: □ If yes, average amount per year: ______
Other taxes: please specify: ___________________Average amount per year: _______
FIXED COSTS
Investment costs
Description Main specifications Cost Depreciation (Year)
Rig (hull) Length
Engine (drive
unit)
Number of cylinders
Generator HP:
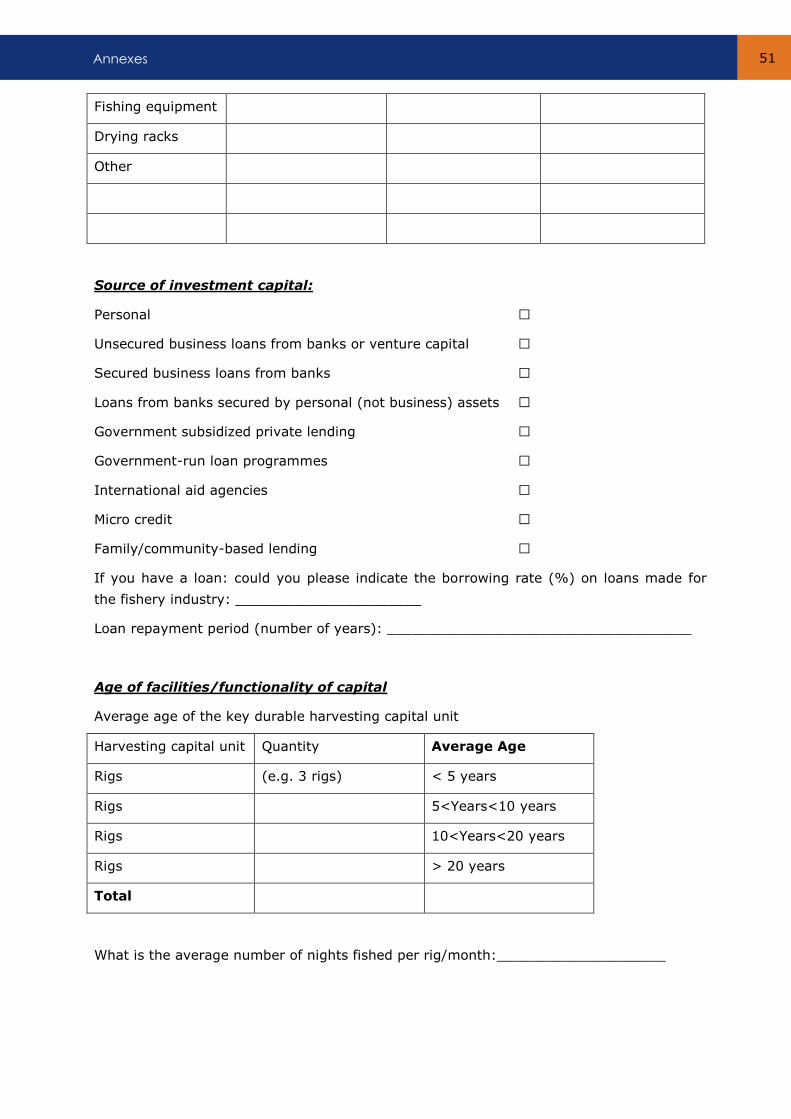
Annexes 51
Fishing equipment
Drying racks
Other
Source of investment capital:
Personal □
Unsecured business loans from banks or venture capital □
Secured business loans from banks □
Loans from banks secured by personal (not business) assets □
Government subsidized private lending □
Government-run loan programmes □
International aid agencies □
Micro credit □
Family/community-based lending □
If you have a loan: could you please indicate the borrowing rate (%) on loans made for
the fishery industry: ______________________
Loan repayment period (number of years): ____________________________________
Age of facilities/functionality of capital
Average age of the key durable harvesting capital unit
Harvesting capital unit Quantity Average Age
Rigs (e.g. 3 rigs) < 5 years
Rigs 5<Years<10 years
Rigs 10<Years<20 years
Rigs > 20 years
Total
What is the average number of nights fished per rig/month:____________________
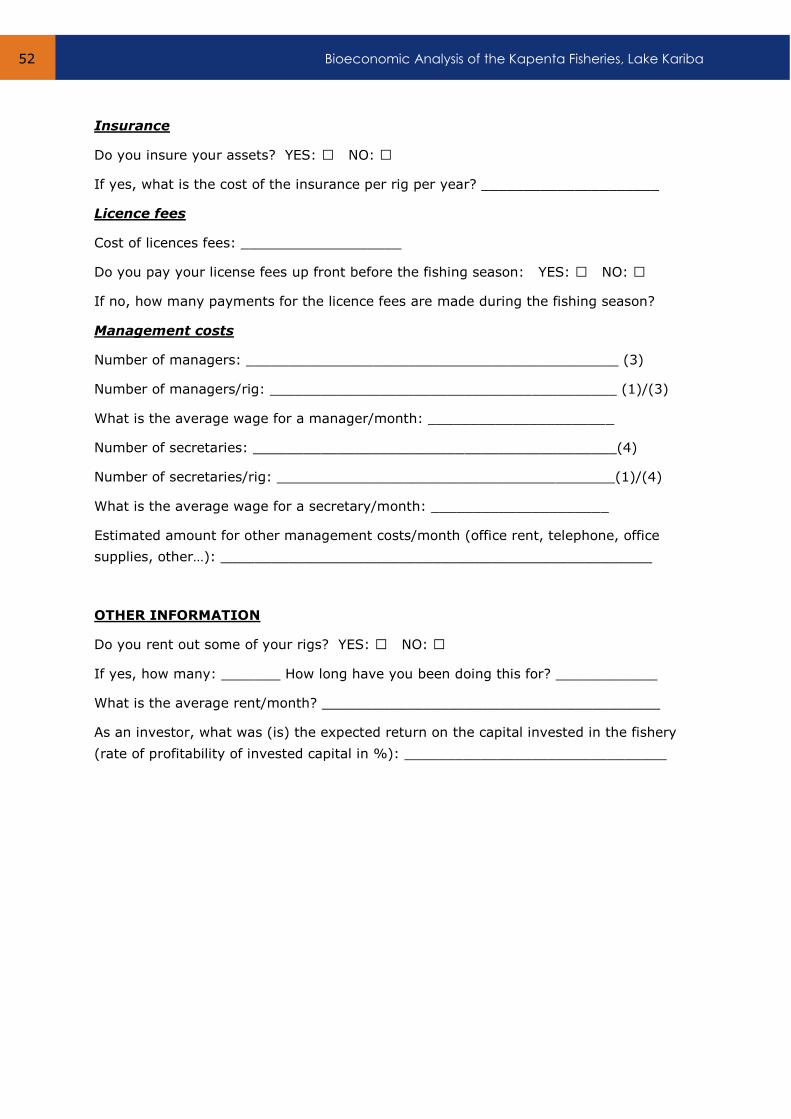
Bioeconomic Analysis of the Kapenta Fisheries, Lake Kariba 52
Insurance
Do you insure your assets? YES: □ NO: □
If yes, what is the cost of the insurance per rig per year? _____________________
Licence fees
Cost of licences fees: ___________________
Do you pay your license fees up front before the fishing season: YES: □ NO: □
If no, how many payments for the licence fees are made during the fishing season?
Management costs
Number of managers: ____________________________________________ (3)
Number of managers/rig: _________________________________________ (1)/(3)
What is the average wage for a manager/month: ______________________
Number of secretaries: ___________________________________________(4)
Number of secretaries/rig: ________________________________________(1)/(4)
What is the average wage for a secretary/month: _____________________
Estimated amount for other management costs/month (office rent, telephone, office
supplies, other…): ___________________________________________________
OTHER INFORMATION
Do you rent out some of your rigs? YES: □ NO: □
If yes, how many: _______ How long have you been doing this for? ____________
What is the average rent/month? ________________________________________
As an investor, what was (is) the expected return on the capital invested in the fishery
(rate of profitability of invested capital in %): _______________________________

SmartFish is a regional fisheries project managed by the Indian Ocean Commission, funded by the European Union and co-implemented by the Food and Agriculture Organization of the United Nations. SmartFish, which operates in 20 countries throughout the East and Southern Africa - Indian Ocean region, focuses on fisheries governance, management, monitoring, control and surveillance, trade, and food security.
For several years, the FAO has been supporting a joint process of fisheries management between Zimbabwe and Zambia on Lake Kariba. Following various meetings between the two riparian countries, the development of a bioeconomic modelling of the Kapenta Fishery was recommended. This bioeconomic modelling will be developed through a participatory process that will involve various public and private stakeholders of this fishery.
This report documents the results of the first phase of a bioeconomic modelling exercise that will be carried out to examine distinct scenarios concerning fishing effort and to provide advice on the optimum number of fishing rigs that should be licensed in Zambia and Zimbabwe.