county of san diego woodside avenue extended detention ... · pdf filewoodside avenue extended...
TRANSCRIPT
County of San Diego Woodside Avenue Extended Detention Basin
Effectiveness Assessment Monitoring Grant Agreement No. 04-067-559-0
Draft Interim Report
Prepared For: County of San Diego Department of Public Works 5555 Overland Avenue San Diego, CA 92123 July 2006
County of San Diego Woodside Avenue Extended Detention Basin
Effectiveness Assessment Monitoring Grant Agreement No. 04-067-559-0
Draft Interim Report
Prepared For:
County of San Diego Department of Public Works
5555 Overland Avenue San Diego, California 92123
Prepared By:
Weston Solutions, Inc. 2433 Impala Drive
Carlsbad, California 92010
July 2006
Grant Agreement No. 04-067-559-0 June 2006
Weston Solutions, Inc. i
TABLE OF CONTENTS
1.0 INTRODUCTION .............................................................................................................. 1 1.1 Project Background................................................................................................. 1
1.1.1 Project Statement ........................................................................................ 1 1.1.2 Existing Property ........................................................................................ 1 1.1.3 Constructed EDB ........................................................................................ 1 1.1.4 Monitoring .................................................................................................. 3
1.2 Geographical Setting............................................................................................... 4 1.2.1 Location ...................................................................................................... 4 1.2.2 BMP Specifications .................................................................................... 4
1.3 Outcomes ................................................................................................................ 6 1.3.1 Purpose........................................................................................................ 6 1.3.2 Goal............................................................................................................. 6 1.3.3 Objective ..................................................................................................... 6
2.0 METHODS ......................................................................................................................... 7 2.1 Photo documentation .............................................................................................. 7 2.2 Bioassessment ......................................................................................................... 7 2.3 Stormwater Flows ................................................................................................... 9
2.3.1 Flow Estimation........................................................................................ 10 2.3.2 Chemistry Analysis................................................................................... 12
2.4 Dry Weather Flows ............................................................................................... 14 2.4.1 Flow Estimation........................................................................................ 15 2.4.2 Chemistry Analysis................................................................................... 15
3.0 EVENTS ........................................................................................................................... 16 3.1 Photo Documentation Events................................................................................ 16
3.1.1 June 2005 .................................................................................................. 16 3.1.2 January 2006 ............................................................................................. 16 3.1.3 May 2006 .................................................................................................. 16 3.1.4 Storm Event Photo Documentation .......................................................... 16 3.1.5 Select Photo Documentation..................................................................... 16
3.2 Bioassessment Events ........................................................................................... 17 3.2.1 Pre-Construction ....................................................................................... 17 3.2.2 Post-Construction...................................................................................... 17
3.3 Stormwater Events ................................................................................................ 17 3.3.1 Storm Event February 19, 2006 ................................................................ 18 3.3.2 Storm Event February 28, 2006 ................................................................ 18 3.3.3 Non-Storm Event March 11, 2006............................................................ 18 3.3.4 Storm Event March 21, 2006 .................................................................... 19 3.3.5 Storm Event March 29, 2006 .................................................................... 19 3.3.6 Storm Event April 4, 2006 ........................................................................ 19 3.3.7 Non-Storm Event April 27, 2006.............................................................. 19 3.3.8 Non-Storm Event May 21, 2006............................................................... 19
3.4 Dry Weather Events.............................................................................................. 19
4.0 RESULTS ......................................................................................................................... 20 4.1 Photo Documentation............................................................................................ 20
Grant Agreement No. 04-067-559-0 June 2006
Weston Solutions, Inc. ii
4.2 Bioassessment ....................................................................................................... 20 4.3 Stormwater Flows ................................................................................................. 20
4.3.1 Estimated Flows........................................................................................ 20 4.3.2 Chemistry Analysis................................................................................... 27
4.4 Dry Weather Flows ............................................................................................... 28
5.0 DISCUSSION................................................................................................................... 29 5.1 Photo Documentation............................................................................................ 29 5.2 Bioassessment ....................................................................................................... 29 5.3 Stormwater Flows ................................................................................................. 30 5.4 Dry Weather Flows ............................................................................................... 32
6.0 DETENTION BASIN PERFORMANCE SUMMARY................................................... 33 6.1 Pollutant Removal Efficiency ............................................................................... 33 6.2 Effect of Vegetation Establishment on Removal Efficiency ................................ 33 6.3 Water Treatment/Holding Capacity vs. Observed Rainfall .................................. 33
7.0 CONCLUSIONS AND RECOMMENDATIONS ........................................................... 34
8.0 REFERENCES ................................................................................................................. 35
Grant Agreement No. 04-067-559-0 June 2006
Weston Solutions, Inc. iii
LIST OF TABLES
Table 1. Field Measured Cross Sectional Channel Area ............................................................. 11 Table 2. Channel Slope ................................................................................................................ 12 Table 3. Holding Times and Preservation Methods..................................................................... 13 Table 4. Percent Contribution to Total Influent........................................................................... 13 Table 5. Wet weather median flows and quartiles....................................................................... 20 Table 6. Manning and SRM Comparison .................................................................................... 26 Table 7. Analytical Chemistry Results for Wet Weather Event .................................................. 27 Table 8. Field Measured Physical Parameters ............................................................................. 28 Table 9. Wilcoxon Signed Rank Results ..................................................................................... 30
LIST OF FIGURES Figure 1. Woodside EDB, May 16, 2006.........................................................................................1 Figure 2. EDB Design......................................................................................................................2 Figure 3. Geographic Location of EDB...........................................................................................5 Figure 4. Sampling Points................................................................................................................8 Figure 5. Cross Sectional Area of Channel Bottom.......................................................................11 Figure 6. Storm Event #1—February 19, 2006.............................................................................21 Figure 7. Storm Event #2—February 28, 2006 through March 1, 2006.......................................22 Figure 8. Storm Event #3—March 21, 2006.................................................................................23 Figure 9. Storm Event #4—March 28, 2006.................................................................................24 Figure 10. Storm Event #5—April 4, 2006...................................................................................25 Figure 11. Box and whisker plots for the weighted sum event mean concentration influents
and EMC effluents.........................................................................................................31
Grant Agreement No. 04-067-559-0 June 2006
Weston Solution, Inc. 1
1.0 INTRODUCTION
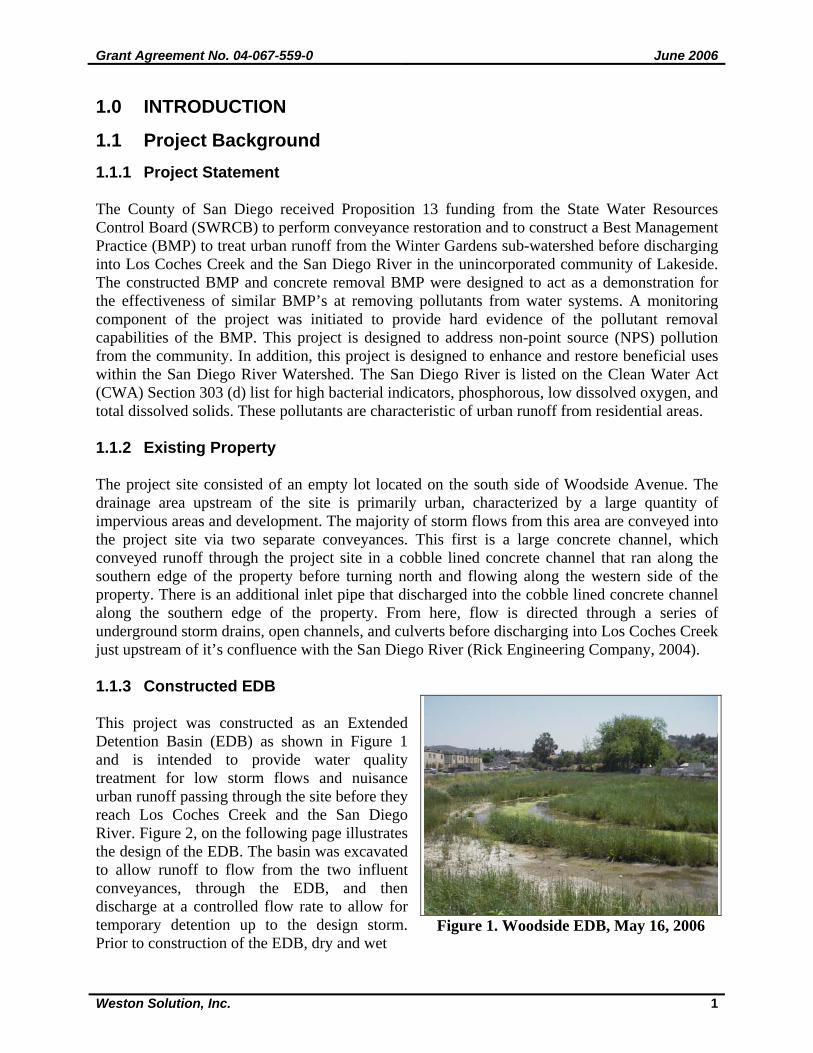
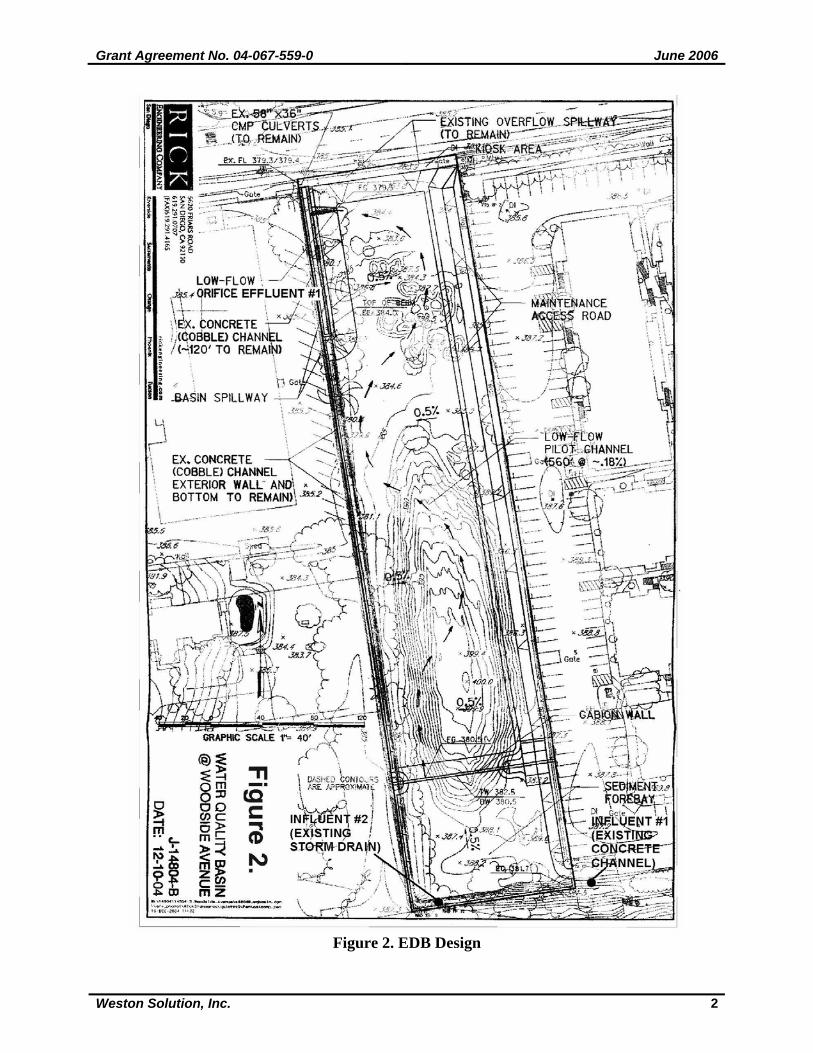
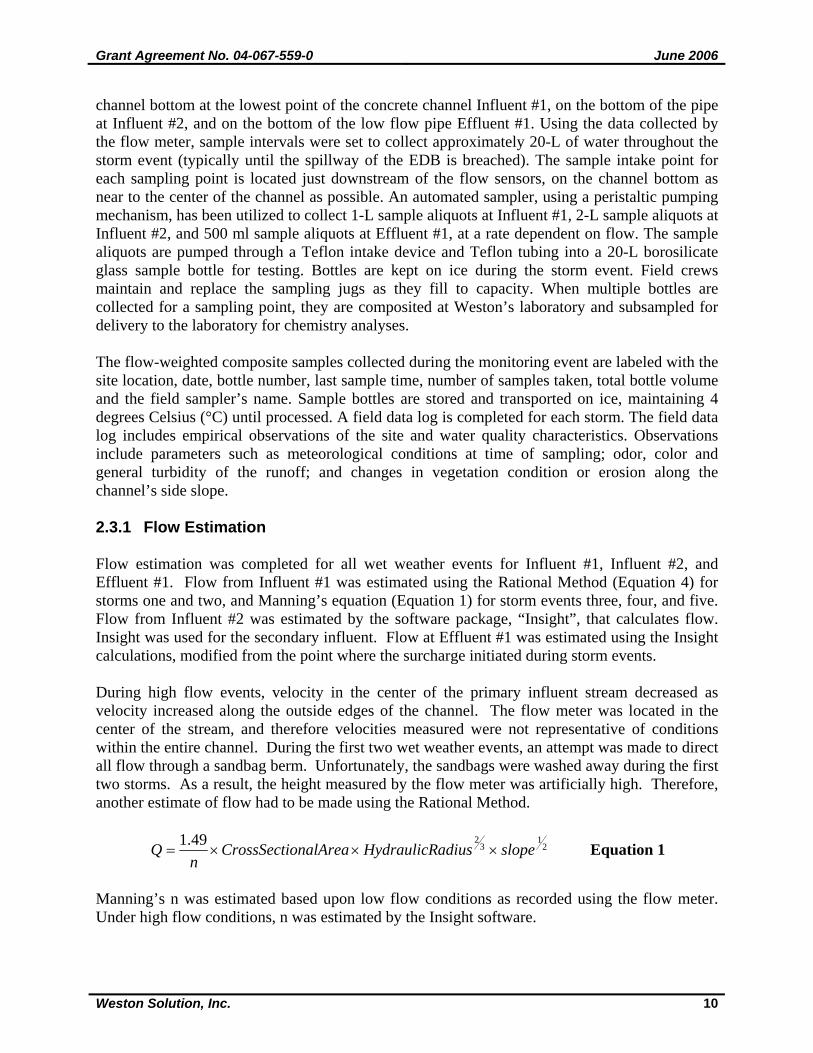
1.1 Project Background 1.1.1 Project Statement The County of San Diego received Proposition 13 funding from the State Water Resources Control Board (SWRCB) to perform conveyance restoration and to construct a Best Management Practice (BMP) to treat urban runoff from the Winter Gardens sub-watershed before discharging into Los Coches Creek and the San Diego River in the unincorporated community of Lakeside. The constructed BMP and concrete removal BMP were designed to act as a demonstration for the effectiveness of similar BMP’s at removing pollutants from water systems. A monitoring component of the project was initiated to provide hard evidence of the pollutant removal capabilities of the BMP. This project is designed to address non-point source (NPS) pollution from the community. In addition, this project is designed to enhance and restore beneficial uses within the San Diego River Watershed. The San Diego River is listed on the Clean Water Act (CWA) Section 303 (d) list for high bacterial indicators, phosphorous, low dissolved oxygen, and total dissolved solids. These pollutants are characteristic of urban runoff from residential areas. 1.1.2 Existing Property The project site consisted of an empty lot located on the south side of Woodside Avenue. The drainage area upstream of the site is primarily urban, characterized by a large quantity of impervious areas and development. The majority of storm flows from this area are conveyed into the project site via two separate conveyances. This first is a large concrete channel, which conveyed runoff through the project site in a cobble lined concrete channel that ran along the southern edge of the property before turning north and flowing along the western side of the property. There is an additional inlet pipe that discharged into the cobble lined concrete channel along the southern edge of the property. From here, flow is directed through a series of underground storm drains, open channels, and culverts before discharging into Los Coches Creek just upstream of it’s confluence with the San Diego River (Rick Engineering Company, 2004). 1.1.3 Constructed EDB This project was constructed as an Extended Detention Basin (EDB) as shown in Figure 1 and is intended to provide water quality treatment for low storm flows and nuisance urban runoff passing through the site before they reach Los Coches Creek and the San Diego River. Figure 2, on the following page illustrates the design of the EDB. The basin was excavated to allow runoff to flow from the two influent conveyances, through the EDB, and then discharge at a controlled flow rate to allow for temporary detention up to the design storm. Prior to construction of the EDB, dry and wet
Figure 1. Woodside EDB, May 16, 2006
Grant Agreement No. 04-067-559-0 June 2006
Weston Solution, Inc. 2
Figure 2. EDB Design
Grant Agreement No. 04-067-559-0 June 2006
Weston Solution, Inc. 3
weather flows traveled into the cobble-lined channel then discharged from the site without detention or treatment. Storm water and nuisance flows currently enter the site through the two influent channels shown on Figure 2. At both influent locations rip-rap has been placed to reduce the velocity of the influent to allow large particles and debris to settle out. The dry and wet weather flows then pass through a gabion wall which provides for additional settlement and some filtering. Low flows are then directed into a vegetated sinuous channel through the basin before discharging through a low flow orifice at the effluent end of the basin. The vegetated channel provides for additional settlement and acts as a bioswale to address total suspended solids (TSS), nutrients and some bacteria. Storm flows up to the design storm event will flow over the gabion wall and pond behind the weir (spillway) in which the low flow effluent discharge point is located. The design storm is held to allow for additional settlement of smaller particles to reduce the concentrations of TSS, metals and nutrients in the effluent. As a flood control facility, during high flows the gabion wall is circumvented and water passes over a spillway at the effluent end of the basin. This design reduces the possibility of upstream flooding; however, optimal water quality treatment will not be achieved during storm events that are greater than the basin’s storage capacity. The emergency bypass valve at the EDB’s effluent location can also be opened during large storm events. 1.1.4 Monitoring A monitoring program was designed to assess the effectiveness of the water quality basin and includes photo documentation, water quality monitoring, and biological monitoring. Photo documentation will provide a record of the success of revegetation efforts, sedimentation in the sediment forebay and within the extended detention basin, stability of the low-flow channel and condition of the outflow structures. Water quality monitoring is being conducted during dry and wet weather events to characterize the pollutant loading and to assess the pollutant removal efficiency of the basin. Biological monitoring consists of bioassessment and habitat assessment. The original Scope of Work for this project specified that wetland monitoring would also be conducted. However, early in the project the design approach was modified from a wet basin to an EDB (originally a wet basin was anticipated). Due to the nature of the EDB, the formation of a wetland community in the basin is unlikely. Observations during the dry season indicate a continuous flow of nuisance flows that may sustain wetland type vegetation. This condition and vegetation type will be verified as part of the visual inspection planned during the dry weather period. Thus, bioassessment and habitat monitoring were selected and are being performed to assess improvement in the biological community and habitat as a result of improved water quality from the installation of the BMP. Bioassessment is being used to determine quality of habitat enhancement by monitoring the benthic macroinvertebrate community. A visual habitat assessment within the basin to document the vegetative communities established is also being performed to document vegetation establishment and if low flow conditions allow for habitat development.

Grant Agreement No. 04-067-559-0 June 2006
Weston Solution, Inc. 4
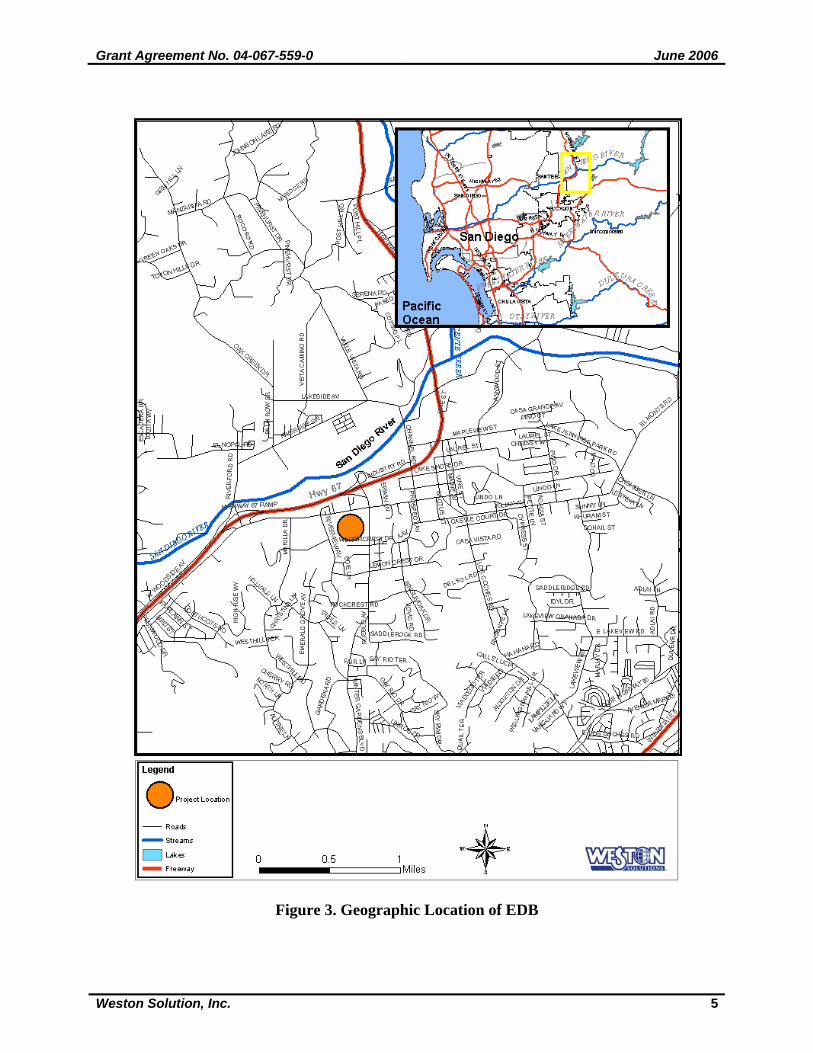
1.2 Geographical Setting 1.2.1 Location The project site is located in the unincorporated community of Lakeside in eastern San Diego County on a vacant property adjacent to Woodside Avenue near Winter Gardens as shown in Figure 3, on the following page. The property is East of Riverview Avenue and West of Winter Gardens Boulevard, APN 38207106 (Rick Engineering, 2006). 1.2.2 BMP Specifications 1.2.2.1 Design and Sizing
The constructed EDB covers an area of 1.7 acres and has an approximate depth of 5.5 feet, however, only 4.5 feet is utilized for water quality treatment. The length to width ratio is very desirable, approximately 5:1. The water quality basin is sized to capture the maximum extent practicable (MEP) of the water quality volume based on horizontal and vertical constraints through the project (Rick Engineering, 2006). 1.2.2.2 Capacity and Discharge
The constructed EDB possesses a water quality treatment volume of 5.6 acre-feet. This is 15% of the desired 37.3 acre feet treatment volume needed to meet numeric sizing criteria for the drainage area. The drainage basin at the downstream end of the EDB encompasses 889 acres, or 1.26 square miles and has a 100-year discharge of 976 cubic feet per second. Under ideal conditions the basin has a drawdown time of 72 hours and discharges no more than 50% of its capacity within the first 24 hours (Rick Engineering, 2006).
Grant Agreement No. 04-067-559-0 June 2006
Weston Solution, Inc. 5
Figure 3. Geographic Location of EDB
Grant Agreement No. 04-067-559-0 June 2006
Weston Solution, Inc. 6
1.3 Outcomes The concentrations of the influent and effluent for each sampling event will be compared using event mean concentration. The results are summarized in this report, which documents the data collected, and the water quality pollutant removal efficiency of the basin. The assessment of pollutant removal efficiency is based on the available data obtained from this monitoring program to date. Due to the inherent variability of water quality in storm water samples, statistical comparisons may not be applicable. Statistical comparisons may be made as part of a long-term monitoring program during which additional data may result in a higher level of statistical confidence. Comparisons between the influent and effluent concentrations for available data are presented in this report along with initial conclusions and recommendations. 1.3.1 Purpose The purpose of this project is to provide water quality treatment to low flows that pass through the project site. Although the project is not intended for flood control, it does provide limited storage that potentially reduces the magnitude of smaller flooding occurrences. 1.3.2 Goal The overall goal of this project is to reduce pollutants from upstream runoff to the maximum extent practicable (MEP) in accordance with the Municipal Storm Water National Pollutant Discharge Elimination System (NPDES) Permit (Municipal Permit), issued on February 21, 2001 to the County of San Diego. The performance of the water quality basin will be assessed through this monitoring program. 1.3.3 Objective The objective of this monitoring program is an assessment of the performance of the water quality basin based on the quantitative and qualitative data obtained as a demonstration for the effectiveness of similar BMP’s at removing pollutants from water systems.
Grant Agreement No. 04-067-559-0 June 2006
Weston Solution, Inc. 7
2.0 METHODS 2.1 Photo documentation Photo documentation points will be established to monitor the success of revegetation efforts, sedimentation in the sediment forebay and within the extended detention basin, stability of the low-flow channel and condition of the outflow structures. These photo points are shown on Figure 4. Photos have been taken during three photo documentation events, during selected storm sampling events, and to document key issues and functions of the BMP. Additionally, photo documentation will occur during selected dry weather sampling events over the program duration. The same stations have been maintained since the preconstruction survey with the exception of storm events when conditions prohibited utilizing pre existing photo points. Field crews monitor the established photo points of the BMP in accordance with SWRCB guidelines. The stations have been established by description of the location, GPS coordinates, and the magnetic compass direction to take the digital photograph. The photographers have made every effort to maintain a level (horizontal) camera view. Although recommended by the SWRCB guidelines, a dry-erase board could not be utilized in the photographs to identify the location, time, and date of the monitoring. The board blocked too much of the long view that was needed to document the BMP. A field data log was completed for each site. Observations of the channel and each bank were documented along with a description of vegetation, presence of sedimentation, and presence of any other debris. When taking photographs, landscape features that were unlikely to change, such as a warehouse and apartment buildings, were utilized and included as a reference for repeat photos. Long view photos were taken to show the project area. It was not possible to photograph from an elevated vantage point. Medium views will be included to show examples of vegetation changes and plantings, if included in the project. 2.2 Bioassessment The focus of the biological monitoring is on in-stream macroinvertebrates. These invertebrates are sampled in typical conditions of flowing wadeable streams using a D-shaped kick net. The Standard Operating Procedures (SOPs) for sampling and in-field processing follow the California Department of Fish and Game (CDFG) California Stream Bioassessment Procedure (available at http://www.dfg.ca.gov/cabw/Field/csbpwforms.html) with modifications for non-typical conditions as recommended by Bill Isham of Weston. The samples are then processed in the laboratory and sorted into major taxonomic groups. All organisms are identified to a standard taxonomic level that is fixed under the California Stream Bioassessment Procedures. Benthic macroinvertebrate (BMI) community based metric values are calculated from this list of invertebrates and the Index of Biotic Integrity (IBI) is calculated to reflect the condition of the reach. As part of bioassessment, habitat quality parameters are assessed to provide a record of the overall condition of the reach. Site conditions were assessed as part of the initial site assessment; parameters such as channel alteration, width of riparian zones, and vegetative cover were documented to provide a more comprehensive understanding of the condition of the channel.

Grant Agreement No. 04-067-559-0 June 2006
Weston Solution, Inc. 8
Figure 4. Sampling Points
Grant Agreement No. 04-067-559-0 June 2006
Weston Solution, Inc. 9
Water quality measurements are taken at bioassessment locations. These sampling locations are shown on Figure 4. Measurements include water temperature, conductivity, pH, and dissolved oxygen. Once sample containers are filled they are labeled and 95% ethanol is added. Labels denote station identification; transect number, stream name, date, times, sampling device, and sampler’s initials. Within 24 hours the ethanol is decanted and replaced with fresh ethanol. No special handling or custody procedures are needed. The chain of custody form is used as a shipping record. Samples are disposed of when analysis is completed and all analytical quality assurance/quality control procedures are reviewed and accepted. 2.3 Stormwater Flows Stormwater monitoring is conducted during storm events that meet the sampling requirements regardless of the time of year. Storm events are considered viable for monitoring activities if they achieve greater than 0.10 inches of rainfall. This amount of rainfall is considered the minimum amount necessary to produce sufficient runoff for sampling. An antecedent dry period of 72 hours and having a storm that is representative of typical storms for the area in terms of intensity, depth and duration are not limiting factors for assessment of this BMP. The focus of this study is on influent concentration versus effluent concentration, not pollutant load from the surrounding watershed. An attempt is made to monitor any storm that meets criteria until a total of ten (10) dry weather or storm events are successfully captured. Sampling is conducted throughout the rise and fall of the hydrograph unless the EDB spillway is breached. At this point the EDB is no longer functioning as designed and sampling is terminated. Samples collected up to the point of spillway breach are analyzed. In order to assess BMP performance, two sampling locations were selected upstream of the EDB and one station was selected at the end of the low flow out flow pipe. These sampling locations are shown in Figure 4. Other site selection factors included:
• Suitability of the site’s hydrological characteristics to enable practical measurement of flow and collection of representative stormwater samples.
• Safety from traffic and other hazards • Suitable for siting automated sampling equipment • Accessibility to phone lines/cellular service availability • Field crew access for retrieving water samples and maintaining equipment during storm
conditions Two influent samples are collected prior to discharge into the sediment forebay. The first sample is collected in the concrete channel that flows into the basin (Influent #1). This reach of the incoming channel parallels Woodside Avenue. The second influent sample is collected from the storm drain pipe that discharges directly into the southern end of the basin (Influent #2). Flow by the basin is regulated through the use of an outflow structure (Effluent #1). Monitoring of the discharge from the basin occurs in the low flow pipe exiting the outflow structure. The effluent sample is collected from the low-flow orifice discharge from the EDB. Sampling of the effluent is discontinued when the water level in the detention basin overtops the basin spillway in order to assure proper assessment of the data for pollutant removal efficiency. Automated flow and sampling equipment was installed at the site to assist in the collection of flow-weighted composite samples during storm events. A flow meter with a bubbler and velocity sensor was installed to measure velocity and stage height. The flow sensor was installed on the
Grant Agreement No. 04-067-559-0 June 2006
Weston Solution, Inc. 10
channel bottom at the lowest point of the concrete channel Influent #1, on the bottom of the pipe at Influent #2, and on the bottom of the low flow pipe Effluent #1. Using the data collected by the flow meter, sample intervals were set to collect approximately 20-L of water throughout the storm event (typically until the spillway of the EDB is breached). The sample intake point for each sampling point is located just downstream of the flow sensors, on the channel bottom as near to the center of the channel as possible. An automated sampler, using a peristaltic pumping mechanism, has been utilized to collect 1-L sample aliquots at Influent #1, 2-L sample aliquots at Influent #2, and 500 ml sample aliquots at Effluent #1, at a rate dependent on flow. The sample aliquots are pumped through a Teflon intake device and Teflon tubing into a 20-L borosilicate glass sample bottle for testing. Bottles are kept on ice during the storm event. Field crews maintain and replace the sampling jugs as they fill to capacity. When multiple bottles are collected for a sampling point, they are composited at Weston’s laboratory and subsampled for delivery to the laboratory for chemistry analyses. The flow-weighted composite samples collected during the monitoring event are labeled with the site location, date, bottle number, last sample time, number of samples taken, total bottle volume and the field sampler’s name. Sample bottles are stored and transported on ice, maintaining 4 degrees Celsius (°C) until processed. A field data log is completed for each storm. The field data log includes empirical observations of the site and water quality characteristics. Observations include parameters such as meteorological conditions at time of sampling; odor, color and general turbidity of the runoff; and changes in vegetation condition or erosion along the channel’s side slope. 2.3.1 Flow Estimation Flow estimation was completed for all wet weather events for Influent #1, Influent #2, and Effluent #1. Flow from Influent #1 was estimated using the Rational Method (Equation 4) for storms one and two, and Manning’s equation (Equation 1) for storm events three, four, and five. Flow from Influent #2 was estimated by the software package, “Insight”, that calculates flow. Insight was used for the secondary influent. Flow at Effluent #1 was estimated using the Insight calculations, modified from the point where the surcharge initiated during storm events. During high flow events, velocity in the center of the primary influent stream decreased as velocity increased along the outside edges of the channel. The flow meter was located in the center of the stream, and therefore velocities measured were not representative of conditions within the entire channel. During the first two wet weather events, an attempt was made to direct all flow through a sandbag berm. Unfortunately, the sandbags were washed away during the first two storms. As a result, the height measured by the flow meter was artificially high. Therefore, another estimate of flow had to be made using the Rational Method.
21
3249.1 slopeadiusHydraulicRonalAreaCrossSecti
nQ ×××= Equation 1
Manning’s n was estimated based upon low flow conditions as recorded using the flow meter. Under high flow conditions, n was estimated by the Insight software.
Grant Agreement No. 04-067-559-0 June 2006
Weston Solution, Inc. 11
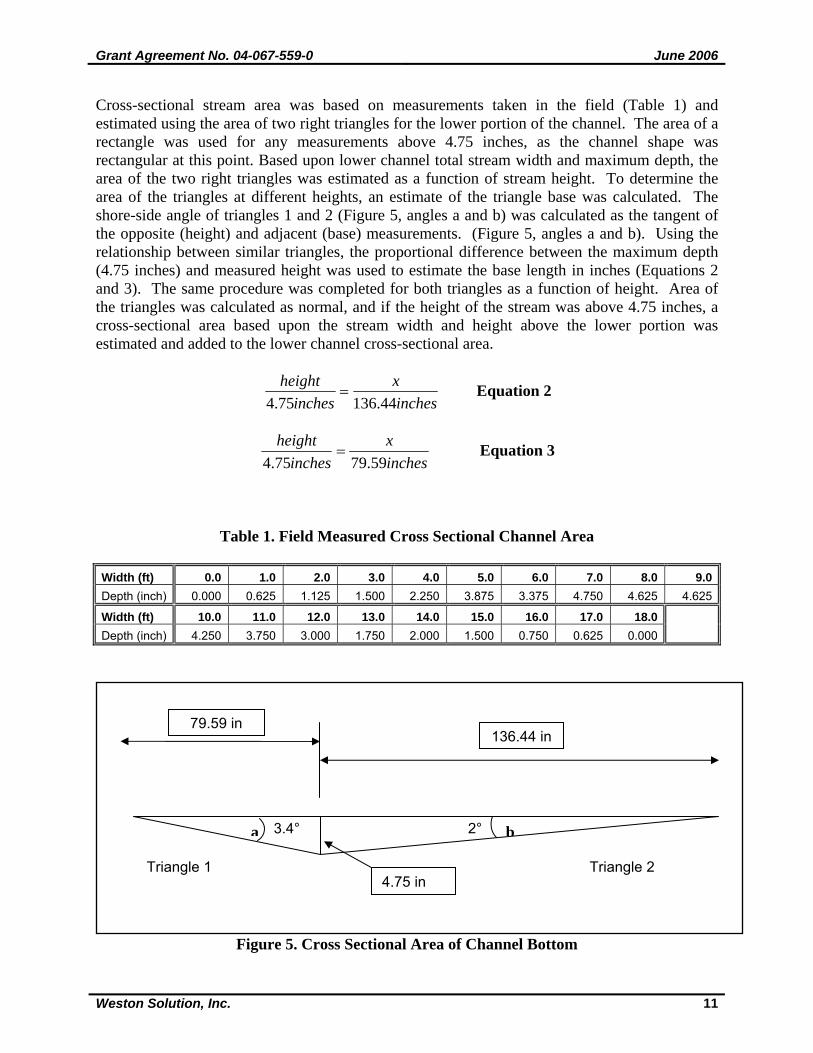
Cross-sectional stream area was based on measurements taken in the field (Table 1) and estimated using the area of two right triangles for the lower portion of the channel. The area of a rectangle was used for any measurements above 4.75 inches, as the channel shape was rectangular at this point. Based upon lower channel total stream width and maximum depth, the area of the two right triangles was estimated as a function of stream height. To determine the area of the triangles at different heights, an estimate of the triangle base was calculated. The shore-side angle of triangles 1 and 2 (Figure 5, angles a and b) was calculated as the tangent of the opposite (height) and adjacent (base) measurements. (Figure 5, angles a and b). Using the relationship between similar triangles, the proportional difference between the maximum depth (4.75 inches) and measured height was used to estimate the base length in inches (Equations 2 and 3). The same procedure was completed for both triangles as a function of height. Area of the triangles was calculated as normal, and if the height of the stream was above 4.75 inches, a cross-sectional area based upon the stream width and height above the lower portion was estimated and added to the lower channel cross-sectional area.
inchesx
inchesheight
44.13675.4= Equation 2
inchesx
inchesheight
59.7975.4= Equation 3
Table 1. Field Measured Cross Sectional Channel Area Width (ft) 0.0 1.0 2.0 3.0 4.0 5.0 6.0 7.0 8.0 9.0Depth (inch) 0.000 0.625 1.125 1.500 2.250 3.875 3.375 4.750 4.625 4.625
Width (ft) 10.0 11.0 12.0 13.0 14.0 15.0 16.0 17.0 18.0Depth (inch) 4.250 3.750 3.000 1.750 2.000 1.500 0.750 0.625 0.000
Figure 5. Cross Sectional Area of Channel Bottom
4.75 in
136.44 in79.59 in
2° 3.4°
Triangle 1 Triangle 2
a b
Grant Agreement No. 04-067-559-0 June 2006
Weston Solution, Inc. 12
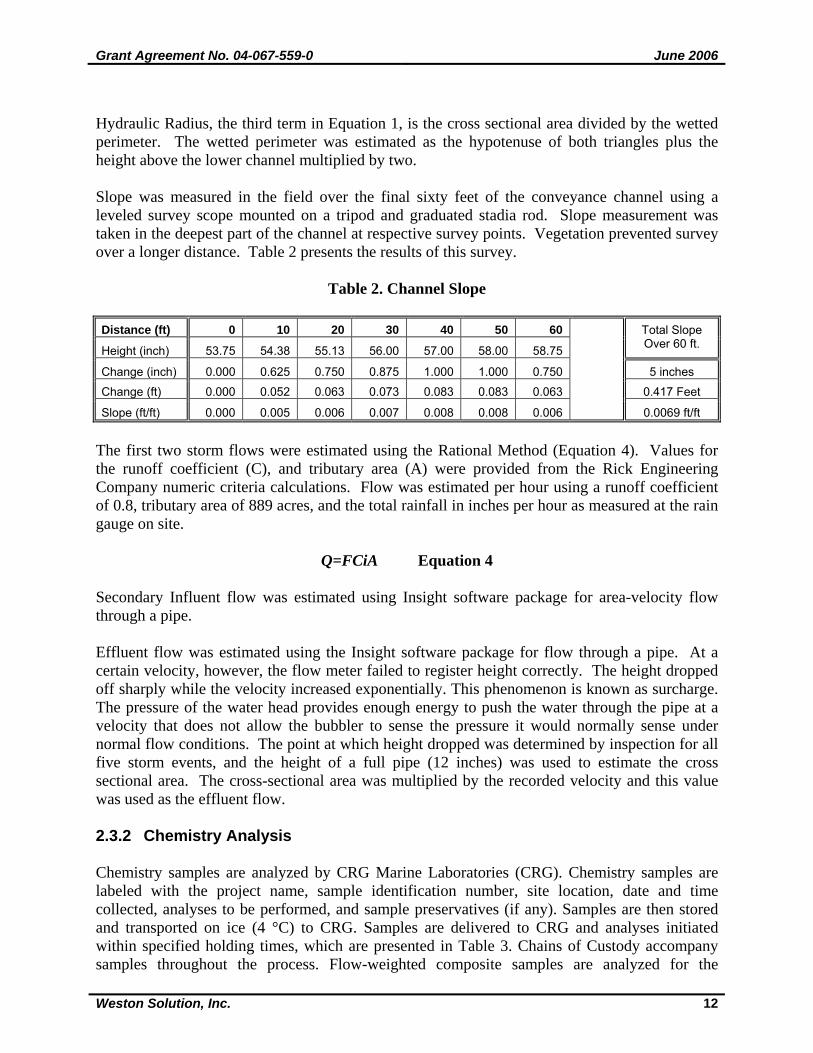
Hydraulic Radius, the third term in Equation 1, is the cross sectional area divided by the wetted perimeter. The wetted perimeter was estimated as the hypotenuse of both triangles plus the height above the lower channel multiplied by two. Slope was measured in the field over the final sixty feet of the conveyance channel using a leveled survey scope mounted on a tripod and graduated stadia rod. Slope measurement was taken in the deepest part of the channel at respective survey points. Vegetation prevented survey over a longer distance. Table 2 presents the results of this survey.
Table 2. Channel Slope Distance (ft) 0 10 20 30 40 50 60
Height (inch) 53.75 54.38 55.13 56.00 57.00 58.00 58.75
Total Slope Over 60 ft.
Change (inch) 0.000 0.625 0.750 0.875 1.000 1.000 0.750 5 inches
Change (ft) 0.000 0.052 0.063 0.073 0.083 0.083 0.063 0.417 Feet
Slope (ft/ft) 0.000 0.005 0.006 0.007 0.008 0.008 0.006 0.0069 ft/ft
The first two storm flows were estimated using the Rational Method (Equation 4). Values for the runoff coefficient (C), and tributary area (A) were provided from the Rick Engineering Company numeric criteria calculations. Flow was estimated per hour using a runoff coefficient of 0.8, tributary area of 889 acres, and the total rainfall in inches per hour as measured at the rain gauge on site.
Q=FCiA Equation 4 Secondary Influent flow was estimated using Insight software package for area-velocity flow through a pipe. Effluent flow was estimated using the Insight software package for flow through a pipe. At a certain velocity, however, the flow meter failed to register height correctly. The height dropped off sharply while the velocity increased exponentially. This phenomenon is known as surcharge. The pressure of the water head provides enough energy to push the water through the pipe at a velocity that does not allow the bubbler to sense the pressure it would normally sense under normal flow conditions. The point at which height dropped was determined by inspection for all five storm events, and the height of a full pipe (12 inches) was used to estimate the cross sectional area. The cross-sectional area was multiplied by the recorded velocity and this value was used as the effluent flow. 2.3.2 Chemistry Analysis Chemistry samples are analyzed by CRG Marine Laboratories (CRG). Chemistry samples are labeled with the project name, sample identification number, site location, date and time collected, analyses to be performed, and sample preservatives (if any). Samples are then stored and transported on ice (4 °C) to CRG. Samples are delivered to CRG and analyses initiated within specified holding times, which are presented in Table 3. Chains of Custody accompany samples throughout the process. Flow-weighted composite samples are analyzed for the
Grant Agreement No. 04-067-559-0 June 2006
Weston Solution, Inc. 13
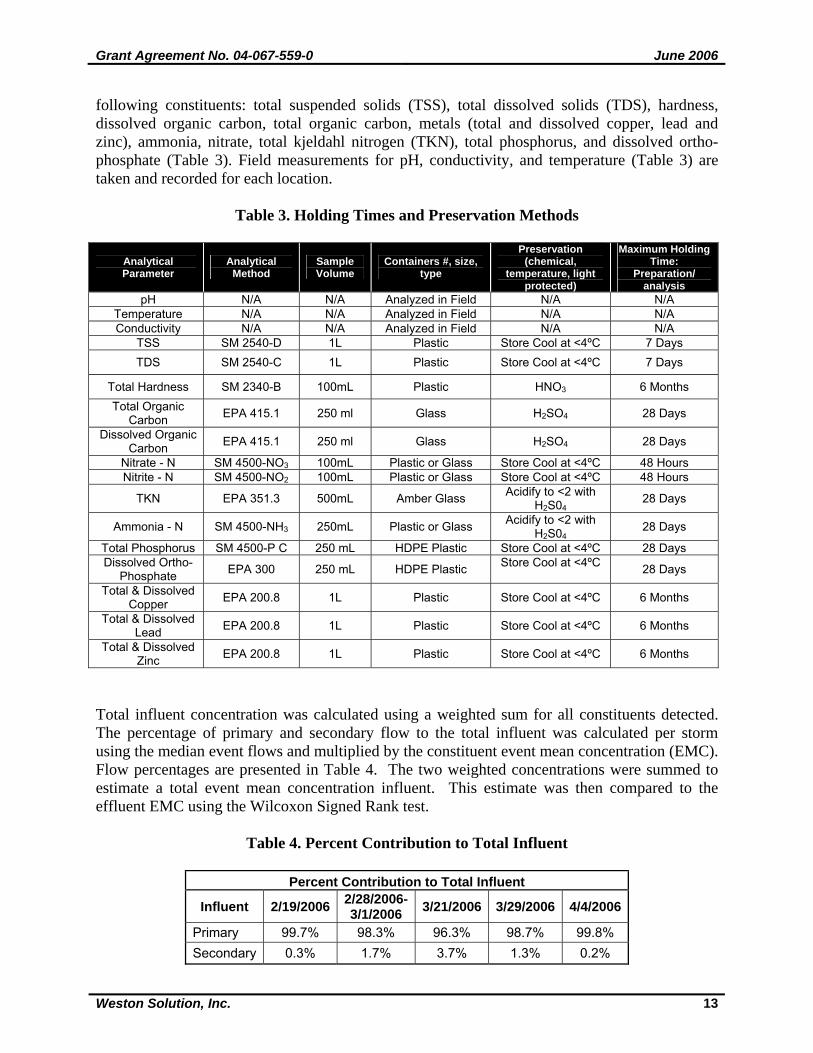
following constituents: total suspended solids (TSS), total dissolved solids (TDS), hardness, dissolved organic carbon, total organic carbon, metals (total and dissolved copper, lead and zinc), ammonia, nitrate, total kjeldahl nitrogen (TKN), total phosphorus, and dissolved ortho-phosphate (Table 3). Field measurements for pH, conductivity, and temperature (Table 3) are taken and recorded for each location.
Table 3. Holding Times and Preservation Methods
Analytical Parameter
Analytical Method
Sample Volume
Containers #, size, type
Preservation (chemical,
temperature, light protected)
Maximum Holding Time:
Preparation/ analysis
pH N/A N/A Analyzed in Field N/A N/A Temperature N/A N/A Analyzed in Field N/A N/A Conductivity N/A N/A Analyzed in Field N/A N/A
TSS SM 2540-D 1L Plastic Store Cool at <4ºC 7 Days TDS SM 2540-C 1L Plastic Store Cool at <4ºC 7 Days
Total Hardness SM 2340-B 100mL Plastic HNO3 6 Months Total Organic
Carbon EPA 415.1 250 ml Glass H2SO4 28 Days
Dissolved Organic Carbon EPA 415.1 250 ml Glass H2SO4 28 Days
Nitrate - N SM 4500-NO3 100mL Plastic or Glass Store Cool at <4ºC 48 Hours Nitrite - N SM 4500-NO2 100mL Plastic or Glass Store Cool at <4ºC 48 Hours
TKN EPA 351.3 500mL Amber Glass Acidify to <2 with H2S04
28 Days
Ammonia - N SM 4500-NH3 250mL Plastic or Glass Acidify to <2 with H2S04
28 Days
Total Phosphorus SM 4500-P C 250 mL HDPE Plastic Store Cool at <4ºC 28 Days Dissolved Ortho-
Phosphate EPA 300 250 mL HDPE Plastic Store Cool at <4ºC 28 Days
Total & Dissolved Copper EPA 200.8 1L Plastic Store Cool at <4ºC 6 Months
Total & Dissolved Lead EPA 200.8 1L Plastic Store Cool at <4ºC 6 Months
Total & Dissolved Zinc EPA 200.8 1L Plastic Store Cool at <4ºC 6 Months
Total influent concentration was calculated using a weighted sum for all constituents detected. The percentage of primary and secondary flow to the total influent was calculated per storm using the median event flows and multiplied by the constituent event mean concentration (EMC). Flow percentages are presented in Table 4. The two weighted concentrations were summed to estimate a total event mean concentration influent. This estimate was then compared to the effluent EMC using the Wilcoxon Signed Rank test.
Table 4. Percent Contribution to Total Influent
Percent Contribution to Total Influent
Influent 2/19/2006 2/28/2006-3/1/2006 3/21/2006 3/29/2006 4/4/2006
Primary 99.7% 98.3% 96.3% 98.7% 99.8% Secondary 0.3% 1.7% 3.7% 1.3% 0.2%
Grant Agreement No. 04-067-559-0 June 2006
Weston Solution, Inc. 14
The Wilcoxon Signed Rank test (WSR) is a non-parametric test used to compare paired data, much like the paired t-test. However, WSR is used when the differences between the paired data are not from a normal distribution. This method was used to test whether or not there was a difference between influent and effluent concentrations for all constituents tested in the study. The hypothesis for this test:
Ho: Influent EMC ≥ Effluent EMC Ha: Influent EMC < Effluent EMC
The critical value for the test was based upon an alpha of 0.05 as significant (Zar 1999). 2.4 Dry Weather Flows Dry weather monitoring is conducted during dry periods that meet the sampling requirements of a 72-hour antecedent dry period regardless of the time of year. The focus of this study is on influent concentration versus effluent concentration, not pollutant load from the surrounding watershed. Based on the design of the basin, it is possible that there will be no observed flow exiting the system during dry weather conditions. If this occurs during monitoring events, only the inflow will be monitored. Additional dry season samples may be collected, if less wet weather samples are collected. It is anticipated that a target total of ten (10) dry weather or storm events will be captured. Sampling is conducted for 24 hours. In order to assess BMP performance, two sampling locations were selected upstream of the EDB and one station was selected at the end of the low flow out flow pipe. These sampling locations are the same locations utilized to sample storm flows and are shown on Figure 4. It is not anticipated that the secondary influent pipe will flow during dry weather sampling. Other site selection factors included:
• Suitability of the site’s hydrological characteristics to enable practical measurement of flow and collection of representative stormwater samples.
• Safety from traffic and other hazards • Suitable for siting automated sampling equipment • Accessibility to phone lines/cellular service availability • Field crew access for retrieving water samples and maintaining equipment during storm
conditions One influent sample is collected prior to discharge into the sediment forebay. The sample is collected in the concrete channel that flows into the basin. This reach of the incoming channel parallels Woodside Avenue. The second influent sample from the storm drain pipe that discharges directly into the southern end of the basin is not anticipated to flow. If the secondary influent pipe flows during dry weather sampling it will be captured and analyzed. Flow through the basin is regulated through the use of an outflow structure. Monitoring of the discharge from the basin occurs in the low flow pipe exiting the outflow structure. The effluent sample is collected from the low-flow orifice discharge from the EDB.
Grant Agreement No. 04-067-559-0 June 2006
Weston Solution, Inc. 15
Automated flow and sampling equipment was installed at the site to assist in the collection of flow-weighted composite samples during dry weather events. A flow meter with a bubbler and velocity sensor was installed to measure velocity and stage height. The flow sensor was installed on the channel bottom at the lowest point of the channel, on the bottom of the secondary influent pipe, and on the bottom of the low flow effluent pipe. Using the data collected by the flow meter, sample intervals were set to collect approximately 20-L of water throughout the dry weather event (24 hours). The sample intake point for each sampling point is located just downstream of the flow sensors, on the channel bottom as near to the center of the channel as possible. An automated sampler, using a peristaltic pumping mechanism, has been utilized to collect 1-L sample aliquots at the primary influent channel, 2-L sample aliquots at the secondary influent if flow is present, and 500 ml sample aliquots at the effluent, at a rate dependent on flow. The sample aliquots are pumped through a Teflon intake device and Teflon tubing into a 20-L borosilicate glass sample bottle for testing. Bottles are kept on ice during the storm event. Field crews maintain and replace the sampling jugs as they fill to capacity. When multiple bottles are collected for a sampling point, they are composited at Weston’s laboratory and subsampled for delivery to the laboratory for chemistry analyses. The flow-weighted composite samples collected during the monitoring event are labeled with the site location, date, bottle number, last sample time, number of samples taken, total bottle volume and the field sampler’s name. Sample bottles are stored and transported on ice, maintaining 4 degrees Celsius (°C) until processed. A field data log is completed for each dry weather event. The field data log includes empirical observations of the site and water quality characteristics. Observations include parameters such as meteorological conditions at time of sampling; odor, color and general turbidity of the runoff; and changes in vegetation condition or erosion along the channel’s side slope 2.4.1 Flow Estimation Flow estimation of dry weather flows is consistent with flow estimation methods for stormwater sampling described in Section 2.3.1. 2.4.2 Chemistry Analysis Chemistry analysis of dry weather flows is consistent with chemistry analysis for stormwater described in Section 2.3.2.
Grant Agreement No. 04-067-559-0 June 2006
Weston Solution, Inc. 16
3.0 EVENTS 3.1 Photo Documentation Events Photo documentation points were established to monitor the success of revegetation efforts, sedimentation in the sediment forebay and within the extended detention basin, stability of the low-flow channel and condition of the outflow structures. A pre-construction survey was conducted to establish photo points to be utilized during selected dry and wet sampling events over the program duration. Figure 4, illustrates the photo documentation points. The photo points were established at strategic viewpoints to best ascertain revegetation success and extent, as well as possible sedimentation problems. To maximize the documentation, long view photographs were/are taken to show the project area, medium view photos showing examples of vegetation changes and plantings, and close views of streambeds to show any sedimentation. In addition to established photo points further photo documentation was conducted to document specific aspects of project progress and issues encountered during assessment of the basin. 3.1.1 June 2005 A pre-construction survey was conducted on June 22, 2005 in conjunction with pre-construction bioassessment to document pre-existing conditions. This was the first photo documentation event. 3.1.2 January 2006 A photo documentation event was conducted on January 18, 2006 utilizing photo points established during the June 22, 2005 pre-construction photo documentation event. This was the first photo documentation event following completion of the BMP. 3.1.3 May 2006 A photo documentation event was conducted on May 16, 2006 utilizing established photo documentation points. This was the third photo documentation event of the BMP. 3.1.4 Storm Event Photo Documentation Limited photo documentation has been conducted during storm events. This photo documentation focuses on key aspects of the basins design and function during storm conditions. Initially, full photo documentation at established photo documentation points was scheduled; however, storm conditions and water level within the basin precluded this from occurring. 3.1.5 Select Photo Documentation Photo documentation is being conducted during key aspects of the project. This photo documentation does not utilize established photo points and documents site reconnaissance, sampling station installation and maintenance, vegetative growth within conveyance channels, and sedimentation within the conveyance channels.
Grant Agreement No. 04-067-559-0 June 2006
Weston Solution, Inc. 17
3.2 3Bioassessment Events Bioassessment sampling was performed prior to construction of the EDB. Post-construction monitoring will be implemented after construction of the EDB and full establishment of vegetative communities. The basin must contain water for a minimum of eight weeks prior to bioassessment sampling to allow the BMI community to establish. 3.2.1 Pre-Construction Sampling was conducted prior to construction to assess baseline conditions. The sampling event was conducted on June 22, 2005 in conjunction with the pre-construction photo documentation event. Sampling points were selected just as water entered the cobble-lined channel for the upstream sample and just prior to water exiting the site for the downstream sample site. Sampling points were selected to fully represent the diversity of the physical habitat present, as specified in the CSBP (Harrington, 1999). The target habitat type for sampling was natural substrate, riffle habitat; however, “best available” habitat was substituted since the sampling sites consisted of concrete lined channel bottom. It was determined that sufficient cobble, sediment, and organic debris were present within the channel above the concrete bottom to support a benthic community viable for sampling. 3.2.2 Post-Construction In order to assess improvement in the biological community and habitat as a result of improved water quality from the installation of the BMP, post-construction bioassessment monitoring will be performed. In general, EDB’s generally do not contain standing pools of water or flowing water. In order to conduct a bioassessment analysis, the basin must contain water for a minimum of eight weeks prior to sampling to allow the BMI community to establish. The basin is not likely to contain a continuous standing pool or flowing water necessary to establish a BMI community. Every effort will be made to maintain the same bioassessment sites from the pre-construction survey. However, due to physical changes within the channel due to construction activities and design of the EDB, Weston’s biologist will determine the best sampling locations during sampling activities. A visual habitat assessment will also be conducted at sampling locations that will document the vegetative communities established. This will be performed after the vegetation has been established and if low flow conditions allow for habitat development. It has been observed that a continuous nuisance flow is present in the low flow channel during the dry weather season. The habitat assessment will include an evaluation of the vegetation that has been established from these flows. 3.3 Stormwater Events Stormwater sampling has been conducted or attempted every time a viable storm has been anticipated since completion of the EDB and successful installation of the monitoring equipment installation on January 6, 2006. Five (5) storms were successfully sampled on February 19, 2006, February 28, 2006, March 21, 2006, March 29, 2006, and April 4, 2006. Additionally, 3 storms were mobilized for and unsuccessfully sampled due to lack of rainfall intensity or
Grant Agreement No. 04-067-559-0 June 2006
Weston Solution, Inc. 18
equipment failure. During the first 2 events a sandbag flume was utilized to obtain more accurate flow measurements. Following 2 consecutive failures of the sand bag flume during the first 2 storm events it was determined that the sandbag flume could not be utilized due to the numerous and large pieces of debris and matted vegetation that travel through the site during storm conditions. 3.3.1 3Storm Event February 19, 2006 Weston mobilized for, and successfully sampled a storm event on February 19, 2006. This was the first storm event sampled at the project site. Less intense rainfall was present in the 24 hours leading up to the sampling event, thus the basin was partially full at the beginning of this storm event. Sampling for this lower intensity storm event was conducted due to National Weather Service seasonal forecast for a dryer than normal year. Additionally, performance of the basin is being assessed, influent versus effluent concentrations, not pollutant load from the surrounding watershed. This event also served as the “calibration” event as it was the first event measured to provide a data of how the basin actually functioned during storm conditions. Little vegetation was established within the basin. Sampling was conducted over approximately 8 hours and sample was collected at the primary influent, secondary influent, and effluent sampling points. During this sampling event a faux leather sofa cushion blocked the sandbag flume that had been installed to obtain a more accurate flow measurement. This resulted in failure of the flume during sampling activities. Sampling was terminated due to equipment failure of both primary and secondary influent sampling points. However, this equipment failure occurred shortly before flow crested over the EDB spillway, and sampling would have been terminated regardless. 3.3.2 Storm Event February 28, 2006 Weston mobilized for, and successfully sampled a storm event on February 28, 2006. This was the second storm event sampled at the project site. Intense rainfall filled the EDB quickly at the beginning of this storm event and results in rapid cresting over the effluent spillway. Little vegetation was established within the basin. Sampling was conducted at the primary and secondary influent over approximately 16 hours and sample was collected at the effluent sampling point over approximately 72 hours. Sampling was terminated following drawdown of the EDB, which was expedited following opening of the emergency bypass by County of San Diego Flood Control personnel. 3.3.3 Non-Storm Event March 11, 2006 Weston mobilized for a forecasted storm event on March 11, 2006. However, a t-shirt snagged over flow monitoring equipment. This prevented the velocity sensor from properly reading the velocity of the channel and the high speed of the water over the t-shirt produced a low-pressure area that caused the level sensor to read a negative level. The speed and depth of runoff water in the channel prevented maintenance of the sensors. Since the sample collection is directly tied to flow this combination of negative level and low velocity produced a false flow reading that was substantially lower than actual in-stream conditions. Thus no samples were collected during this event.
Grant Agreement No. 04-067-559-0 June 2006
Weston Solution, Inc. 19
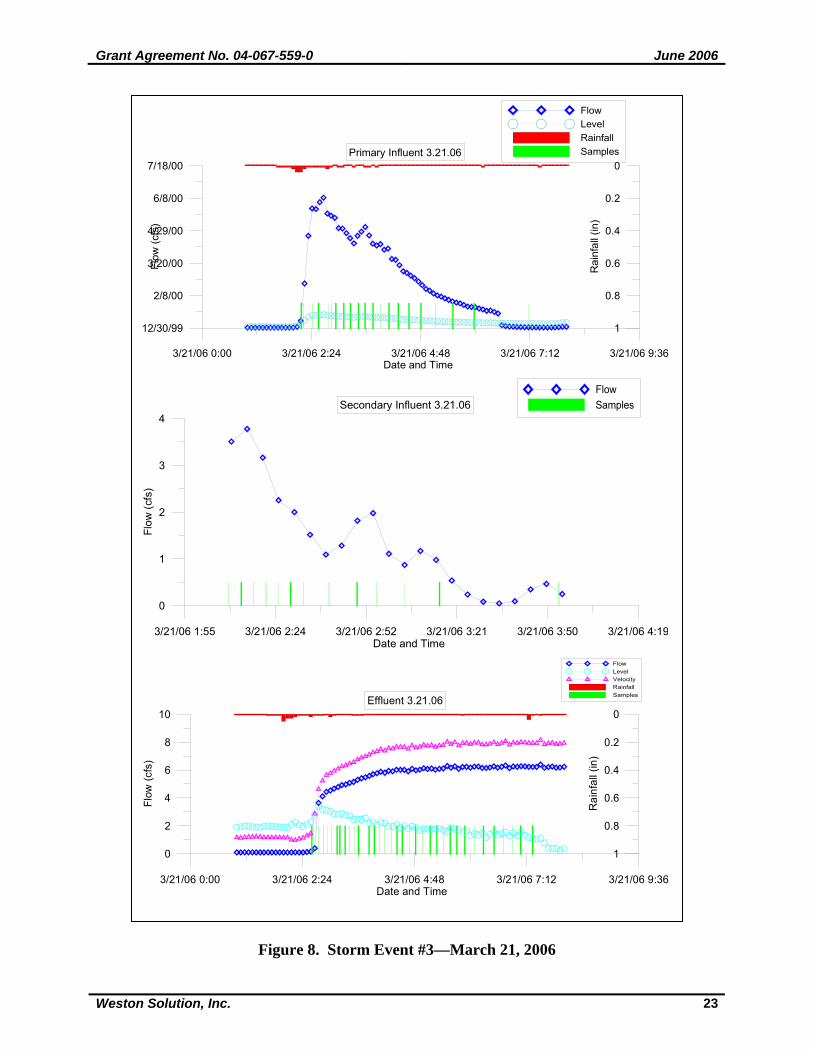
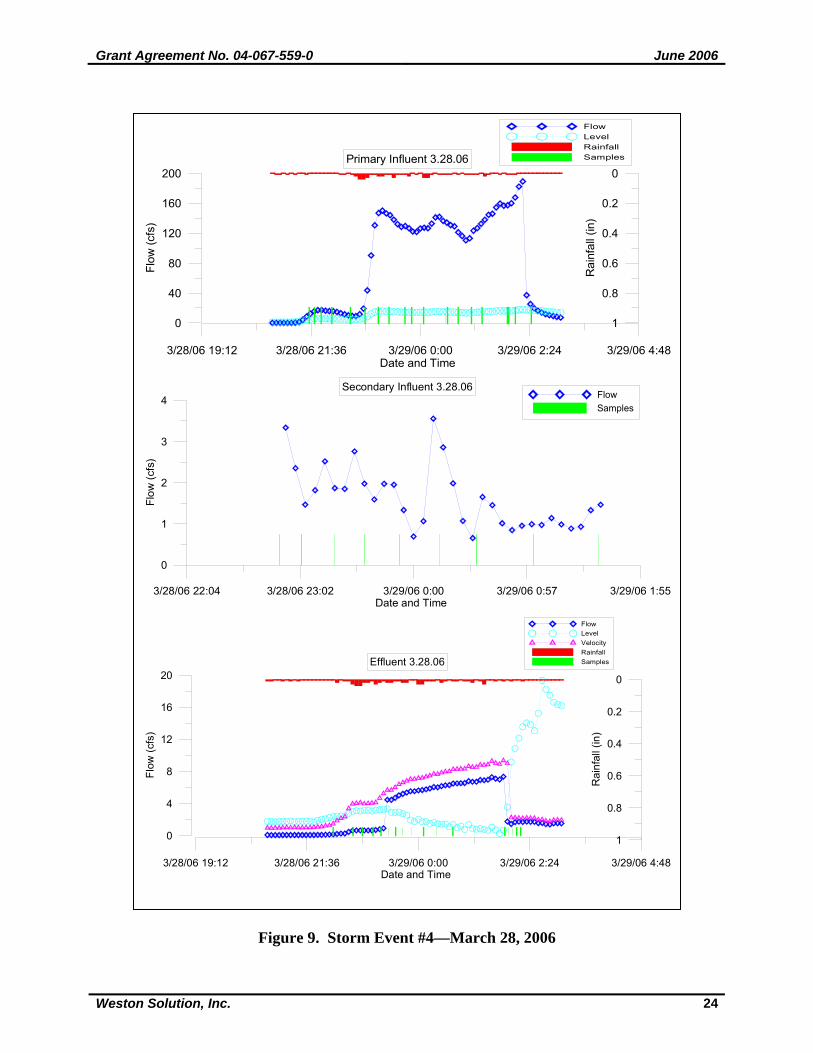
3.3.4 Storm Event March 21, 2006 Weston mobilized for, and successfully sampled the storm event on March 21, 2006. This was the third storm event sampled at the project site. Patches of low growing vegetation were established within the basin. Sampling was conducted over approximately 5 hours and samples were collected at the primary influent, secondary influent, and effluent sampling points. Sampling was terminated due to cresting of the flow over the EDB spillway. 3.3.5 Storm Event March 29, 2006 Weston mobilized for, and successfully sampled a storm event on March 29, 2006. This was the fourth storm event sampled at the project site. Patches of low growing vegetation were established within the basin. Sampling was conducted over approximately 5 hours and samples were collected at the primary influent, secondary influent, and effluent sampling points. Sampling was terminated due to cresting of the flow over the EDB spillway. 3.3.6 Storm Event April 4, 2006 Weston mobilized for, and successfully sampled a storm event on April 4, 2006. This was the fifth storm event sampled at the project site. Low growing vegetation was established within the basin. Sampling was conducted over approximately 5 hours and samples were collected at the primary influent, secondary influent, and effluent sampling points. Sampling was terminated due to cresting of the flow over the EDB spillway. 3.3.7 Non-Storm Event April 27, 2006 Weston mobilized for a forecast storm event on April 27, 2006. However the storm did not produce rainfall of sufficient intensity and duration for sampling activities. Thus no samples were collected during this event. 3.3.8 Non-Storm Event May 21, 2006 Weston mobilized for a forecasted storm event on May 21, 2006. However, unknown debris snagged over flow monitoring equipment. This produced a low pressure area over the level sensor that caused the level sensor to read a negative level. The speed and depth of runoff water in the channel prevented maintenance of the sensors. Since the sample collection is directly tied to flow this negative level produced a false flow reading that was substantially lower than actual in-stream conditions. Thus no samples were collected during this event. 3.4 Dry Weather Events One 24-hour dry weather sampling event was conducted on June 5-6, 2006. However, no results are available for this event at this time of the writing of this report. These results will be presented in the final report for this project.
Grant Agreement No. 04-067-559-0 June 2006
Weston Solution, Inc. 20
4.0 RESULTS
4.1 Photo Documentation The focus of photo documentation is on a qualitative assessment of revegetation efforts and therefore there are no specific constituents to monitor. Photographs are taken in accordance with the State Water Resources Control Board (SWRCB) guidelines (SWRCB, 2003). No special handling or custody procedures are needed. The digital camera is returned to the Weston office and the photographs are downloaded and labeled onto the server. Photos from the pre-construction survey document pre-existing site conditions. Photos from the two post construction photo documentation events illustrate vegetation growth within the basin, the channel within the basin, and sedimentation issues. Additionally, photo documentation has been conducted to illustrate installation, monitoring issues, and key features of the EDB. A photo documentation report was submitted in March, 2006, which documented pre-construction conditions during June 2005, conditions present within the basin in January 2006, and issues that effected monitoring during that time frame. A second photo documentation report will be submitted in July 2006 that will document conditions present in the basin through May 2006.
4.2 Bioassessment Sampling was conducted prior to construction to assess baseline conditions. The sampling event was conducted on June 22, 2005 in conjunction with the pre-construction photo documentation event. Post-construction monitoring will be implemented after construction of the EDB and full establishment of vegetative communities. It is anticipated that this monitoring will be conducted during September 2006. The focus of bioassessment is on improvement in the benthic community through improved water quality provided by the EDB. Since only the initial baseline bioassessment has been conducted it is not possible to present results for bioassessment monitoring at this time. The results of bioassessment monitoring will be presented in the final report for this project. 4.3 Stormwater Flows
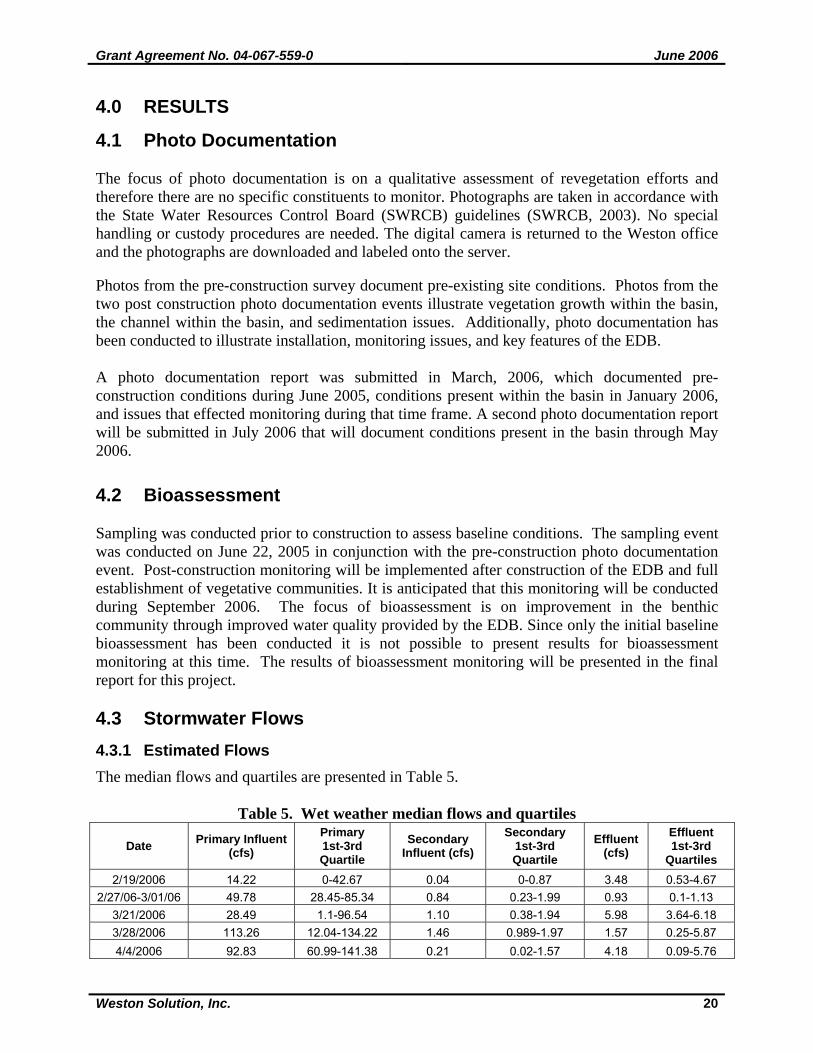
4.3.1 Estimated Flows The median flows and quartiles are presented in Table 5.
Table 5. Wet weather median flows and quartiles
Date Primary Influent (cfs)
Primary 1st-3rd Quartile
Secondary Influent (cfs)
Secondary 1st-3rd Quartile
Effluent (cfs)
Effluent 1st-3rd
Quartiles 2/19/2006 14.22 0-42.67 0.04 0-0.87 3.48 0.53-4.67
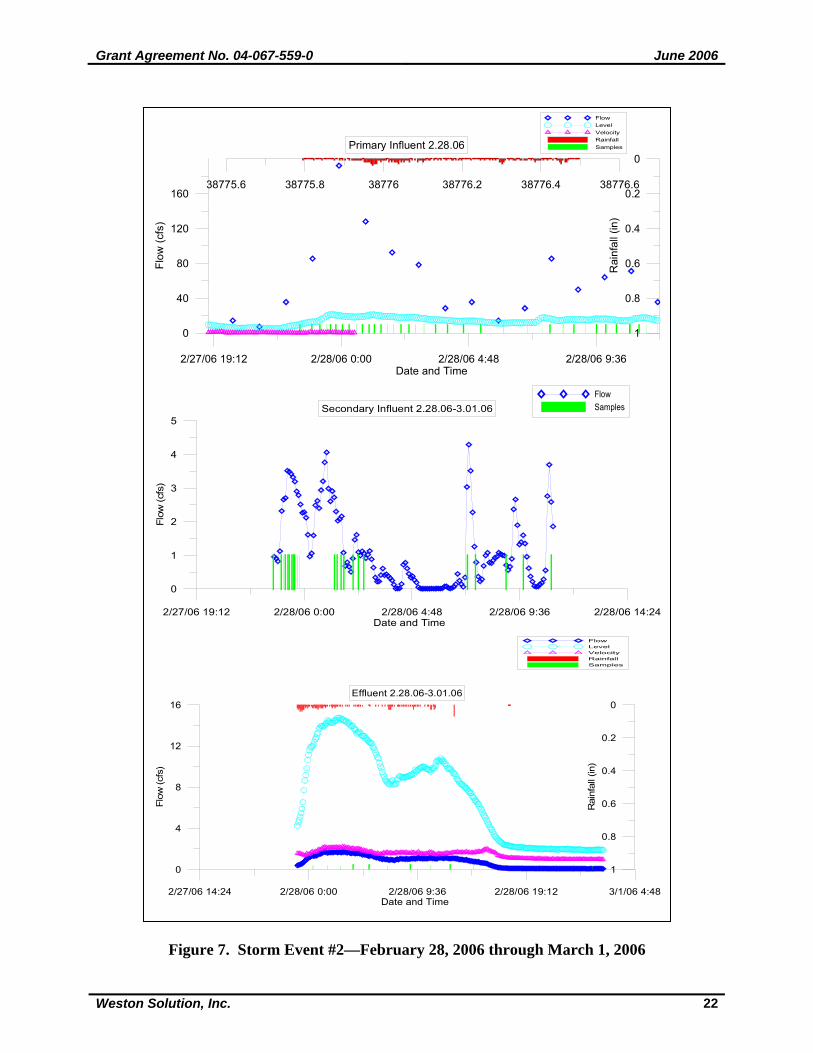
2/27/06-3/01/06 49.78 28.45-85.34 0.84 0.23-1.99 0.93 0.1-1.13 3/21/2006 28.49 1.1-96.54 1.10 0.38-1.94 5.98 3.64-6.18 3/28/2006 113.26 12.04-134.22 1.46 0.989-1.97 1.57 0.25-5.87 4/4/2006 92.83 60.99-141.38 0.21 0.02-1.57 4.18 0.09-5.76
Grant Agreement No. 04-067-559-0 June 2006
Weston Solution, Inc. 21
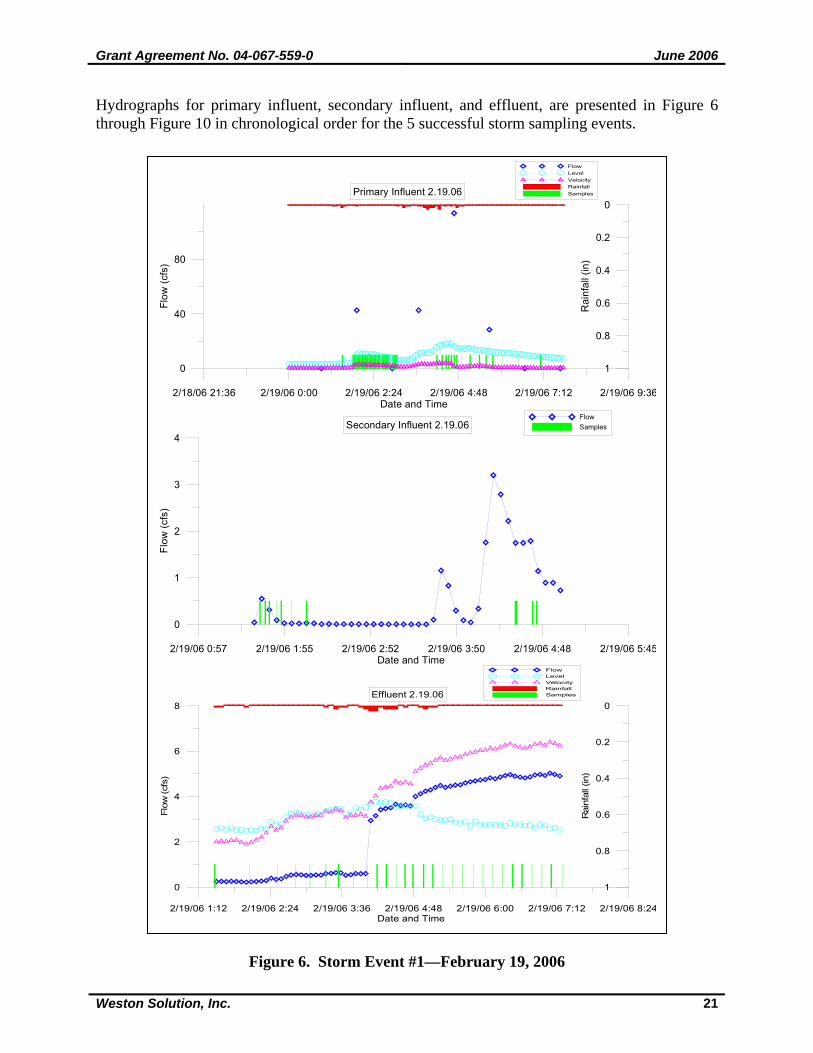
Hydrographs for primary influent, secondary influent, and effluent, are presented in Figure 6 through Figure 10 in chronological order for the 5 successful storm sampling events.
Figure 6. Storm Event #1—February 19, 2006
2/18/06 21:36 2/19/06 0:00 2/19/06 2:24 2/19/06 4:48 2/19/06 7:12 2/19/06 9:36Date and Time
0
40
80
Flow
(cfs
)
1
0.8
0.6
0.4
0.2
0
Rai
nfal
l (in
)
FlowLevelVelocityRainfallSamplesPrimary Influent 2.19.06
2/19/06 0:57 2/19/06 1:55 2/19/06 2:52 2/19/06 3:50 2/19/06 4:48 2/19/06 5:45Date and Time
0
1
2
3
4
Flow
(cfs
)
FlowSamplesSecondary Influent 2.19.06
2/19/06 1:12 2/19/06 2:24 2/19/06 3:36 2/19/06 4:48 2/19/06 6:00 2/19/06 7:12 2/19/06 8:24Date and Time
0
2
4
6
8
Flow
(cfs
)
1
0.8
0.6
0.4
0.2
0
Rai
nfal
l (in
)
FlowLevelVelocityRainfallSamplesEffluent 2.19.06
Grant Agreement No. 04-067-559-0 June 2006
Weston Solution, Inc. 22
Figure 7. Storm Event #2—February 28, 2006 through March 1, 2006
2/27/06 19:12 2/28/06 0:00 2/28/06 4:48 2/28/06 9:36Date and Time
0
40
80
120
160
Flow
(cfs
)
1
0.8
0.6
0.4
0.2
0
Rai
nfal
l (in
)
FlowLevelVelocityRainfallSamples
38775.6 38775.8 38776 38776.2 38776.4 38776.6
Primary Influent 2.28.06
2/27/06 19:12 2/28/06 0:00 2/28/06 4:48 2/28/06 9:36 2/28/06 14:24Date and Time
0
1
2
3
4
5
Flow
(cfs
)
FlowSamplesSecondary Influent 2.28.06-3.01.06
2/27/06 14:24 2/28/06 0:00 2/28/06 9:36 2/28/06 19:12 3/1/06 4:48Date and Time
0
4
8
12
16
Flow
(cfs
)
1
0.8
0.6
0.4
0.2
0
Rai
nfal
l (in
)
FlowLevelVelocityRainfallSamples
Effluent 2.28.06-3.01.06
Grant Agreement No. 04-067-559-0 June 2006
Weston Solution, Inc. 23
Figure 8. Storm Event #3—March 21, 2006
3/21/06 0:00 3/21/06 2:24 3/21/06 4:48 3/21/06 7:12 3/21/06 9:36Date and Time
12/30/99
2/8/00
3/20/00
4/29/00
6/8/00
7/18/00Fl
ow (c
fs)
1
0.8
0.6
0.4
0.2
0
Rai
nfal
l (in
)
FlowLevelRainfallSamplesPrimary Influent 3.21.06
3/21/06 1:55 3/21/06 2:24 3/21/06 2:52 3/21/06 3:21 3/21/06 3:50 3/21/06 4:19Date and Time
0
1
2
3
4
Flow
(cfs
)
FlowSamplesSecondary Influent 3.21.06
3/21/06 0:00 3/21/06 2:24 3/21/06 4:48 3/21/06 7:12 3/21/06 9:36Date and Time
0
2
4
6
8
10
Flow
(cfs
)
1
0.8
0.6
0.4
0.2
0
Rai
nfal
l (in
)
FlowLevelVelocityRainfallSamples
Effluent 3.21.06
Grant Agreement No. 04-067-559-0 June 2006
Weston Solution, Inc. 24
Figure 9. Storm Event #4—March 28, 2006
3/28/06 19:12 3/28/06 21:36 3/29/06 0:00 3/29/06 2:24 3/29/06 4:48Date and Time
0
40
80
120
160
200
Flow
(cfs
)
1
0.8
0.6
0.4
0.2
0
Rai
nfal
l (in
)
FlowLevelRainfallSamplesPrimary Influent 3.28.06
3/28/06 22:04 3/28/06 23:02 3/29/06 0:00 3/29/06 0:57 3/29/06 1:55Date and Time
0
1
2
3
4
Flow
(cfs
)
FlowSamples
Secondary Influent 3.28.06
3/28/06 19:12 3/28/06 21:36 3/29/06 0:00 3/29/06 2:24 3/29/06 4:48Date and Time
0
4
8
12
16
20
Flow
(cfs
)
1
0.8
0.6
0.4
0.2
0
Rai
nfal
l (in
)
FlowLevelVelocityRainfallSamplesEffluent 3.28.06

Grant Agreement No. 04-067-559-0 June 2006
Weston Solution, Inc. 25
Figure 10. Storm Event #5—April 4, 2006
4/4/06 16:48 4/4/06 18:00 4/4/06 19:12 4/4/06 20:24 4/4/06 21:36 4/4/06 22:48 4/5/06 0:00Date and Time
0
40
80
120
160
200
Flow
(cfs
)
1
0.8
0.6
0.4
0.2
0
Rai
nfal
l (in
)
FlowLevelRainfallSamples
Primary Influent 4.4.06
4/4/06 18:14 4/4/06 19:12 4/4/06 20:09 4/4/06 21:07 4/4/06 22:04 4/4/06 23:02Date and Time
0
1
2
3
4
5
Flow
(cfs
)
FlowSamples
Secondary Influent 4.4.06
4/4/06 14:24 4/4/06 16:48 4/4/06 19:12 4/4/06 21:36 4/5/06 0:00Date and Time
0
2
4
6
8
10
Flow
(cfs
)
1
0.8
0.6
0.4
0.2
0
Rai
nfal
l (in
)
FlowLevelVelocityRainfallSamplesEffluent 4.4.06

Grant Agreement No. 04-067-559-0 June 2006
Weston Solution, Inc. 26
A measure of how well Manning’s and the Rational Method (SRM) compare is presented below (Table 6). The Rational Method flow estimate per hour was subtracted from the Manning’s estimate per hour for all storm events. The differences were summed and divided by the sum total average hourly Manning flow for each event. This percent difference is presented in Table 6. Note that the difference in the first two storm events is most likely due to the error in height estimation after the sandbag berm washed away. Most importantly, the flow estimates for the last three events show that Manning’s flow results in larger flow estimates overall. This means that flows from the first two storm events are most likely under-estimated because the Rational Method was used to estimate flow for those events.
Table 6. Manning and SRM Comparison
Storm Percent
Difference 2/19/2006 33%
2/27/06-3/01/06 -90% 3/21/2006 32% 3/28/2006 14% 4/4/2006 24%
Grant Agreement No. 04-067-559-0 June 2006
Weston Solution, Inc. 27
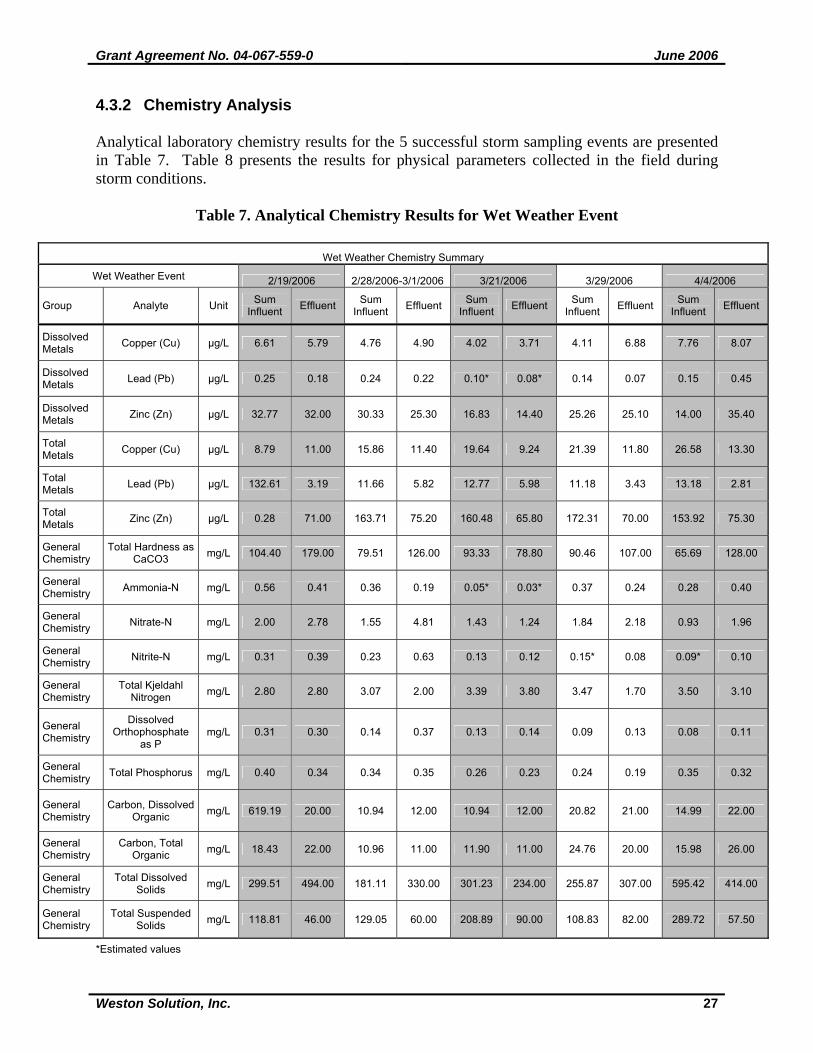
4.3.2 Chemistry Analysis Analytical laboratory chemistry results for the 5 successful storm sampling events are presented in Table 7. Table 8 presents the results for physical parameters collected in the field during storm conditions.
Table 7. Analytical Chemistry Results for Wet Weather Event
Wet Weather Chemistry Summary
Wet Weather Event 2/19/2006 2/28/2006-3/1/2006 3/21/2006 3/29/2006 4/4/2006
Group Analyte Unit Sum Influent Effluent Sum
Influent Effluent Sum Influent Effluent Sum
Influent Effluent Sum Influent Effluent
Dissolved Metals Copper (Cu) µg/L 6.61 5.79 4.76 4.90 4.02 3.71 4.11 6.88 7.76 8.07
Dissolved Metals Lead (Pb) µg/L 0.25 0.18 0.24 0.22 0.10* 0.08* 0.14 0.07 0.15 0.45
Dissolved Metals Zinc (Zn) µg/L 32.77 32.00 30.33 25.30 16.83 14.40 25.26 25.10 14.00 35.40
Total Metals Copper (Cu) µg/L 8.79 11.00 15.86 11.40 19.64 9.24 21.39 11.80 26.58 13.30
Total Metals Lead (Pb) µg/L 132.61 3.19 11.66 5.82 12.77 5.98 11.18 3.43 13.18 2.81
Total Metals Zinc (Zn) µg/L 0.28 71.00 163.71 75.20 160.48 65.80 172.31 70.00 153.92 75.30
General Chemistry
Total Hardness as CaCO3 mg/L 104.40 179.00 79.51 126.00 93.33 78.80 90.46 107.00 65.69 128.00
General Chemistry Ammonia-N mg/L 0.56 0.41 0.36 0.19 0.05* 0.03* 0.37 0.24 0.28 0.40
General Chemistry Nitrate-N mg/L 2.00 2.78 1.55 4.81 1.43 1.24 1.84 2.18 0.93 1.96
General Chemistry Nitrite-N mg/L 0.31 0.39 0.23 0.63 0.13 0.12 0.15* 0.08 0.09* 0.10
General Chemistry
Total Kjeldahl Nitrogen mg/L 2.80 2.80 3.07 2.00 3.39 3.80 3.47 1.70 3.50 3.10
General Chemistry
Dissolved Orthophosphate
as P mg/L 0.31 0.30 0.14 0.37 0.13 0.14 0.09 0.13 0.08 0.11
General Chemistry Total Phosphorus mg/L 0.40 0.34 0.34 0.35 0.26 0.23 0.24 0.19 0.35 0.32
General Chemistry
Carbon, Dissolved Organic mg/L 619.19 20.00 10.94 12.00 10.94 12.00 20.82 21.00 14.99 22.00
General Chemistry
Carbon, Total Organic mg/L 18.43 22.00 10.96 11.00 11.90 11.00 24.76 20.00 15.98 26.00
General Chemistry
Total Dissolved Solids mg/L 299.51 494.00 181.11 330.00 301.23 234.00 255.87 307.00 595.42 414.00
General Chemistry
Total Suspended Solids mg/L 118.81 46.00 129.05 60.00 208.89 90.00 108.83 82.00 289.72 57.50
*Estimated values
Grant Agreement No. 04-067-559-0 June 2006
Weston Solution, Inc. 28
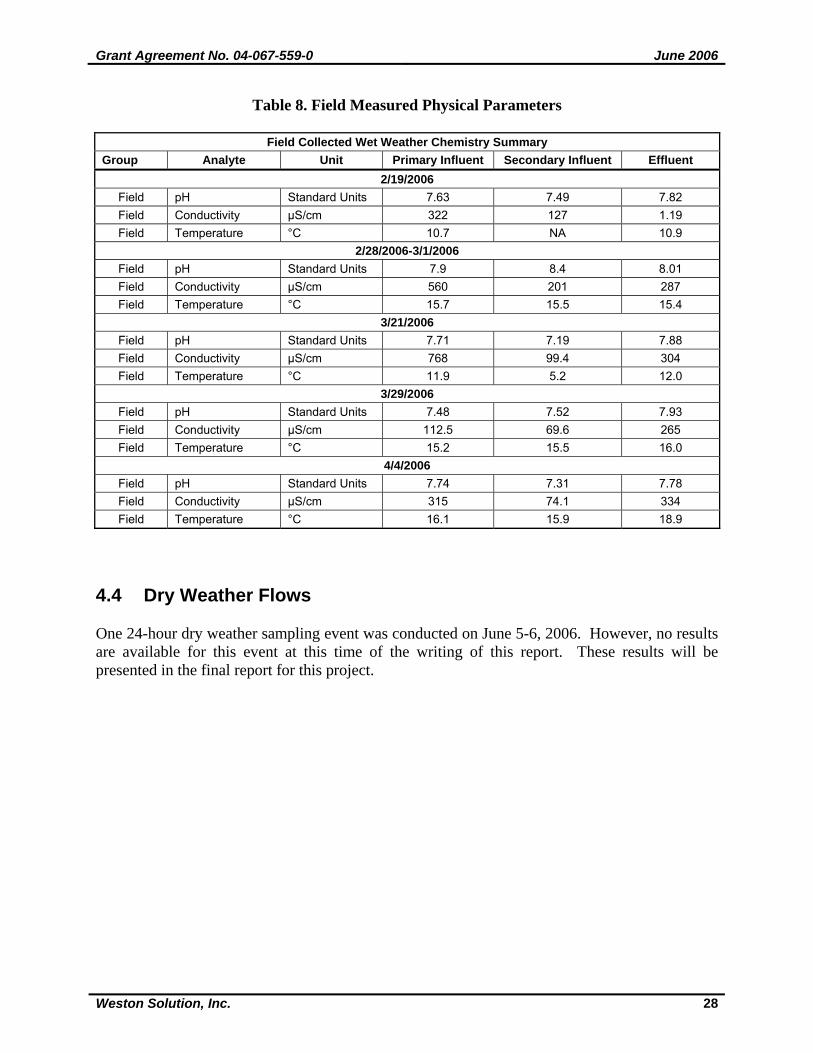
Table 8. Field Measured Physical Parameters
Field Collected Wet Weather Chemistry Summary Group Analyte Unit Primary Influent Secondary Influent Effluent
2/19/2006 Field pH Standard Units 7.63 7.49 7.82 Field Conductivity µS/cm 322 127 1.19 Field Temperature °C 10.7 NA 10.9
2/28/2006-3/1/2006 Field pH Standard Units 7.9 8.4 8.01 Field Conductivity µS/cm 560 201 287 Field Temperature °C 15.7 15.5 15.4
3/21/2006 Field pH Standard Units 7.71 7.19 7.88 Field Conductivity µS/cm 768 99.4 304 Field Temperature °C 11.9 5.2 12.0
3/29/2006 Field pH Standard Units 7.48 7.52 7.93 Field Conductivity µS/cm 112.5 69.6 265 Field Temperature °C 15.2 15.5 16.0
4/4/2006 Field pH Standard Units 7.74 7.31 7.78 Field Conductivity µS/cm 315 74.1 334 Field Temperature °C 16.1 15.9 18.9
4.4 Dry Weather Flows One 24-hour dry weather sampling event was conducted on June 5-6, 2006. However, no results are available for this event at this time of the writing of this report. These results will be presented in the final report for this project.
Grant Agreement No. 04-067-559-0 June 2006
Weston Solution, Inc. 29
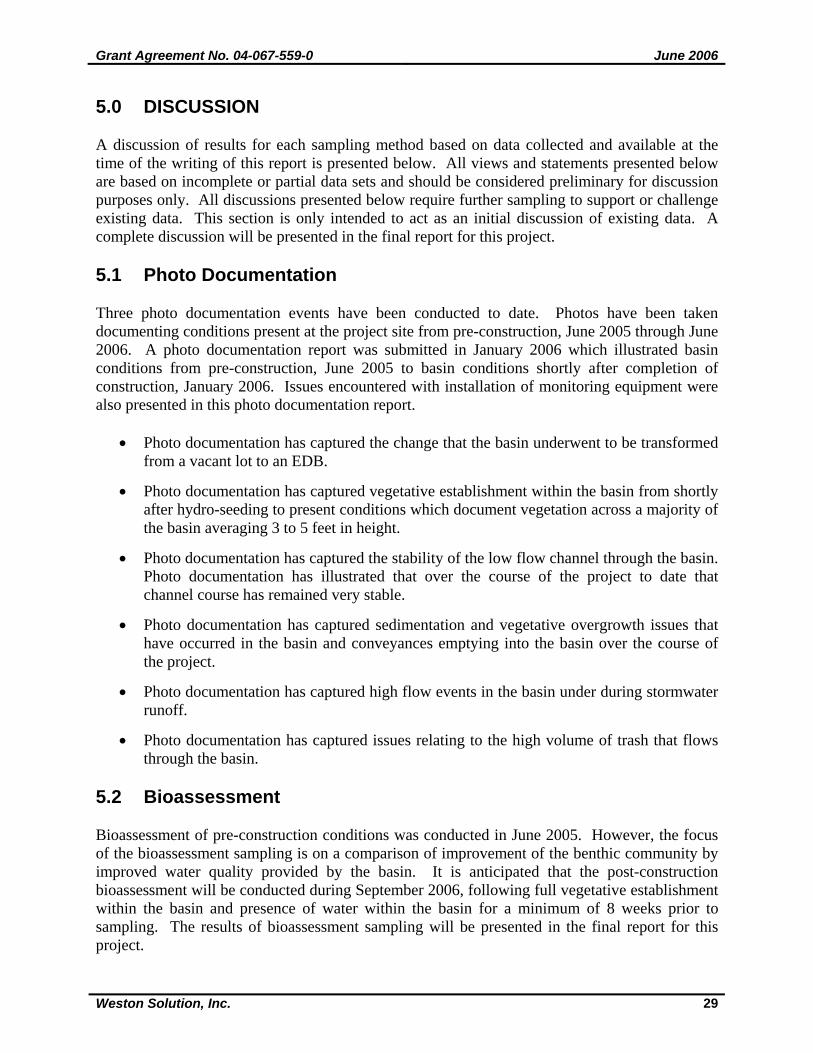
5.0 DISCUSSION A discussion of results for each sampling method based on data collected and available at the time of the writing of this report is presented below. All views and statements presented below are based on incomplete or partial data sets and should be considered preliminary for discussion purposes only. All discussions presented below require further sampling to support or challenge existing data. This section is only intended to act as an initial discussion of existing data. A complete discussion will be presented in the final report for this project. 5.1 Photo Documentation Three photo documentation events have been conducted to date. Photos have been taken documenting conditions present at the project site from pre-construction, June 2005 through June 2006. A photo documentation report was submitted in January 2006 which illustrated basin conditions from pre-construction, June 2005 to basin conditions shortly after completion of construction, January 2006. Issues encountered with installation of monitoring equipment were also presented in this photo documentation report.
• Photo documentation has captured the change that the basin underwent to be transformed from a vacant lot to an EDB.
• Photo documentation has captured vegetative establishment within the basin from shortly after hydro-seeding to present conditions which document vegetation across a majority of the basin averaging 3 to 5 feet in height.
• Photo documentation has captured the stability of the low flow channel through the basin. Photo documentation has illustrated that over the course of the project to date that channel course has remained very stable.
• Photo documentation has captured sedimentation and vegetative overgrowth issues that have occurred in the basin and conveyances emptying into the basin over the course of the project.
• Photo documentation has captured high flow events in the basin under during stormwater runoff.
• Photo documentation has captured issues relating to the high volume of trash that flows through the basin.
5.2 Bioassessment Bioassessment of pre-construction conditions was conducted in June 2005. However, the focus of the bioassessment sampling is on a comparison of improvement of the benthic community by improved water quality provided by the basin. It is anticipated that the post-construction bioassessment will be conducted during September 2006, following full vegetative establishment within the basin and presence of water within the basin for a minimum of 8 weeks prior to sampling. The results of bioassessment sampling will be presented in the final report for this project.
Grant Agreement No. 04-067-559-0 June 2006
Weston Solution, Inc. 30
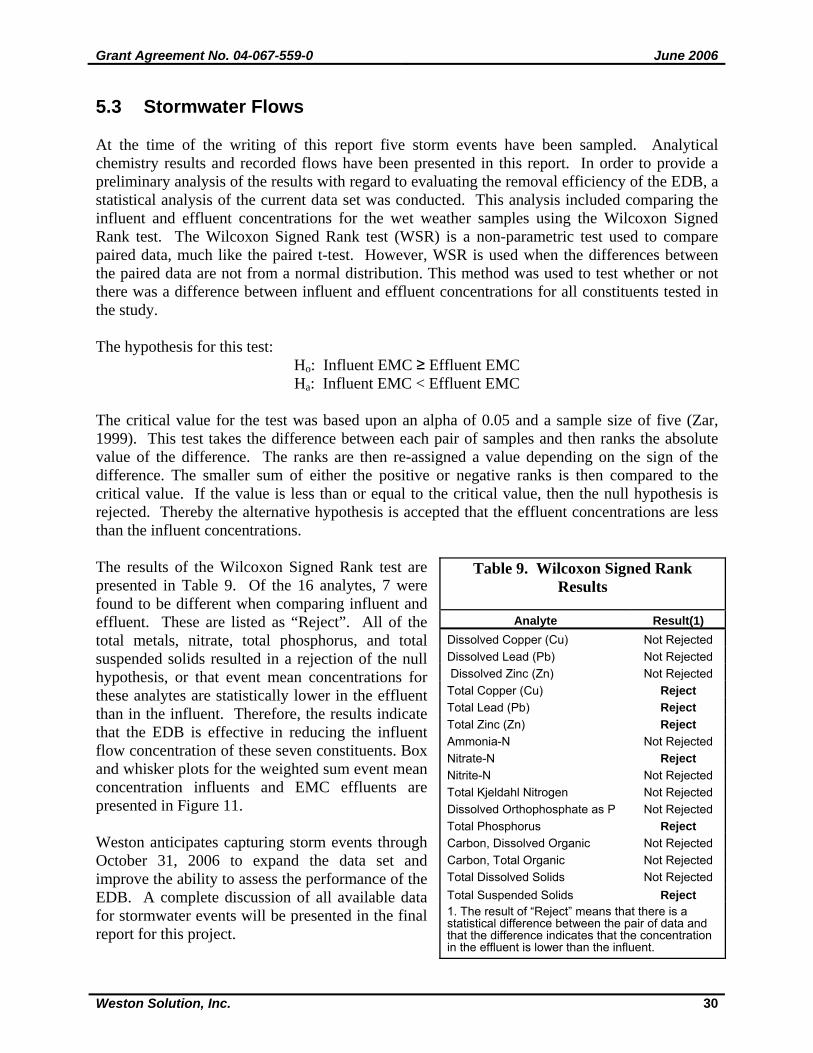
5.3 Stormwater Flows At the time of the writing of this report five storm events have been sampled. Analytical chemistry results and recorded flows have been presented in this report. In order to provide a preliminary analysis of the results with regard to evaluating the removal efficiency of the EDB, a statistical analysis of the current data set was conducted. This analysis included comparing the influent and effluent concentrations for the wet weather samples using the Wilcoxon Signed Rank test. The Wilcoxon Signed Rank test (WSR) is a non-parametric test used to compare paired data, much like the paired t-test. However, WSR is used when the differences between the paired data are not from a normal distribution. This method was used to test whether or not there was a difference between influent and effluent concentrations for all constituents tested in the study. The hypothesis for this test:
Ho: Influent EMC ≥ Effluent EMC Ha: Influent EMC < Effluent EMC
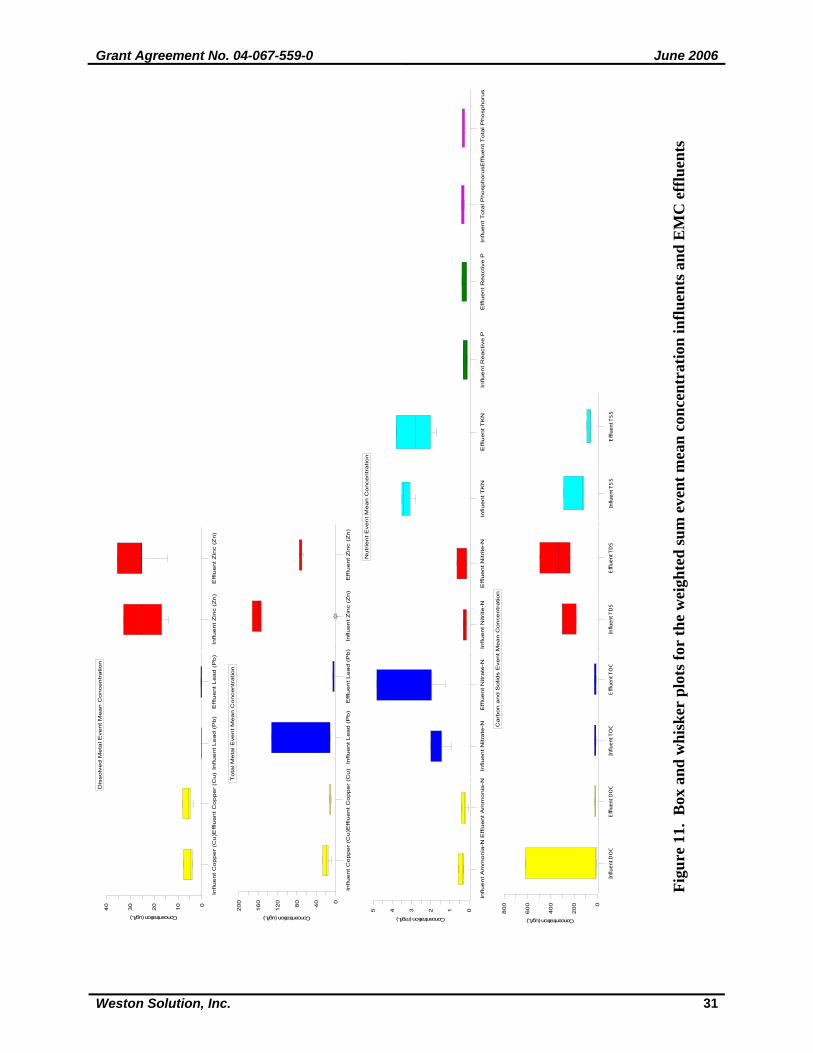
The critical value for the test was based upon an alpha of 0.05 and a sample size of five (Zar, 1999). This test takes the difference between each pair of samples and then ranks the absolute value of the difference. The ranks are then re-assigned a value depending on the sign of the difference. The smaller sum of either the positive or negative ranks is then compared to the critical value. If the value is less than or equal to the critical value, then the null hypothesis is rejected. Thereby the alternative hypothesis is accepted that the effluent concentrations are less than the influent concentrations. The results of the Wilcoxon Signed Rank test are presented in Table 9. Of the 16 analytes, 7 were found to be different when comparing influent and effluent. These are listed as “Reject”. All of the total metals, nitrate, total phosphorus, and total suspended solids resulted in a rejection of the null hypothesis, or that event mean concentrations for these analytes are statistically lower in the effluent than in the influent. Therefore, the results indicate that the EDB is effective in reducing the influent flow concentration of these seven constituents. Box and whisker plots for the weighted sum event mean concentration influents and EMC effluents are presented in Figure 11. Weston anticipates capturing storm events through October 31, 2006 to expand the data set and improve the ability to assess the performance of the EDB. A complete discussion of all available data for stormwater events will be presented in the final report for this project.
Table 9. Wilcoxon Signed Rank Results
Analyte Result(1)
Dissolved Copper (Cu) Not Rejected Dissolved Lead (Pb) Not Rejected Dissolved Zinc (Zn) Not Rejected Total Copper (Cu) Reject Total Lead (Pb) Reject Total Zinc (Zn) Reject Ammonia-N Not Rejected Nitrate-N Reject Nitrite-N Not Rejected Total Kjeldahl Nitrogen Not Rejected Dissolved Orthophosphate as P Not Rejected Total Phosphorus Reject Carbon, Dissolved Organic Not Rejected Carbon, Total Organic Not Rejected Total Dissolved Solids Not Rejected Total Suspended Solids Reject 1. The result of “Reject” means that there is a statistical difference between the pair of data and that the difference indicates that the concentration in the effluent is lower than the influent.
Grant Agreement No. 04-067-559-0 June 2006
Weston Solution, Inc. 31
Figu
re 1
1. B
ox a
nd w
hisk
er p
lots
for
the
wei
ghte
d su
m e
vent
mea
n co
ncen
trat
ion
influ
ents
and
EM
C e
fflu
ents
0
10
20
30
40
Concentration (ug/L)
Influ
en
t Z
inc
(Zn
)E
fflu
ent Z
inc
(Zn)
Influ
ent L
ea
d (
Pb
)E
fflu
ent L
ea
d (
Pb)
Influ
ent C
op
per
(Cu
)Eff
luen
t C
opp
er
(Cu)
Dis
solv
ed M
eta
l Eve
nt M
ea
n C
on
centr
atio
n
0
40
80
12
0
16
0
20
0
Concentration (ug/L)
Influ
en
t Z
inc
(Zn)
Efflu
en
t Z
inc
(Zn
)In
fluen
t L
ead
(P
b)
Efflu
en
t Lead
(P
b)
Influ
ent
Co
pp
er
(Cu)E
fflu
en
t C
oppe
r (C
u)
Tota
l Meta
l E
vent M
ean
Conce
ntr
atio
n
012345
Concentration (mg/L)
Influ
en
t R
eact
ive P
Efflu
en
t R
ea
ctiv
e P
Influ
ent T
KN
Eff
luent
TK
NIn
flue
nt N
itrite
-NE
fflu
en
t N
itrite
-NIn
fluen
t N
itrate
-NE
fflu
en
t N
itrate
-NIn
flue
nt A
mm
on
ia-N
Eff
lue
nt A
mm
onia
-NIn
fluent T
ota
l Pho
sphoru
sEfflu
en
t T
ota
l Pho
sphoru
s
Nutr
ient E
ven
t M
ean C
once
ntr
atio
n
0
20
0
40
0
60
0
80
0
Concentration (ug/L)
Influ
ent T
SS
Effl
uent
TS
SIn
fluen
t TD
SE
fflue
nt T
DS
Influ
ent T
OC
Effl
uent
TO
CIn
fluen
t DO
CE
fflue
nt D
OC
Ca
rbon
an
d S
olid
s E
vent
Mean C
once
ntr
atio
n
Grant Agreement No. 04-067-559-0 June 2006
Weston Solution, Inc. 32
5.4 Dry Weather Flows One 24-hour dry weather sampling event was completed in June 2006. Results for this sampling event were not available at the time of this report. Results of dry weather sampling will be presented in the final report for this project.
Grant Agreement No. 04-067-559-0 June 2006
Weston Solution, Inc. 33
6.0 DETENTION BASIN PERFORMANCE SUMMARY A summary of performance of the EDB is presented below. All views and statements presented below are based on incomplete or partial data sets and should be preliminary for discussion purposes only. All views presented below require further sampling to support or challenge existing data. This section is only intended to act as an initial summary of performance to date. A complete summary will be presented in the final report for this project. 6.1 Pollutant Removal Efficiency At the time of the writing of this report, the results to date indicate that the EDB is effective in reducing the influent concentrations of total metals, several nutrients and TSS. These results are preliminary and are presented here for discussion purposes. 6.2 Effect of Vegetation Establishment on Removal Efficiency Initial sampling within the EDB began with little or no vegetation established with the basin. Vegetation is still in the process of fully establishing itself. A summary will be presented in the final report documenting any discernable effects the establishment of vegetation appeared, or appeared not to have on the EDB’s pollutant removal efficiency. At this time due to insufficient data and lack of full vegetative establishment no information is presented. 6.3 Water Treatment/Holding Capacity vs. Observed Rainfall All storms sampled and observed during the assessment of this EDB have resulted in the cresting of the flow over the spillway. Once storm flows crest over the spillway the basin is not treating the full storm volume. Additionally, during higher flows that crest the spillway, the County of San Diego Flood Control opens the emergency bypass which further reduces the retention time of the EDB and potentially further impacts pollutant removal efficiency. The County of San Diego Flood Control opens the emergency bypass to prevent flooding upstream. The emergency bypass was designed into the EDB to be utilized if the primary effluent became blocked and it was necessary to drain the basin.
Grant Agreement No. 04-067-559-0 June 2006
Weston Solution, Inc. 34
7.0 CONCLUSIONS AND RECOMMENDATIONS The assessment of the Woodside EDB is incomplete and this interim report is intended solely to act as an update on the status of the assessment and present data that has been collected to date. Thus, at this time no conclusions or recommendations can be put forth. Conclusions and recommendations will be included in the final report for this project.
Grant Agreement No. 04-067-559-0 June 2006
Weston Solution, Inc. 35
8.0 REFERENCES Zar, J.H., 1999. Biostatistical Analysis, 4th ed. Prentice-Hall, Inc., New Jersey. Rick Engineering Company. 2004. Preliminary Design for Water Quality Basin at Woodside Avenue. Rick Engineering Company. 2006. Weston Solutions. 2005. Quality Assurance Project Plan for Woodside Avenue Low Flow Water Quality Basin Photo Documentation and Water Quality Monitoring Kuichling, E. 1889. The relation between the rainfall and the discharge of sewers in populous districts. Transactions, American Society of Civil Engineers 20, 1–56.