counterfeiting in figures · · 2013-04-05directorate-general for the fight against...
TRANSCRIPT

July 2012 - 1
Department for Enterprise and Internationalisation Directorate-General for the Fight against Counterfeiting –
Italian Patent and Trademark Office (UIBM)
Counterfeiting in figures:
Italy’s fight against counterfeiting, 2008-2011
Rome, July 2012
Integrated database on anti‐counterfeiting activities

July 2012 - 2
Index
Introduction
Part One – Anti-counterfeiting figures, 2008-2010
Part Two – External indicators
Part Three – Anti-counterfeiting activities

Introduction
Every day a large number of counterfeit products are manufactured, distributed and sold all over the world. In 2009 the Organisation for Economic Co-operation and Development (OECD) estimated that the economic value of the phenomenon was approximately 250 billion dollars,¹ more than the GDP of at least 150 countries.
More recent estimates2 indicate that by 2015 the total value of counterfeiting worldwide will reach 1,700 billion dollars, including the market value of international trade, of production, of domestic consumption and of digital piracy.
Other types of study have dealt with the issue of the economic value of intellectual property in various terms.3
A survey4 conducted in 15 countries has shown how, out of 21 classes of products representing the range of products traded at the international level, in no less than 19 violations connected with intellectual property were recorded, with 744 specific counterfeit products identified (14% of the total).
¹ OECD 2009, magnitude of counterfeiting and piracy of tangible products: an update.
² ICC (International Chamber of Commerce), BASCAP, Business Action to Stop Counterfeiting and Piracy, Feb. 2011, “Estimating the global economic and social impacts of counterfeiting and piracy, a report commissioned by Business Action to Stop Counterfeiting and Piracy”, Frontier Economics Ltd, London. 3 US Department of Commerce, Intellectual Property and the U.S. Economy: Industries in Focus, March 2012
4 OECD 2006, “OECD customs survey”, unpublished, cited in OECD 2008, “The economic impact of counterfeiting and piracy”.
July 2012 - 3

July 2012 - 4
Introduction
As one of the distribution channels of choice for trade in fake goods, the use of Internet is growing. Nevertheless, the expansion of the phenomenon and the strength of criminal organisations also involves traditional distribution channels which, although they are more difficult to violate, render consumers less inclined to ascertain the authenticity of the product.
The following table summarises the advantages and related disadvantages for distributors of fake goods according to the distribution channels used.
Nexen Business Consultants, based on OECD 2008, “The economic impact of counterfeiting and piracy”
Difficult to penetrate Ease of fraud
Difficulty of fraud Low risk
High risk Low costs, anonymous, size of market, ease of fraud
Markets and fairs

July 2012 - 5
Introduction
The data presentations contained in this report have been produced in order to provide an overall evaluation of the phenomenon of the fight against counterfeiting.
It should be pointed out that the information and analyses contained in this document refer to anti-counterfeiting activities and not to the phenomenon of counterfeiting itself. They may not therefore be considered a direct measurement of the phenomenon with a certifiable statistical value.
Nevertheless, it may be said that these data constitute one of the most useful indirect-measurement tools for evaluating anti-counterfeiting actions and for steering the strategic and legislative actions of the Authorities concerned, particularly at the local level, where law Enforcement Agencies have been conducting their anti-counterfeiting activities – by now successfully – for years.

July 2012 - 6
Initial indicators (1/4)
During the four-year period under consideration (2008-2011) an essentially stable trend in the number of seizures relating to counterfeit goods is observed at the national level, with an increase in the average size of such seizures (determined by the ratio of the number of items seized to the number of seizures).
1. Interesting information emerges from an analysis of the breakdown of seizures by product category/sector. The main categories continued to be “Clothing Accessories”, “Clothing” and “Other Goods”, although they were slightly reduced in size in 2011; in addition, the average size of seizures is higher for other types of product, including “Toys and Games” and “Perfumes and Cosmetics”.
2. At the regional level, despite significant year-to-year variations in quantity terms, the ranking of Italy’s regions has remained essentially stable. The largest number of seizures took place in Lazio, followed by Lombardy, Campania and Apulia.

July 2012 - 7
Initial indicators (2/4)
Specifically, Campania, Lazio and Lombardy, and to a lesser extent Tuscany, Apulia and Calabria, are regions with potentially high consumption of counterfeit goods and/or transit regions for such goods.
It should be pointed out that in absolute terms, seizures in Lombardy and Lazio, followed by Campania, were of a higher economic value than in other Regions.
For all of the other Regions the data do not show any anomalous and/or sufficiently significant situations for the purposes of analysis of the phenomenon.
This report introduces a number of useful indicators for verifying correlation and any interdependence between behaviours of the phenomenon in question under consideration with standard data on the phenomenon under analysis drawn from ISTAT data (crimes reported by law Enforcement Agencies to Judicial Authorities), demographic data (population) and macroeconomic data (for example consumption, income, imports and exports).

July 2012 - 8
Initial indicators (3/4)
In order to interpret the phenomenon correctly, it is also necessary to examine the other two types of violation in more detail: that is, those relating to legislation governing “Made in Italy” and Product Safety violations.
With regard to both types of violation there was a general reduction in both the number and total value of seizures in 2011.
Once again the key role played by the Campania and Liguria regions regarding violations of legislation relating to “Made in Italy” issues comes to light, as does the role of the Veneto, Apulia, Tuscany and Campania regions regarding Product Safety violations. In other regions the phenomenon was marked by a high degree of volatility during the period in question and was not particularly correlated with a specific geographical pattern for such violations.

July 2012 - 9
Initial indicators (4/4)
During the period under examination a slight decrease in the number of items seized and the number of seizures in 2011 can be noted.
Customs Agency and Tax Police data regarding counterfeiting, excluding Foods, Tobacco, Beverages and Medical Products.
Number of items seized
Number of seizures

July 2012 - 10
The European context (1/2)
The Taxation and Customs Union of the European Commission gathers and publishes statistics relating to anti-counterfeiting activities performed by the customs agencies of Member States in terms of goods seized as they enter the EU. European data include all product categories, including Foods, Beverages, Tobacco and Medical Products.
ec.europa.eu/taxation_customs/customs/customs_controls/counterfeit_piracy/statistics
The most recent data are for 2011. The main indicators are summarised here in order to provide a broader overview of the counterfeiting phenomenon.
Approximately 91,000 seizures and 115 million products in 2011: the number of seizures continues
to increase
Estimated equivalent value
of the original goods in 2011: over 1.2 billion
euros
73% of goods seized are of Chinese origin
In 2011 Italy accounted for over 26% of
all items seized in the EU, compared
with 15% in 2010
Sharp increase in seizures of goods sold online and
transported by air, post or courier
Medicines and cigarettes constituted almost 42% of products seized in 2011

July 2012 - 11
The European context (2/2)
Items
Seizures
Since 2000 the number of seizures has recorded a marked upward
trend The total amounts of goods seized is growing, with a pronounced peak in
2008 Source: (*)
Source: (*) Source: (*)
Clothing and Shoes are the most commonly seized items
(*) European Commission - Taxation and customs union, Report on EU customs enforcement of intellectual property rights, Results at the EU border - 2010
Seizures of goods entering EU (2000-2011)
Year
No
. o
f it
ems
No
. o
f se
izu
res
Most commonly seized articles, by number of seizures Most commonly seized articles, by number of items
Percentage of total number of seizures in 2011 Percentage of total number of items in 2011
Shoes Clothing
Clothing accessories
Electrical equipment Sports shoes
Watches
Other goods
Medicines Stationery Cigarettes
Clothing Mobile phone
accessories Labels and decorations
Other goods

July 2012 - 12
Index
Introduction
Part One – Anti-counterfeiting figures, 2008-2010
Part Two – External indicators
Part Three – Anti-counterfeiting activities

Introduction
The figures presented below refer exclusively to seizures by the Italian Customs Agency and Italian Tax Police, net of seizures performed jointly by both agencies.
They exclude seizures of foods, beverages, tobacco and medical products, as a result of the specific nature of the relevant legislative and organisational context.
They mainly concern seizures relating to violations of anti-counterfeiting legislation.
The first part of the report analyses the following, in that order:
Seizures
Seizures by region
Seizures by product sector
Seizures relating to “Made in Italy” and “Product Safety” violations
July 2012 - 13

July 2012 - 14
Standardisation of units of measurement
To enable correct interpretation of the data, attention should be drawn to an inconsistency in the data provided by the Agencies involved regarding the unit used to measure the volume of seized goods.
So that the data can be correctly interpreted, it has been agreed that all seizures should be assigned the unit of measurement “number of items” by means of a simple conversion rule:
1 kilo = 1 item; 1 litre = 1 item, 1 metre = 1 item
This conversion, although reasonable from several perspectives, nonetheless produces an extremely minor approximation, given the negligible share of seizures concerned.
Product sectors excluded from this analysis include Foods, Beverages and Tobaccos, precisely those which are the main ones in which seizures are expressed in kilograms or litres.

July 2012 - 15
Seizures in Italy
Data provided by Customs Agency and Tax Police concerning counterfeiting, excluding Foods, Beverages, Tobacco and Medical Products.
During the four years from 2008 to 2011 the Italian Customs Agency and Tax Police carried out over 71,000 seizures, while anti-counterfeiting activities do not show any significant changes from year to year.
Number of seizures

July 2012 - 16
Number of items seized
The 71,000 seizures by the Italian Customs Agency and Tax Police during the period in question regarded over 228 million counterfeit items; while anti-counterfeiting activities measured in terms of number of operations changed little during the four years, it is interesting to note that their impact increased: indeed, the average size of seizures, measured in terms of products seized, increased sharply over the four years in question, from 2,331 items in 2008 to around 3,560 in 2011.
Data provided by Customs Agency and Tax Police concerning Counterfeiting, excluding Foods, Beverages, Tobacco and Medical Products
Counterfeiting 2008 2009 2010 2011 Overall total Number of items seized 42,056,701 68,142,885 64,008,000 54,491,186 228,698,772 Number of seizures 18,041 19,683 18,331 15,304 71,359 Average size of seizures 2,331 3,462 3,492 3,561 3,205
Source: IPERICO (DGLC-UIBM)

July 2012 - 17
Seizures by Region
Anti-counterfeiting activities recorded the highest number of seizures in Lazio, with 15,121 seizures in total during the four years, around 21% of all seizures in Italy, followed by Lombardy, Campania and Puglia.
Data provided by Customs Agency and Tax Police concerning Counterfeiting, excluding Foods, Beverages, Tobacco and Medical Products
Source: IPERICO (DGLC-UIBM)
Seizures by region
Nu
mb
er
ABRU
ZZO
BASIL
ICATA
CALA
BRIA
CAM
PAN
IA
EMIL
IA R
OM
AG
NA
FRIU
LI
LAZIO
LIG
URIA
LOM
BARD
Y
MARCH
E
MO
LISE
PIED
MO
NT
APU
LIA
SARD
INIA
SIC
ILY
TUSCAN
Y
TREN
TIN
O
UM
BRIA
AO
STA
VALL
EY
VEN
ETO

July 2012 - 18
Average size of seizures by Region (1/2)
The average size of seizures exhibited an increasing trend during the period observed. At the regional level the figure for Trentino Alto Adige stands out, with an aggregated average of 10,236 items, although the figure is discontinuous, given the extraordinary dimensions of a small number of individual operations.
Data provided by Customs Agency and Tax Police
concerning Counterfeiting, excluding Foods, Beverages, Tobacco and Medical Products
Source: IPERICO (DGLC-UIBM)
Average size of seizures Aggregated average
ABRUZZO BASILICATA CALABRIA CAMPANIA EMILIA ROMAGNA FRIULI LAZIO LIGURIA LOMBARDY MARCHE MOLISE PIEDMONT APULIA SARDINIA SICILY TUSCANY TRENTINO UMBRIA AOSTA VALLEY VENETO Overall total

July 2012 - 19
Average size of seizures by Region (2/2)
The aggregated average for the period is not sufficient to capture the phenomenon in detail. We also need to focus on percentage changes in the average size of seizures (the overall change between 2008 and 2001), pointing out that: the regions in which the average size of seizures increased are Abruzzo (+3,981.75%), Umbria (+793.84%), Piedmont (+444.07%), Veneto (+356.66%) and Apulia (+283.31%), while the regions in which it decreased are the Aosta Valley (-99.88%), Trentino Alto Adige (-91.31%), Sardinia (-89.14%), Friuli Venezia Giulia (-76.83%) and Lombardy (-76.25%). Trentino Alto Adige and the Aosta Valley, which over the four years recorded a higher average size of seizure than other regions, showed a contraction in 2011.

July 2012 - 20
Seizures by Product Sector (1/2)
57% of all seizures recorded during the period in question were concentrated mainly in Clothing Accessories and Clothing, with 25,554 and 14,814 seizures, respectively. The category of Footwear, too, recorded significant numbers, with 9,559 seizures.
Data provided by Customs Agency and Tax Police concerning Counterfeiting, excluding Foods, Beverages, Tobacco and Medical Products
SEIZURES BY PRODUCT SECTOR 2008 2009 2010 2011 Overall total CLOTHING 3,724 4,094 3,883 3,113 14,814CLOTHING ACCESSORIES 6,914 7,287 6,386 4,967 25,554OTHER GOODS 1,444 1,356 2,076 1,701 6,577ELECTRICAL EQUIPMENT 489 726 1,142 1,139 3,496IT EQUIPMENT 61 76 135 125 397FOOTWEAR 2,828 3,401 1,883 1,447 9,559CDS, DVDS AND VIDEOCASSETTES 84 100 100 61 345TOYS AND GAMES 238 311 377 227 1,153EYEWEAR 1,338 1,126 1,002 870 4,336WATCHES AND JEWELLERY 867 1,142 1,294 1,619 4,922PERFUMES AND COSMETICS 54 64 53 35 206Overall total 18,041 19,683 18,331 15,304 71,359
Source: IPERICO (DGLC-UIBM)

Source: IPERICO (DGLC-UIBM) July 2012 - 21
Seizures by Product Sectors (2/2)
The trend over time in seizures by product sector has shown slight
variation, which is more pronounced in some sectors than in others; in 2011
there was a decrease in the number of seizures of clothing, clothing
accessories and footwear. With regard to products seized, the concentration in
the three main sectors, clothing, accessories and footwear, nevertheless
remains very high, accounting for around 70% of all goods seized during the
period in question.

July 2012 - 22
Number of items seized by Product Sector (1/2)
The number of items seized fell overall in 2011, with the exception of the residual category of other goods (which peaked in 2010 and remained essentially stable in 2011), electrical equipment, IT equipment and eyewear, which in contrast increased significantly in terms of number of items seized in 2011.
Data provided by Customs Agency and Tax Police
concerning Counterfeiting, excluding Foods, Beverages, Tobacco and Medical Products Number of items seized 2008 2009 2010 2011 Overall total Percentage
change 2008‐2011
CLOTHING 11,837,302 12,753,112 12,781,043 6,218,729 43,500,276 47.47%
CLOTHING ACCESSORIES 8,257,589 29,983,001 4,975,004 9,115,830 52,331,424 10.39%
OTHER GOODS * 10,492,727 6,130,907 26,834,232 23,278,889 66,736,755 121.86%
ELECTRICAL EQUIPMENT 1,629,368 1,197,981 681,837 3,345,619 6,854,805 105.33%
IT EQUIPMENT 75,703 81,336 183,099 279,278 619,416 268.91%
FOOTWEAR 5,529,665 4,143,310 1,807,529 1,344,778 12,825,282 ‐75.68%
CDS, DVDS, VIDEOCASSETTES 277,812 291,236 1,330,625 203,537 2,103,210 ‐26.74%
TOYS AND GAMES 1,499,532 11,284,521 10,406,511 4,989,188 28,179,752 232.72%
EYEWEAR 1,387,536 699,188 512,757 3,802,051 6,131,532 171.01%
WATCHES AND JEWELLERY 407,220 326,568 1,356,597 892,459 2,982,844 119.16%
PERFUMES AND COSMETICS 662,157 1,251,725 3,108,766 1,020,828 6,043,476 54.17%
Overall total 42,056,701 68,142,885 64,008,000 54,491,186 228,698,772 29.57%
Source: IPERICO (DGLC-UIBM)
* Main types of product in the “Other Goods” category: tools, car parts, stationery, furniture and furnishings

July 2012 - 23
Number of items seized by Product Sector (2/2)
If we analyse the change in the number of items seized between 2008 and
2011, we obtain some interesting information regarding the increase or
decrease for specific product categories.
IT equipment, toys and games recorded an increase of 268.91% and
232.72% respectively.
These figures in all likelihood point to an increasing trend in the purchase of
high-tech devices, such as computers, mobile phones, audio-video systems,
etc.
On the other hand, between 2008 and 2011, the number of footwear
and clothing items fell by -75.68% and -47.47% respectively.
Average size of seizures by Product Sector
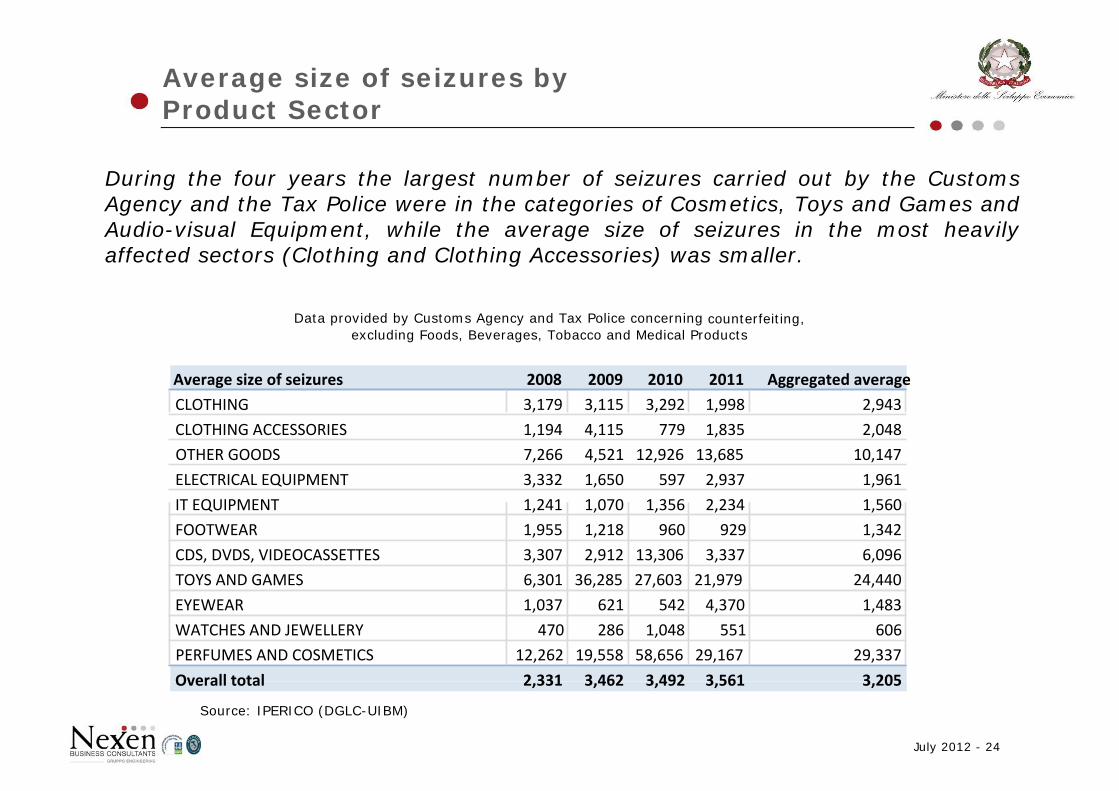
During the four years the largest number of seizures carried out by the Customs Agency and the Tax Police were in the categories of Cosmetics, Toys and Games and Audio-visual Equipment, while the average size of seizures in the most heavily affected sectors (Clothing and Clothing Accessories) was smaller.
Data provided by Customs Agency and Tax Police concerning counterfeiting, excluding Foods, Beverages, Tobacco and Medical Products
Average size of seizures 2008 2009 2010 2011 Aggregated average CLOTHING 3,179 3,115 3,292 1,998 2,943 CLOTHING ACCESSORIES 1,194 4,115 779 1,835 2,048 OTHER GOODS 7,266 4,521 12,926 13,685 10,147 ELECTRICAL EQUIPMENT 3,332 1,650 597 2,937 1,961 IT EQUIPMENT 1,241 1,070 1,356 2,234 1,560 FOOTWEAR 1,955 1,218 960 929 1,342 CDS, DVDS, VIDEOCASSETTES 3,307 2,912 13,306 3,337 6,096 TOYS AND GAMES 6,301 36,285 27,603 21,979 24,440 EYEWEAR 1,037 621 542 4,370 1,483 WATCHES AND JEWELLERY 470 286 1,048 551 606 PERFUMES AND COSMETICS 12,262 19,558 58,656 29,167 29,337 Overall total 2,331 3,462 3,492 3,561 3,205
Source: IPERICO (DGLC-UIBM)
July 2012 - 24

July 2012 - 25
IPERICO Web
Customised statistics and detailed tables on counterfeiting
IPERICO online at the following address: http://www.uibm.gov.it/iperico

July 2012 - 26
Seizures concerning “Made in Italy” violations (1/3)
Activities to counter violations of legislation governing products “Made in Italy” show a steadily decreasing trend, falling from 1,285 seizures in 2008 to 847 in 2011, with a much larger reduction both in terms of the total number of items seized and number of operations.
Data provided by Customs Agency and Tax Police concerning counterfeiting, excluding Foods, Beverages, Tobacco and Medical Products
Made in Italy 2008 2009 2010 2011 Overall total
Number of items seized 20,753,339 17,460,010 7,569,790 6,434,557 52,217,696
Number of seizures 1,285 1,198 1,128 847 4,458
Average size of seizures 16,150 14,574 6,711 7,597 11,713
Source: IPERICO (DGLC-UIBM)

July 2012 - 27
Seizures concerning “Made in Italy” violations (2/3)
Also with regard to seizures concerning violations of “Made in Italy” legislation, most seizures (40%) were in the major category of “Clothing, Footwear and Clothing Accessories”.
Data provided by Customs Agency and Tax Police concerning counterfeiting, excluding Foods, Beverages, Tobacco and Medical Products
Source: IPERICO (DGLC-UIBM)
Percentage distribution of seizures by sector, 2008 ‐ 2011
CLOTHING CLOTHING ACCESSORIES OTHER GOODS ELECTRICAL EQUIPMENT IT EQUIPMENT FOOTWEAR CDS, DVDS, VIDEOCASSETTES TOYS AND GAMES EYEWEAR WATCHES AND JEWELLERY PERFUMES AND COSMETICS

July 2012 - 28
Seizures concerning “Made in Italy” violations (3/3)
A regional analysis shows that Campania was – considering the four years as a whole – the region which ranked first for number of seizures concerning violations of “Made in Italy” legislation, although the number was smaller in 2011 compared with the pronounced peak of 2010. In contrast, despite ranking second, Liguria, recorded a sharp fall in the number of operations.
Data provided by Customs Agency and Tax Police concerning counterfeiting, excluding Foods, Beverages, Tobacco and Medical Products
Source: IPERICO (DGLC-UIBM)
Number of seizures relating to violations of “Made in Italy” legislation, 2008 ‐ 2011
Num
ber
ABRU
ZZO
BASILICA
TA
CALABR
IA
CAMPA
NIA
EMILIA ROMAG
NA
FRIULI
LAZIO
LIGURIA
LOMBA
RDY
MAR
CHE
MOLISE
PIED
MONT
APULIA
SARD
INIA
SICILY
TUSCAN
Y
TREN
TINO
UMBR
IA
AOSTA VA
LLEY
VENETO

July 2012 - 29
Seizures relating to Product Safety violations (1/3)
Activities carried out during the period in question by the Customs Agency and Tax Police also obtained significant results in relation to Product Safety, with 7,913 seizures and over 116 million items seized; such operations increased steadily between 2008 and 2010 both in terms of number of items seized and average size of seizures, before decreasing in number in 2011.
Data provided by Customs Agency and Tax Police concerning counterfeiting, excluding Foods, Beverages, Tobacco and Medical Products
Product safety 2008 2009 2010 2011 Overall total Number of items seized 9,438,743 30,811,540 48,888,369 27,774,630 116,913,282 Number of seizures 1,132 2,190 1,920 2,671 7,913 Average size of seizures 8,338 14,069 25,463 10,399 14,775 Source: IPERICO (DGLC-UIBM)
July 2012 - 30
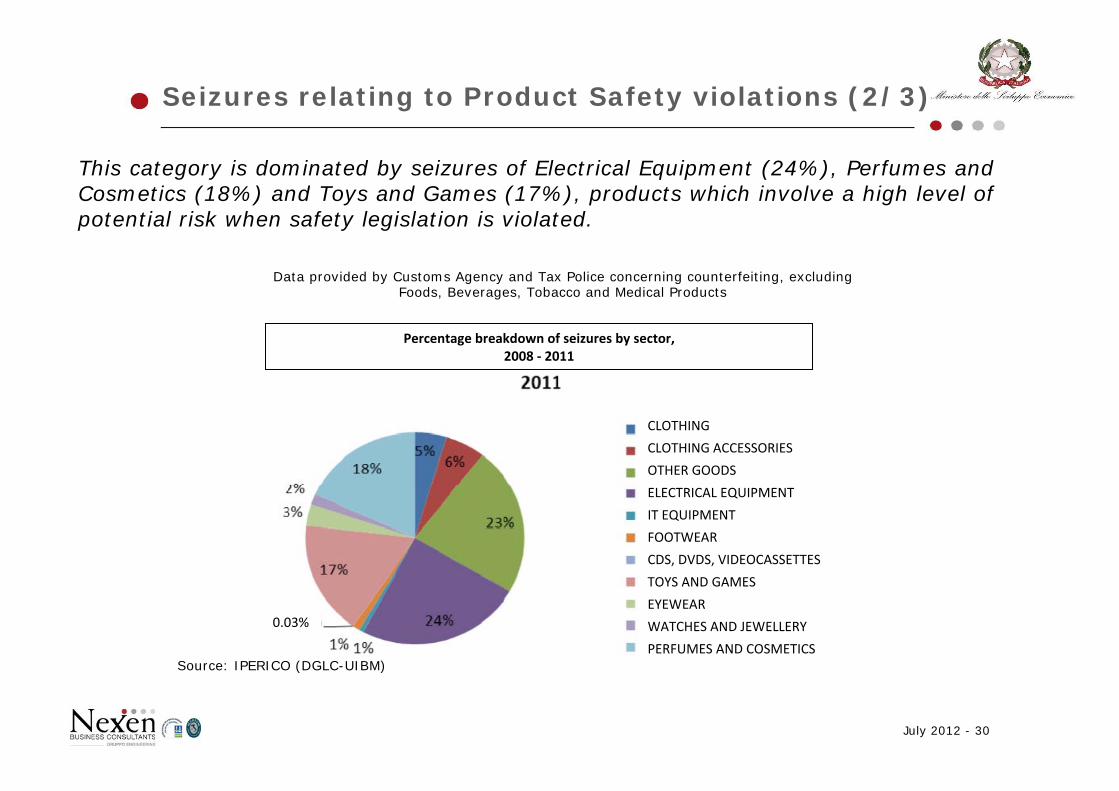
Seizures relating to Product Safety violations (2/3)
This category is dominated by seizures of Electrical Equipment (24%), Perfumes and Cosmetics (18%) and Toys and Games (17%), products which involve a high level of potential risk when safety legislation is violated.
Data provided by Customs Agency and Tax Police concerning counterfeiting, excluding Foods, Beverages, Tobacco and Medical Products
Source: IPERICO (DGLC-UIBM)
Percentage breakdown of seizures by sector, 2008 ‐ 2011
CLOTHING CLOTHING ACCESSORIES OTHER GOODS ELECTRICAL EQUIPMENT IT EQUIPMENT FOOTWEAR CDS, DVDS, VIDEOCASSETTES TOYS AND GAMES EYEWEAR WATCHES AND JEWELLERY PERFUMES AND COSMETICS
0.03%

July 2012 - 31
Seizures relating to Product Safety violations (3/3)
An analysis of the geographical distribution of this category of seizures over the four years in question highlights a rather erratic trend, with figures varying widely from year to year. Veneto, Apulia, Tuscany and Campania are the regions in which the most seizures of products contravening safety legislation were carried out, although in some cases certain operations made a decisive contribution to the results (such as in the case of the 2010 figure for Puglia, or the 2011 figure for Veneto).
Data provided by Customs Agency and Tax Police concerning counterfeiting, excluding Foods, Beverages, Tobacco and Medical Products
Source: IPERICO (DGLC-UIBM)
Number of seizures relating to Product Safety violations, 2008 ‐ 2011
Num
ber
ABRU
ZZO
BASILICA
TA
CALABR
IA
CAMPA
NIA
EMILIA ROMAG
NA
FRIULI
LAZIO
LIGURIA
LOMBA
RDY
MAR
CHE
MOLISE
PIED
MONT
APULIA
SARD
INIA
SICILY
TUSCAN
Y
TREN
TINO
UMBR
IA
AOSTA VA
LLEY
VENETO

July 2012 - 32
Economic value of seizures
Establishing the value of seized goods is a complex operation.
In order to make such an estimate, the Customs Agency applies the most stable, commonly shared procedures, providing, in the event of seizures of counterfeit goods, a market value for the goods, estimated according to the quality of the counterfeiting and the response with which they would have been met on the market.
Nevertheless, such a strategy is not sufficient to provide an economic estimate for the phenomenon in its entirety; a “precise” estimated value is not available for all of the seizures carried out by the Customs Agency itself, and obviously is not for the other Agencies either.
The IPERICO procedure for estimating the value of seized goods
The values of seized goods estimated by the Customs Agency are used where available; from this subset, by dividing the sum of the value of seized goods by the sum of the number of items seized, an average unit value is obtained, broken down by product category. For more reliable results, the four-year period from 2007 to 2010 has been taken as the period of reference.

July 2012 - 33
Estimation of economic value of goods by product category
The following table shows the estimated amounts based on the procedure described as average unit values of goods seized in the various sectors (calculated with reference to the four-year period 2007-2010), once again excluding the categories of Foods, Beverages, Tobacco and Medical Products. These values are also used in calculating the value for 2011, so that the various years can be compared.
Product category Average value Clothing € 10.54Clothing accessories € 19.24Other goods € 1.67Electrical equipment € 13.28IT equipment € 2.12Footwear € 23.22CDs, DVDs, videocassettes € 3.12Toys and games € 1.43Eyewear € 7.20Watches and jewellery € 10.08Perfumes and cosmetics € 19.02
Source: Nexen Business Consultants and DGLC-UIBM

July 2012 - 34
Value of seizures (1/2)
The total estimated value of goods seized over the four-year period is found to be over 2.2 billion euros. A breakdown by year shows a significant peak in the value for 2009, against a sharp upward trend in the number of items seized between 2008 and 2009, yet without any sizeable contraction between 2009 and 2011.
Data provided by Customs Agency and Tax Police concerning Counterfeiting, excluding Foods, Beverages, Tobacco and Medical Products
Economic value of seizures 2008 2009 2010 2011 Overall total CLOTHING 124,755,283 134,406,134 134,700,501 65,539,715 459,401,632 CLOTHING ACCESSORIES 158,867,590 576,842,393 95,714,009 175,379,282 1,006,803,274 OTHER GOODS 17,522,757 10,238,558 44,812,920 38,875,530 111,449,764 ELECTRICAL EQUIPMENT 21,636,050 15,907,749 9,053,976 44,425,802 91,023,577 IT EQUIPMENT 160,314 172,242 387,742 591,417 1,311,715 FOOTWEAR 128,400,490 96,208,909 41,971,369 31,226,151 297,806,919 CDS, DVDS, VIDEOCASSETTES 866,520 908,390 4,150,335 634,850 6,560,094 TOYS AND GAMES 2,146,548 16,153,548 14,896,696 7,141,915 40,338,706 EYEWEAR 9,991,098 5,034,577 3,908,179 27,377,067 46,310,921 WATCHES AND JEWELLERY 4,105,433 3,292,331 13,676,680 8,997,423 30,071,867 PERFUMES AND COSMETICS 12,595,206 23,809,661 59,133,329 19,417,659 114,955,855 Overall total 481,047,288 882,974,492 422,405,735 419,606,809 2,206,034,324
Source: Nexen Business Consultants and DGLC-UIBM

July 2012 - 35
Value of seizures (2/2)
Seizures of Clothing Accessories, Clothing and Footwear account for the highest overall values over the four years: over 1 billion, over 450 million and almost 300 million euros respectively.
Data provided by Customs Agency and Tax Police concerning counterfeiting, excluding Foods, Beverages, Tobacco and Medical Products
Source: Nexen Business Consultants and DGLC-UIBM
CLOTHING
CLOTHING ACCESSORIES
OTHER GOODS
ELECTRICAL EQUIPMENT
IT EQUIPMENT
FOOTWEAR
CDS, DVDS, VIDEOCASSETTES
TOYS AND GAMES
EYEWEAR
WATCHES AND JEWELLLERY
PERFUMES AND COSMETICS
Breakdown of overall value in percentage terms, 2008 ‐ 2011
0.06%
0.30%

July 2012 - 36
La Toscana, con circa
Value of seizures by Region
Calculation of the overall estimated value by region for 2008-2011, shown in the graph, sees Lombardy in first place (with an estimated value of seized goods of over 500 million euros), followed by Lazio (almost 492 million) and Campania (just under 393 million). Tuscany, with around 188 million, ranks fourth, yet a long way behind the first three.
Data provided by Customs Agency and Tax Police concerning Counterfeiting, excluding Foods, Beverages, Tobacco and Medical Products
Source: Nexen Business Consultants and DGLC-UIBM
ABRU
ZZO
BASILICA
TA
CALABR
IA
CAMPA
NIA
EMILIA ROMAG
NA
FRIULI
LAZIO
LIGURIA
LOMBA
RDY
MAR
CHE
MOLISE
PIED
MONT
PUGLIA
SARD
INIA
SICIILY
TUSCAN
Y
TREN
TINO
UMBR
IA
AOSTA VA
LLEY
VENETO
Economic value of seizures by Region
Thou
sand
s

July 2012 - 37
Index
Introduction
Part One – Anti-counterfeiting figures, 2008-2010
Part Two – External indicators
Part Three – Anti-counterfeiting activities

July 2012 - 38
“External” indicators
The following slides show a number of indicators which are defined as “external” as they relate the data contained in IPERICO to general phenomena that can improve the interpretability of available data.
The analysis exclusively regards violations of anti-counterfeiting legislation.
Reference will be made in particular to ISTAT (National Institute of Statistics) sources:
• data typical of the phenomenon analysed (violations reported by the police to the judicial authorities);
• demographic data (population);
• macroeconomic data (consumption, income, imports, exports).
The purpose is to verify the correlation and any interdependence between changes in the phenomenon and exogenous variables selected and deemed relevant on a case-by-case basis.
Similarly, the analysis makes it possible to filter out any potential effects on data regarding seizures deriving from other variables such as population or income.

July 2012 - 39
Violations reported by Police to Judicial Authorities (1/2)
During the period of reference 2008-2011
Key 0 500
Lazio (1,470) and Campania (1,076) recorded, on average, the most reports of counterfeiting violations, followed by Apulia (598) and Veneto (509).
501 1000
1001 1500
Source: Nexen Business Consultants, based on Istat data

July 2012 - 40
Violations reported by Police to Judicial Authorities (2/2)
Average annual number of seizures, 2008-2011 (ratio between)
Average annual number of violations reported, 2009-2010¹
The denominator value is a measure of the propensity to counterfeit. Regions with high ratios have more intensive – and in a certain sense more efficient – anti-counterfeiting operations. Abruzzo, Sardinia and Aosta Valley are characterised by significantly above-average values.
Counterfeiting seizures (Tax Police and Customs)
Source: Nexen Business Consultants, based on Istat data ¹ Violations of anti-counterfeiting legislation are reported by the National Police, Carabinieri, Tax Police, National Forest Rangers and the Prison Service. Data are only available for the 2009-2010 period.
PIED
MO
NT
AO
STA
VALL
EY
LOM
BARD
Y
TREN
TIN
O A
LTO
AD
IDE
VEN
ETO
FRIU
LI V
ENEZ
IA
GIU
LIA
LIG
URIA
EMIL
IA
RO
MAG
NA
TUSCAN
Y
UM
BRIA
MARCH
E
LAZIO
ABRU
ZZO
MO
LISE
CAM
PAN
IA
APU
LIA
BASIL
ICATA
CALA
BRIA
SIC
ILY
SARD
INIA
Average of seizures / number of crimes reported

July 2012 - 41
Number of items seized and population (1/2)
Average annual number of items seized, 2008-2011 (ratio between)
Average population, 2008-2011
The indicator represents the number of items seized per capita of population. An analysis of the indicator makes it possible to filter out from anti-counterfeiting figures any potential possible effects deriving from the size of the region in question. Lazio, which is already first in terms of number of items, remains in first place compared with other regions (with 2.4 items per capita). It is followed by Liguria, Campania, Calabria and Tuscany with 2.06, 1.71, 1.31 and 1.09 counterfeit items seized per capita.
Counterfeiting seizures (Tax Police and Customs)
Source: Istat - IPERICO - Nexen Business Consultants
Seizures per capita / Population
PIED
MO
NT
AO
STA
VALL
EY
LOM
BARD
Y
TREN
TIN
O A
LTO
AD
IDE
VEN
ETO
FRIU
LI V
ENEZ
IA
GIU
LIA
LIG
URIA
EMIL
IA R
OM
AG
NA
TUSCAN
Y
UM
BRIA
MARCH
E
LAZIO
ABRU
ZZO
MO
LISE
CAM
PAN
IA
APU
LIA
BASIL
ICATA
CALA
BRIA
SIC
ILY
SARD
INIA

July 2012 - 42
Number of items seized and population (2/2) The indicator can be interpreted as follows:
• where the number of items seized is much higher than the population, we are dealing with a region with a large potential market for counterfeit goods or a region through which counterfeit goods transit (e.g. Lazio, Liguria and Campania);
• if the number of items seized is lower than the population, the region in question may be characterised by low consumption of counterfeit goods (e.g. Molise, Umbria and Basilicata).
Naturally, in order to be relevant these figures must be supplemented by other measurements and/or indicators (e.g. type of items seized, consumption, imports and exports), as we shall see in the following slides.

July 2012 - 43
Value of non-food seizures and consumption
Average annual value of seizures, 2008-2011 (ratio between)
Average annual consumption per capita, 2008-2011 It may be supposed that seizures, as a proxy measure for counterfeiting activities, depend on the volume of local demand in the market of reference, measured by means of consumption per capita. The indicator shows that some regions stand out from others by virtue of a very high estimated value of seizures in relation to demand: Campania, Lazio, Lombardy and Tuscany.
Counterfeiting seizures (Tax Police and Customs)
Source: Nexen Business Consultants, based on Istat – IPERICO data
PIED
MO
NT
AO
STA
VALL
EY
LOM
BARD
Y
TREN
TIN
O A
LTO
AD
IDE
VEN
ETO
FRIU
LI V
ENEZ
IA
GIU
LIA
LIG
URIA
EMIL
IA R
OM
AG
NA
TUSCAN
Y
UM
BRIA
MARCH
E
LAZIO
ABRU
ZZO
MO
LISE
CAM
PAN
IA
PUG
LIA
BASIL
ICATA
CALA
BRIA
SIC
ILY
SARD
INIA
Value of seizures/Consumption per capita

July 2012 - 44
Value of seizures and foreign trade movements
Average annual value of seizures, 2008-2011 (ratio between)
Average annual imports/exports, 2008-2011
A high ratio between the value of seizures and the value of foreign trade movements may indicate that counterfeiting activities are greater than the region’s dynamism in terms of foreign trade. The value of this indicator is high in Campania, Lazio and Calabria, suggesting that in these regions a relatively high percentage of imports and exports may involve counterfeit goods
Counterfeiting seizures (Tax Police and Customs) Source: Nexen Business Consultants, based on Istat – IPERICO data
Value of seizures/Foreign trade
PI
EDM
ON
T
AO
STA
VALL
EY
LOM
BARD
Y
TREN
TIN
O A
LTO
AD
IDE
VEN
ETO
FRIU
LI V
ENEZ
IA
GIU
LIA
LIG
URIA
EMIL
IA
RO
MAG
NA
TUSCAN
Y
UM
BRIA
MARCH
E
LAZIO
ABRU
ZZO
MO
LISE
CAM
PAN
IA
APU
LIA
BASIL
ICATA
CALA
BRIA
SIC
ILY
SARD
INIA

Value of seizures and income per capita
Average annual value of seizures, 2008-2011 (ratio between)
Average annual income per capita, 2008-2011 The ratio between the value of seizures and income per capita confirms once again the particular importance of anti-counterfeiting activities in certain regions, as already highlighted by other indicators. Campania, Lazio and Lombardy, in that order, record very high values for this indicator, and are followed, albeit at some distance, by Apulia, Tuscany and Calabria.
Counterfeiting seizures (Tax Police and Customs)
Source: Nexen Business Consultants, based on Istat – IPERICO data
July 2012 - 45
PIED
MO
NT
AO
STA
VALL
EY
LOM
BARD
Y
TREN
TIN
O A
LTO
AD
IDE
VEN
ETO
FRIU
LI V
ENEZ
IA
GIU
LIA
LIG
URIA
EMIL
IA
RO
MAG
NA
TUSCAN
Y
UM
BRIA
MARCH
E
LAZIO
ABRU
ZZO
MO
LISE
CAM
PAN
IA
APU
LIA
BASIL
ICATA
CALA
BRIA
SIC
ILY
SARD
INIA
Value of seizures/Income per capita

July 2012 - 46
An evaluation of the indicators
An analysis of the indicators shows how regional variability in volumes of anti-counterfeiting activity cannot be explained simply by the dynamics of the phenomenon of counterfeiting alone, thus bringing the specific aspects of certain regions into view. It thus emerges from an initial analysis that Campania, Lazio and Lombardy and, to a lesser extent, Tuscany, Apulia and Calabria, appear to be Regions potentially with high consumption levels for counterfeit goods and/or regions for the transit of such goods.
It should be borne in mind that in terms of absolute values Lombardy and Lazio, followed by Campania, have the highest value of seizures in comparison with other regions.
What follows is a more detailed cross-analysis of a number of indicators/measures which are deemed of particular interest in order to understand the relation between counterfeiting and activities to combat it.

Relation between “Value of seizures/Consumption” and “Items seized/Population”
The two indicators may be considered proxy measures of the propensity to consume counterfeit items and of the volume of anti-counterfeiting activity. The matrix representation shows how Lazio and Campania are characterised by high values for both indicators. Lombardy, by way of contrast, exhibits a high propensity combined with a low volume of seizures in proportion to the population. At the opposite end of the scale is Liguria, where the volume is high but the propensity to consume counterfeit goods is very low.
Propensity to consume counterfeit goods
LOMBARDY
CAMPANIA
LAZIO
LIGURIA
Source: Nexen Business Consultants, based on DGLC-UIBM and Istat data Volume of anti-counterfeiting activities
July 2012 - 47
PIEDMONTE AOSTA VALLEY LOMBARDY TRENTINO ALTO ADIDE
VENETO FRIULI VENEZIA GIULIA
LIGURIA EMILIA ROMAGNA TUSCANY
UMBRIA MARCHE LAZIO ABRUZZO MOLISE CAMPANIA PUGLIA BASILICATA CALABRIA SICILY SARDINIA Items seized/Population
Val
ue
of s
eizu
res/
Con
sum
pti
on

Ratio between “Value of Seizures” and “Number of Seizures”
The two measurements compared confirm that Campania, Lazio and Lombardy are regions with high levels of potential consumption and/or transit of counterfeit goods both in terms of the value of seizures in the period under consideration.
LOMBARDY LAZIO CAMPANIA
TUSCANY
In contrast, the ratio between the two measurements shows that Trentino Alto Adige and to a lesser extent Lombardy and Friuli Venezia Giulia have a very high value of seizures in relation to the number of seizures, highlighting the possibility of trade and/or transit of high-value counterfeit goods.
Source: Nexen Business Consultants, based on DGLC-UIBM and Istat data
July 2012 - 48
PIED
MO
NT
AO
STA V
ALL
EY
LOM
BAR
DY
TREN
TIN
O A
LTO
AD
IGE
VEN
ETO
FR
IULI
VEN
EZIA
G
IULI
A
LIG
URIA
EM
ILIA
RO
MAG
NA
TUSCAN
Y U
MBRIA
M
ARCH
E LA
ZIO
ABRU
ZZO
M
OLI
SE
CAM
PAN
IA
APU
LIA
BASIL
ICAT
A CALA
BRIA
SIC
ILY
SARD
INIA
PIED
MO
NT
AO
STA V
ALL
EY
LOM
BAR
DY
TREN
TIN
O A
LTO
AD
IGE
VEN
ETO
FR
IULI
VEN
EZIA
G
IULI
A
LIG
URIA
EM
ILIA
RO
MAG
NA
TUSCAN
Y
UM
BRIA
MARCH
E LA
ZIO
ABRU
ZZO
MO
LISE
CAM
PAN
IA
APU
LIA
BASIL
ICAT
A
CALA
BRIA
SIC
ILY
SARD
INIA
Value of seizures/Number of seizures (2008-2011)
Average value of seizures, 2008-2011 Average seizures, 2008-2011

July 2012 - 49
Index
Introduction
Part One – Anti-counterfeiting figures, 2008-2010
Part Two – External indicators
Part Three – Anti-counterfeiting activities

July 2012 - 50
Anti-counterfeiting activities: Tax Police (1/7)
The Italian Tax Police is, by law, the Police Force which specialises preventing and suppressing all criminal offences of an economic and financial nature. The Agency’s commitment to combating the “market in fake goods”, not only from the criminal perspective but also from the perspective of taxation, social security contributions and consumer safety, can be summarised under the following areas of activity:
a) prevention, identification and suppression – from both an administrative law and criminal law viewpoint – of violations of legislation governing the sector;
b) information and operational collaboration and international police cooperation.
In order to perform the institutional tasks assigned to it, the Tax Police is organised into the following units:
• General Command; • Special Departments; • Local Branches.

July 2012 - 51
Anti-counterfeiting activities: Tax Police (2/7)
National level Regional level Sectoral level
During the four-year period considered by this report, the Tax Police carried out over 93,000 seizures, a total of 401 million items, half of which regarded counterfeiting violations.
Data provided by Tax Police concerning counterfeiting, excluding Foods, Beverages, Tobacco and Medical Products
Number of seizures 2008 2009 2010 2011 Overall total COUNTERFEITING 16,453 16,140 16,184 13,138 61,915 “MADE IN ITALY” VIOLATIONS
905 835 925 640 3,305
PIRACY 7,905 6,216 3,980 3,129 21,230 PRODUCT SAFETY VIOLATIONS
997 2,042 1,802 2,586 7,427
Overall total 26,260 25,233 22,891 19,493 93,877
Source: IPERICO (DGLC-UIBM)

July 2012 - 52
Anti-counterfeiting activities: Tax Police (3/7)
National level Regional level Sectoral level
A slightly different picture is obtained by examining the figures for numbers of products seized, which, by nature, are much more random.
Data provided by Tax Police concerning counterfeiting, excluding Foods, Beverages, Tobacco and Medical Products
Number of items seized 2008 2009 2010 2011 Overall total COUNTERFEITING 40,231,023 66,396,729 60,743,425 52,401,932 219,773,109 “MADE IN ITALY” VIOLATIONS
16,557,159 12,224,118 6,043,136 3,908,203 38,732,616
PIRACY 28,754,053 4,116,592 3,636,818 2,381,204 38,888,667 PRODUCT SAFETY VIOLATIONS
9,307,191 29,975,095 40,008,206 24,898,821 104,189,313
Overall total 94,849,426 112,712,534 110,431,585 83,590,160 401,583,705
Source: IPERICO (DGLC-UIBM)

July 2012 - 53
Anti-counterfeiting activities: Tax Police (4/7)
National level Regional level Sectoral level
If the average size of seizures is analysed, different values are found, depending on the type of offence to which reference is made. Seizures of counterfeit products or products which violate copyright laws are in fact fairly small on average, with an average number of around 2,000 items. Seizures regarding the other two types of offence analysed were larger, with quantities seized ranging between 11,000 and 13,000 items.
Data provided by Tax Police excluding Foods, Beverages, Tobacco and Medical Products
Source: IPERICO (DGLC-UIBM)
Average size of seizures by type of violation
COUNTERFEITING MADE IN ITALY PIRACY PRODUCT SAFETY

July 2012 - 54
Anti-counterfeiting activities: Tax Police (5/7)
National level Regional level Sectoral level
During 2008-2011, the largest number of operations recorded by the Tax Police was in Lazio (approximately 14,000) and Campania (over 8,000). This result was confirmed in the 2011 figure alone, the year in which the two regions mentioned above were joined by Apulia, the third region in terms of seizures, with 6,803 operations.
Data provided by Tax Police concerning Counterfeiting, excluding Foods, Beverages, Tobacco and Medical Products
Source: IPERICO (DGLC-UIBM)
ABRU
ZZO
BASILICA
TA
CALABR
IA
CAMPA
NIA
EMILIA
ROMAG
NA
FRIULI
LAZIO
LIGURIA
LOMBA
RDY
MAR
CHE
MOLISE
PIED
MONT
APULIA
SARD
INIA
SICILY
TUSCAN
Y
TREN
TINO
UMBR
IA
AOSTA VA
LLEY
VENETO
Average size of seizures by type of violation

July 2012 - 55
Anti-counterfeiting activities: Tax Police (6/7)
National level Regional level Sectoral level
The Italian Tax Police carry out most of the seizures relating to Clothing and Clothing Accessories. Indeed, these two categories alone account for over 50% of the total.
Data provided by Tax Police concerning counterfeiting, excluding Foods, Beverages,
Tobacco and Medical Products
Source: IPERICO (DGLC-UIBM)
Percentage breakdown of number of seizures of counterfeit goods by sector
CLOTHING
CLOTHING ACCESSORIES
OTHER GOODS
ELECTRICAL EQUIPMENT
IT EQUIPMENT
FOOTWEAR
CDS, DVDS, VIDEOCASSETTES
TOYS AND GAMES
EYEWEAR
WATCHES AND JEWLLERY
PERFUMES AND COSMETICS

July 2012 - 56
Anti-counterfeiting activities: Tax Police (7/7) Tobaccos
Between 2008 and 2011 the Italian Tax Police seized 148,653 kg of counterfeit tobacco products. The year-to-year trend was significantly upwards between 2008 and 2010, with a peak in 2010, before settling down markedly in 2011. Almost 60% of tobaccos were seized in the Calabria and Marche regions, while large quantities were also seized in Sardinia and Tuscany.
Source: IPERICO (DGLC-UIBM)
Quantity (kg) 2008 2009 2010 2011 Overall total
Abruzzo L’Aquila ‐
Basilicata Potenza ‐
Calabria Catanzaro 2 10 53,950 3 53,965
Campania Naples 4,948 4,948
Emilia Romagna Bologna 17 17
Friuli V.G. Trieste ‐
Lazio Rome 1 1
Liguria Genoa 700 8,490 9,190
Lombardy Milan 5,850 23 5,873
Marche Ancona 2,550 29,265 31,815
Molise Campobasso ‐
Piedmont Turin ‐
Puglia Bari 2 2
Sardinia Cagliari 18,240 18,240
Sicily Palermo 1 10 11
Tuscany Florence 20,340 20,340
Trentino A.A. Trento ‐
Umbria Perugia ‐
Aosta Valley Aosta ‐
Veneto Venice 4,251 4,251
Overall total 18,942 28,841 62,361 38,509 148,653

July 2012 - 57
Anti-counterfeiting activities: Customs Agency (1/11)
National level Regional level Sectoral level
The Italian Customs Agency is a non-profit public agency which operates with a central facility and a regional facility. It performs functions and duties with regard to customs, movement of goods and domestic taxation in connection with international trade. It also performs duties in connection with excise duties applied to domestic production and consumption.
In the non-tax-related sector the Agency monitors goods arriving at customs in order to ensure that they are legal, safe and genuine as provided for by EU and national legislation. In this context it performs an important role in analysing and countering the movement of goods which breach intellectual property rights, using instruments provided by EU and national legislation. The Central Anti-fraud Department handles applications for copyright protection and deals with cooperation between the Customs Agency and firms.

July 2012 - 58
Anti-counterfeiting activities: Customs Agency (2/11) Number of seizures by type of violation
National level Regional level Sectoral level
Between 2008 and 2011 the Italian Customs Agency carried out over 17,000 seizures, the vast majority of which (14,000) regarded counterfeiting offences.
Data provided by Customs Agency, excluding Foods,
Beverages, Tobacco and Medical Products
Number of seizures 2008 2009 2010 2011 Overall total COUNTERFEITING 2,676 5,170 3,205 3,314 14,365 “MADE IN ITALY” VIOLATIONS
478 434 236 254 1,402
PRODUCT SAFETY VIOLATIONS
441 404 311 182 1,338
Overall total 3,595 6,008 3,752 3,750 17,105
Source: IPERICO (DGLC-UIBM)
Analysing the year-to-year trend it may be noted that 2009 in particular made a decisive contribution to this high figure, with almost one third of seizures of this type.

July 2012 - 59
Anti-counterfeiting activities: Customs Agency (3/11)
National level Regional level Sectoral level
During the period under consideration, the contribution made by seizures for Product Safety violations, although not exactly comparable with those for counterfeit goods and “Made in Italy” violations, is nonetheless fairly high.
Data provided by Customs Agency,
concerning Counterfeiting, Made in Italy and Product Safety excluding Foods, Beverages, Tobacco and Medical Products
Source: IPERICO (DGLC-UIBM)
Percentage breakdown of number of products seized by type of violation, 2008‐2011
COUNTEFEITING
MADE IN ITALY
PRODUCT SAFETY

July 2012 - 60
Anti-counterfeiting activities: Customs Agency (4/11)
National level Regional level Sectoral level
An analysis of the average size of seizures shows different figures depending of the type of violation concerned. Seizures of counterfeit products were quite small, with an average number of around 2,000 items. Seizures relating to Product Safety and “Made in Italy” violations were larger, with quantities seized averaging between 13,000 and 20,000 items.
Data provided by Customs Agency, excluding Foods, Beverages, Tobacco and Medical Products
Source: IPERICO (DGLC-UIBM)
COUNTERFEITING MADE IN ITALY PRODUCT SAFETY
Average size of seizures by type of violation
Num
ber

Anti-counterfeiting activities: Customs Agency (5/11)
National level Regional level Sectoral level Lombardy is the region in which the largest number of seizures for counterfeiting were conducted (7,517), followed at some distance by Lazio (3,125). Over 74% of seizures carried out by the Customs Agency during the four years in question were concentrated in these regions.
Data provided by Customs Agency, concerning Counterfeiting excluding Food, Beverages, Tobacco and Medical Products
Source: IPERICO (DGLC-UIBM) July 2012 - 61
ABRU
ZZO
CALABR
IA
CAMPA
NIA
EMILIA ROMAG
NA
FRIULI
LAZIO
LIGURIA
LOMBA
RDY
MAR
CHE
PIED
MONT
APULIA
SARD
INIA
SICILY
TUSCAN
Y
UMBR
IA
VENETO
Number of seizures by Region
Num
ber

July 2012 - 62
Anti-counterfeiting activities: Customs Agency (6/11)
National level Regional level Sectoral level
It is interesting to note that the weight of the different regions changes radically if we move on to an analysis of the number of items seized, even though the year-to-year trend is erratic.
Data provided by Customs Agency,
excluding Food, Beverages, Tobacco and Medical Products
Source: IPERICO (DGLC-UIBM)
Number of items seized by Region
Thou
sand
s
ABRU
ZZO
CALABR
IA
CAMPA
NIA
EMILIA ROMAG
NA
FRIULI
LAZIO
LIGURIA
LOMBA
RDY
MAR
CHE
PIED
MONT
APULIA
SARD
INIA
SICILY
TUSCAN
Y
UMBR
IA
VENETO

Anti-counterfeiting activities: Customs Agency (7/11)
National level Regional level Sectoral level
In terms of numbers of items, seizures in Lombardy were small compared with the average in other regions, while the largest average size in terms of numbers of items seized per operation was recorded in Sardinia (with the exception of Umbria which exhibits an anomalous trend).
Data provided by Customs Agency,
concerning Counterfeiting excluding Food, Beverages, Tobacco and Medical Products Average size of seizures 2008 2009 2010 2011 Overall total ABRUZZO 71 231 81CALABRIA 23,354 4,313 17,897 7,719 10,833CAMPANIA 12,657 13,239 37,564 3,697 19,391EMILIA ROMAGNA 824 270 225 44 225FRIULI 17,047 3,131 4,149 11,436 9,024LAZIO 276 180 1,608 1,382 816LIGURIA 4,255 16,728 11,277 4,215 10,968LOMBARDY 295 54 126 61 113MARCHE 7,369 1,179 1,903 3,785 2,316PIEDMONT 1,049 3 48 2,561 696APULIA 2,154 4,173 46,174 15,057 9,093SARDINIA 64,397 57,114 13,211 132 45,084SICILY 5,016 1,629 465 118 1,692TUSCANY 49,268 10,768 15,922 2,107 17,445UMBRIA ‐ ‐ ‐ 78,003 78,003VENETO 1,056 1,343 1,618 890 1,267Overall total 2,338 2,125 4,019 1,049 2,339
Source: IPERICO (DGLC-UIBM) July 2012 - 63

Anti-counterfeiting activities: Customs Agency (8/11)
National level Regional level Sectoral level
The Customs Agency figures show completely distinct characteristics compared with the other agencies, in particular with regard to results achieved in 2009. The largest number of seizures during the period were of Footwear (3,249 operations during the four years in question), Clothing (3,125 seizures), Watches and Jewellery (2,738 seizures) and Clothing Accessories (2,144 seizures). Nonetheless, in 2011 a decrease in the number of seizures was seen, with the exception of Watches and Jewellery.
Data provided by Customs Agency,
concerning Counterfeiting excluding Food, Beverages, Tobacco and Medical Products
Source: IPERICO (DGLC-UIBM) July 2012 - 64
Number of seizures by product sector
CLOTH
ING
CLOTH
ING
ACCE
SSORIES
OTH
ER GOODS
ELEC
TRICAL
EQ
UIPMEN
T
IT EQUIPMEN
T
FOOTW
EAR
CDS, DVD
S,
VIDE
OCA
SSETTES
TOYS AND GAM
ES
EYEW
EAR
WAT
CHES AND
JEWELLERY
PERFUMES AND
COSM
ETICS

Anti-counterfeiting activities: Customs Agency (9/11) Number of seizures
National level Regional level Sectoral level Summing up, in absolute terms the Italian Customs Agency carried out most of the seizure operations in the following sectors:
• Footwear
• Clothing
• Watches and Jewellery
• Clothing Accessories
In terms of percentage changes in the number of seizures between 2008 and 2011, a vertical increase is evident for Watches and Jewellery (+502%), Computer Equipment (+410%), Perfumes and Cosmetics (+200%) and Electrical Equipment (+119%).
Once again in percentage terms, a reversal in the trend in the number of seizures of Footwear can be noted (-68.9%) while the number of CDs, DVDs and Videocassettes seized fell (-66.7%), while remaining at a much lower level than other product sectors in terms of numbers of seizures.
July 2012 - 65

July 2012 - 66
Anti-counterfeiting activities: Customs Agency (10/11) Tobacco products
During the four years a total of 25 seizures relating to counterfeiting were carried out, with a total of 119,238 kg. The year-to-year trend shows a pronounced decrease through to 2010, followed by a substantial upturn in 2011: the number of kilograms seized fell from 55,639 kg in 2008 to 4,385 in 2010, with an intermediate figure of 33,746 kg in 2009, before increasing once more to 25,477 kg in 2011.
Seizures of Tobaccos by Customs Agency during the four years from 2008 to 2011 Number of seizures 2008 2009 2010 2011 Overall total
CALABRIA 3 5 8 CAMPANIA 1 1 LIGURIA 1 1 2 LOMBARDY 1 1 MARCHE 3 5 8 PUGLIA 3 3 SARDINIA 1 1 VENETO 1 1 Overall total 7 9 4 5 25
Source: IPERICO (DGLC-UIBM)

July 2012 - 67
Anti-counterfeiting activities: Customs Agency (11/11) Tobacco products
Finally, an analysis of the regional distribution shows that in 2008 and 2009 the activity was concentrated in the southern regions (Calabria, Campania and Apulia), with significant numbers for Liguria (700 kg in 2008) and Sardinia (18,240 kg, also in 2008) too. In 2010 seizures were carried out only in Lombardy and Marche, albeit with very low numbers, while in 2011 Marche was the only region where seizures of tobaccos took place.
Kilograms of tobacco products seized by the Customs Agency during the four years from 2008-2011
Quantity (kg) 2008 2009 2010 2011 Overall total CALABRIA 24,760 15,010 39,770 CAMPANIA 7,830 7,830 LIGURIA 700 8,490 9,190 LOMBARDY 9 9 MARCHE 4,376 25,477 29,853 PUGLIA 10,246 10,246 SARDINIA 18,240 18,240 VENETO 4,100 4,100 Overall total 55,630 33,746 4,385 25,477 119,238
Source: IPERICO (DGLC-UIBM)

July 2012 - 68
Destination provinces for counterfeit goods seized by the Customs Agency (1/3)
As of 2010, the Customs Agency also publishes information regarding the destination province for the goods seized, which in many cases may not be the same as the province in which the seizure took place.
This information will now be analysed with the difference between the number of items bound for each province and the number of items seized in each province.
A positive difference means that the region attracts counterfeit goods, while a negative difference means that it has a capacity for handling or producing goods bound for other provinces.
The following slides identify the provinces which record significant values for this indicator both at the aggregate level for the two years 2010 and 2011 and separately for both years.
Source: IPERICO (DGLC-UIBM)

Source: IPERICO (DGLC-July 2012 - 69
Province
Destination provinces for counterfeit goods seized by the Customs Agency (2/3)
Provinces with largest capacity for Handling or Producing counterfeit goods, according to
aggregate 2010-2011 data
Provinces with largest capacity for Attracting counterfeit goods, according to aggregate 2010-2011 data
(*) NB: in 2010 the Customs Agency recorded data for Gioia Tauro separately, given the importance of its port; in the table these seizures have been aggregated with those recorded in the province of Reggio Calabria.
Position PROVINCE
Position
Aggregate Attraction Index 2010‐2011
Aggregate Production Index 2010‐2011 PROVINCE

July 2012 - 70
(*)
Destination provinces for counterfeit goods seized by the Customs Agency (3/3)
The following graph summarises the attraction/production factor for the main provinces in numerical terms, for 2010 and 2011 separately. Some significant differences between the two years may be noted (for example Rome, Verona, Naples and Ancona).
Attraction (positive value)
Production (negative value) Source: IPERICO (DGLC-UIBM) (*) NB: in 2010 the Customs Agency recorded data for Gioia Tauro separately, given the importance of its port; in the table these seizures have been aggregated with those recorded in the province of Reggio Calabria.
Provinces according to attraction/production factors, 2010‐2011

July 2012 - 71
Anti-counterfeiting activities: Police (1/3) (Carabinieri, National Police, Local Police)
Criminal Analysis Service
The Criminal Analysis Service, a multi-agency police intergroup, as part of the Central Directorate of the Criminal Police at the Department of Public Security is the institutional hub for coordinating criminal intelligence and strategic analysis of criminal phenomena.
CO.AB Form
Since 1997 a “Multi-agency Anti-Counterfeiting Desk” has been in operation at the Criminal Analysis Service, with the main task of developing a form for collecting statistical data regarding the results of the fight against counterfeiting which is uniform for all intergroup police forces. The Anti-Counterfeiting Desk has made it possible to develop a single form for statistical returns – called CO.AB. – for reporting data regarding seized goods divided according to product category, the number of violations of criminal or administrative law reported, and finally the number of operations conducted by the Criminal Investigations Department.

Source: IPERICO (DGLC-UIBM) July 2012 - 72
Anti-counterfeiting activities: police (2/3) (Carabinieri, National Police, Local Police)
National level Regional level Sectoral level
In the period under analysis, the Carabinieri, National Police and Local Police seized approximately 6.7 million items. Most of these were seized by the Carabinieri (50%), while seizures of goods carried out by the National and Local Police accounted for the remaining 28% and 22% respectively.
CARABINIERI
LOCAL POLICE
NATIONAL POLICE
Number of items of counterfeit goods seized
Thou
sand
s

July 2012 - 73
Anti-counterfeiting activities: police (3/3) (Carabinieri, National Police, Local Police)
National level Regional level Sectoral level
An analysis of data provided by the Carabinieri and the National Police at the regional level confirms the general reduction in seizures during the four years in question, with few exceptions; 50% of all goods seized by the Carabinieri during the three years concerned Campania, which therefore comes first by some distance in this particular ranking.
Items seized by the Local Police exhibit a regional distribution which is fairly consistent with figures recorded for the other two Forces.
It is quite interesting to note, as a distinguishing characteristic, the large number of goods seized in 2011 by the Local Police in the Lazio region, which with over 196,000 items was the region with the largest number of items seized in the same year, ahead of Lombardy and Sicily which were second and third in this ranking, with over 63,000 and 61,000 items respectively.

Anti-counterfeiting activities: Polizia di Stato
National level Regional level Sectoral level
Data provided by National Police concerning Counterfeiting, excluding Foods, Beverages, Tobacco and Medical Products
Number of items seized by National Police
2008 2009 2010 2011 Overall total CLOTHING 19,685 18,989 15,332 32,369 86,375 CLOTHING ACCESSORIES 93,147 141,947 39,797 44,033 318,924 OTHER GOODS 190,259 75,597 155,107 50,567 471,530 ELECTRICAL EQUIPMENT 462 98 40 600 IT EQUIPMENT 304 170 144 74 692 FOOTWEAR 18,193 6,748 8,955 9,120 43,016 CDS, DVDS, VIDEOCASSETTES 330,952 205,186 136,347 171,541 844,026 TOYS AND GAMES 1,269 18,920 2,954 448 23,591 EYEWEAR 13,681 12,201 7,772 8,402 42,056 WATCHES AND JEWELLERY 17,742 5,642 4,943 2,409 30,736 PERFUMES AND COSMETICS 213 146 242 94 695 Overall total 685,445 486,008 371,691 319,097 1,862,241 Source: IPERICO (DGLC-UIBM), based on CO.AB. (Central Directorate of the Criminal Police) data
For the National Police the figure for seizures of CDs, DVDs and Videocassettes stands out, above all for seizures carried out in 2008-2009.
July 2012 - 74

July 2012 - 75
Antic-counterfeiting activities: Carabinieri
National level Regional level Sectoral level
Data provided by Carabinieri concerning Counterfeiting and Piracy, excluding Foods, Beverages, Tobacco and Medical Products
Number of items seized by Carabinieri 2008 2009 2010 2011 Overall total
CLOTHING 50,112 22,234 26,329 29,054 127,729CLOTHING ACCESSORIES 771,422 145,628 73,285 174,772 1,165,107OTHER GOODS 7,751 23,316 4,189 30,176 65,432ELECTRICAL EQUIPMENT 155 61 1 217IT EQUIPMENT 5,658 49 186 41 5,934FOOTWEAR 18,733 7,067 8,144 10,347 44,291CDS, DVDS AND VIDEOCASSETTE 638,978 718,757 291,960 211,503 1,861,198TOYS AND GAMES 11,264 4,178 1,566 2,597 19,605EYEWEAR 21,345 20,316 11,350 13,309 66,320WATCHES AND JEWELLERY 4,478 8,782 2,945 1,702 17,907PERFUMES AND COSMETICS 117 6 421 862 1,406Overall total 1,530,013 950,394 420,376 474,363 3,375,146Source: IPERICO (DGLC-UIBM), based on CO.AB. (Central Directorate of the Criminal Police) data
During the period the Carabinieri seized mainly CDs, DVDs, videocassettes and clothing accessories.

Anti-counterfeiting activities: Local Police
National level Regional level Sectoral level
Data provided by Local Police concerning Counterfeiting and Piracy, excluding Foods, Beverages, Tobacco and Medical Products
Number of items seized by local police
2008 2009 2010 2011 Overall total
CLOTHING 40,044 22,195 16,156 9,454 87,849 CLOTHING ACCESSORIES 220,440 93,483 66,643 68,329 448,895 OTHER GOODS 43,596 19,134 29,058 153,373 245,161 ELECTRICAL EQUIPMENT 30 966 996 IT EQUIPMENT 37 153 17 470 677 FOOTWEAR 2,588 3,797 3,276 5,064 14,725 CDS, DVDS, VIDEOCASSETTE 197,040 125,654 69,460 71,427 463,581 TOYS AND GAMES 5,078 8,843 25,675 51,368 90,964 EYEWEAR 31,386 30,578 13,361 18,353 93,678 WATCHES AND JEWLLERY 4,099 3,012 4,882 2,817 14,810 PERFUMES AND COSMETICS 3,266 1,352 2,482 1,339 8,439 Overall total 547,574 308,231 231,010 382,960 1,469,775
Source: IPERICO (DGLC-UIBM), based on CO.AB. (Central Directorate of the Criminal Police) data
The Local Police, like the Carabinieri, are distinguished by the fact that they seized a high number of items in the CDs, DVDs and Videocassettes and Clothing Accessories product categories.
July 2012 - 76