council on environmental quality - ct.gov · council on environmental quality 79 elm street,...
TRANSCRIPT
Council on Environmental Quality 79 Elm Street Hartford CT 06106
Telephone 860-424-4000
wwwctgovceq
1
Progress and Problems
As in many recent years each improvement of 2017 was countered by a step backward in another part of
the environment Air was better beaches were closed more often More eagles fewer bats And so on There is a large reason that Connecticut residents continued commitment to a more healthful
environment does not yield quicker more satisfying results Connecticuts location in a changing climate Connecticut residents take pride in the unique history and beauty of their state There is uniqueness in
Connecticuts challenges too The seas of the world for example are rising everywhere but nowhere
more quickly than the shores of New England That is just one challenge As the environmental indicators in this report illustrate Connecticut residents continue to breathe
unhealthful air on many summer days lobsters are scarce where once they were abundant beaches close
because it rains heavily and harmful insects and plants are moving northward into Connecticut -- rapidly
The common threads running through these unhappy facts are the changing climate and Connecticuts
place on the continent which puts it in the path of invading pests air pollution rising seas and an array of
other injuries Climate change is global in scope and often perceived to be beyond the individuals ability to have an
impact However individual actions do have an effect and Connecticuts ability to help through civic
action and leadership can help to turn the tide of climate-altering pollution There is another tide that will not be stopped or turned aside anytime soon According to a report being
completed by the Connecticut Institute for Resilience and Climate Adaption the warming leads to a much
greater increase in the mean sea level around New England and the Canadian Maritime Provinces than
almost anywhere else in the world Few or none of the indicators in this report will show improvement because of greater warmth more
episodic rainfall or rising seas They will improve only through greater human effort As mentioned
elsewhere in this report nearly all indicators in this report include a link to additional information that
explains the connection to a changing climate
The Conservation Question
Among the few indicators in this report that are not tied closely to climate change is the pace
of land conservation The chronically slow pace is the result of financial commitments that are not
sufficient to get Connecticut to its goals The pace of farmland conservation did improve in 2017 in
contrast to the conservation of other lands a product of greater investment of state funds and use of
federal money Even that increase however is not quite enough to get the state to its goal for farmland
conservation
The Importance of the Public Trust
As 2018 began the Council studied the public trust in natural resources when the concept suddenly
became controversial following its insertion into the draft State Water Plan It published Connecticut
Residents and the Public Trust in Air Water Wildlife and Other Resources in March 2018 to help guide
public discussion of the issue Recognition of the public trust in natural resources has been critical to
Connecticuts environmental progress for decades and will remain so
2
New in This Edition Climate Notes
The strong enduring and largely successful efforts of Connecticut residents to improve their air and water
have faced many opponents persistent sources of long-term pollution unhealthful air blowing in from
other states local scofflaws and increasingly the weather
The environmental indicators in this report illustrate the effects of hot summers and heavy precipitation
Both are hallmarks of New Englands changing climate and unfortunately major factors that work in
opposition to Connecticuts pollution-control efforts A summer of hot days and big storms will lead to
more bad-air days and more closed beaches But those obvious consequences are not the only effects
The majority of Connecticuts key environmental indicators are strongly affected -- almost always negatively -- by a changing climate
This years edition has a new feature to highlight each environmental conditions connection to climate change At the top of nearly every page there is a symbol
Running your cursor over the symbol will reveal a brief statement of the indicators connection to climate
Clicking on the symbol will open a page with more details (This feature will not work in the Iron version
which you are reading now This version will have only the heating globe symbol to indicate a climate
effect Moe information can be found in Climate Notes on page 56)
Air and water quality have the most immediate and direct connections to weather variations that are
caused by the changing climate Connecticuts forests are changing wildlife is changing and invasive species -- most of which arrive here from more southern locations -- are thriving
The invasions of species are potentially of great consequence This years report includes a new indicator
that illustrates the northward migration of Asian Tiger Mosquitoes into Connecticut Scientists are confident that this disease-bearing mosquito is expanding its range because the climate is changing
All of the efforts that residents put forth to conserve their environment from preserving land to protecting
turtles to driving efficient vehicles are critical to Connecticuts march toward its environmental goals This
years report highlights the fact that residents are having to work even harder because the changes in the climate are working against them
Invasion
One of the most troubling consequences of Connecticuts location and warming climate is the ease with
which foreign pests invade from the south and west The Asian tiger mosquito is an excellent example and is highlighted in the new page called Invasions Future editions will expand this section
3
Invasions
Asian Tiger Mosquitoes
The Asian tiger mosquito continues to expand its range northward as the climate warms
The range of the Asian tiger mosquito is expanding in the United States particularly into Connecticut and
other northeastern states Infection rates of West Nile Virus and other mosquito-borne diseases are likely
to rise as a warming climate creates more favorable habitats for mosquitoes Much of Connecticut is
expected to get warmer and wetter over the coming century enhancing mosquito populations by creating
more suitable habitat In other locations the invasive Asian tiger mosquito Aedes Albopictus is a vector of the dengue
chikungunya and Zika viruses all major concerns for public health agencies A 2018 report from the
Centers for Disease Control and Prevention found that illnesses transmitted by mosquitoes more than
tripled in the United States from 2004 to 2016 The Asian tiger mosquitos first appearance in the United
States was in Texas in 1985 and was followed by rapid expansion This mosquito was first discovered in
Connecticut in 2006
Scientists at the Connecticut Agricultural Experiment Station (CAES) published a study in 2017 that
documents the recent statewide expansion Bridgeport has been a particularly productive location for the
Asian tiger mosquito
4
The maps show the locations in Connecticut where Asian tiger mosquitoes have been collected by the
CAES After its initial detection in 2006 it disappeared again until 2010 Asian tiger mosquito abundance decreased during 2014 and 2015 following winters with cold
temperatures Following more moderate winters in 2016 and 2017 the Asian tiger mosquito population
increased dramatically
The study by CAES clearly portrays the invasion expansion and overwintering success of the Asian tiger
mosquito in southern Connecticut and how mild winters enhance its abundance If a winter is too cold or
there is not enough precipitation the mosquito population declines Because of warming winter
temperatures Asian tiger mosquitoes are expected to increase their range further
The maps below are from a 2013 study that projects Asian tiger mosquito range expansion in the
northeastern USA under two climate change scenarios (A and B) Scenario A (top map) indicates a
moderate increase in carbon dioxide emissions while Scenario B portrays greater increases in those
emissions Significant expansion of the Asian tiger mosquitos range was predicted under both emission
scenarios The most expansion would occur in southern New England where this species is predicted to
occupy most of Connecticut by 2039
It is not just the expansion of suitable habitat that allows mosquitoes to thrive here As the temperature
rises everything about the disease-spreading biology of mosquitoes speeds up Warmer temperatures are
more likely to make mosquitoes breed get infected and transmit disease at a faster rate Warmer air
incubates the virus faster in the cold-blooded mosquito Warmer temperatures make the mosquito
hungrier so it bites more people Another recent study further suggests that temperature is an important
factor enhancing the vector competence of the Asian tiger mosquito for various mosquito-borne diseases
such as Dengue and Zika
5
Technical Notes The Connecticut Agricultural Experiment Station collects mosquitoes from June through October at 91 trapping locations as part of the Connecticut Mosquito and Arbovirus Surveillance Program In 2016 new sites were added to
the surveillance network The data in this indicator is restricted to the original 91 sites that have been in continuous operation for 20 years at CAES (shown at right)
Mean monthly temperatures were calculated for the winter months using information obtained from the National Oceanic and Atmospheric Administration
Each of the time periods on the map actually covers three decades
2020s = 2010ndash2039 2050s = 2040ndash2069 and 2080s =2070ndash2099
COMING SOON Future editions of this report will document other
invasive-species populations in Connecticut
6
Air
Good Air Days
Connecticut residents breathed unhealthful air on 20 days in 2017 a significant improvement over the 10-year average
A Good Air Day is when every monitoring station in the state records satisfactory air quality ldquoSatisfactory
air qualityrdquo is defined here as air that meets the health-based ambient air quality standards for all of the
following six pollutants sulfur dioxide lead carbon monoxide particles nitrogen dioxide and ground-level
ozone
Connecticutrsquos goal is to have air that meets health-based standards for all six pollutants Violations of
health-based air quality standards have been eliminated for five of the six pollutants leaving ground-level
ozone as the only remaining chronic problem (As described on the CEQ Air Pollution Index page the
levels of lead are so low that the possibility of violations is remote the standards remain in place
however) Ground-level ozone is created when nitrogen oxides and organic compounds in the air react in the
presence of sunlight Weather is a major factor in year-to-year fluctuations Motor vehicles remain a large
source of ozone-forming emissions despite improvements in tailpipe standards Cities and towns in coastal regions of the state usually see more bad ozone days than inland locations
The map below illustrates a bad-air day in 2017 that was more intense than average but followed the
typical pattern of Connecticut having the worst ozone pollution in New England
7
Source US Environmental Protection Agency Region 1
The yellow areas met the air quality standard for ground-level ozone while the orange and red areas did
not Some residents in yellow areas who are unusually sensitive to pollution might have been affected Coastal towns saw the most unhealthful days including Madison (12 days) Stratford (11) Westport
(9) and Danbury (9) while Cornwall (1) and Stafford (3) saw the fewest No other New England state had
more days with unhealthful levels of ozone than Connecticut which had a total of 20 Massachusetts was
the next highest with 12 unhealthful days The number of statewide good air days in 2017 (345) was significantly better than the average of the
previous ten years (3326)
Connecticut saw improvement in the number of good air days in 2017 because in part there were fewer
hot days during the ozone season (April through September) than in 2016
In contrast to 2017 temperatures during the 2016 ozone season (April through September) were very high
since 1895 only four years had a higher average temperature during the ozone season and only two years
(2002 and 2010) saw more days with high temperatures of 90 degrees or more at Bradley International
Airport In 2017 which was a warm year overall there actually were fewer days over 90 degrees than in an
average year and fewer bad-air days Because levels of ground-level ozone generally rise with the
temperature Connecticut will have to reduce pollution even more just to maintain current air quality as the
climate warms
Much of Connecticuts ground-level ozone originates in states to the west Unless emissions in those states
are reduced substantially Connecticut residents could breathe unhealthful air indefinitely
Fine particles such as those found in smoke and haze are 25 micrometers in diameter and smaller (For
reference a typical human hair is about 70 micrometers in diameter) Connecticut did not
see any violations of the fine-particle standard in 2016 or 2017 The annual average for the preceding
decade was 41 days in exceedance of the standard for fine particles
8
Technical Note The federal air quality standard for ozone was revised prior to the 2016 ozone season
The new standard (0070 parts per million over eight hours) is slightly more protective of human health
than the older standard (0075) As it always does when a standard is revised the Council re-calculated
the data for all previous years In order to display an accurate trend the chart shows the number of good
and unhealthful days for each year as if the new standard had been in effect all along
Good Air for Bugs and Birds Too
The sight of hundreds of chimney swifts swirling into the chimney of the Willimantic Town Hall on
a summer evening is a cause for celebration The chimney swift is one of several bird species that feed
entirely on the wing devouring insects and spiders high in the air Unfortunately swifts and other aerial
insectivores are in a long-term decline One hypothesis for the decline the insects that sustain the birds
are not as numerous as they once were or perhaps not as nutritious Could pesticides or other
contaminants be the problem Read more about the ecology of the air in the Connecticut Audubon
Societys 2013 State of the Birds report
9
Air
CEQ Annual Air Pollution Index
Average Levels of Air Pollution
Connecticut set a new record for low levels of air pollution in 2017
The chart shows the average level of pollution in Connecticuts air
Five air pollutants -- sulfur dioxide carbon monoxide particles nitrogen dioxide and ground-level ozone -
- are measured continuously across the state by DEEP At the end of every year the Council calculates the
average level of each pollutant on a numerical scale where zero equals no pollution and 100 would
represent the ldquounhealthfulrdquo level of the specified pollutant The Council takes this annual number for each
of the five pollutants and averages them to yield the single index value on the chart
Connecticuts air quality was better in 2017 on average than in any recent year Most pollutants and
especially fine particles showed measurable improvement the exception was nitrogen dioxide
The trend in sulfur dioxide (which is a component of the index value above but not shown separately) is
worth noting The average concentration in Connecticuts air in 2017 was a 47 percent reduction from
2007 Since late 2014 heating oil sold in Connecticut and several other northeastern states has by law
contained very low concentrations of sulfur By 2018 the sulfur content will be even lower
Lead is Out
Until 2012 this indicator charted the combined average level of six pollutants not five as it now does The sixth pollutant was lead In the early 1980s lead was a serious problem but unleaded gasoline and other advances have reduced lead levels dramatically Levels of lead have dropped so low that in recent years they barely registered in this indicator By removing lead from this indicator the Council declared victory on behalf of Connecticut residents (Lead
still is subject to regulation and health-based standards and still is monitored by DEEP so it can be brought back into this indicator if levels rise unexpectedly in future years)
10
Land
Preserved Land
Connecticut has two land conservation goals for 2023
Goal 1 State Lands
State parks forests wildlife management areas and other state-owned conservation
lands shall constitute 10 percent of Connecticuts land area
In 2017 the state acquired approximately 810 acres greater than the ten-year average
of 705 acres State preservation efforts are not nearly on track to reach the state preservation goal by 2023
More information about the pace of state land preservation can be found on the To Get Back on
Track page
________________
11
Goal 2 All Conservation Lands
Land conserved by towns and cities the state land trusts and other nonprofit
organizations and water utilities shall constitute 21 percent of Connecticuts land area
Nobody knows what that total is today
State law sets a goal of conserving 21 percent of Connecticutrsquos land area The Green Plan Connecticutrsquos
official land conservation plan establishes 2023 as the target date That goal includes conservation land
owned by towns and cities land trusts and other nonprofit organizations water utilities and the state
As Connecticut comprises 3205760 acres fulfilling this goal would require protection of 673210 acres State grants helped municipalities and land trusts acquire 895 acres in 2017 far fewer than the 2200
acres of 2016 Many acres also are preserved each year by municipalities and land trusts without state grants but that
information is not reported to the state The oft-cited estimate that Connecticut has achieved about 74
percent of its goal is inaccurate A review by the Council in 2015 of published landholdings of land
trusts showed nearly 60000 acres held in fee and close to 30000 in easements -- far more land than
what is included in most published estimates There is however no accurate current census of all
the preserved properties in the state The absence of an accurate inventory of protected land in Connecticut is a serious deficiency DEEP had
been collecting data from municipal records in a sequential fashion for 14 years that effort almost
certainly will not be completed and in any event the earliest-collected data is well out of date To make
land preservation more strategic and cost-effective Connecticut needs a reliable and up-to-date registry
of the protected lands An Act Concerning the States Open Space Plan adopted in 2012 should
eventually lead to an accurate tally of preserved lands but progress has been slow DEEP has launched a
registry portal as a pilot
How the Goal Track is calculated
The State of Connecticut has been acquiring land for parks forests and wildlife conservation for more than a century In 1997 and again in 1999 it committed itself to the goals stated above For the state itself this meant acquiring another 104000 acres to reach the goal of 321000 acres (or 10 percent of the land within Connecticuts borders) by
2023 Achieving this goal would have required Connecticut beginning in 1999 to acquire about 4500 acres per year (on average) a rate that had been met (on average) up to 2008 The Goal Track on the chart shows the acquisition rate necessary from 2017 onward to achieve the state goal Because the state has fallen below the Goal Track it now
will need to acquire about nearly 9000 acres per year For more information about the pace of preservation please see the To Get Back on Track page
Preserved Forests = Clean Water
Rain that falls on land flows toward the nearest stream If that land is mostly woods there is a high probability that the stream will support a full range of aquatic life If even 12 percent of the land is paved or built upon then the life in the stream is almost certain to be affected
These revealing statistics are discussed further on the Rivers Streams and Rain page
12
Land
Forest and Forest Birds
Forested Land Forest Birds
The years from 2010 through 2015 were unusual gains in forest acreage equaled the
losses Before 2010 Connecticuts forests had been shrinking for three decades
The chart above shows the acreage of forest The health of those forests is reflected in the populations of forest birds (see next page)
Top chart (Forest Acres) Forests that are at least 300 feet from non-forest development -- roads
buildings and farms -- are classified as core forests Core forests provide habitat for many species of
wildlife that cannot tolerate significant disturbance Forests that are fragmented or divided by roads and
clearings provide some forest functions but are not fully-functioning forest ecosystems Fragmented
forests are known to provide substandard or poor habitat for some species of wildlife and in many cases
less opportunity for hunting and other types of recreation Invasive species of plants and animals appear
in the wake of activities that fragment the forests
The acreage of forests can fluctuate over years or decades increasing as fields grow into forests and
declining as timber is harvested by clear-cutting or as agricultural fields are expanded These
temporary fluctuations are distinct from permanent declines caused by road and building construction
The economic recession that began in 2008 slowed (but did not halt) new construction in most parts of the
state During the lull in land development some areas that were observed to be cleared land in 2010
became forests by 2015 Gains appear to have balanced the losses This five-year period of unchanging
forest acreage is highly unusual in Connecticuts modern history
13
The number of birds nesting in Connecticuts forests has been shrinking This is true for birds that nest in mature forests as well as for birds that nest in young forests and
shrublands The 2017 nesting season brought a slight improvement for most forest-bird species though some declined
Birds as Indicators of Forest Health
The Connecticut Forestlands Council Forest Ecosystem Health Committee developed a list of Avian Forest
Health Indicator Species that can be used as indicators in identifying both positive and negative areas of
forest ecosystem health From that list the Council on Environmental Quality selected two groups of
species that best typify forest birdlife throughout the state In selecting the species the Council was
aided invaluably by five experts in ornithology
The Council calculates index values (using advice from statistics experts) to show the combined population
trends of several woodland species In the bottom chart the red dots follow the combined nesting
populations of eight species of birds that typically inhabit mature forests in Connecticut
Hairy Woodpecker Wood Thrush Eastern Wood-Pewee Red-eyed Vireo Scarlet Tanager Black-and-white Warbler Veery Ovenbird
The yellow dots track the nesting populations of five bird species that typically inhabit forests that are
young or dominated by shrubby vegetation sometimes known as shrublands
14
American Redstart
Blue-winged Warbler
Chestnut-sided Warbler
Eastern Towhee
Yellow Warbler
Both categories of forest birds have been declining faster than the forests themselves This rapid
decline could be caused by several factors Most of the mature-forest bird species are affected greatly by
fragmentation Predators invasive species overpopulating deer and human activities follow roads and
other intrusions into the forests and cause nesting success to falter The true forest birds those that are
not adapted to disturbed roadside or suburban habitat will succeed in the long term only in forests that
are not fragmented After years of decline in the acreage of core forest one would expect to see declines
in many bird species and Connecticut is seeing such a decline Many studies have identified a time lag
period between the fragmentation of a forest and the decline in birds explained probably by the fact that
the birds breeding success diminishes gradually not instantaneously when a forest is divided into smaller
parcels The link between the conservation of unbroken forests and bird populations is the subject of the
Connecticut Audubon Societys 2015 State of the Birds report
Songbirds that depend on young forests have seen their habitat lost to development and to aging of the
trees Other young-forest wildlife such as the New England Cottontail and Ruffed Grouse also have
declined as such habitat has dwindled Many landowners including the state have taken action to expand
this type of forest habitat Where land is managed to encourage young forests and shrublands the wildlife
responds favorably but such managed areas are small in total In late 2016 the federal
government approved creation of the Great Thicket National Wildlife Refuge across six states that could
protect habitat for many young-forest and shrubland bird species the focus in Connecticut will be in
western and southeastern areas of the state It is too soon to conclude that these efforts led to the uptick
in some nesting populations in 2017 but they do provide some hope
The decline of Connecticuts forest birds has landed the majority of the above species on the states
2015 list of wildlife species of greatest conservation need The decline can be attributed to a combination
of shrinking core forests a lack of young forests and a surge in other threats Connecticuts current efforts
to maintain and improve forest ecosystems evidently are inadequate
The Connecticut Forestlands Council Forest Ecosystem Health Committee prepared a list of forest ecosystem health indicator species for Connecticuts Forest Resource Assessment and Strategy (see Appendix 4 of that document for the list of species)
The Council used five criteria to select species that represent the birdlife of Connecticut forests The species that
meet the criteria are songbirds (excepting the Hairy Woodpecker) that have been nesting for decades throughout Connecticut where suitable habitat exists Species thought to be moving into or out of the state because of a changing climate were excluded (Information about climate-sensitive species can be found in a 2014 report by the National Audubon Society) Annual nesting data are obtained from the North American Breeding Bird Survey (BBS) a cooperative effort between the US Geological Survey and the Canadian Wildlife Service to monitor the status and
trends of North American bird populations Using a rigorous protocol BBS data are collected by thousands of dedicated participants along thousands of randomly established roadside routes throughout the continent Population
data for the eight species are combined into an annual index value The annual values depicted on the chart are five-year moving averages which smooths the year-to-year fluctuations that might be caused by weather or other short-term factors A parallel method was used to select and chart the populations of birds that inhabit young forests and shrublands The Council welcomes questions about the criteria and methods used for this indicator
Five biologists (please see the acknowledgments from the 2015 report) with expertise in ornithology were asked to review the criteria and a draft list of species Their comments led to several improvements including changes to the lists of species selected for the indices The Council greatly appreciates their learned input but assumes full responsibility for any weaknesses in the charts
15
Land Farmland
Preservation Connecticut preserved 1850 acres of agricultural land in 2017 the most since 2011
Loss Farmland loss slowed considerably after 2006
The top chart shows the cumulative acreage preserved by the Connecticut Department of Agriculture
which began preserving land by purchasing development rights in 1978 In 2011 the Department
launched the Community Farms Preservation Program for farms that do not meet all eligibility
requirements of the longstanding farmland preservation program but are nonetheless worthy of
16
preservation The acreage figures since 2014 include both programs State bonding the Community Investment Act and federal funds are the main sources of funding
The bottom chart presents an estimate of the total area of land used for crops and pasture in
Connecticut developed by the Center for Land Use Education and Research (CLEAR) at the University of
Connecticut using satellite-derived data It shows that less farmland was lost to development between
2006 and 2015 than in prior periods presumably because of the downturn in real estate development associated with the recessionary economy
The top chart does not show agricultural land acquired for preservation by municipalities and nonprofit
organizations Several towns purchased farms in recent years with no state assistance and those acres
are not reported or recorded at the state level Along with a central registry of preserved open space
Connecticut needs a registry of preserved farmland to help state agencies and other organizations preserve land strategically
What is the Source of the Goal
The Connecticut Department of Agriculture adopted a farmland preservation goal -- 130000 acres in total
with at least 85000 acres in cropland -- that originally was based on the amount of land needed for food
production to sustain Connecticuts population
Council projections prepared in 2008 show the goal being reached in the 22nd century but in reality there
will not be that acreage of agricultural land remaining in the state by the end of the current century if the
rate of loss continues as it has for most of the past five decades Preservation of at least 2000 acres
annually should result in success During the last ten years preservation has progressed at slightly more
than half the needed rate Please see the To Get Back on Track page for more information
Technical note The analysts at CLEAR made slight revisions to all years data in 2015 and the chart above was modified accordingly
17
Land
To Get Back on Track
Milestones
The previous three pages of land indicators illustrate Connecticuts insufficient progress in land
conservation This page tracks the mandatory milestones which if met are expected to get the states
land conservation effort moving forward at a greater pace In 2012 and 2014 legislation was adopted and signed (Public Acts 12-152 and 14-169 respectively) that
set specific targets and timeframes for land-conservation planning
Mandate for DEEP Deadline Done Notes on Progress
Prepare comprehensive land conservation strategy (including an estimate of total conservation acreage in the state) CGS Section 23-8(b)
December 2012
Published February 2017 Does not include accurate
estimate of preserved land
Establish a process for state agencies to identify landholdings that might be valuable for conservation CGS Section 23-8(d)
No specific date
Incomplete
Establish a publicly-accessible registry of conservation lands CGS Section 23-8(e)
January 1 2015 Quarterly updates
thereafter
Project has slowed or stopped
The Pace of Preservation
The gauges below show the differences between the current rates of land preservation and the rates
needed to meet the goals Connecticut has set for itself
Preservation of Land by the State for State Parks Forests and Wildlife Management Areas
(Goal = 10 of Connecticuts Land Area)
Average Annual Rate
of State Land Acquisition
Needed to Reach Goal
Average Annual Rate
of State Land Acquisition
Since 2007
Goal Track
Current Trend
18
In the last ten years the State of Connecticut has added about 7200 acres to its network of state parks
forests and wildlife management areas Achieving the States goal would require exceeding that ten-year
total every year ____________
Preservation of Farmland by the State
Average Annual Rate
of Farmland Preservation
Needed to Reach Goal
Average Annual Rate
of Farmland Preservation
Since 2007
Goal Track
Current Trend
____________
Preservation of Land by Cities Towns State
Nonprofit Organizations and Water Utilities
(Aggregate Goal = 21 of Connecticuts Land Area)
The gap between the goal and the rate of acquisition by these land-conserving organizations is not
possible to assess Acquisition data are not collected by DEEP or any other organization
Small Parcel Size A Big Impediment One of the reasons that Connecticut probably will not meet its goals for land conservation is the fact that
most forest land is owned in small parcels Read more about this in a December 2015 CEQ staff memo
19
Shore + Sound
Swimming
Coastal swimmers had to contend with more beach closings in 2017
The Council adds up the number of days that each coastal city and town closed one or more of its public
beaches and calculates an average for all the coastal cities and towns with beaches
Coastal swimmers hoping to enjoy their sport on as many days as they had in the previous two years
were disappointed in 2017
Yearly variations are products of rainfall patterns and unusual incidents such as sewer-line ruptures
Heavy rainfall may have been a factor in 2017 Total annual precipitation levels in 2017 were 40
percent greater than in 2016 Polluted surface runoff and sewage overflows after rainstorms are the most
common sources of bacteria After heavy rains health officials must assume that polluted runoff andor
overflows from combined sanitarystorm sewers have raised bacteria levels Though beaches are regularly
monitored for bacteria test results are not immediate More closings are initiated preemptively as a
precaution after heavy rain than are initiated due to actual monitoring results
Most closures in 2017 were due to elevated bacterial levels in the water A sewage spill caused New Haven
to close a beach for ten days in 2017
The cities and towns on the western half of the states shoreline usually have a higher frequency of
closings and 2017 was no exception The western half of the coastline has more sewer systems
with overflows and more paved surfaces that send contaminated runoff into the waters
The water is tested at beaches from Memorial Day through Labor Day At other times the water could be
clean or contaminated it is not tested Most sewage treatment plants along the coast disinfect their
routine effluent discharges all year but most treatment plants north of I-95 do not disinfect their effluent
before May and after September
20
How this indicator is calculated The number of days that each coastal town and city closed one or more of
its public beaches is added and an average is calculated for all the coastal cities and towns with beaches
Because the bathing season is approximately 100 days long the number of days shown on the top chart
also equals the percentage of the bathing season when beaches were closed
What is the Source of the Goal
The goal line on the top chart is an approximation of the target adopted in the 2015 edition of the Long
Island Sound Studys Comprehensive Conservation and Management Plan That plans goal calls
for cutting the number of beach closings in half by 2035 (from 2014 with the number for 2014
calculated using a five-year rolling average) The plans goal is tied to individual beaches while the
indicator above counts beach closings by grouping together the beaches within each municipality A fifty
percent reduction in individual beach closings will likely result in a comparable reduction in the indicator
above
Clamming and Oystering
The area of the Sound unconditionally approved for harvesting shellfish was unchanged
in 2017
The Connecticut Department of Agricultures Bureau of Aquaculture and Laboratory Services
monitors shellfish beds and classifies them according to their potential for yielding healthful
uncontaminated shellfish The chart immediately above shows the acreage of shellfish beds that are
included in the approved category for direct harvesting because they are generally unaffected by
pollution There is also a conditionally approved category which requires a management plan and might be
subject to closings seasonally or after rainfalls (Even areas that are approved may be closed as a
21
precaution following exceptional rainfalls of three or more inches) Aquaculture experts have suggested
that the gradual historic shrinkage of approved shellfish beds is associated with an increasing volume of
runoff from lawns and pavement flowing further into the Sound Shellfish beds can be closed in
anticipation of rain events that will wash pollutants into receiving waters The drought conditions which
persisted during 2016 resulted in fewer closures
What is the Source of the Goal The goal for shellfish beds adopted in the 2015 edition of the Long Island Sound Studys Comprehensive
Conservation and Management Plan is to upgrade five percent of the 2014 restricted acres so that
shellfish may be harvested in those areas freely Adding those upgraded acres results in a target of
approximately 139550 approved acres by 2035 shown on the chart as a horizontal line
Forecast More Heavy Rains
Connecticut residents have witnessed a steep increase in the amount of rain arriving in downpours In
October 2015 the National Weather Service updated the precipitation frequency data for Connecticut that
had last been published in 1961 The new data confirm what had been predicted by many rainfalls are
getting heavier and heavy rains are becoming more frequent In 1961 most of the state would have
expected a four-inch one-day rainfall every five years or so in some northwestern towns that five-year
storm would have brought less than four inches Now all portions of the state can expect the five-year storm to bring well over four inches and in some northwestern Connecticut towns close to five inches
While this trend generally attributed to a changing climate can be found throughout the country it is particularly strong in the northeastern states The 2014 National Climate Assessment predicts this trend to
strengthen
Precipitation data are from the Bradley International Airport monitoring station
22
Shore + Sound
Piping Plovers and Others
A 30-year high number of plovers nested on 19 Connecticut beaches from Westport to Stonington
Piping Plovers are small shorebirds that nest only on sandy beaches with sparse vegetation People storm
tides and predators frequently destroy nests The number of plovers on Connecticuts beaches now exceeds the estimated recovery potential level
(see below) However the modest size of the population requires that the species continue in
threatened status at the state and national level Nesting adults are counted (and in most cases protected) every spring by hundreds of volunteers working
with the Audubon Alliance for Coastal Waterbirds The Nature Conservancy and other organizations Their habitat is a narrow strip squeezed between a rising Sound and higher ground The Piping Plover
population is according to the United States Fish and Wildlife Service an indicator of the health of the
fragile beach ecosystem (Atlantic Coast Piping Plover Revised Recovery Plan) Since protection and monitoring efforts began in 1984 nesting success has improved resulting in more
returning adults in subsequent years In 2017 66 pairs (a modern record) successfully raised 100 young
plovers on 19 Connecticut beaches Scientists estimate that each pair must successfully raise an average
of 120 young per year to maintain a stable population of Piping Plovers In 2017 Connecticut plovers
raised an average of 151 chicks per nest
23
Other Beach Residents
The protections afforded Piping Plovers benefit other threatened species including American
Oystercatchers and Least Terns
The least tern count was low again in 2017 244 pairs of least terns were counted on Connecticut shores
down from 250 pairs in 2016 This yearrsquos pairs were able to raise 31 chicks a small increase but still a low
number that reflects the numerous challenges confronting wildlife on Connecticut beaches While
Connecticuts least tern numbers have been variable from year to year the population has remained
relatively stable since 2006 in the southern New EnglandNew York region Oystercatcher pairs had a record high year in 2017 with a population of 63 pairs and the second best year
for productivity 63 oystercatcher fledglings a better-than-average number
American Oystercatchers
parent and young
Five-year Trend
Least Terns
still in their eggs
Five-year Trend
The Goal for Piping Plovers
When the federal government listed the Piping Plover as a threatened species in 1986 Connecticut was
home to an estimated 40 nesting adults (in 20 pairs) The entire population inhabiting the Atlantic coast
from Canada to North Carolina was estimated to number about 1600 An initial recovery goal was set for
2400 birds over the plovers entire Atlantic coast range The federal government reviewed the goal in
1996 and revised the overall Atlantic coast goal upward to 4000 birds New Englands share of the newer
target is about 1200 birds At that time scientists estimated Connecticut to have habitat for at least 120
nesting birds (depicted above as recovery potential) The breeding population of Massachusetts has
been so successful since then that New Englands overall goal has been met Connecticut now appears to
have reached its potential (as estimated in 1996) perhaps a future reassessment will show the potential
habitat to be greater than it was known to be
24
Shore + Sound
The Water of Long Island Sound
The area with acceptable levels of dissolved oxygen throughout the year are on track
to meet the 2035 goal
Marine life requires oxygen The percentage of Long Island Sound that has adequate oxygen throughout
the year is shown in the chart above
During the summer some areas of the Sound experience hypoxia which is a condition in the water where
oxygen levels are not adequate to fully support desirable forms of life including fish and lobsters Hypoxia
occurs when the nitrogen in pollution stimulates excessive growth of aquatic plants which die and get
consumed by oxygen-using bacteria Hypoxia occurs predominantly in the western portions of the Sound
Weather greatly influences hypoxia making year-to-year changes less important than long-term trends
Detailed reports that include maps of the extent and duration of hypoxia in Long Island Sound are
produced annually by the Department of Energy and Environmental Protection
Goal for hypoxia The goal line on the chart above set at 86 percent of the Sound is an approximation
of the target adopted in the 2015 edition of the Long Island Sound Studys Comprehensive Conservation
and Management Plan That plans goal calls for measurably reducing the area of hypoxia in Long Island
Sound from pre-2000 averages A measurable reduction is at least a 28 percent reduction according to
the plans statistical analysis that accounts for the year-to-year weather-induced fluctuations that bedevil
this indicator
25
Slightly more nitrogen pollution was discharged to the Sound in 2017
Connecticutrsquos investments in nitrogen-removal technology at sewage treatment plants have been
successful
The chart above tracks the amount of nitrogen discharged by 80 sewage treatment facilities across
Connecticut two large coastal industrial facilities and a small group of industrial sources in the Naugatuck
River watershed The sewage treatment plants include those along the coast and many more that
discharge to rivers that flow to the Sound Connecticutrsquos investments in nitrogen-removal technology at
many of those plants have been successful The nitrogen discharges of New York which lags Connecticut
in nitrogen control are not shown
To reduce the nitrogen inputs that cause hypoxia Connecticut and New York adopted a comprehensive
management plan in 1994 and built upon that plan with an expanded agreement in 2002
Connecticutrsquos share of the total nitrogen pollution in Long Island Sound is about one-third and New Yorkrsquos
is two-thirds In 2001 the federal Environmental Protection Agency approved the New York and
Connecticut joint plan for implementing a Total Maximum Daily Load (TMDL) The TMDL is the maximum
amount of pollutants that can be discharged while still allowing water quality standards to be attained
Despite the greater nitrogen discharges from 2013 through 2015 DEEP reports that Connecticut met the
goal for the trade-equalized load which takes into account the distance of inland treatment plants from
Long Island Sound A portion of the reduction in nitrogen discharges in 2016 was due to the drought
when less stormwater flowed into and through the sewer systems and another portion was the result of
capital improvements in New Haven Also more nitrogen is discharged when the weather is cold so the
warmth of 2016 probably was a factor
26
As Connecticut reduces or increases the amount of nitrogen discharged into the Sound the level of dissolved nitrogen in the water usually follows suit
The effectiveness of Connecticuts approach to reducing nitrogen in the Sound is confirmed in two
ways First the bottom chart shows the average level of nitrogen in the water of Long Island Sound
Levels have improved as Connecticut has reduced its nitrogen discharges
Second the United States Geological Survey published a report in 2016 that analyzed the nutrients being
carried to the Sound by Connecticuts rivers and streams since 2001 the total amount of nitrogen was
reduced by more than ten percent
Large uncontrolled quantities of nitrogen enter Long Island Sound when rainfall carries fertilizer from
residents lawns along with the pollutants that have accumulated on pavement
Technical Notes
1 The top chart shows the area of Long Island Sound (both states combined) that had adequate oxygen
levels throughout each year The sampling area (2700 square kilometers) does not include the whole
Sound (3400 square kilometers) The areas not sampled are shallow waters near shore which generally
do not experience hypoxia bays the eastern end of the Sound which is not expected to experience
hypoxia and an area in the far western end which probably becomes hypoxic in most years
2 More about the new hypoxia goal Progress toward the goal should be assessed using a five-year rolling
average One or two years of promising data could be natural variability at work The five-year rolling
average is not shown here but can be calculated or inferred fairly easily
3 Hypoxia was redefined by DEEP in 2011 Areas of the Sound are now considered hypoxic where a liter
of water contains less than 30 mg of dissolved oxygen This is the criterion that was used prior to 2004
From 2004 through 2010 DEEP used 35 mgl as the determining level The threshold was returned to the
30 level in 2011 to be consistent with the Long Island Sound Study Data for all previous years were
recalculated to show the area having adequate oxygen under the current definition (at least 30 mgl)
4 The nitrogen in the bottom chart is total dissolved nitrogen in the bottom waters of Long Island Sound
27
Shore + Sound
Trends Under the (Rising) Surface of Long Island Sound
The water is warming
Fish species that thrive in cold water have become less common Fishes from warmer regions are more common than they used to be
DEEP surveys marine fish squid and lobster populations every spring and fall by towing nets from a
research vessel The top chart shows the average number of fish species caught in each tow during the
spring and fall surveys combined The well-documented trend toward species that favor warm water is
apparent The chart does not include the small but growing number of sub-tropical species captured in the
fall tows In 2014 the researchers netted their first bluespotted cornetfish (a skinny fish depicted above)
Data from 2010 are missing because no fall survey was conducted that year
One study published this past year projects the shifts in thermal habitat for over 600 species on the North
American continental shelf Water temperature is a major factor in determining the geographic
distribution and preferred habitats of marine species Future shifts in species distribution were generally
found to be poleward and followed the coastline It is shown in this study that climate change in the
21st century will shift the location and available area of suitable thermal habitat for species inhabiting the North American shelf These results stress the importance of the level of global warming for the magnitude
of changes in living marine resources by the end of this century
28
The lobster population of Long Island Sound has failed to recover
The chart shows the number of lobsters caught in the average tow during DEEPs fall survey of marine life
The numbers caught in 2016 and 2017 were the lowest ever with no signs of change in 2018 The
decline in the lobster population began in 1999 and also is reflected in a dramatic drop in commercial
lobster landings during the same period (not shown) Throughout most of the 1990s (not shown on the
chart) researchers generally caught between seven and eleven lobsters per tow with a spike to nearly 20
in 1997 Researchers investigated several possible causes for the dramatic downturn in lobster
populations since 1998 disease changes in water quality changes in climatic conditions and other human
impacts to the Sound including the presence of insecticides Scientists detected no pesticides in lobsters
collected in 2014 leaving warming waters as the most likely problem for Connecticuts lobsters
The average temperature of the water in Long Island Sound has been rising with the surface temperature
rising slightly faster than the bottom water The frigid weather of early 2015 led to the coldest wintertime
water temperature in at least 25 years the weather and water then heated up more than usual in the
summer In 2017 the winter and summer water temperatures were well above average at the surface
and at the bottom Hypoxia is most likely to be a problem when the surface water is as it was in 2017 much warmer than the deep water during the summer
____________
and risinghellip
29
The chart below displays average sea level from 1965 to the present at a monitoring station in Bridgeport where sea level rise has accelerated since 1990
As the Sound rises more tidal wetlands will be flooded The natural migration of wetlands landward in
response to sea level rise is prevented in many places by fill and development
University of Connecticut scientists participated in a multi-year multi-state assessment of bird
species that nest in coastal marshes The results published in 2015 reveal several species in sharp
decline For Saltmarsh Sparrows and Clapper Rails drops of 10 to 13 percent annually since 1998
augur a short road to local extinction From the report The declines can be explained by
increases in rates of nest flooding since 2002 A scientific paper published in 2016 concludes that
1) for Saltmarsh Sparrows the extinction will not just be local but global 2) extinction can only
be averted through immediate conservation action and 3) human influences on tidal flows are as
big a factor as climate change
The changes in marine life temperature and sea level are signs of a warming Sound
Technical Notes
1 The cold-adapted species shown on the top chart are those that prefer water temperatures below 60 degrees Fahrenheit The warmer-adapted species prefer water ranging from 55 to 72 degrees Fahrenheit Because no survey was conducted during the fall of 2010 that year was excluded from the chart
2 Lobster data for 2010 are absent because repairs to the research vessel John Dempsey precluded the fall Long
Island Sound trawl survey
3 The bottom chart shows the average level of the Sound at a point in Bridgeport expressed as the number of feet above a submerged reference point Alert readers will note that the scale on the vertical axis differs from the one used in last years report a new datum point in Bridgeport was selected The trend depicted was not affected by this change
The term detailed view on the bottom chart refers to the fact that the vertical axis has been shortened beginning at five (feet) rather than the customary zero This detailed view allows the reader to discern changes in the rate of sea level rise across decades
30
Rivers + Reservoirs
Rivers and Streams
Throughout the state about 30 percent of assessed river miles are classified as being clean enough for swimming and other water contact sports
More than 1300 miles were assessed by DEEP as to their safety for swimming and other recreation About
397 miles (30 percent) are clean enough to fully support contact recreation
In most sections of rivers and streams bacteria levels are higher at least some of the time than what is
considered safe for a person swimming or playing in the water Detailed information is contained in the
draft 2016 Integrated Water Quality Report released by DEEP in early 2017 The 2014 edition
also estimated the percent of suitable streams to be 30 The 2011 edition of that report estimated the
percentage of fully safe rivers to be about 11 while the 2008 edition of that report estimated the
percentage to be 15
A separate statistical analysis performed by DEEP in 2010 estimated that 47 percent of wadeable streams
(which are streams shallow enough to be sampled using methods that involve wading) are suitable for recreation that involves contact with the water (See page 42 of linked document)
Apparent fluctuations in year-to-year results are probably due to limitations in data collection and study
design and not to widespread changes in water quality There are estimated to be 5830 river miles in
Connecticut Not all are sampled with the same frequency Sampled locations retain their designation until
re-sampled at irregular intervals The inescapable conclusion of all the analyses is that the water in most Connecticut streams and rivers might not always be safe for swimming and similar activities
____________
31
The ecological health of a stream depends very much on a single factor the percentage
of the land in its watershed that is paved
In nearly all cases a stream that
has less than 12 percent of its watershed
covered by impervious surfaces will fully
support aquatic life (shown as blue)
Impervious surfaces are largely pavement
and rooftops
If watershed is less than 12
paved
In all cases streams where more than 12
percent of the watershed is impervious will
not fully support aquatic life (shown
as gray)
If watershed is morethan
12 paved
The watershed of a stream is all of the land from which water flows to the stream For illustration think
of a stream as the drain of a bathtub the watershed is the entire bathtub A survey of 99 stream segments conducted by DEEP found that aquatic life is measurably affected when
impervious surfaces -- largely pavement and rooftops -- cover 12 percent or more of the streams
watershed (See pages 35 and 36 of linked document) No stream fully supported aquatic life where this
12-percent threshold was exceeded
Numerous analyses point to the importance of keeping impervious surfaces to a minimum and reducing
the runoff that flows directly from pavement into waterways The University of
Connecticuts NEMO (Nonpoint Education for Municipal Officials) program maintains an atlas of projects
and an inventory of municipal regulations designed to reduce the impacts of impervious surfaces About
one in five municipalities have adopted regulations that protect vegetation along streams such
regulations can yield significant beneficial results for streams and rivers but nearly all of those towns limit
the protection to a small number of named streams
There are hundreds of small streams where the water is very clean and many of these have been
documented by volunteers working with DEEPs Riffle Bioassessment by Volunteers (RBV) program RBV
enlists more than 400 students and adults to sample the aquatic life in more than 90 streams In 2015 21
out of 68 specific sampling locations (31) were found to harbor the types of insects and other life forms
that signal a healthy ecosystem ________
Rain Too Little and Too Much or It Never Rains But it Pours
Dry streambeds were a common sight in 2016 as most of Connecticut experienced extreme or severe
drought Late in 2015 several sizable streams in Woodbury Bristol and other Connecticut towns already had dried
up Connecticut had been experiencing a moderate drought far from severe but bad enough there simply
was not enough water to keep drinking water wells and surface waters flowing The streams and their
inhabitants were out of luck (and water)
32
Some large streams go dry during less-than-severe droughts because too much water is taken from the
underground aquifers that would under natural conditions supply the waterways during dry weather
Only new commercial wells must obtain a permit to withdraw water wells that existed before the state
water diversion law was enacted in 1982 need only be registered with the state Many streams are
affected greatly by these older wells in their watersheds (Streams that are impaired by diversions of
water are identified in DEEPs draft 2016 Integrated Water Quality Report)
At the same time Connecticut faces increasing probabilities of intense rains that cause flooding and
pollution At the Connecticut Department of Emergency Services and Public Protections Division of State
Police firearms training facility in Simsbury for example floodwaters have reached or exceeded the level shown below at least five times in the last ten years
(Photograph courtesy of the Dept of Administrative Services Construction Services)
Most of the pollution problems observed in small streams discussed above can be traced to excessive
runoff from land especially land covered by impervious surfaces such as pavement Additional information
on the growing frequency of heavy rains can be found on the Swimming Clamming and Heavy Rains page
of this report
One solution to both rainfall problems -- dry streams and floods -- is to reduce the area of impervious
surfaces Such reductions allow more rain to reach the groundwater table to keep wells and stream
flowing during dry weather ____________
About 80 miles of rivers are polluted by overflows of raw sewage
33
In 15 Connecticut cities and towns sanitary sewers were built in combination with storm sewers When it
rains these combined systems carry more water than their treatment facilities can handle and a
combination of stormwater and untreated sewage overflows directly into the rivers and Long Island
Sound Regrettably scientists predict climate change to yield more frequent high-intensity rainfall events
in Connecticut During very heavy rains the sewage treatment systems of many other municipalities
even those without combined sanitary and storm sewers are overwhelmed and spill untreated or poorly-
treated sewage to rivers and harbors
Several of the combined sewer systems have been completely or partly separated since 1990 reducing
the volume of untreated sewage in rivers Four cities that still contain multiple combined-sewer overflows
-- Bridgeport Hartford New Haven and Norwich -- have reduced the number of overflow points but about
a hundred remain Two other cities Norwalk and Waterbury have reduced their overflows to periods of
exceptionally wet weather New Haven is working on several projects that result in storing sewage within
the sewer pipes so that the discharge points release less untreated sewage New Haven estimates a 129
million gallon reduction in discharge from the amount in 2014 to what was released in 2016
DEEP maintains an interactive map showing the exact locations where sewage is known to overflow into
waterways The law that led to the map also required DEEP to publish notices of actual overflow events
starting in 2014 but that deadline was not met
Connecticuts goal is to eliminate the effects of raw sewage discharges from combined sewer systems
Progress is slow because of the extraordinary expense of separating the sewers
Links to flow data for many Connecticut streams as monitored and reported by the US Geological Survey and other
useful information about streamflow can be found on the website of the nonprofit organization Rivers Alliance of
Connecticut
34
Rivers + Reservoirs
Bald Eagles
Bald Eagles continued their dramatic surge (and Ospreys are doing well too)
Bald Eagles stopped breeding in Connecticut in the 1950s The species declined throughout the lower 48
states and was declared endangered in 1967 A variety of environmental conditions harmed the eagle
including the widespread use of certain chemicals (chlorinated hydrocarbons) that accumulated in its prey
(mostly fish) When those chemicals were banned and polluted waterways were improved the Bald Eagle
was able to reproduce again Young eagles were reintroduced into nearby states in the 1980s and a pair
found their way to Connecticut in 1991 and successfully raised a family in 1992 In 2000 there were
known to be eight nesting adults Many more have since found acceptable nesting habitat on land
protected by government and private landowners including utility companies and land trusts DEEP
monitors the eagles with the assistance of the Bald Eagle Study Group and other volunteers
The population of Bald Eagles is included as an indicator because the eagle is representative of species
especially predators which share similar habitat requirements large areas of relatively undisturbed land
near rivers or lakes where the birds can find adequate supplies of fish and other prey that are ndash very importantly ndash only minimally contaminated
Bald Eagles can be seen fairly frequently where for decades they were scarce On one morning in March of
2013 for example 15 Bald Eagles were reported by experienced birdwatchers at Wethersfield Cove only
three miles from the State Capitol In January of 2017 139 eagles were counted in the state They spend
35
their winter mostly along larger rivers where they have become a regular sight Iced-over rivers to the north can push more eagles south to Connecticut
The federal government removed the Bald Eagle from its list of threatened and endangered species in 2007 In 2010 Connecticut changed the eagles in-state status from endangered to threatened
Another large fish-eating bird of prey the Osprey has rebounded in similar fashion From a low of nine
nesting pairs in 1974 Ospreys -- counted by the Connecticut Audubon Societys Osprey Nation
volunteers -- were seen at more than 390 nests in 2017 including many along inland rivers and lakes
where they had been utterly absent for decades The Council once included Osprey population data in
these annual reports but discontinued that indicator when the Department of Environmental Protection
stopped counting them in 2004 Now that the Connecticut Audubon Society and its volunteers have
started their census-taking the Council intends to publish annual numbers after a few years of data are collected
Osprey over Fairfield
What is the Source of the Goal
The 1983 Northern States Bald Eagle Recovery Plan prepared by the United States Fish and Wildlife
Service established a goal for Connecticut of 20 breeding birds (10 nests) which was reached for the first
time in 2005 According to experts in the Bald Eagle Study Group Connecticut could eventually host up to
200 nesting eagles (100 nests) (See page nine of the linked document)
36
Rivers + Reservoirs
Public Drinking Water
The modest decline after 2013 reflects the discovery of water-treatment byproducts in a few medium-sized systems following a change in monitoring and reporting procedures
Every public water system submits monthly quality reports to the Department of Public Health (DPH) This
indicator shows the percentage of monthly reports that demonstrate full compliance after weighting the
reports to account for the number of people served by each system Though long-term problems occur
they are rare in large systems This indicator would show greater fluctuations if the larger utilities failed to
deliver good water
The list of systems with violations includes several chronic or repeat offenders that serve relatively small
numbers -- usually dozens sometimes hundreds -- of customers
By far the most common problem during 2017 in systems with violations was excessive levels
of chloride which is typical of most years Other violations included excessive levels of radioactive substances byproducts of disinfection and other chemicals
New rules became effective for small and medium-sized drinking water systems in late
2013 for measuring and reporting total trihalomethanes (TTHM) four chemicals that are byproducts of
using chlorine for disinfection during the treatment process The changes resulted in more violations being
reported in subsequent years Not all of the downward trend depicted in the chart above
necessarily reflects changes in the quality of the drinking water some of it could reflect post-
2013 reporting of TTHM that had been present in the water in prior years when such a presence was not
required to be reported as a violation If the TTHM violations were excluded from the chart the
percentage of water delivered in 2016 that met all standards would be about 997 percent (This
37
statistical exclusion is calculated only to add perspective to the apparent trend on the chart TTHMs are regulated because they have been determined to pose risks to human health)
A
Note
About
Lead
Lead contamination in Flint Michigan gained national attention in 2015 and 2016 Usually as in
Michigan large-scale lead contamination is a result of mismanagement The lead normally is not found
in the water source (such as reservoir river or well) The problem occurs when corrosive water enters
homes and schools through pipes that contain lead The Connecticut DPH oversees the monitoring for
lead by public water supplies and also requires public water to be tested for corrosive properties
(including pH) Lead contamination is an uncommon problem here generally affecting only very small
systems Lead is not included in the chart above
Data are not completely comparable across all states but federal reports suggest that Connecticut is
among the very best in delivery of safe water from public supplies This excellent record can be attributed
to many factors including Connecticuts policy of not permitting direct discharges of pollution into streams
that flow to drinking water reservoirs
About 85 percent of people in Connecticut are supplied by the public water systems included in the chart
above The other 15 percent rely on private wells which are not monitored by any government agency
and are not counted in this indicator An unknown but significant number of private wells are
contaminated by pollution or naturally-occurring toxins such as arsenic and uranium Residents who drink
from private wells are not required to test their water routinely so the number of people who drink contaminated water from private wells cannot be measured
The term detailed view on the chart refers to the fact that the vertical axis has been shortened beginning at 90 percent rather than the customary zero This allows the reader to see year-to-year differences which would be nearly imperceptible if the chart ran from zero to 100 percent
The standard for chloride is set by state regulation Violations are reported to the Department of Public Health but are not included in the Departments annual compliance reports that are submitted to the federal government
In preparing this years report the Council checked and recalculated previous years data which resulted in a modest change from last years report The percentage of water that met all standards that was delivered in 2015 was just under 99 percent not over
38
Mosaic Habitats
Some of Connecticuts wildest residents do not restrict
themselves to one particular type of habitat in fact they cant
They live among mature forest trees some of the time but at
other times require fields young forests shrublands or in many
cases clean waterways for their continued existence If this
mosaic of habitats is fragmented with roads and other intrusions
these species will decline To track the condition of these
productive mosaics in Connecticut the Council selected three
types of animals that depend on them turtles grouse and bats
Resident Turtles
Five of the eight turtle species that live year-round in Connecticut are on the latest list of species that are endangered or of special concern
Turtles are excellent indicators of ecological health They live long lives reproduce slowly and decline in
number when their habitat declines This indicator includes the eight species of turtle that live in
Connecticut (but not the four marine species that visit Long Island Sound in summer all of which also are
threatened or endangered)
Until 2015 only three of the eight resident turtle species were listed as endangered or of special concern
bog turtle (endangered) eastern box turtle and wood turtle (both species of special concern and
particularly representative of mosaic habitats) The other five -- common musk turtle common snapping
39
turtle northern diamondback terrapin eastern painted turtle and spotted turtle -- were considered stable
and secure enough to be kept off the list
The 2015 list classified two more species as being of special concern northern diamondback terrapin and
spotted turtle
Classification and protection of endangered species in Connecticut dates back to 1989 and the adoption of
An Act Establishing a Program for the Protection of Endangered and Threatened Species (Public Act 89-
224) The Department of Environmental Protection published the first list of Connecticuts Endangered
Threatened and Special Concern Species in 1992 At that time only the bog turtle was on the list The
wood turtle and the eastern box turtle joined the list in 1998 as species of special concern
The Goal for Turtles
The goal for all endangered and threatened species is for recovery of their populations to a stable
sustainable level
Ruffed Grouse
The Ruffed Grouse population recovered slightly after declining to its lowest level in decades
The chart illustrates a dramatic decline in Ruffed Grouse (Bonasa umbrellas) The annual index value is
the mean of population counts from the Christmas Bird Count and Summer Bird Count Once prevalent throughout the state this game bird is rarely seen outside the northwest corner where it
also is uncommon The most likely cause is a decline in young forests worsened by the effects of human
activities including roads development and introduction of invasive species and pests that have reduced
the vegetation favored by grouse Too many deer reduced the forest understory where the grouse lived
40
Grouse is an excellent indicator species for New England hardwood-dominated forested landscapes
Grouse have well-defined habitat requirements multiple stages of forest including newly disturbed forest
shrub openings and mature stands all within a 15 to 40 acre area Much like terrestrial turtles grouse are
sensitive to habitat fragmentation They are readily detected and recorded and do not migrate The mosaic habitats that support Ruffed Grouse also sustain many other species such as American
woodcock New England cottontail and numerous songbirds While 60 percent of Connecticut is forested
the Connecticut Department of Energy and Environmental Protection estimates that only five percent
contains the early-stage forest that grouse depend upon Recent efforts to create young forest habitat
might be one reason for the slight increase in sightings since 2015
The Goal for Grouse
The Association of Fish and Wildlife Agencies of which Connecticuts DEEP is a member prepared
a plan in 2006 that set a target of restoring the Ruffed Grouse throughout North America to 1980
population levels by 2025
Technical Note The CEQ Ruffed Grouse Index is based on the mean
of winter and summer bird counts conducted by volunteers This index is
the CEQs first use of these extensive troves of data collected by the
National Audubon Society and its affiliated organizations The scale of the
index value is set by the CEQ a value of 100 equals the highest
population level detected over the 20 years shown on the chart The
Council is grateful to the organizations and individuals who provided data
and advice for creating this new index
41
Mosaic Habitats
Bats
Cave-dwelling bat species have declined catastrophically
The chart above depicts the winter populations of three cave-dwelling bat species at caves monitored by
the Department of Energy and Environmental Protection (At one of the caves the decline was so
complete that monitoring ceased in 2011 in 2015 monitoring was discontinued at a second site) An epidemic fungal disease called white-nose syndrome (WNS) is the primary cause of the bats demise
WNS has been documented in at least 31 states since its first appearance in New York in 2006 Prior to
the spread of WNS (evidently caused by a fungus from Europe) these were the three most common cave-
dwelling bat species in Connecticut
Now all but one Connecticut bat species is listed as endangered or of special concern
The catastrophic decline that led to the classification in 2015 of three more species as endangered in
Connecticut has raised concerns about the future of bats here Of the eight species native to Connecticut
only the big brown bat is not categorized as a species of special concern or as endangered The big brown
bat also declined while it still is abundant enough to be kept off the endangered list in 2015 it added to
the list of species of Greatest Conservation Need in Connecticuts Wildlife Action Plan
42
Recovery if one occurs will be slow adult female bats usually produce just one pup per year Bats are mammals but the Connecticut Audubon Society included a review of these ecologically-important
aerialists in their 2013 report on the State of the Birds That report describes other challenges facing
species that collect their food on the wing several species of high-flying insect-catching birds have
undergone long-term decline in Connecticut though not to the same disastrous extent as bats The absence of bats from Connecticuts evening air will be a boon to the nocturnal moths and beetles that
continually threaten to infest forests and crops Nationally the loss to agricultural production has
been estimated to total billions of dollars annually Bats also eat many mosquitoes a number of which
carry diseases that affect humans birds horses and other animals Though seldom seen bats play big
ecological roles Not all bats live or hibernate in caves many inhabit trees If data become available future editions of this
report will contain information on the tree-dwelling species (three of which are on the list of species that
are of special concern and are represented on the chart above) The goal for bats is for recovery of all eight species to a stable sustainable level
43
Personal Impact
Driving
Driving Steady
Driving a car truck or sport utility vehicle is one of the most environmentally harmful activities a
Connecticut resident will engage in personally Impacts are direct (air pollution oil leakage etc) and
indirect (creating demand for new roads) In nearly every year for several decades the average
Connecticut resident drove more miles than in the previous year That trend halted in 2008 The reasons
for the decades of increasing vehicle use are complex and include the fact that most new development
was accessible only by private vehicle The drop in driving by Connecticut residents that began in 2008
mirrored the national trend As residents drove less gasoline consumption decreased and pollution was
reduced From 2007 through 2013 the miles driven by the average resident was on a steady decline The
slight increase in miles driven in 2014 followed the national trend Even as travel leveled off in 2016
gasoline consumption which began to rise in 2014 continued to rise apparently an effect of more
inefficient vehicles on the road Gasoline and diesel consumption is displayed on the Climate
Changers page
Personal impact indicators illustrate trends in behavior or practices that can be expected to influence the condition of tomorrows air water land and wildlife
44
Personal Impact
Riding
People got on the bus less often
In 2017 ridership on in-state local and commuter busses declined 55 percent from 2015 and 2016
making it the lowest ridership since 2010 In late 2016 CTtransit fare prices were increased in eight
transit service areas The fare increase might not be the sole reason for the decline in ridership Other
factors that could include success in ride sharing efforts (see below) and gasoline prices that have stayed
below the highs of some previous years
Riding a bus is just one way to avoid the negative environmental consequences of driving a car The
Department of Transportations transit and ride-sharing website helps commuters find the best way to get
to work or school and offers information amp resources for travel options throughout Connecticut Recent metrics from CTrides shows an increase in general program usage
Transit ridership is down nationwide
In 2015 new routes were added and CTfastrak service was launched on the Hartford to New Britain
corridor but total ridership remained about the same Ridership data collected by the Department of Transportation are estimated for 2016 and 2017 and will be refined in future reports
Personal impact indicators illustrate trends in behavior or practices that can be expected to influence the condition of tomorrows air water land and wildlife
45
Personal Impact
Compliance
More than 800 violations of environmental laws were detected in 2017 As usual the greatest number (by far) were found at gas stations and other facilities that store or
distribute petroleum ___________________________________
DEEP conducted more inspections in 2017 reversing a ten-year trend
Who is breaking Connecticuts environmental laws
To answer this question the Council reviewed the Notices of Violation (NOVs) issued by DEEP in (fiscal
years) 2011 through 2016 The conclusions of the first years analysis are summarized in an April
2012 staff memo and the violators are characterized in a series of charts The overwhelming majority of
businesses found to be in violation were small companies and most violations were related to the storage
transport or distribution of petroleum The largest group by far were gas stations and convenience
stores Only seven percent of NOVs were issued to manufacturers with more than 20 employees fewer
than the number issued to individual citizens
The Councils review of the 1098 NOVs issued in 2013 found similar data though the numbers of
inspections and violations were beginning downward trends that continue today Again the largest portion
46
were related to violations of laws pertaining to the storage or distribution of petroleum and most of the
laws broken were aimed at reducing the risk that pollution (from spills discharges leaks etc) would
occur in the future This was true again in 2014 when more than 1200 NOVs were issued in 2015 when
more than 900 violations were found and in 2016 which saw about 800 violations
___________________________
Focus on Pesticides
DEEP inspected 128 businesses -- mostly stores and certified applicators -- for compliance with pesticide
laws in 2016 These resulted in 26 NOVs and two other enforcement actions The greatest number of
violations (10) were found at the 25 stores inspected Only two were agricultural in nature
2017 Update The Council inspected the pesticides enforcement data for the first three quarters of 2017
(As noted in the footnotes indicators on this page only track data by federal fiscal year rather than
47
calendar year the federal fiscal year ends on September 30) With the issuance of nine NOVs in June
DEEP has issued a total of 15 NOVs for 2017 The chart below includes the Councils projection for all of
2017 (20 NOVs and two consent orders)
As recently as 2014 when DEEP had more staff it conducted more than twice as many pesticide
inspections (287) which resulted in 82 NOVs and eight other enforcement actions
Each year DEEP signs a cooperative agreement with the USEPA that projects pesticide enforcement
activity In 2016 DEEP devoted fewer than half of the projected hours to enforcement took fewer
samples and conducted about half of the projected inspections
Because NOVS carry no penalties a person violating pesticide laws bears only a slight risk of
being penalized With compliance rates as low as they are DEEPs shrinking enforcement presence
probably contributes to the large majority of violations going undetected It is impossible to calculate a
precise compliance rate as many inspections are prompted by complaints and are not conducted
randomly Information about reporting potential violations can be found on the National Pesticide
Information Center website
According to the USEPA inspections are the core of pesticide compliance monitoring
The Changing Tools of Enforcement
Faced with diminishing staff resources DEEP has streamlined enforcement procedures in some programs
resulting in issuance of notices to more violators Electronic submission of reports by permit-holders in
some programs also has allowed for more targeted enforcement To use the well-worn police-and-
speeders analogy this would be concentrating a smaller police force on the roads where speeding is
believed to be most prevalent with the result of more tickets being issued But targeted enforcement
alone might not explain the larger number of violations Numerous studies have shown that the average
speed on highways increases when drivers believe there are no police looking for speeders Is there an
analogous increase in environmental violations when people know that fewer inspections are being
conducted
Compliance and Environmental Quality
The role of compliance has changed For decades the extent to which people companies and government
complied with environmental laws had an immediate effect on the condition of the states environment As
compliance improved so did the air water wildlife and other natural resources With a few notable
exceptions such as some municipal sewage treatment facilities that still pollute large bodies of water from
time to time the current environment owes more to past compliance efforts than to current ones
According to the Councils analysis of enforcement data (see above) most violations and enforcement
48
actions now relate to the prevention of petroleum leaks and spills In contrast to those many sites that
are not violating any laws contribute enormous amounts of pollution to rivers and streams every time it
rains or in some cases pump so much groundwater that a stream dries up Compliance and enforcement
remain important for maintaining a habitable state but Connecticut residents should no longer expect
higher compliance rates (should they occur) to lead to dramatic improvements in statewide environmental
indicators
The Council has discontinued the Compliance Rate indicator
The Compliance Rate -- the percentage of inspections that find facilities to be in full
compliance -- was developed when physical inspections were more important to the states
enforcement of environmental laws Now that many violations are detected by other means
(such as reviews of monitoring reports submitted electronically cross-checking data
sources to find unpermitted facilities and following up on companies failures to respond to
initial notices) the Council has concluded that it is impossible to estimate the percentage of
companies that are operating in compliance with all environmental laws A reliable estimate
would depend on random sampling of regulated facilities but such sampling is not likely to
occur Instead faced with dwindling resources DEEP focuses enforcement on sectors where
violations are commonplace (as discussed below) With no Compliance Rate to report this
page now focuses on aspects of compliance that can be documented
Personal Impact indicators illustrate trends in behavior or practices that can be expected to influence the condition of tomorrowrsquos air water land and wildlife Notices of Violation (NOVs) are informal enforcement tools generally issued whenever DEEP detects one or more
violations at a facility They carry no financial penalty The recipient has 30 days to respond They can be issued for relatively minor or major violations in cases of the latter type the recipient might also receive an order which might carry a financial penalty NOVs typically outnumber orders by a factor of five or more in any year NOVs are good indicators of trends in violations because almost all violations found through inspections result in NOVs DEEP also
issues a smaller number of warning letters and those are included in the NOV totals above
For this indicator only years pertain to federal fiscal years (ie October 1 through September 30) not calendar years The projections for 2017 enforcement actions are based on extrapolations of the data from the first three quarters of the (federal fiscal) year Because it does not have any numbers for inspections conducted in 2017 the Council based the projected number of inspections on the historic ratio of enforcement actions to inspections
The analogy between speeders and environmental violators is imperfect at best Speeders hope to avoid a ticket that comes with a significant financial penalty A Notice of Violation (NOV) issued by DEEP on the other hand carries no financial penalty
49
Personal Impact
The latest statewide recycling data are from 2014 The chart will be updated when
the Council is able to obtain more recent data The text has been updated
Recycling Rate
Connecticut struggles to recycle It also struggles like many states and municipalities to gain an accurate
accounting of the waste recycled The 2014 (latest data available) recycling rate of 23 percent does not
include recycled wood or scrap metal Regardless of the precise recycling rate more needs to be done A
2015 study commissioned by DEEP found that about 16 percent of the stuff in Connecticuts garbage was
readily recyclable but did not find its way into recycling bins
What is the Source of the Recycling Goal
With adoption of An Act Concerning Connecticutrsquos Recycling and Materials Management Strategy in 2014 (Public Act
14-94 codified in Section 22a-241a of the Connecticut General Statutes ) Connecticut set a challenging goal for itself
to achieve by 2024 divert 60 percent of solid waste from disposal Diversion includes more than recycling
According to DEEPs Comprehensive Materials Management Strategy revised and adopted in 2016 it will be necessary
to boost recycling to 45 percent if Connecticut is to achieve the 60-percent diversion rate
The Strategy describes tactics to divert an additional 15 percent to get Connecticut to its goal of 60 percent The
Strategy also estimates the 2013 diversion rate to be about 35 percent Clearly progress will need to accelerate
Some types of waste can be handled through programs established by the industries that produce the products
Connecticut requires producers to establish opportunities for consumers to return electronic equipment mattresses
and unwanted paint for recycling and sees potential for more product take-backs The effectiveness of the existing
programs was evaluated in 2016
Recycling as mentioned above is not the only method for diverting waste from disposal Yard and food waste can be
composted or even converted to fuel as can agricultural waste Waste can be avoided altogether through more
efficient packaging Such tactics count toward the diversion rate
50
Personal Impact
This indicator will be updated when
the Council is able to obtain more recent data
Climate Changers
Connecticut residents were meeting the 2020 goal for carbon dioxide emissions from
2011 to 2014 but are no longer on track to meet the goal A rise in gasoline
consumption will move this indicator in the wrong direction
Certain gases in the air function like the glass of a greenhouse they allow the suns energy to pass
through the atmosphere to the ground then trap the heat that radiates from the ground These gases
often are called greenhouse gases Worldwide a build-up of greenhouse gases is contributing to the
ongoing rise in temperature Carbon dioxide is not the only greenhouse gas nor even the most powerful but carbon dioxide emissions are far greater in quantity than the others
The chart shows the total amount of carbon dioxide emitted in Connecticut from the burning of petroleum
products natural gas and coal divided by the population The most recent data available are from
2015 Data are estimates prepared by federal agencies which are adjusted by DEEP to better reflect
conditions in Connecticut Year-to-year fluctuations could be adjusted in future years The 2015 data were
revised slightly from last years report
51
Connecticut residents bought more gasoline in 2014 through 2016 reversing a long
trend toward greater efficiency
New Indicator Consumption of Motor Fuels (Gasoline and Diesel) Early in 2016 transportation (primarily
the combustion of gasoline and diesel fuel in vehicles) overtook power plants as the largest source of
carbon dioxide emissions in the United States Recent data for individual states are not yet available
but transportation had already been the largest source of carbon dioxide emissions in Connecticut
(about 36 percent) As residents buy more petroleum their carbon dioxide emissions rise After vehicles
the largest sources are power plants homes and industrial facilities
How the Goal Track on the top chart is calculated
State law sets two goals for greenhouse gas emissions reduce statewide emissions to 10 percent below
1990 levels by 2020 and 80 percent below 2001 levels by 2050 The top chart shows emissions per
Connecticut resident not total emissions The goals on the chart have been adjusted to account for the
growth in population that is projected for 2020 and 2050 Many more people are projected to be living in
Connecticut in 2020 and 2050 so the average resident will have to work that much harder to reduce
carbon dioxide emissions if the statewide goal is to be met
Connecticuts goals are in line with national and international estimates of the extent carbon dioxide
emissions from industrialized nations will need to be reduced in order to limit the rise in global mean
temperature to no more than 36 degrees Fahrenheit (20 degrees Celsius) above preindustrial
temperatures In December 2015 most countries of the world agreed to this limit and also a further goal to pursue steps to limit warming to no more than 27 degrees Fahrenheit (15 degrees Celsius)
Nationwide data are from the May 2018 Monthly Energy Review published by the US Environmental Information Administration (specifically pages 180 - 182) Technical Note This report represents only the federal data which had not been modified by DEEP at the time of publication The most significant of DEEPs adjustments to the federal data is for greenhouse gasses produced regionally for consumption in Connecticut The federal data only takes into account electricity produced in state The Council compared the federal and state data back to 2003 and determined that the trends were identical
52
Personal Impact
Electricity at Home and Work
At Home
The average Connecticut residents electric consumption continued to decline in 2017
Efficiency at Home The trend in average Connecticut household consumption of electricity has been
trending lower since 2013 (see technical note below) The uptick of 2015 came in a year of extreme
weather but a very hot summer in 2016 did not lead to a similar increase Nonetheless peak demand
remains excessive According to the Connecticut Siting Council peak demand occurs during hot humid
summer days when residents use air conditioning (See page 7 of linked document for details) A
significant percentage of Connecticut consumers do not purchase the most efficient air conditioners
(Appliance purchasing data for Connecticut previously was tracked in this report but became unavailable
after 2010 more recent national data show modest improvement in the market penetration of efficient
room air conditioners and central air conditioning including air-source heat pumps used for cooling)
Excessive electricity consumption in the summertime has had significant environmental consequences On
the hottest days Connecticutrsquos base-load power plants are unable to meet the additional demand and
older petroleum-fueled plants are brought online Because they are used sporadically some of these older
plants are permitted to operate with no pollution control equipment As a result state residents generate the most air pollution on the hottest summer days when air quality is already bad
The vast majority of Connecticutrsquos electricity is generated from nuclear energy and the combustion of
natural gas oil and other fuels Hydropower wind solar and other renewable resources are small but
growing sources of electricity Each source renewable or not has its own negative environmental
consequences Reducing those consequences will require Connecticut households to use electricity more
efficiently Such efficiency can be attained in part with ENERGY STAR appliances
53
Though the amount of solar photovoltaic (PV) panel installations has increased the number installed in 2017 is smaller than in any of the preceding three years
Residential Solar Energy Producers Thousands of Connecticut homes now use the sun to generate
much of their own electricity Legislation adopted in 2011 (CGS 16-245ff) set a goal of 30 megawatts of
new photovoltaic capacity installed on residential properties by the end of 2022 The Residential Solar
Investment Program of the Connecticut Green Bank (formerly the Clean Energy Finance and Investment
Authority) reports that this goal was exceeded in 2014 In 2015 the law was amended to continue
subsidies for residential photovoltaic installations until 300 megawatts is achieved or until 2022 The
Connecticut Green Bank estimates that by the end of 2016 it had assisted in the installation of 140
megawatts
For customers who do not sign up to purchase electricity from renewable sources a percentage of their
regular electricity service is required by statute to be from renewable sources that minimum percentage
was 21 percent in 2016 and will escalate to 27 percent in 2020 More than a dozen types of energy qualify
as renewable under this requirement Projects selected for renewable generation in Connecticut have
largely been solar photovoltaic facilities proposed to be built on farmland and forest as documented in the
Councils 2017 special report Energy Sprawl in Connecticut
54
At Work
Connecticuts businesses and industries continue to use energy more efficiently
Efficiency at work The chart shows the trend in the efficiency with which Connecticutrsquos economy uses
electricity to produce goods and services
Connecticuts businesses generally have been using less electricity to produce a unit of goods or services
Gross Domestic Product (GDP) is the total value of goods and services produced within the state in a
single year The federal Bureau of Economic Analysis (BEA) put Connecticuts 2016 GDP at $228 billion
(seasonally adjusted chained dollars) a decrease of one percent from 2015 At the same time
Connecticuts business and industrial sectors used slightly less electricity (measured by utility electricity
sales of electricity to commercial and industrial end users It is not known how much of the decrease in
electricity sales is due to installation of solar panels fuel cells or other alternative means of generation
The 2017 GDP is an estimate based on the first three quarters and will be adjusted in this report when the
BEA releases the actual totals
The Council investigated the question of whether the apparent long-term improvement in efficiency might
have been caused by a shift in Connecticuts economy from energy-intensive manufacturing to financial
services and other business sectors that consume less electricity That shift probably has been a factor
Manufacturing GDP grew from 2004 through 2011 (the most complete data available at the time of this
analysis) at a slower rate than the overall state GDP while the financial and health care sectors expanded
at a faster rate The latter sectors probably use less electricity to create a dollar of GDP in comparison to
manufacturing so their increasing importance to the states economy could make the overall business
sector appear more energy-efficient
Personal Impact indicators illustrate trends in behavior or practices that can be expected to influence the condition of tomorrowrsquos air water land and wildlife
55
Climate Notes
This section explains how climate change affects the environmental indicators in this report
Good Air Days The number of days with bad air is directly related to the number of days when the high
temperature exceeds 90 degrees (F) primarily as a result of the chemistry of ground-level ozone Also
the extra use of air conditioners on hot days leads to more pollution from power plants Connecticut is
forecast to see more hot days as the earths average temperature increases Unless summertime
emissions of air pollution are reduced the number of bad air days is likely to increase The correlation
between hot days and bad air is explained more fully in a 2017 technical document prepared by the
Department of Energy and Environmental Protection CEQ Air Pollution Index Air pollution and climate change are closely related Emissions of certain
pollutants into the air can result in changes to the climate which in turn has negative consequences for air
quality The US Environmental Protection Agency (EPA) states that while the US has made
progress over the last 40 years improving air quality climate change will make it more difficult to meet
pollution standards in the future Preserved Land The climate influences the structure and function of forest ecosystems and plays an
essential role in forest health Forests are sensitive to changes in temperature and precipitation and are
greatly affected by the expanding ranges of fire invasive species and disease outbreaks One study by the
United States Department of Agriculture (USDA) states that climate also affects the frequency and
severity of many forest disturbances Land conservation can help to reduce the impacts of climate change
by absorbing carbon dioxide from the air Farmland The extent of farmland in Connecticut depends greatly on farms profitability Climate change
may benefit some plants by lengthening growing seasons and increasing carbon dioxide However other
effects of a warmer climate such as more pests droughts flooding changes in atmospheric carbon
dioxide and ground-level ozone concentrations will be less beneficial for agriculture It is also noted in
one report published by the US EPA that warmer temperatures cause cows to eat less and produce less
milk negatively affecting agriculture that could reduce the output of Connecticutrsquos $70-million dairy
industry which provides 13 percent of the statersquos farm revenue Swimming Clamming and Heavy Rain As the atmosphere warms changes to the amount timing
distribution and intensity of precipitation will continue Warmer temperatures increase the rate of
evaporation of water into the atmosphere and increase the atmospheres capacity to hold water What
evaporates will fall as excess precipitation in many regions Over the past 50 years the amount of rain
falling during very heavy precipitation events has increased for most of the United States As more intense
precipitation leads to increased runoff more pollution is washed into waterways including sediments
nitrogen from fertilizers disease pathogens and pesticides The same factors that affect beaches present
problems for shellfish beds Plovers and Others Coastal-nesting birds such as the Piping Plover are among the species most
threatened by climate change Rising sea levels will reduce nesting areas available for many coastal and
nesting birds The Water of Long Island Sound Climate change has a variety of direct and indirect effects on ocean
ecosystems Increasing temperatures have the capability to make coastal and marine ecosystems more
vulnerable to hypoxic conditions as well as drive the expansion of hypoxic environments Temperature is
an integral component of how ecosystems and organisms generate hypoxic conditions In general warmer
water holds less dissolved oxygen than colder water As the estuaries and oceans heat up less oxygen is
held stratification of the Sound waters intensifies and deeper waters then lose even more oxygen As
temperatures increase some marine animals require more not less oxygen to survive In addition
the earlier arrival of summer results in the earlier development of hypoxia and the expansion of hypoxic
56
environments Precipitation also is important climate factor that can affect hypoxic rates and expansion Changes in precipitation patterns affect nutrient and hypoxic dynamics in coastal ecosystems
Trends Under the (Rising) Surface The Connecticut Institute for Resilience and Climate Adaptation
(CIRCA) recommending that Connecticut plan for and expect 50 centimeters (20 inches) of sea level rise
by 2050 with further increases following that date This much rise in water level is likely to have
devastating effects on local coastal communities and ecosystems
Rivers Streams and Rain Rivers and streams are affected greatly by fluctuations in precipitation and
evaporation patterns around the world Changes in the timing and location of precipitation combined with
rising levels of water pollution will strain ecosystems and threaten the survival of many fish and wildlife
species Warming temperatures are altering the water cycle and shifting precipitation patterns In many
areas rainfall has become either increasingly abundant leading to floods or dry streams An increase in
severe storms due to climate change will degrade water quality and increase the risk of catastrophic
floods On the other end of the spectrum frequent droughts enhanced evaporation and decreases in
overall annual rainfall result in reduced water levels in streams rivers and lakes which leaves less water
to dilute common pollutants It goes without saying that rising levels of pollution whether from too much
or too little precipitation will create a major strain on any ecosystem that relies on the freshwater
provided by streams rivers and lakes threatening the survival of many fish plant and wildlife species
In addition climate change will contribute to a general upstream movement of river zones particularly
affecting species bound to small streams and springs which cannot move further upstream
Bald Eagles Climate change affects the survival of bald eagles on multiple levels according to scientists
As climate change progresses the Audubon Societys climate model projects that Bald Eagles will have
just 26 percent of their current summer range by 2080 It is possible that the birds will adapt and reclaim
summer terrain as new areas become hospitable but it isnt known whether the birds will be able to find
the food and habitat they need to survive
Drinking Water Extreme rainfall events lead to more runoff when the soil simply is not able to absorb the
precipitation at the rate it is falling In urban suburban and agricultural areas this runoff will pick up
pollutants from the landscape and carry them to nearby rivers and other waterways ultimately affecting
the quality of drinking water In addition to more intense storms and flooding more frequent or longer dry
spells are also projected in many climate change scenarios Connecticut is expected to have more frequent
drought impacts A drought advisory was issued in 2016 in Connecticut According to the advisory
precipitation amounts were lower than average
Turtles and Grouse Some North American Turtles face an uncertain future as a warming climate
threatens to reduce their suitable habitat according to a 2013 study This is particularly true for turtle
species in the eastern United States Their evolutionary history suggests that they will not be able to
adapt to rapid changes caused by global warming
Climate change has led to declines in forest species that are closely associated with the ruffed grouse This
habitat loss will continue to reduce grouse populations overtime Adequate snow cover can also be
important for overwinter survival in grouse populations as they burrow into deep snow during cold winter
periods Warming temperatures will likely change the quantity and characteristics of snow making snow
roosting more difficult for the grouse
Bats As temperatures increase with climate change bats habitat range is expected to shift in a northerly
direction or to higher elevations Bats also are migrating earlier in the season A change in bat migration
patterns can affect their ability to reproduce and the resources they need to survive Changes in
temperature will also affect hibernation periods and the availability of resources for bats in the future if
bats are induced to emerge from hibernation early A recent study even suggests that a changing climate
could affect the ability of some bat species to hunt effectively using sound
Driving and Riding Burning gasoline and diesel releases carbon dioxide a greenhouse gas into the
atmosphere Both nationally and in Connecticut the transportation sector is the greatest contributor
to climate change
57
Compliance As climate change makes puts Connecticuts environmental goals harder to achieve more
will be expected of business and industry to reduce pollution If the percentage of people and businesses
who fail to comply with environmental laws remains constant then more violations can be expected as
regulatory burdens expand
Climate Changers The Climate Changers web page describes how emissions of carbon dioxide increase
climate change There also is a feedback loop with warmer summer temperatures more people are
induced to use air conditioning and to use it more often with the result that emissions from power plants
increase
Electricity at Home and Work A 2015 paper published in the Proceedings of the National Academy of
Science examines the global potential for air conditioning use As incomes rise and global temperatures go
up people buy more air conditioners This creates a feedback loop of increased warming and increased air
conditioner use leading to more electricity demand more emissions and more warming
Renewable energy is one of the most effective tools against climate change The sun provides a
tremendous resource for generating clean and sustainable electricity without toxic pollution or global
warming emissions Solar panels do not release any emissions as they generate electricity Emissions are
released during the manufacturing transportation installation maintenance operation and demolishing
of these solar energy systems while these emissions are minimal in comparison to emissions created by
burning petroleum or coal they reinforce the point that efficient use of electricity is warranted regardless
of its source Wasted electricity always has impacts
Invasions Global warming threatens to increase the extent frequency and severity of invasive species
The milder winters and extended spring that comes with climate change are helping invasive species
extend their ranges pushing aside native species and transforming habitats The removal of temperature
or moisture constraints will allow species to move into and successfully invade new areas Species range
shifts will also lead to native species moving out of their current habitat or becoming more rare This
creates ecological space for other species to increase in abundance and become invasive or for non-native
invasive species to move in Invasive species are well adapted to thrive in environments with high
resource availability predicted under climate change scenarios Climate change will in many cases lead to
a future of warmer temperatures and increased carbon dioxide availability allowing some species to
invade new environments Research has shown that some invasive species show a greater response to
increased carbon dioxide than non-invaders In addition invasive species have short life spans strong
dispersal abilities and high environmental tolerances all of which lead them to adapt to rapid changes
Extreme weather events may lead to increased disturbance and invasive species generally thrive in
disturbed landscapes with high light availability and fragmented communities In other words invasive
species are adapted to living in disrupted environments
58
Activities of the CEQ in 2017
Research and Reports
The Council published the states annual environmental quality report in April 2017 and published an
update when supplemental data arrived in June
The Council continued to develop new indicators of ecological health The current report includes a new
indicator for invasive mosquitoes The development of biological indicators requires considerable care in
the selection of appropriate species and the Council is grateful for the advice it received from experts
Residents brought several deficiencies in current laws and policies to the Councils attention which led to
considerable research and drafting of special reports
Early in 2017 the Council published Energy Sprawl in Connecticut a special report that analyzed
the reasons that large solar energy facilities were being constructed predominantly on farmland
and forests The Council recommended changes to state law that would help to steer such projects
toward industrial land or other appropriate sites Public Act 17-218 included most of these
recommendations and the Council expects considerable improvement in the selection of locations
for solar facilities
In December the Council published Environmental Enforcement in Connecticut Part 1 Pesticides
This special report documented the decline in the Department of Energy and Environmental
Protectionrsquos (DEEPrsquos) ability to enforce pesticide laws It now is highly unlikely that someone
violating state pesticide laws will be penalized Pesticides also were the subject of citizen
complaints and comments during the year
The Connecticut General Assembly directed the Council to consult with the Water Planning Council
regarding an environmental study of the City of New Britains proposal to allow the expansion of a surface
mining operation into a drinking water supply watershed The Council reviewed the proposal for the study
and after a series of meetings with the citys consultants approved a plan for a more thorough and
comprehensive study than what had been described in previous documents The Council also was required
to review the final report which was submitted to the Council in February 2018 The Councils
final comments were submitted to the city in May 2018
As 2018 began the Council discussed the public trust in natural resources after citizens told the Council
that the matter had become controversial following its insertion into the draft State Water Plan It
published Connecticut Residents and the Public Trust in Air Water Wildlife and Other Resources in March
2018 to help guide public discussion of the issue
Advice to other Agencies
Council staff reviewed Environmental Impact Evaluations prepared by other agencies and submitted
comments where required The Council also provided recommendations to the Office of Policy and
Management regarding the requirements of the Connecticut Environmental Policy Act and responded to
the Connecticut Siting Councilrsquos solicitation of comments on several proposed facilities
Following up on prior concerns about a state-funded and state-permitted boat-launch facility that now is
infested with the dreaded invasive plant Hydrilla the Council submitted detailed comments and
recommendations to DEEP when the new permit was being considered with the goal of helping to avoid a
potential ecological catastrophe
59
Citizen Concerns and Complaints
State law directs the Council to investigate citizen complaints alleging violation of any statute or regulation
in respect to environmental quality
In 2017 citizens spoke at Council meetings to express concerns about potentially contaminated soil in a
municipal park the proposed location for a firearms training facility several proposed locations of utility-
scale solar energy facilities plans for allowing mining on watershed lands Phragmites and other invasive
species pesticide misting devices and other concerns
In addition staff received complaints and inquiries regarding emissions from large trucks runoff from an
animal facility the large Gypsy Moth infestation of 2017 drainage from state bridges wetlands violations
and many others
The Council investigated all of the complaints it received and offered recommendations to the relevant state agencies where warranted and pursued the solutions until they were implemented
At its regular monthly meetings the Council heard from many people and organizations including DEEP
Office of Policy and Management Department of Public Health Torrington Water Company New Britain
Water Department and its consultants Highstead Rescue Candlewood Mountain Environment and Human
Health Inc Rivers Alliance of Connecticut and others
60
Council Duties
The main responsibilities of the Council on Environmental Quality are described in Sections 22a-11
through 22a-13 of the Connecticut General Statutes
The Council is a nine-member board that works independently of the Department of Energy and
Environmental Protection (except for administrative functions) The Chairman and four other members are
appointed by the Governor two members by the President Pro Tempore of the Senate and two by the Speaker of the House The Councilrsquos responsibilities include
1 Submittal to the Governor of an annual report on the status of Connecticutrsquos environment including
progress toward goals of the statewide environmental plan with recommendations for remedying
deficiencies of state programs
2 Review of state agenciesrsquo construction projects
3 Investigation of citizensrsquo complaints and allegations of violations of environmental laws
4 Review of environmental impact evaluations that state agencies prepare for major projects under the
Connecticut Environmental Policy Act (CEPA)
5 Publication of the Environmental Monitor the site where all state agencies must post their scoping
notices and environmental impact evaluations under CEPA The Environmental Monitor also is the official
publication for notice of intent by state agencies to sell or transfer state lands
In 2016 Public Act 16-61 instructed the Council to review the environmental study on a proposed change
in use of New Britain Water Company Land Those duties extended into 2018
Acknowledgments
The Council appreciates the assistance of the many people in the Departments of Agriculture Energy and
Environmental Protection Transportation and Public Health and the Connecticut Siting Council who
provided data
The Council especially thanks the many citizens businesses and organizations who offered information
and viewpoints to the Council throughout the year
The Council also appreciates the work of its Executive Director Karl Wagener and Environmental Analyst Peter Hearn in drafting this report for review by the Council and preparing the final version for publication
The Council notes the valuable contributions of three interns in 2017 and early 2018 Jeffrey Hannan
(Washington University in Saint Louis) Blair Frantz (recent graduate Trinity College) and Paul MacGillis-Falcon (University of Connecticut)
New Mosquito Indicator Blair Frantz created the new indicator She received data and advice from the
Connecticut Agricultural Experiment Station and the federal Centers for Disease Control and Prevention
Image Credits The overheating earth symbol used to denote indicators affected by climate change
was created by Tracey Saxby Integration and Application Network University of Maryland Center for
Environmental Science The photograph of the Chimney Swift on the Good Air Days page was taken by
Julian Hough The photograph of the Scarlet Tanager on the Forest and Forest Birds page was taken by A
J Hand The Osprey on the Bald Eagle page is part of a photograph taken by Anastasia Zinkerman The
Ruffed Grouse on the New in This Edition page is part of a photograph taken by Paul Fusco The image of
the Asian tiger mosquito on the Invasions page was provided by James Gathany and the Centers for
Disease Control and Prevention The Council greatly appreciates their generosity in allowing the use of
these excellent photographs in this report
61
CEQ Members
Susan D Merrow Chair
Resident and former First Selectman of East Haddam Member East Haddam Conservation Commission
Board Member Eightmile River Wild and Scenic Coordinating Committee Former President Connecticut
Conference of Municipalities Former President National Board of Directors Sierra Club Author One for
the Earth Journal of a Sierra Club President Board Member Connecticut League of Conservation Voters
Former Trustee Connecticut River Watershed Council
Janet P Brooks
Resident of Middletown Attorney with law office in East Berlin with a practice in environmental
administrative and land use law Member of the Connecticut Bar Association Planning amp Zoning Section
and Environment Section Co-author of Connecticut Environmental Protection Act Volume 15 of the
Connecticut Practice Series published by Thomson West Formerly Assistant Attorney General in the
Environment Department of the Connecticut Attorney Generalrsquos (AGs) Office for 18 years enforcing the
statersquos environmental laws running the gamut from noise odor water pollution air pollution pesticides to
habitat protection and preservation of land While at the AGrsquos Office coordinated the wetlands appeal
practice and developed the legal training for wetlands commissioners for DEEPrsquos annual training Recipient
of 1984 German Marshall Fund grant to study the effect of citizen participation on hazardous waste clean-
ups in four European countries Based on those experiences authored a chapter published in Americarsquos
Future in Toxic Waste Management Lessons from Europe Staff Attorney for five years at the Connecticut
Fund for the Environment Inc representing citizens groups in administrative and court proceedings
Began practice of law assisting the Middletown City Attorney in the cityrsquos opposition to the utility
companyrsquos burning of PCB waste oil within the city boundaries
Alicea Charamut
Resident of Newington Lower River Steward at the Connecticut River Conservancy (formerly the
Connecticut River Watershed Council) Long-time grassroots advocate for Connecticuts water resources
Board of Directors Rivers Alliance of Connecticut Chair Connecticut Council of Trout Unlimited
Secretary Fisheries Advisory Council
Lee E Dunbar
Resident of Mansfield Retired Previously Assistant Director Bureau of Water Management and Land Re-
Use Planning and Standards Division Connecticut Department of Environmental Protection Responsible
for developing scientifically defensible water quality standards and criteria to protect human health and
aquatic life Developed and implemented environmental monitoring and assessment methods Participated
in the development of regulations to better manage stream flow in Connecticut streams affected by water
withdrawals and diversions Oversaw the development of regulatory programs including the Total
Maximum Daily Load (TMDL) Program Nitrogen Trading Program and Water Quality-based Discharge
Permitting Program Awarded Lifetime Achievement Environmental Merit Award by the US EPA in 2010
for significant contributions to environmental awareness and problem solving Board Member Eastern
Connecticut Forest Landowners Association Board Member Wolf Den Land Trust
Karyl Lee Hall
Resident of Branford Attorney with the Connecticut Legal Rights Project Formerly with Murtha Cullina
the Connecticut Fund for the Environment and Connecticut Legal Services Member Branford Conservation
Commission Chair from 2005-2015 Former Board Member Connecticut League of Conservation Voters
Co-chair Scenic Roads Advisory Committee for Routes 146 and 77 Member Advisory Board Branford
Land Trust Vice President Citizens for Branfords Environment 2002-2009 Connecticut Bar Association
Pro Bono Service Award 2003 Former Co-chair State Implementation Plan [for Air Management]
Revision Advisory Committee
Alison Hilding
Resident of Mansfield Long-time advocate for the environment and children viewing the protection of
clean water and air as important dimensions of child advocacy President Mansfield Environmental Trust
Commissioner and Executive Board Member Connecticut Commission on Children 2003 to 2016
62
Founding member Mansfields Citizens for Responsible Growth Background in financial management
worked for NYNEX Corporation on the capital budget with responsibility for growth and modernization
currently engaged on the grassroots level in promoting streambelt protective zoning and sustainable land
use practices in Mansfield and the northeast corner of CT Member of various CT environmental
organizations
Kip Kolesinskas
Resident of Manchester Consulting Conservation Scientist Current projects include assisting agencies
NGOrsquos and private individuals with farmland protection land access and affordability for new and
beginning farmers farmland restoration and climate change adaptation strategies Member of the
Working Lands Alliance Steering Committee and has contributed to numerous publications and initiatives
including Conservation Options for Connecticut Farmland Planning for Agriculture-A Guide for Connecticut
Municipalities and the award-winning training videos for CT DEEPrsquos Municipal Inland Wetlandrsquos Agency
Training Program Formerly USDA Natural Resources Conservation Service State Soil Scientist for
Connecticut and Rhode Island where he worked extensively with farmers educators government and
nonprofits to help them protect farmland and wetlands and use soils information to make better informed
land use decisions He is a recognized regional and national speaker on soils and land use planning
farmland protection climate change adaptation farmland access and wetlands
Matthew Reiser
Resident of Avon Environmental health and safety consultant with over 20 years of experience
performing regulatory compliance auditing planning training and reporting air water and waste
discharge permitting and air water and waste sampling for industrial commercial municipal and
institutional facilities Member Connecticut Chapter of the Academy of Certified Hazardous Materials
Managers Member Connecticut Marine Trades Association Environment Committee
Charles Vidich
Resident of Ashford Environmental and land use consultant concerned with energy efficient and
sustainable patterns of development Served as manager of the United States Postal Service Corporate
Sustainability Initiatives program with responsibility for sustainability energy efficiency and environmental
management systems for the nationrsquos 32000 domestic and overseas Post Offices Previously served as
the principal planner for the Central Naugatuck Valley Council of Governments where he developed solar
conscious land use ordinances and the nationrsquos first comprehensive regional plan of development
Appointed to the Connecticut Land Use Education Council with the mission to improve the skills and
resources available to local planning and zoning commissions Received the Lifetime Achievement Award
from EPArsquos National Sustainable Materials Management program Appointed a visiting scientist to the
Harvard School of Public Health as well as the Harvard Humanitarian Initiative where he lectured on
scientific approaches to the use of quarantine and the environmental control of communicable disease He
served as the pivotal expert witness in a celebrated Connecticut Supreme Court case that successfully
overturned restrictive zoning regulations and in a federal district court case that successfully overturned
discriminatory land use practices
We would like to hear from you Does this report give you the information on Connecticuts
environment that you need Is there something missing
79 Elm Street
Hartford CT 06106
Phone 860-424-4000 (messages can be left 24 hours a day)
Fax 860-424-4070
karlwagenerctgov
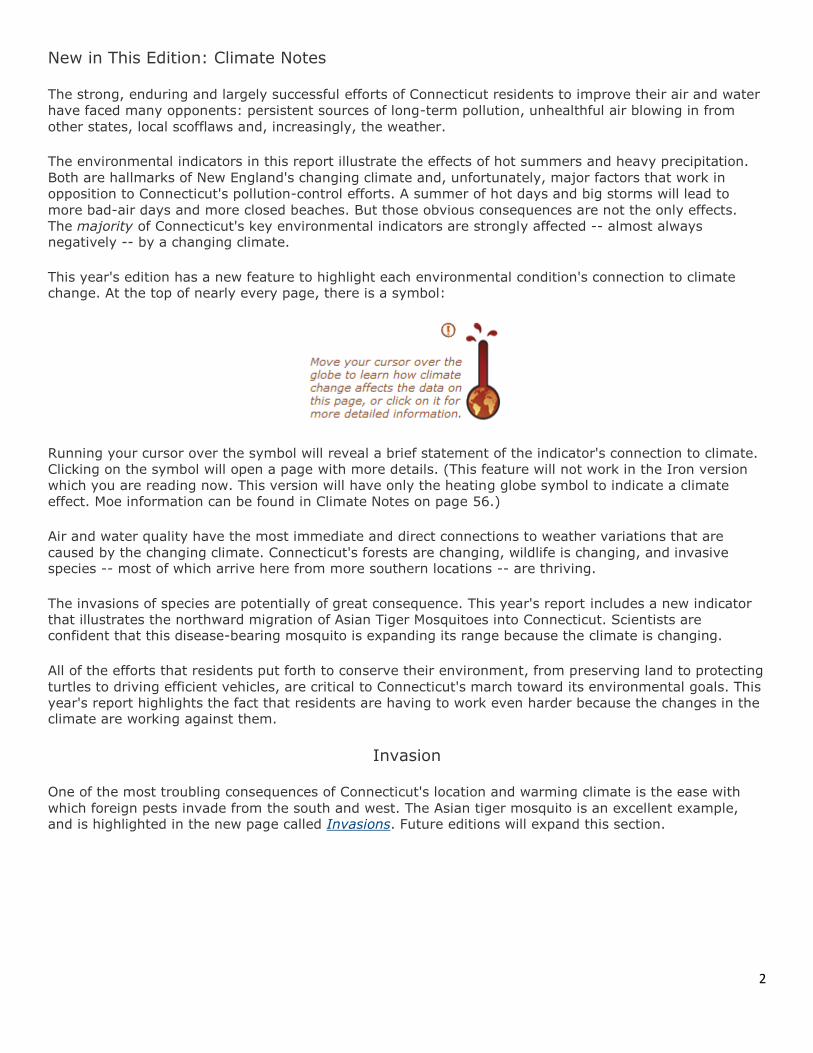
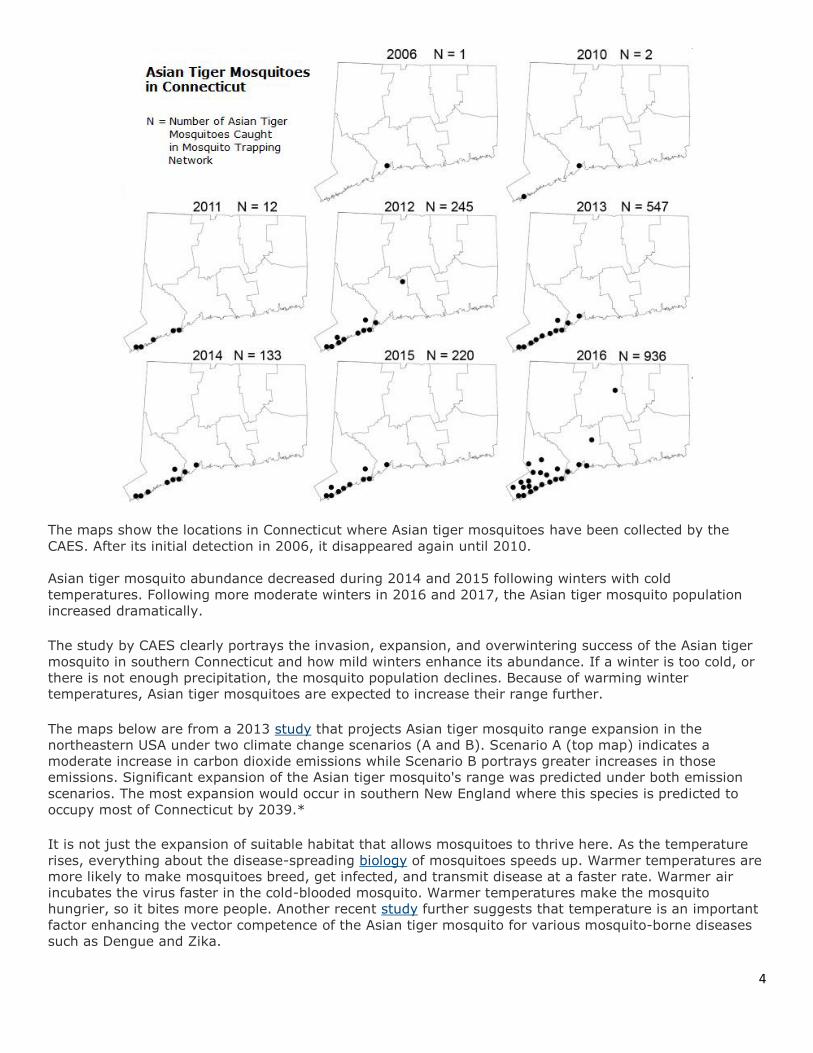
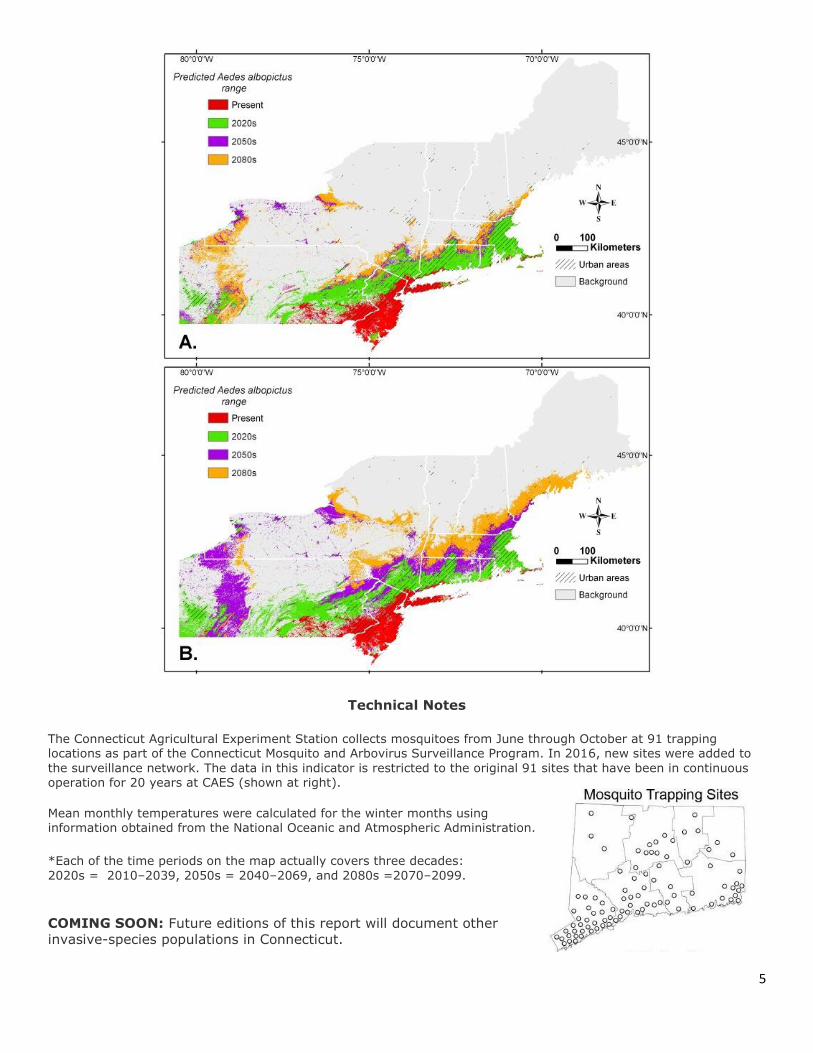
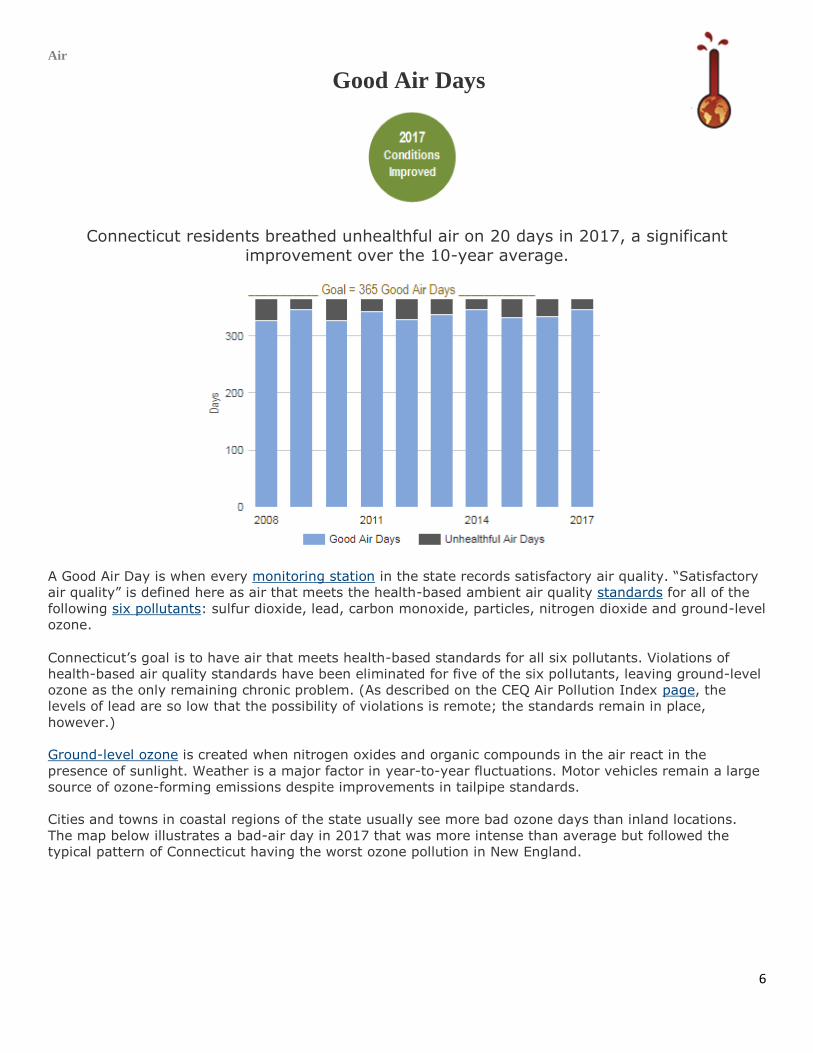
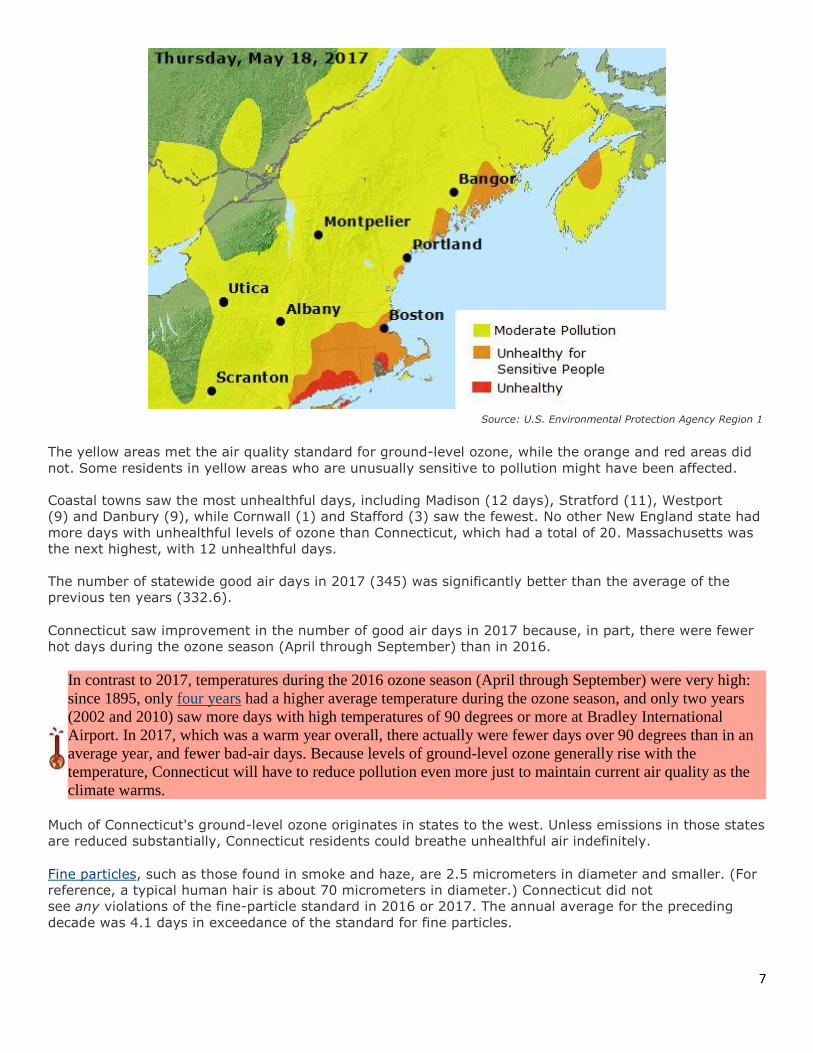
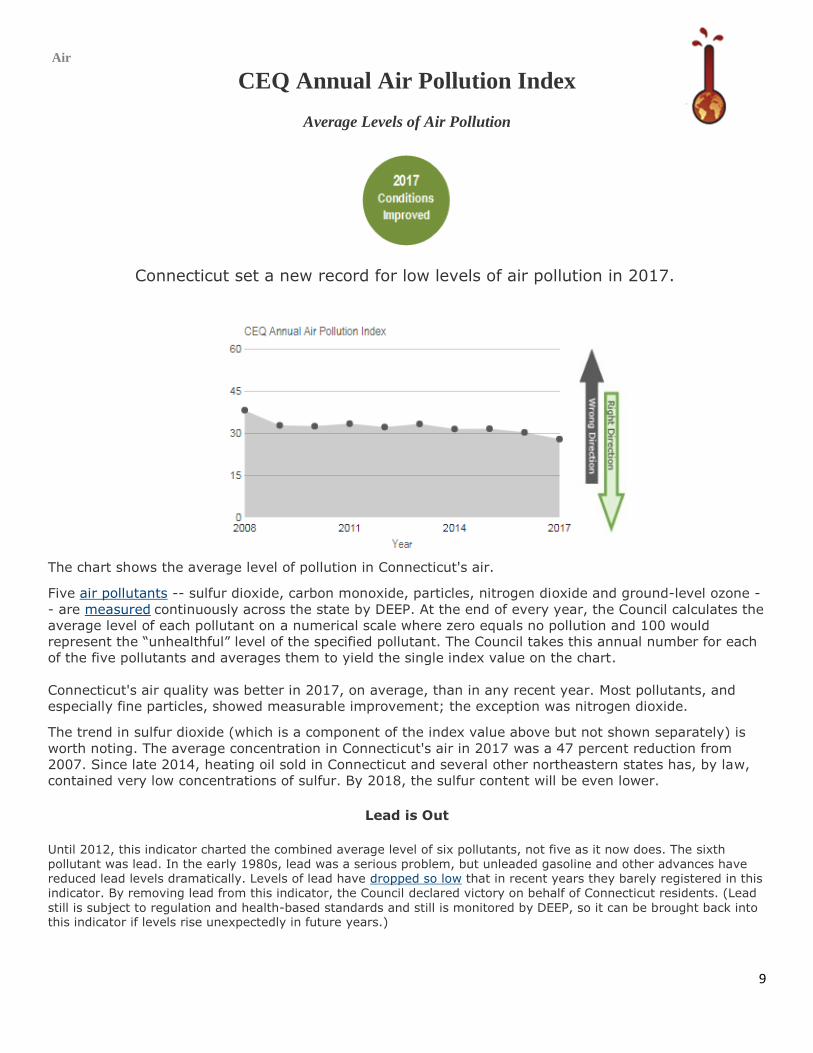
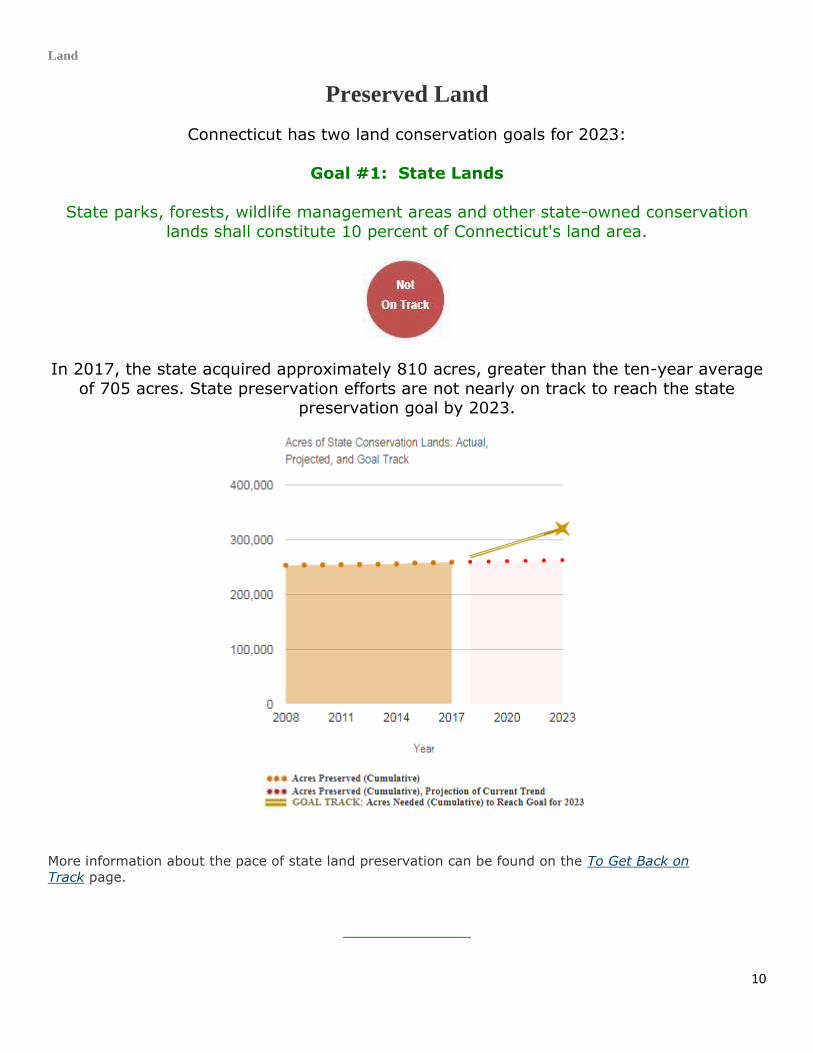
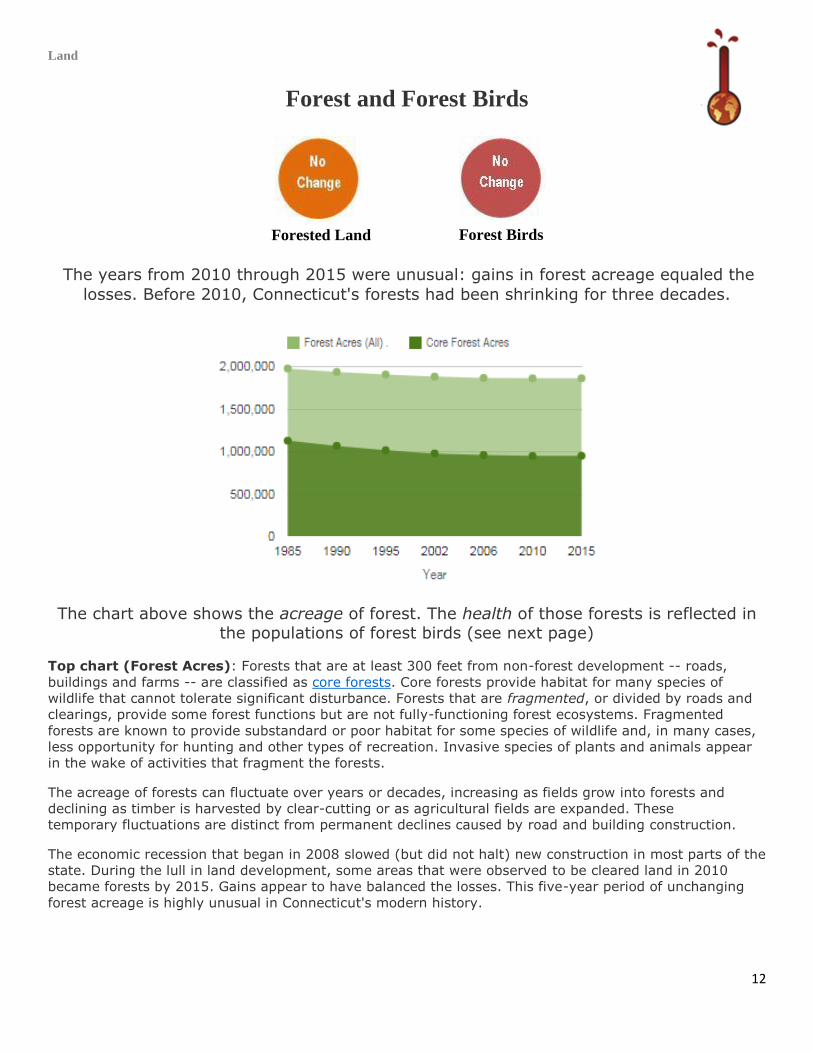
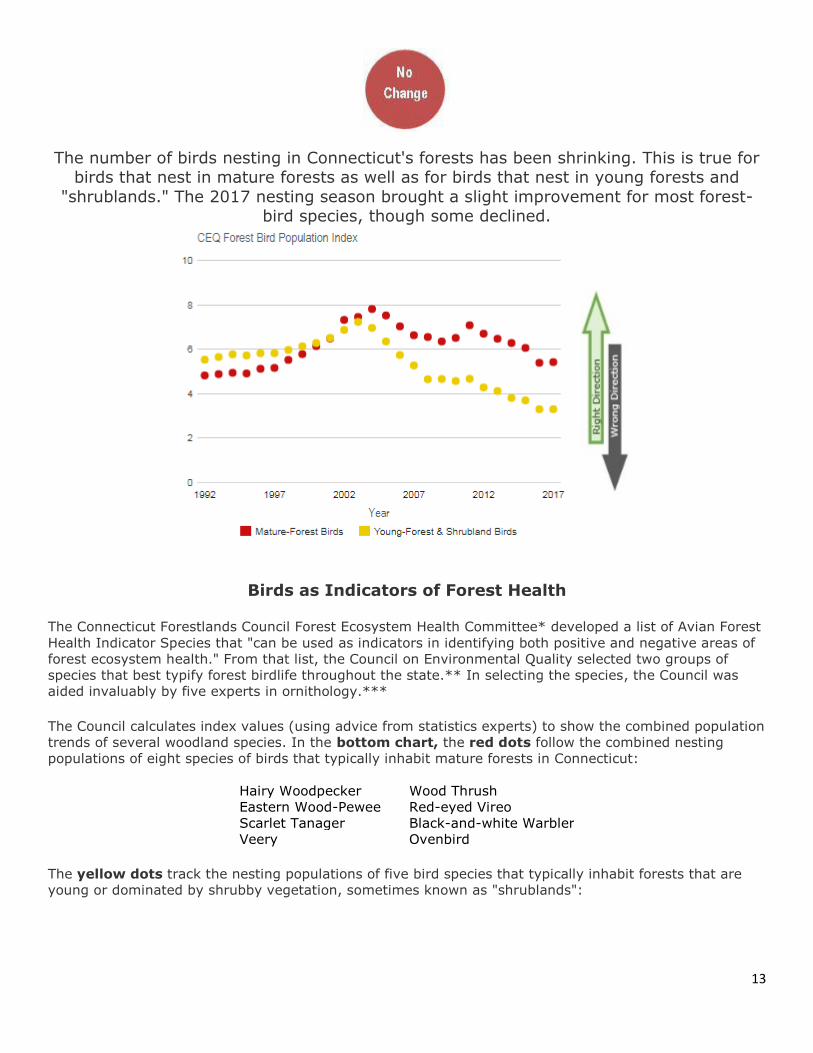
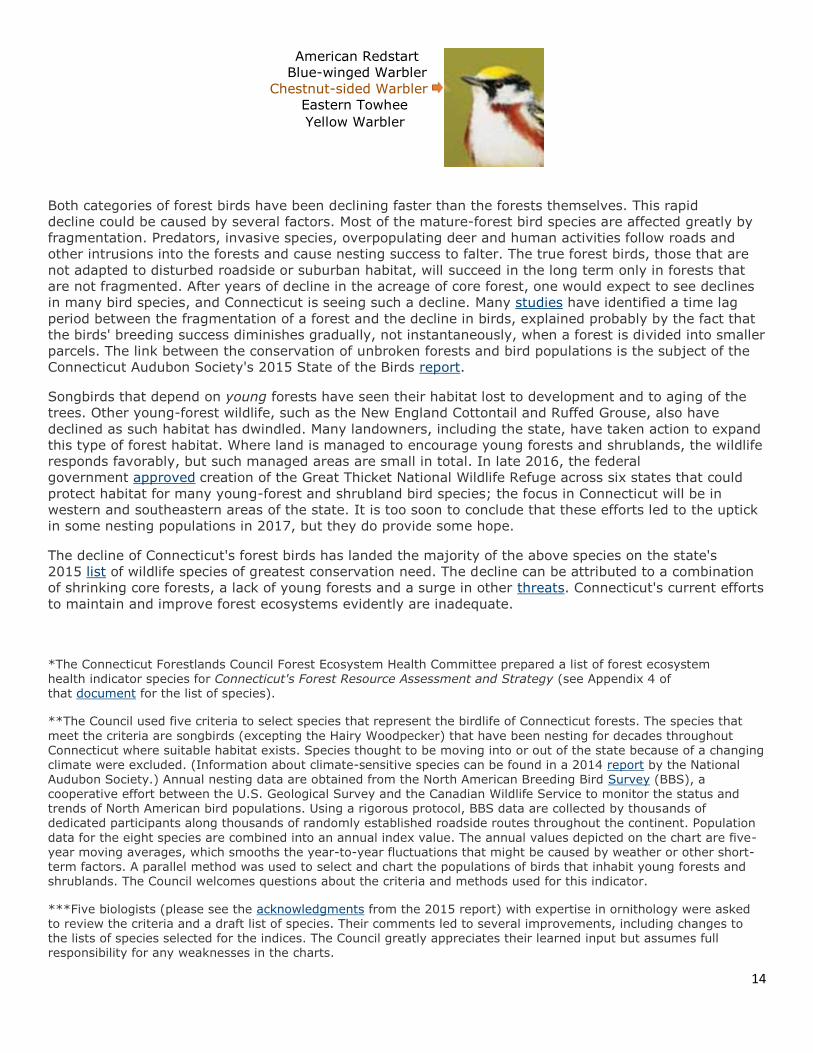
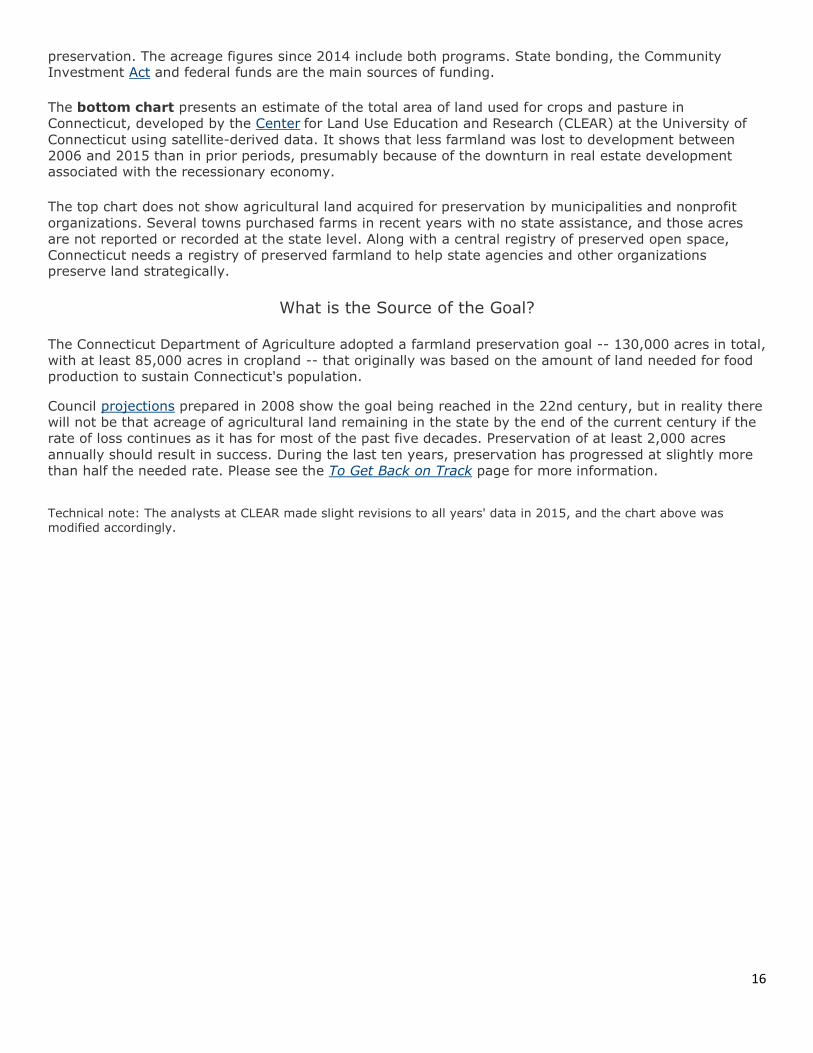
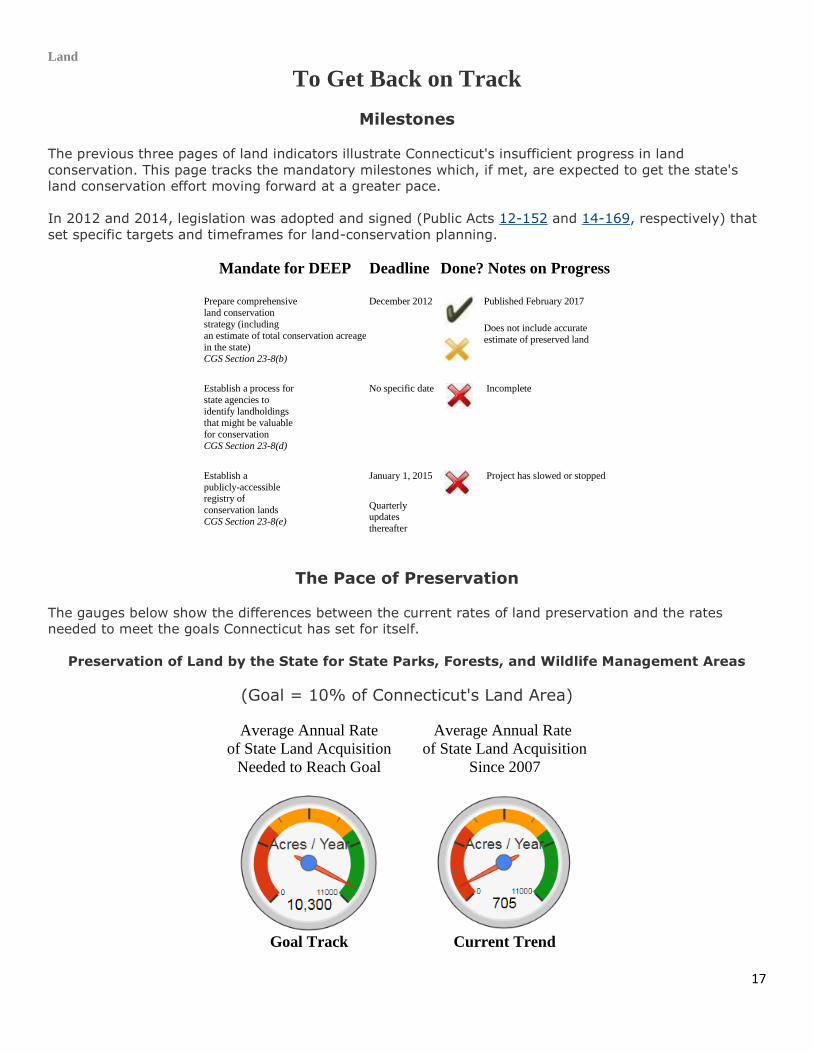
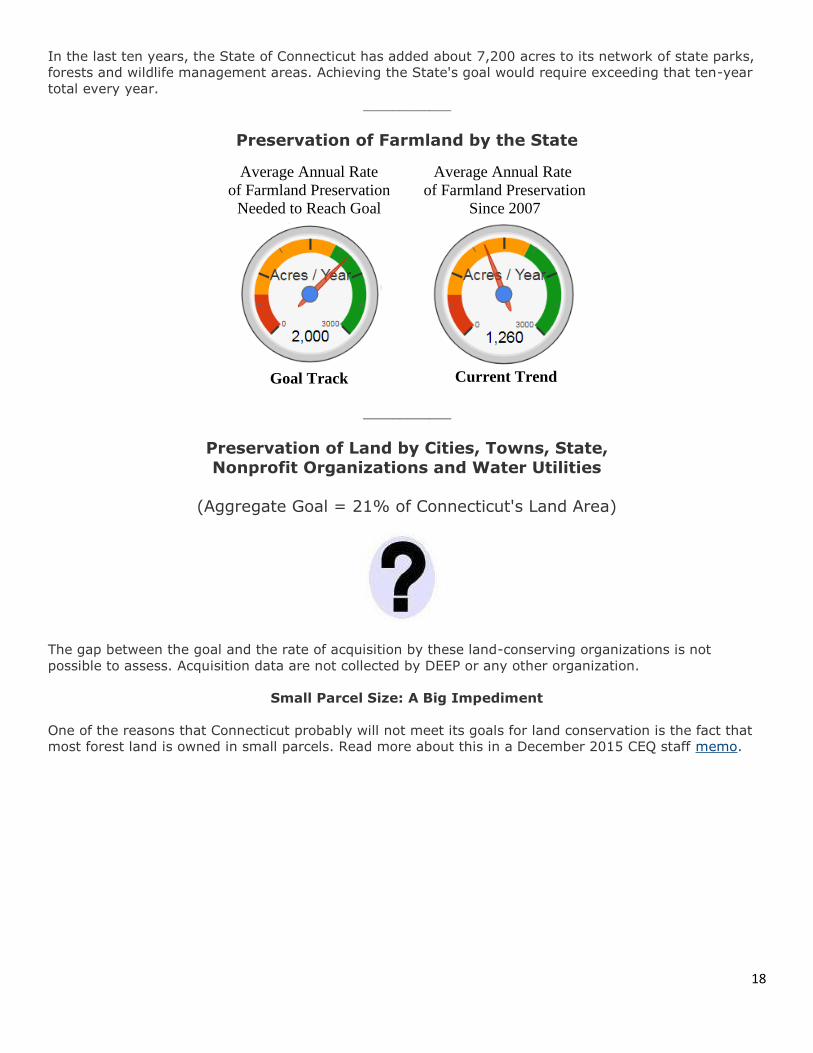
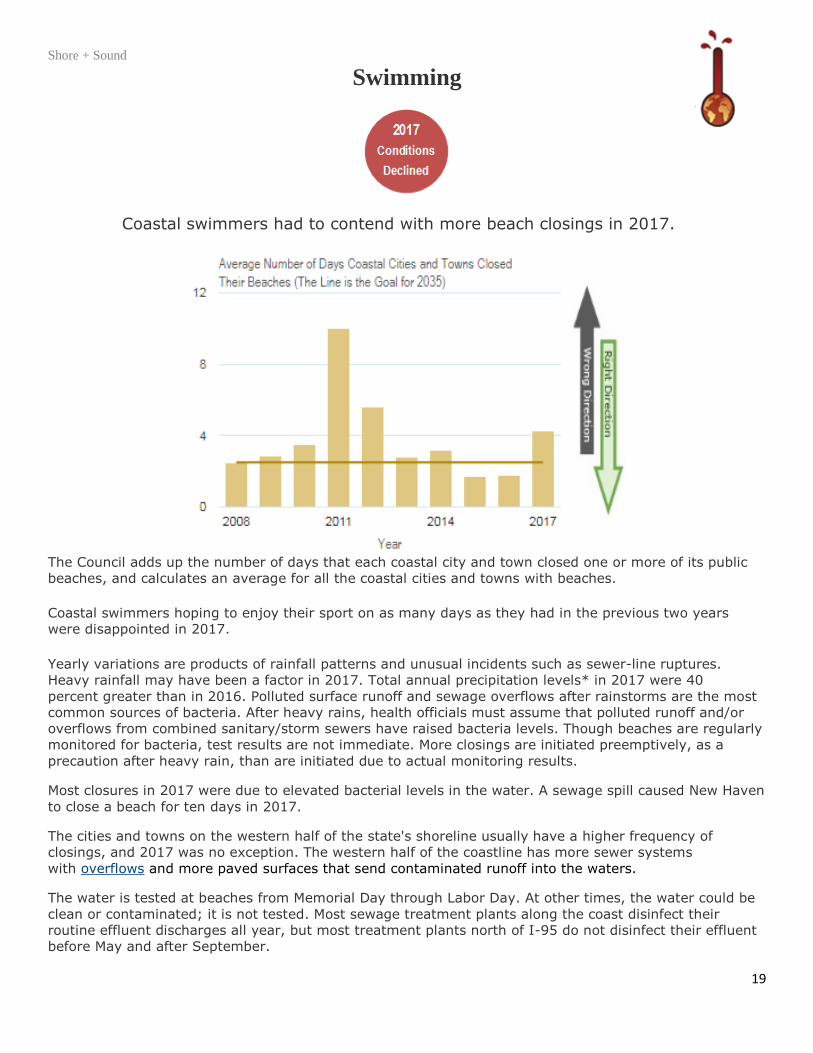
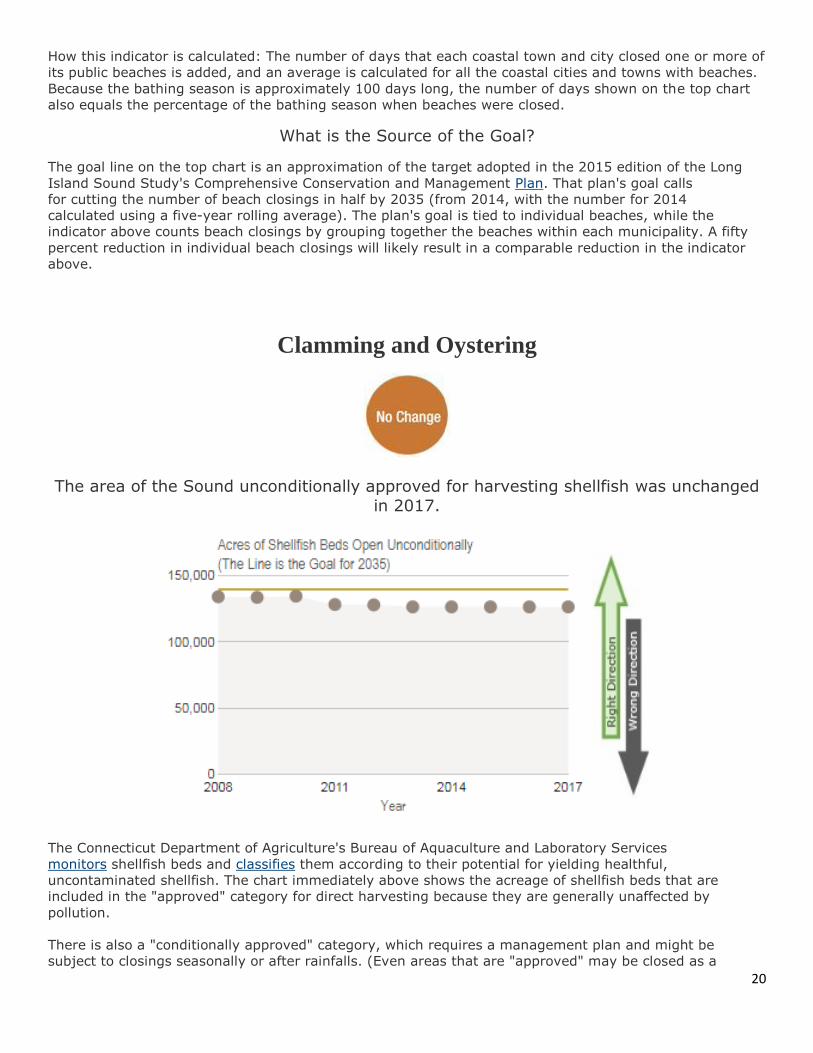
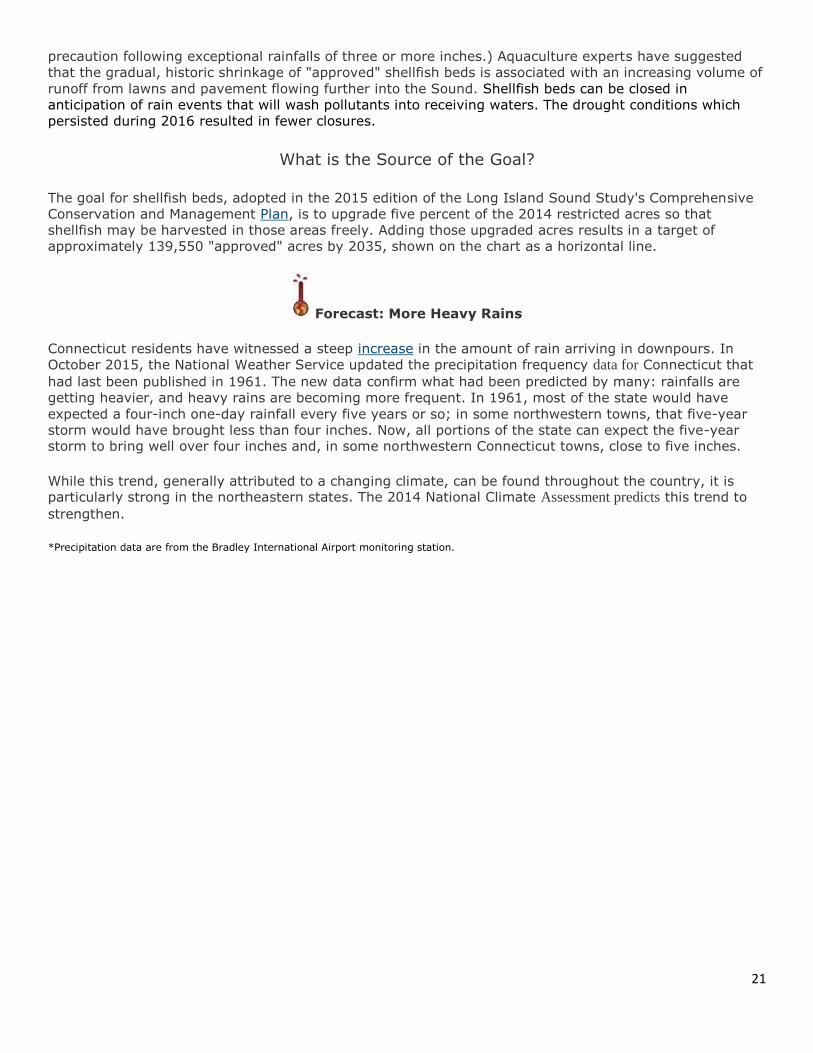
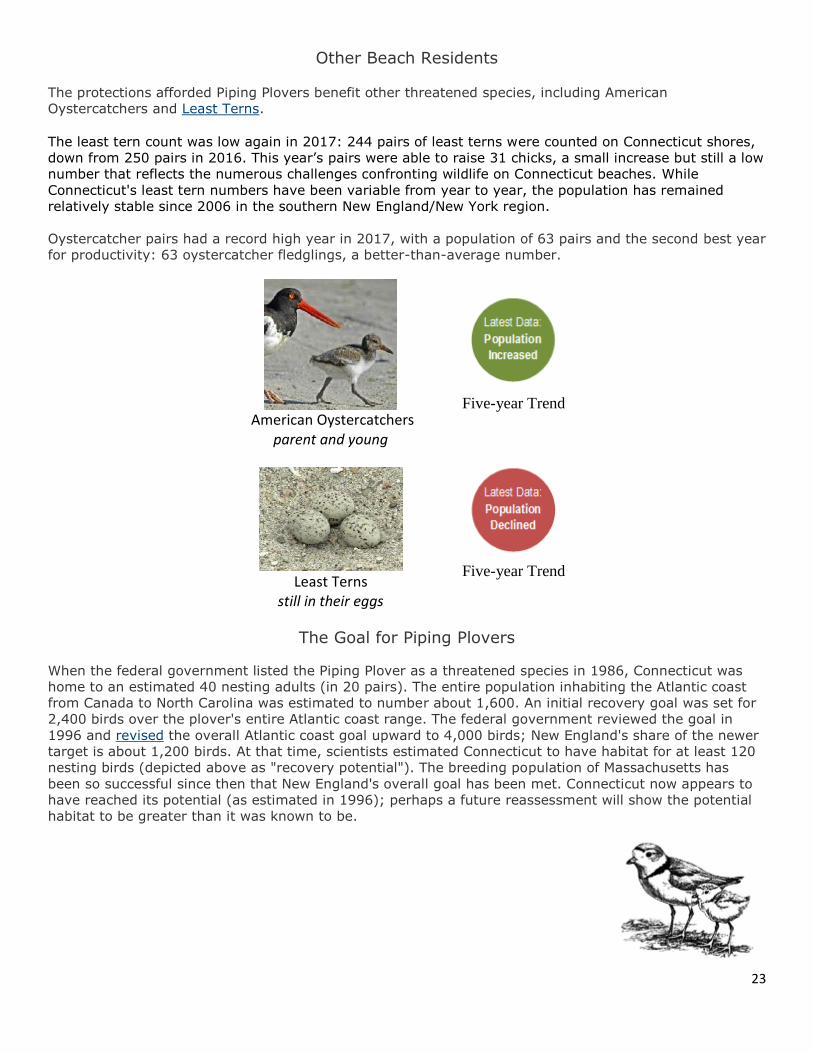
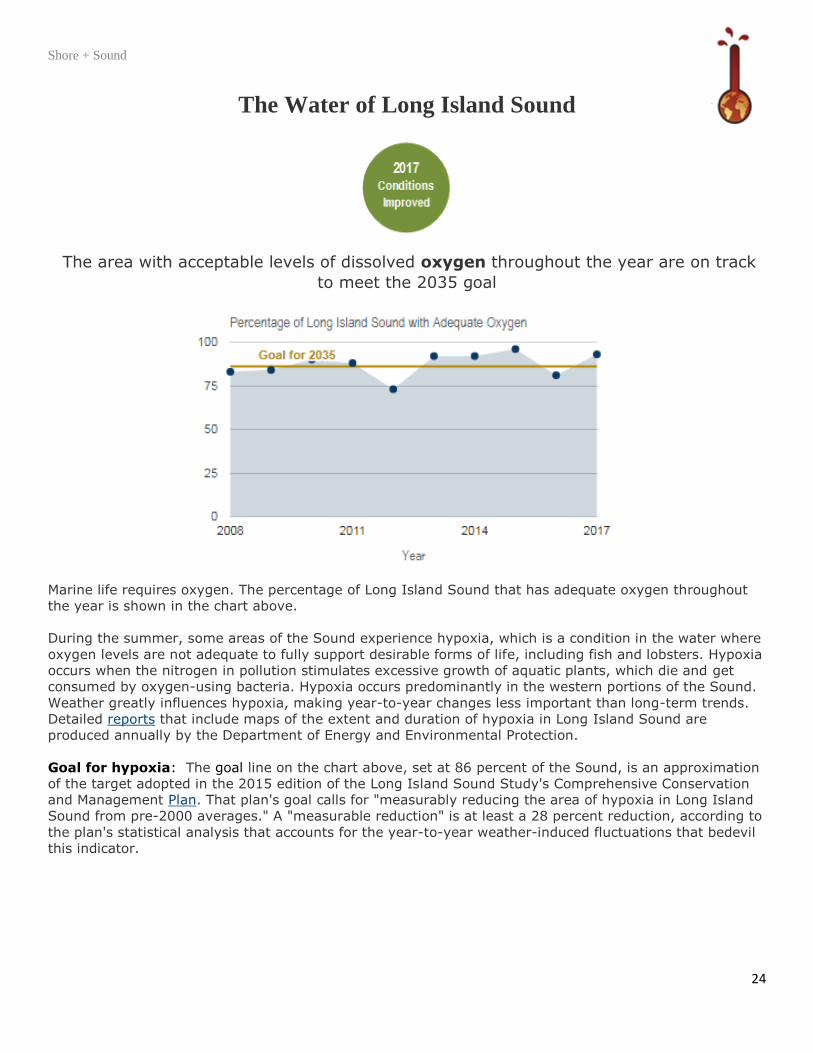
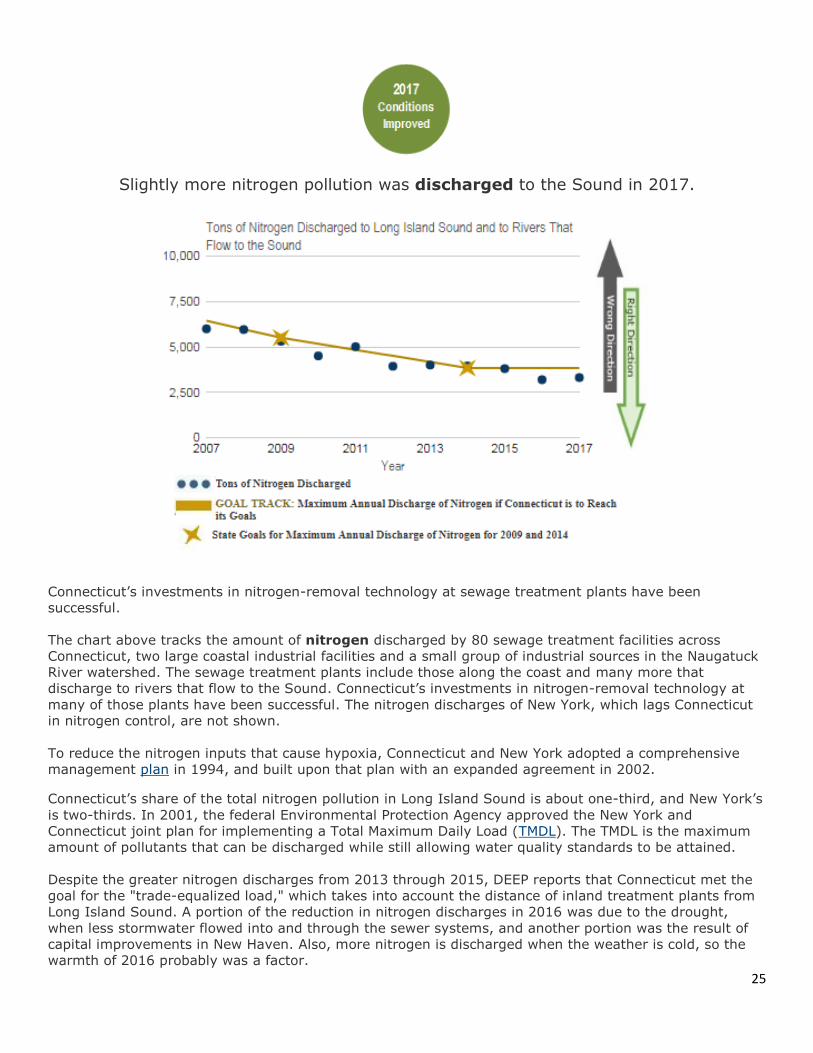
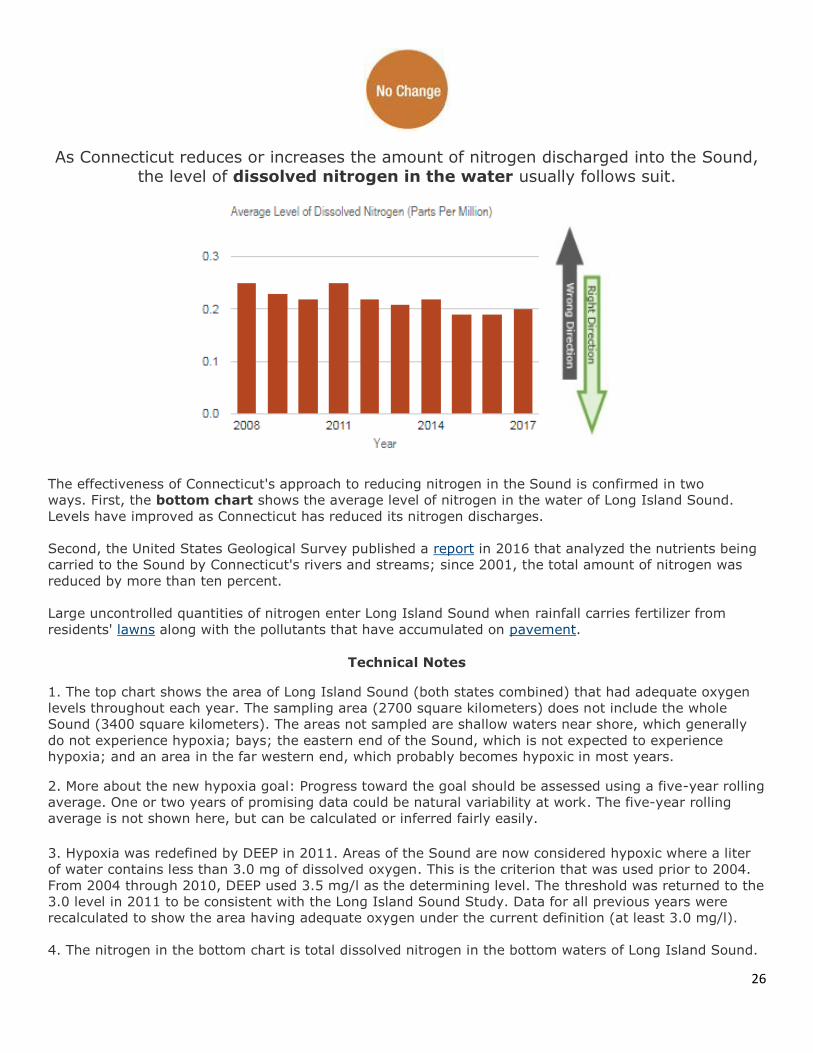
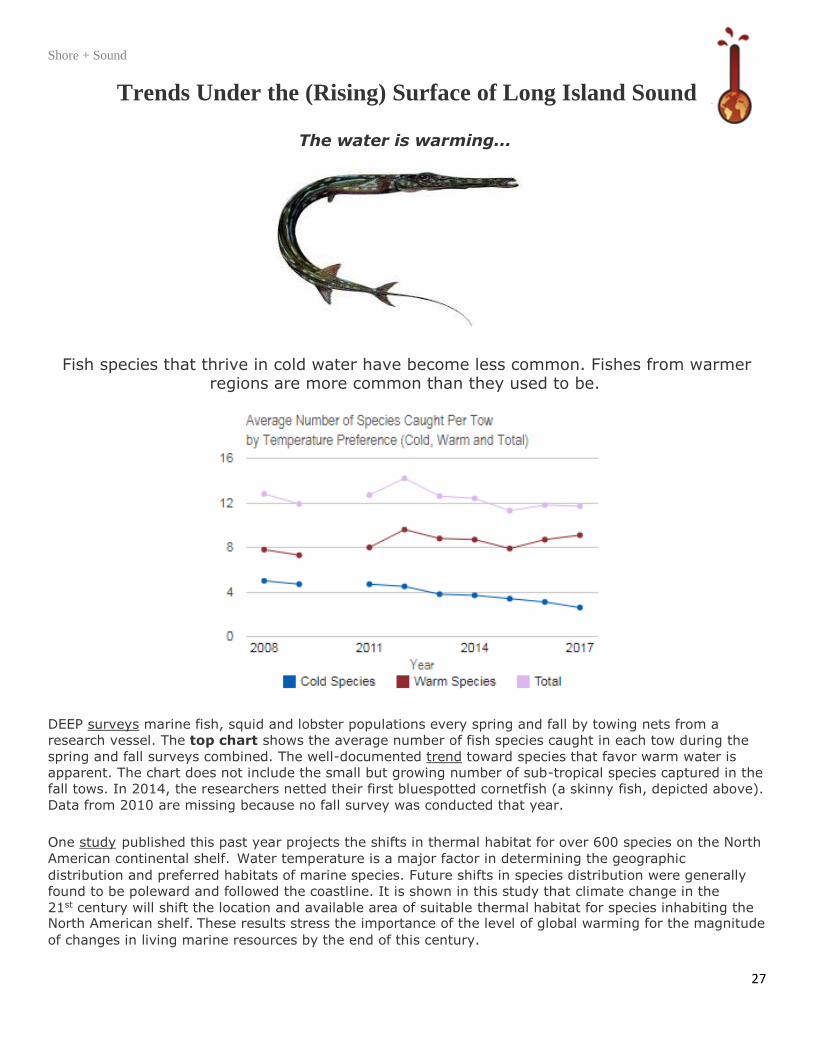
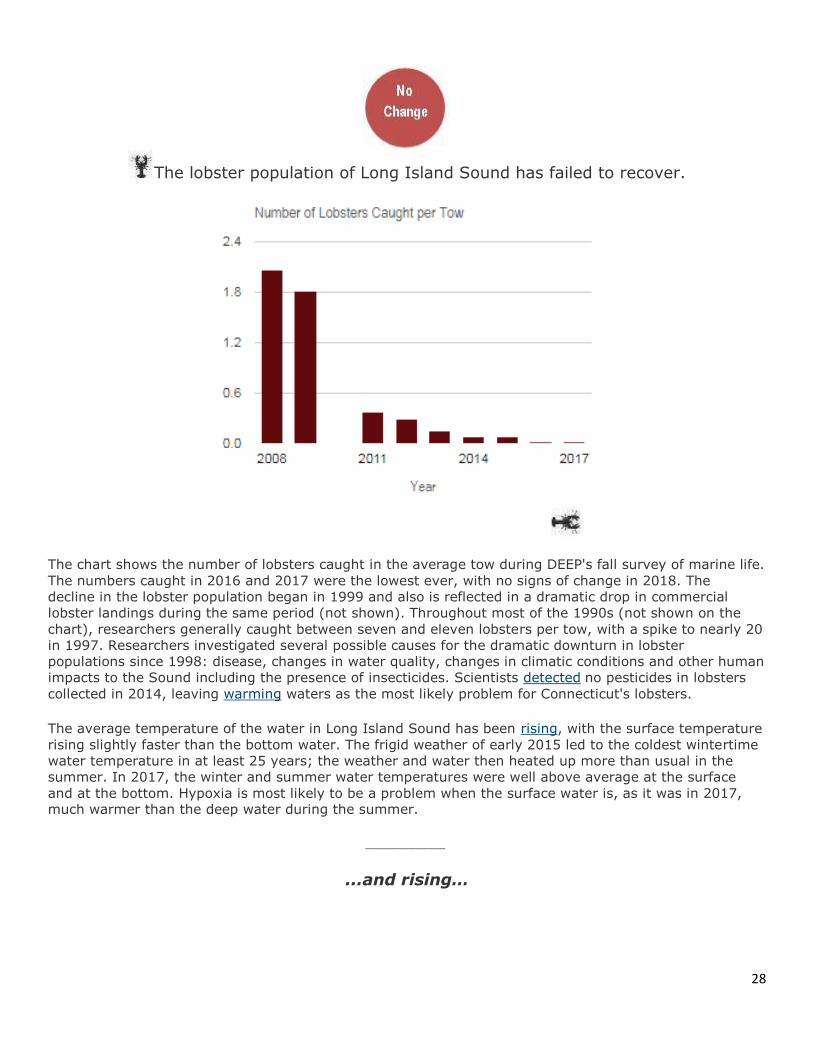
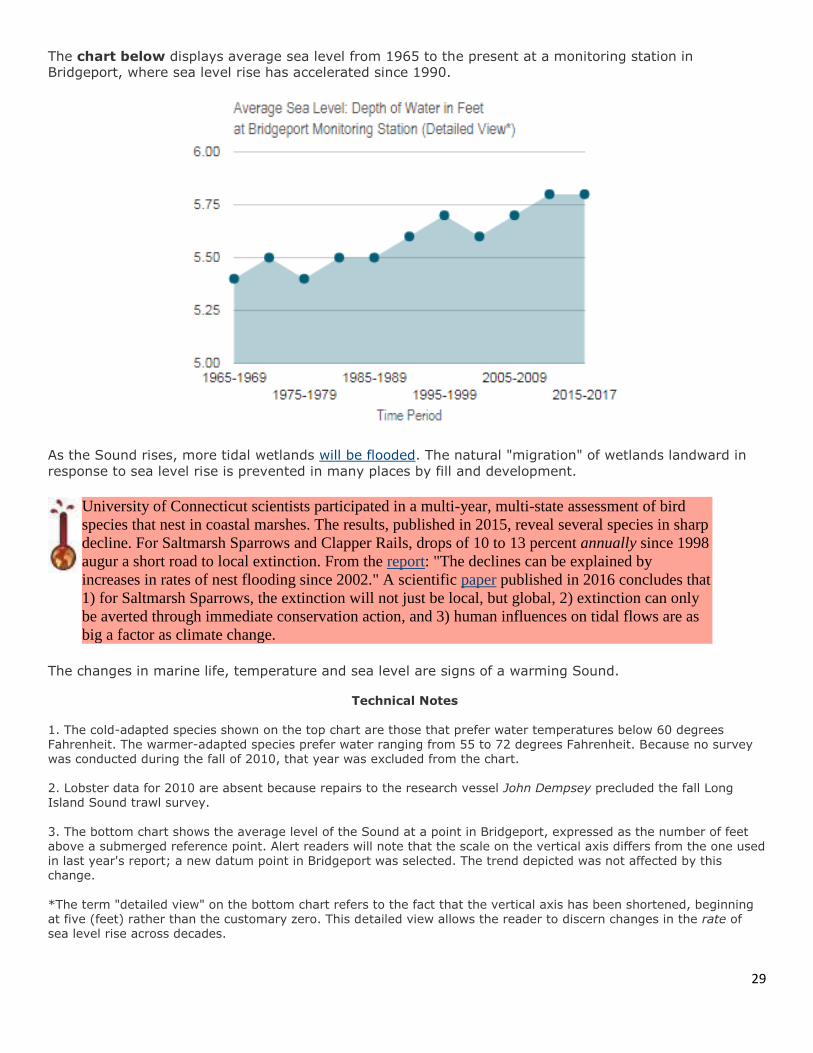
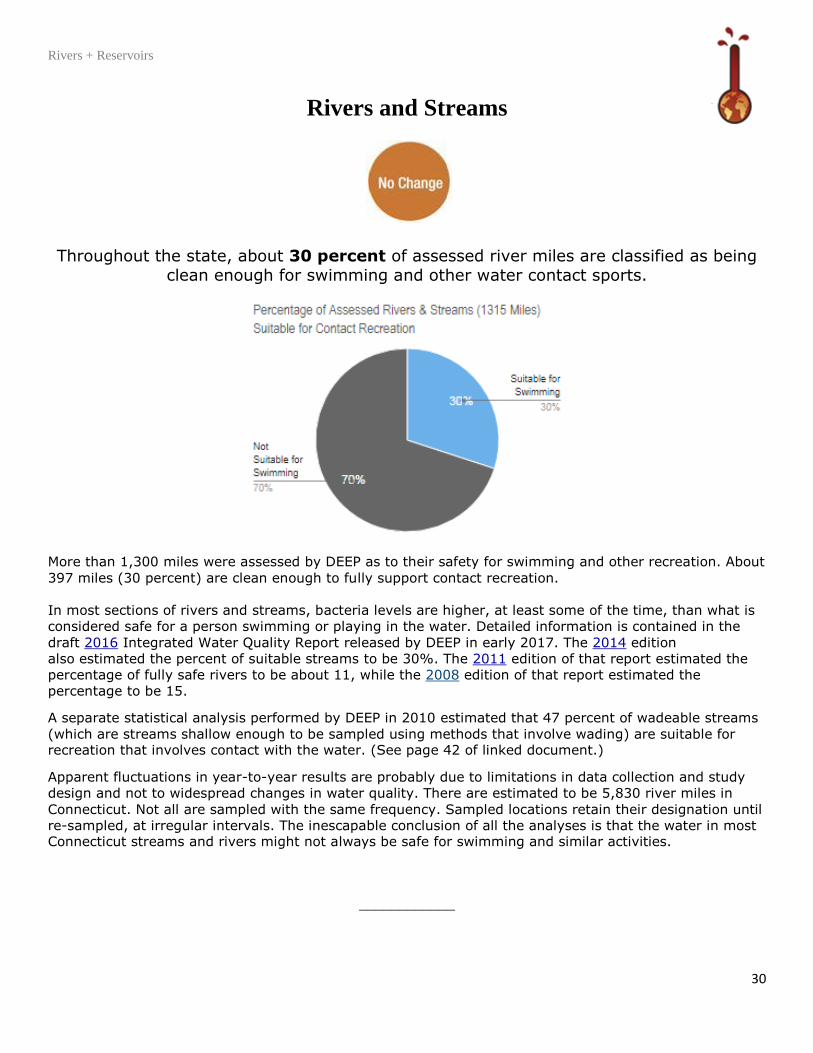
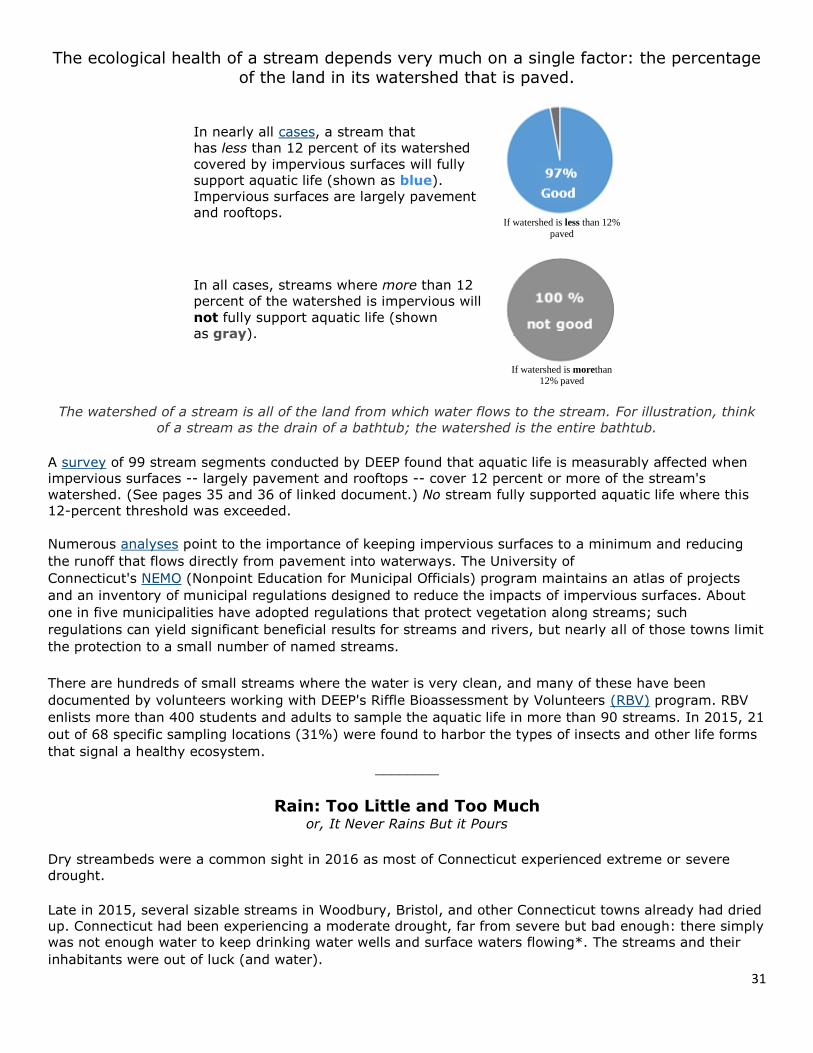
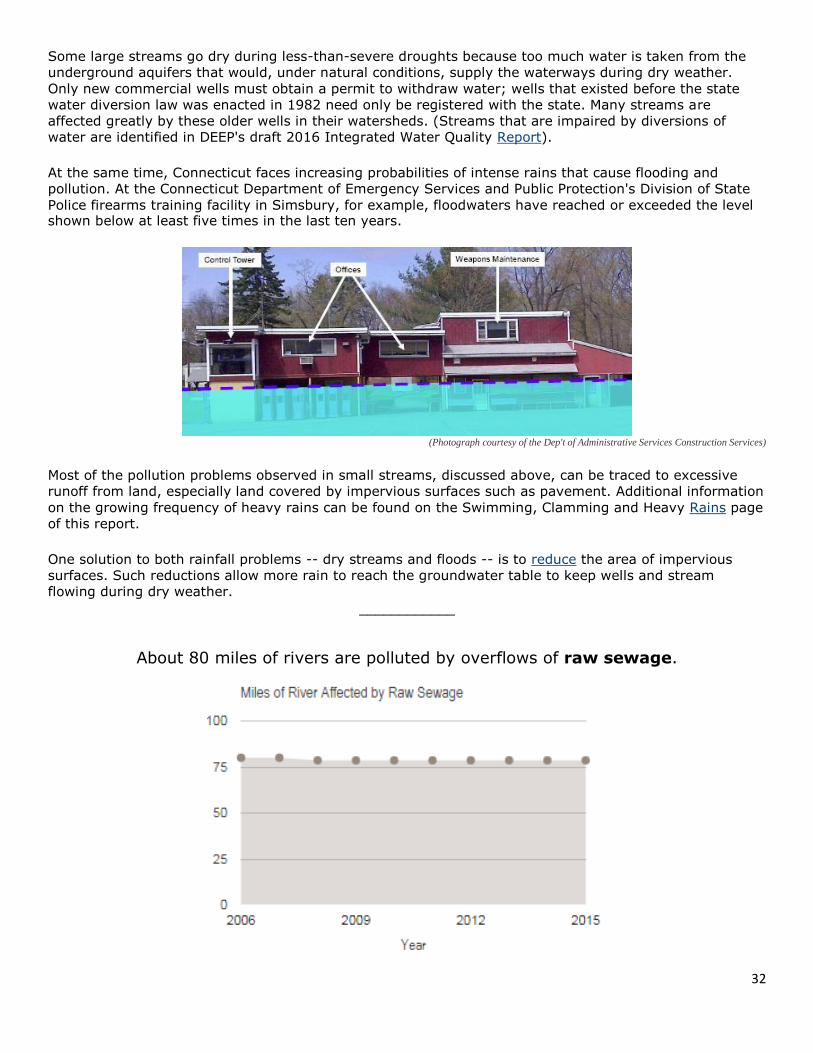
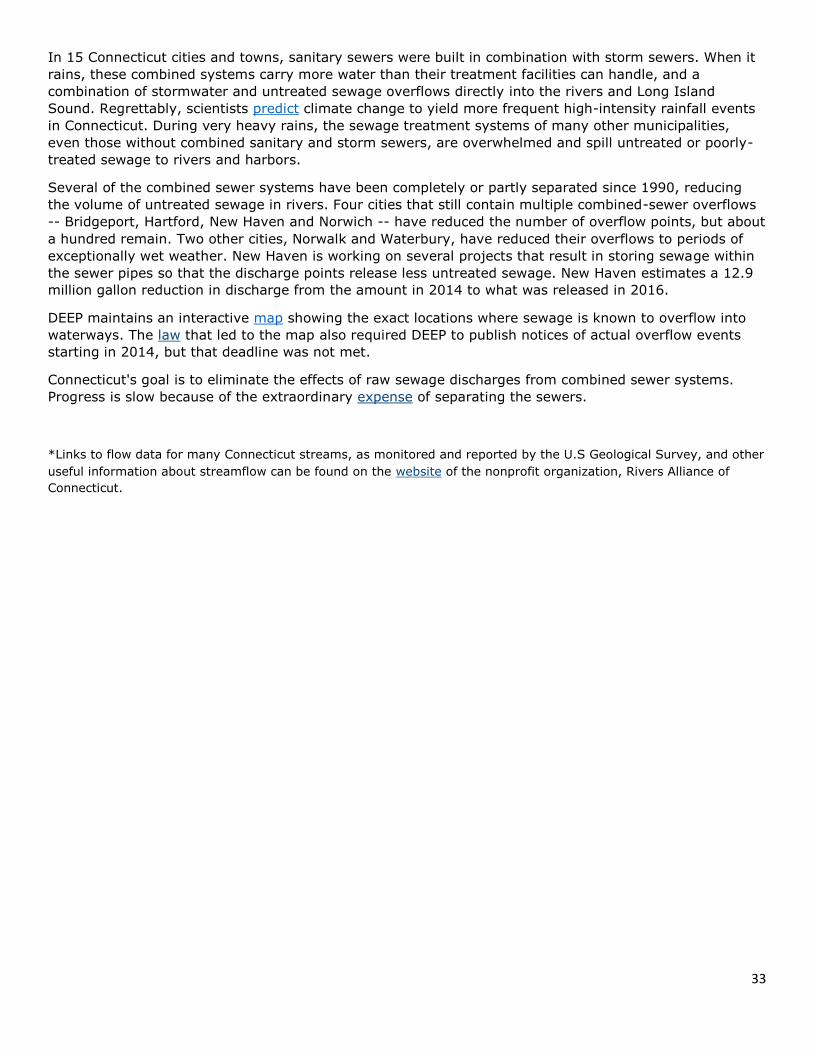
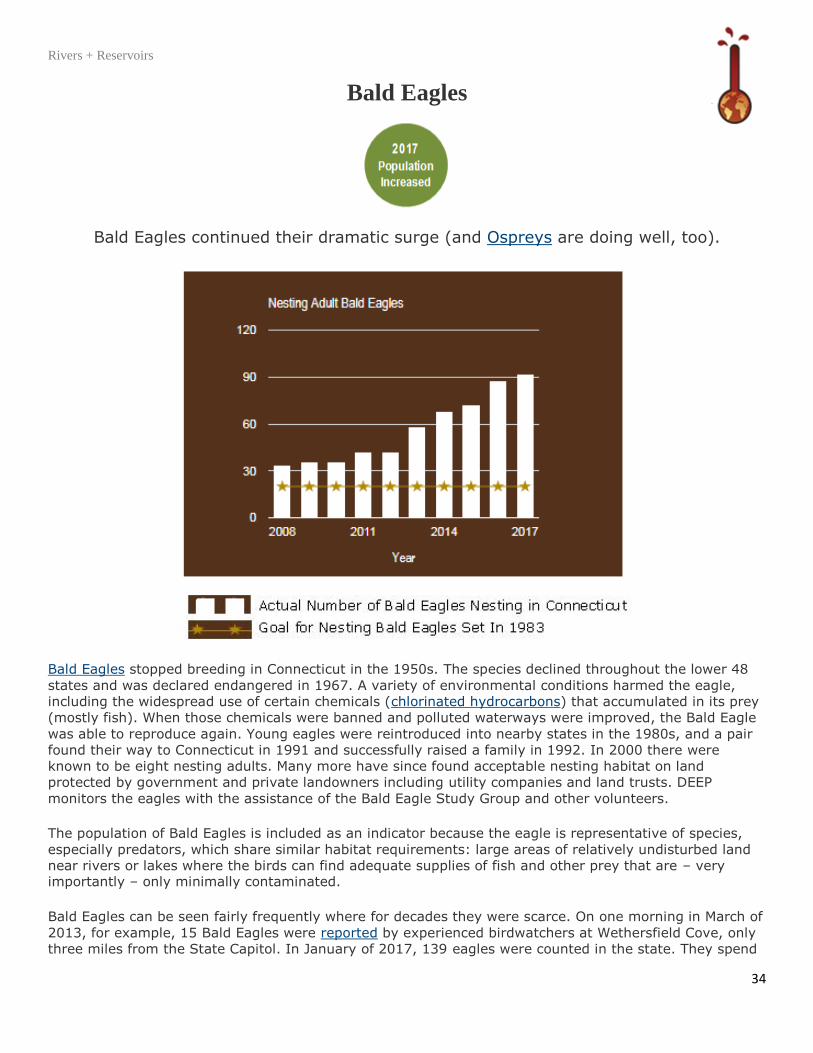
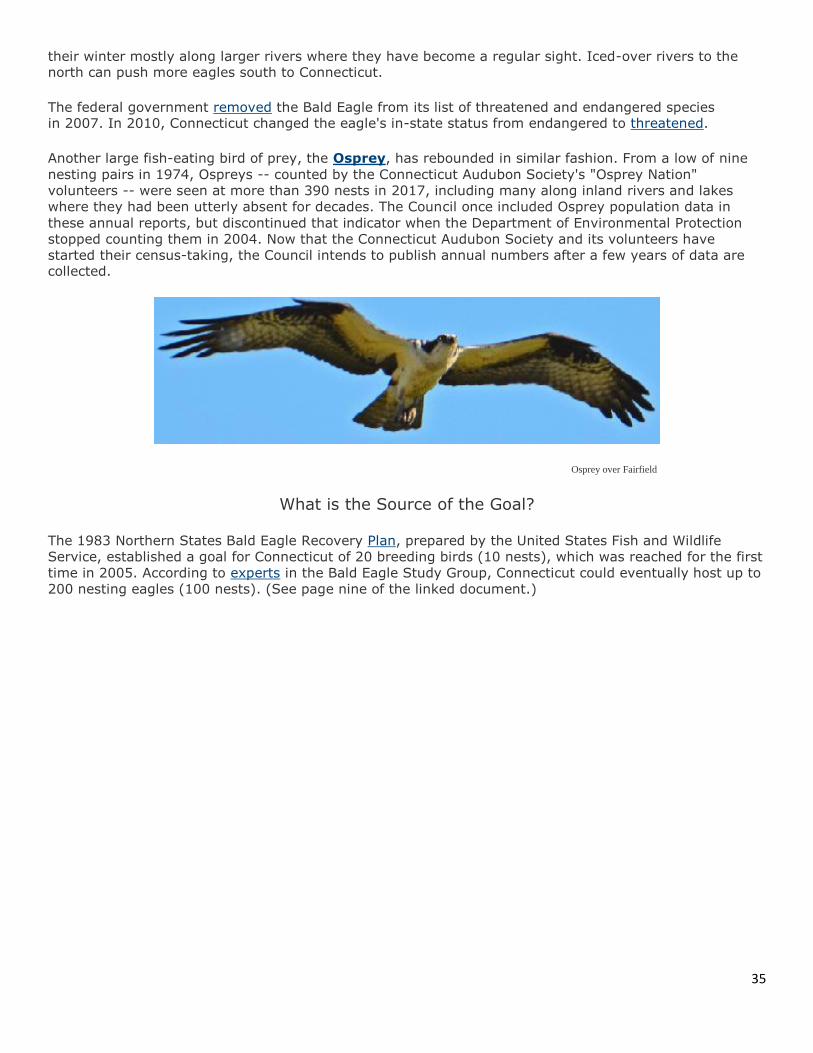
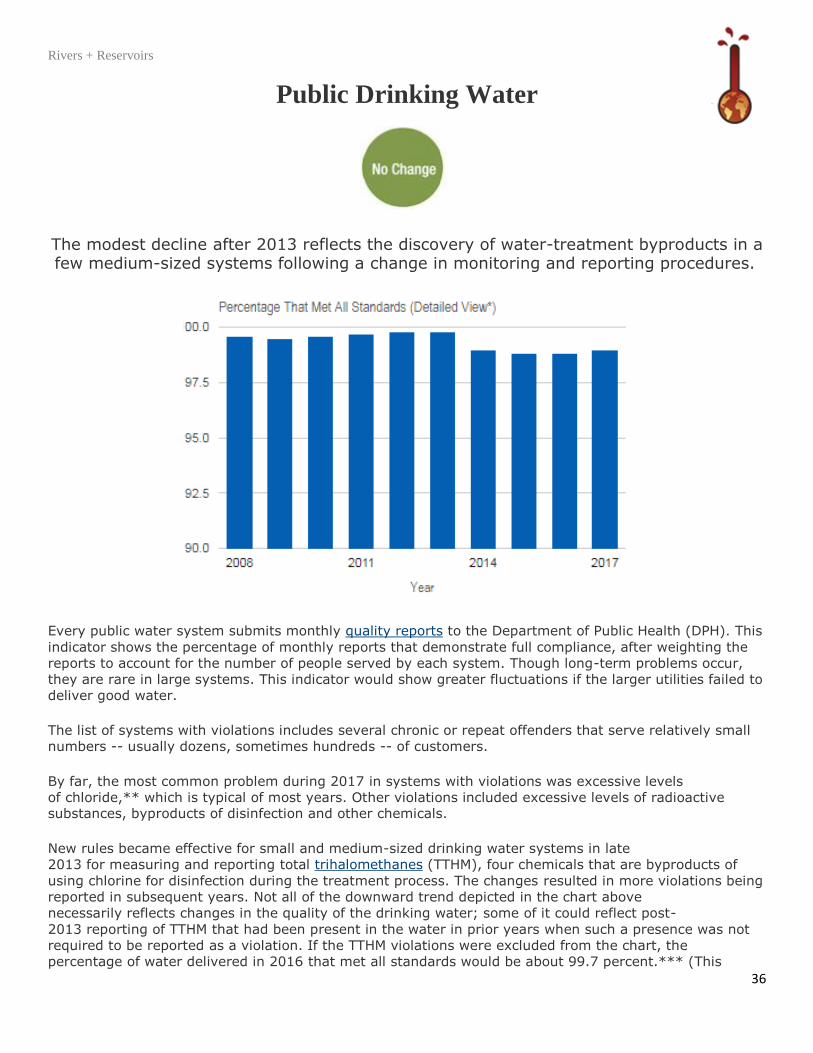
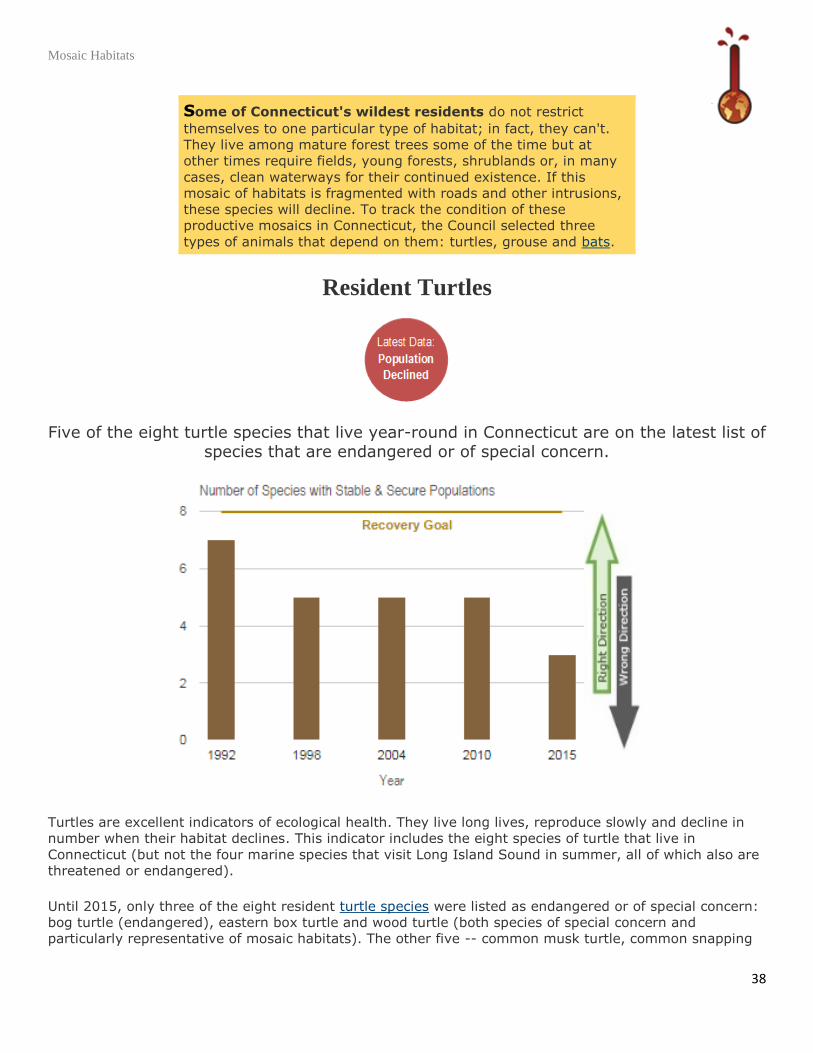
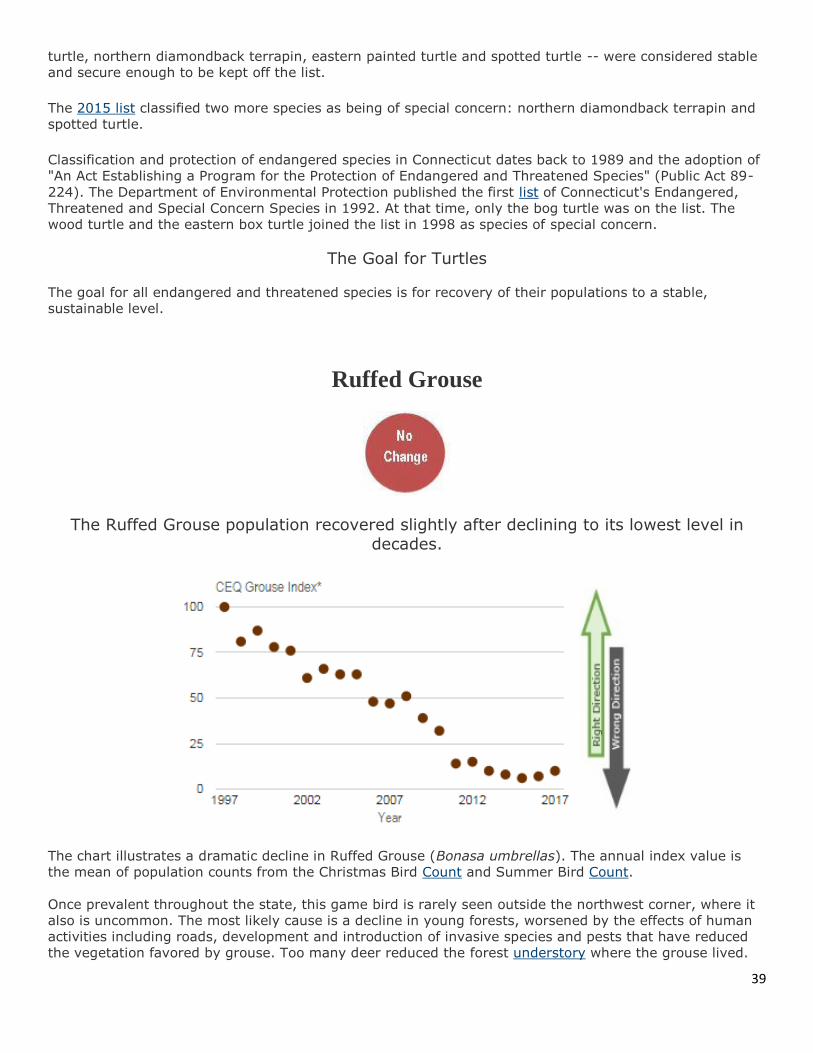
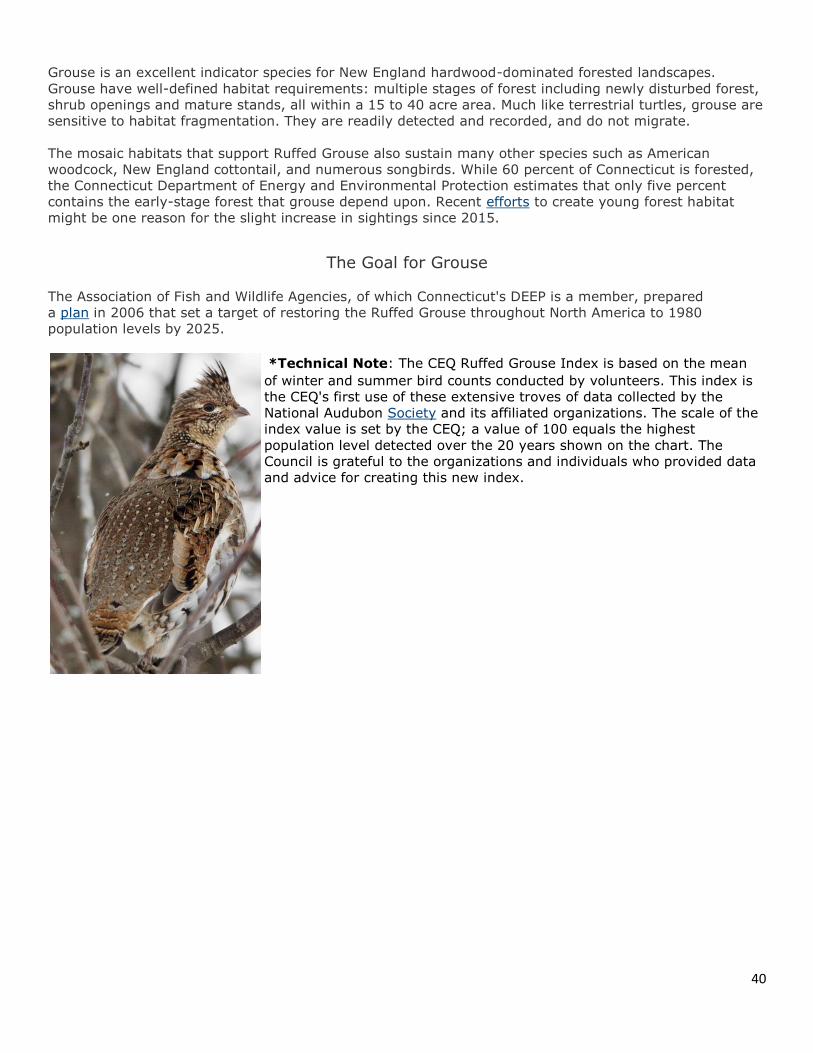
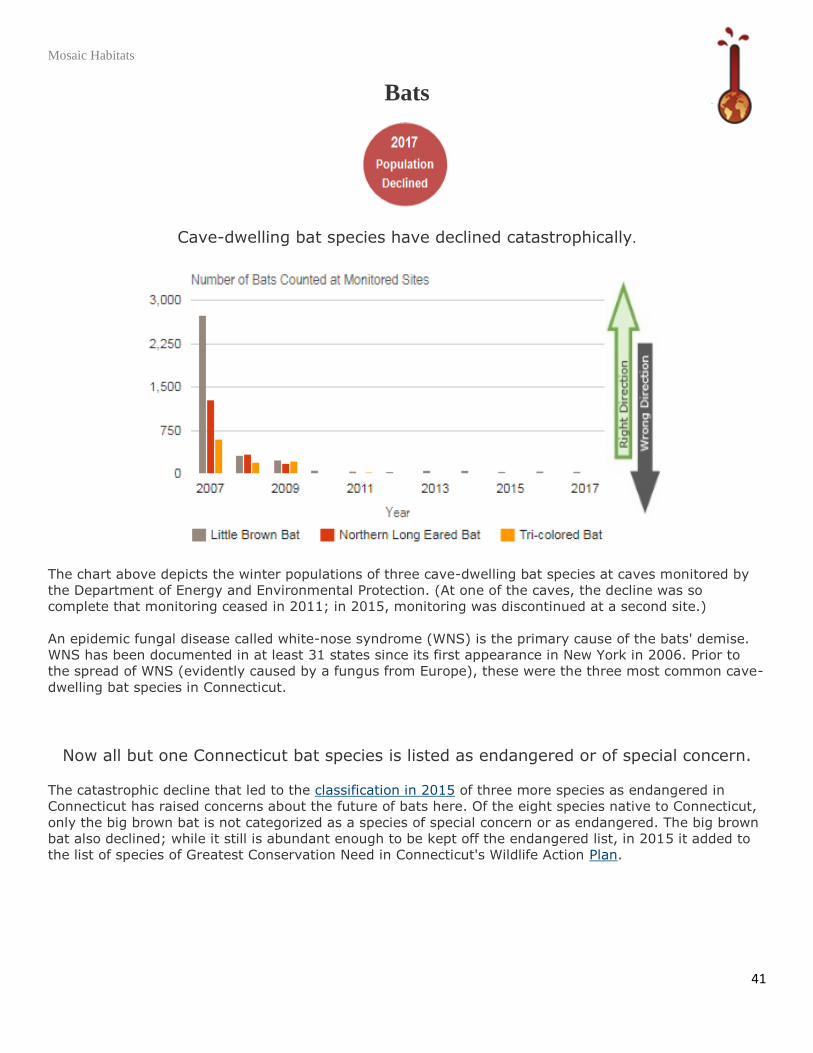
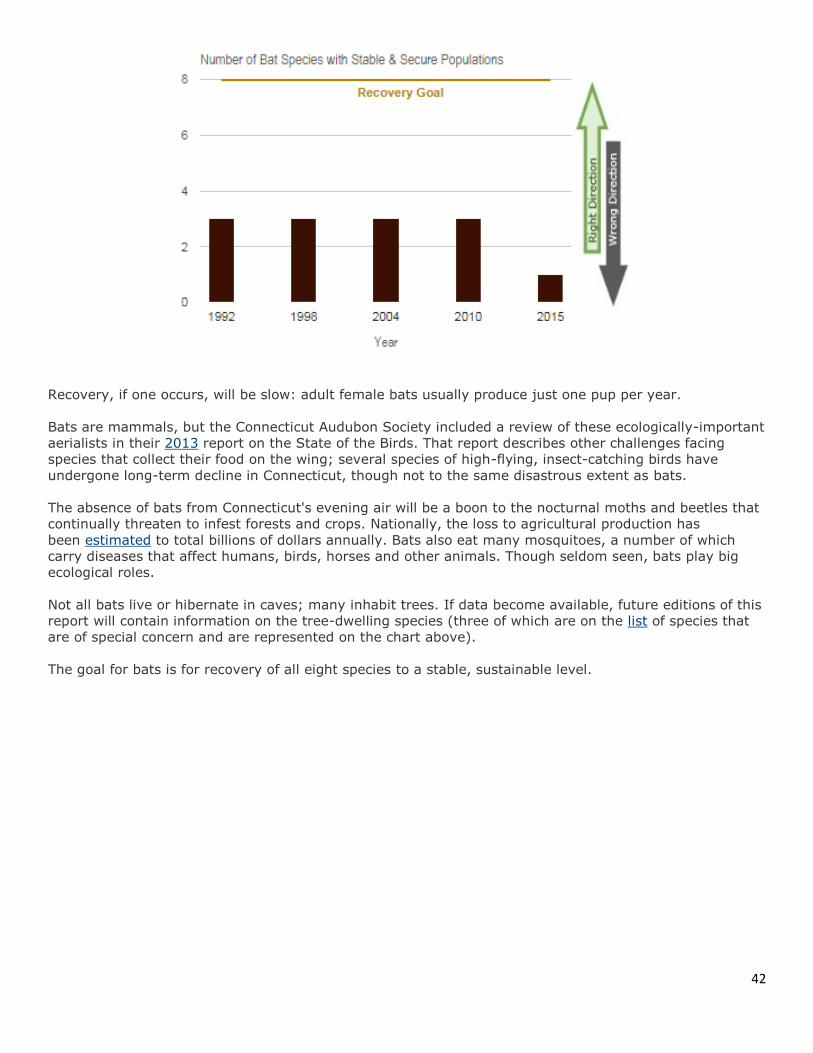
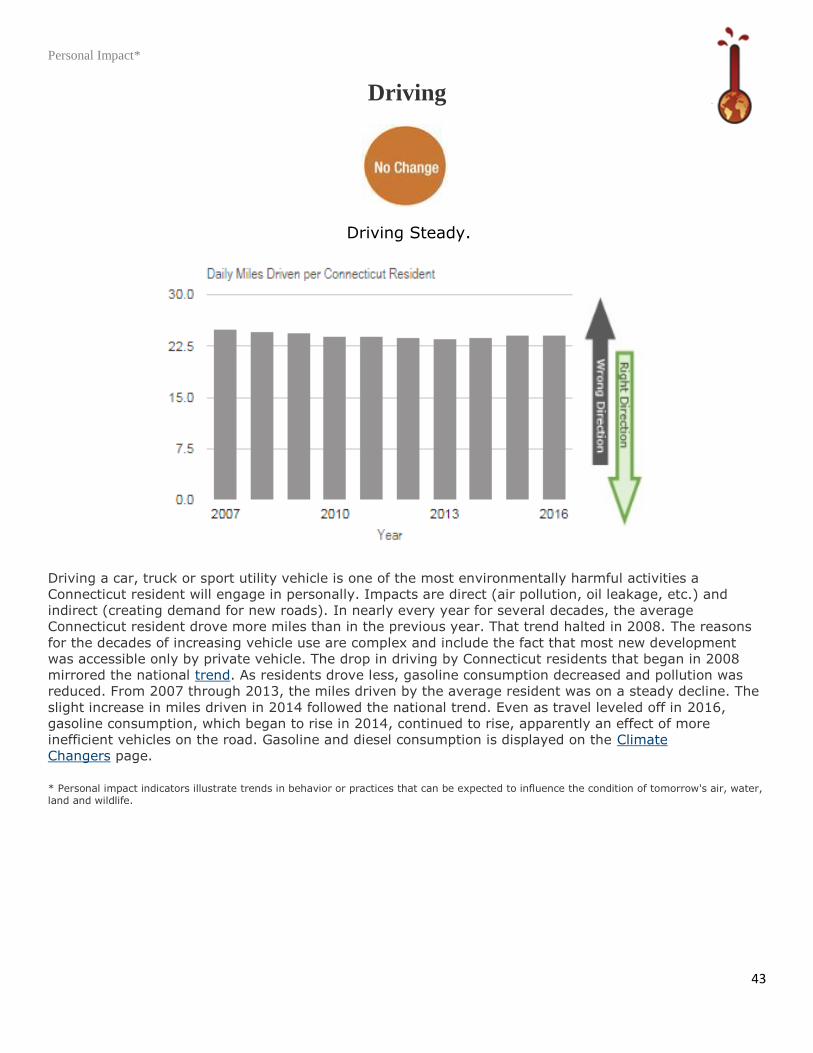
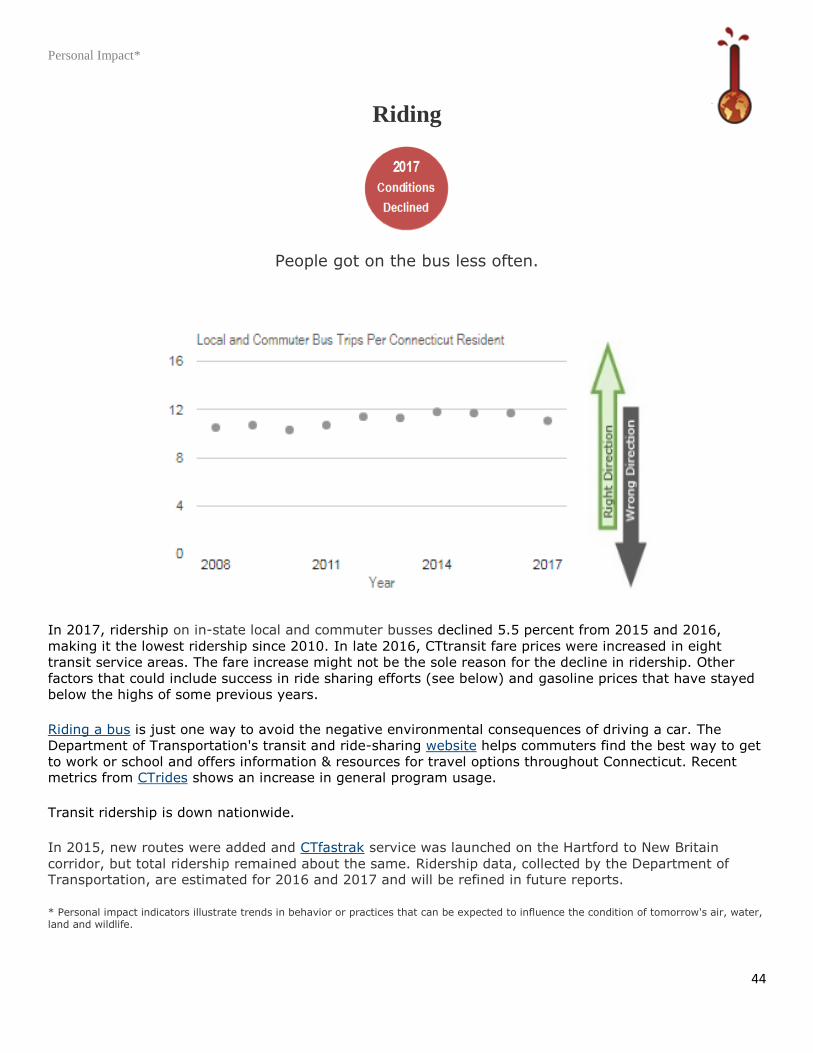
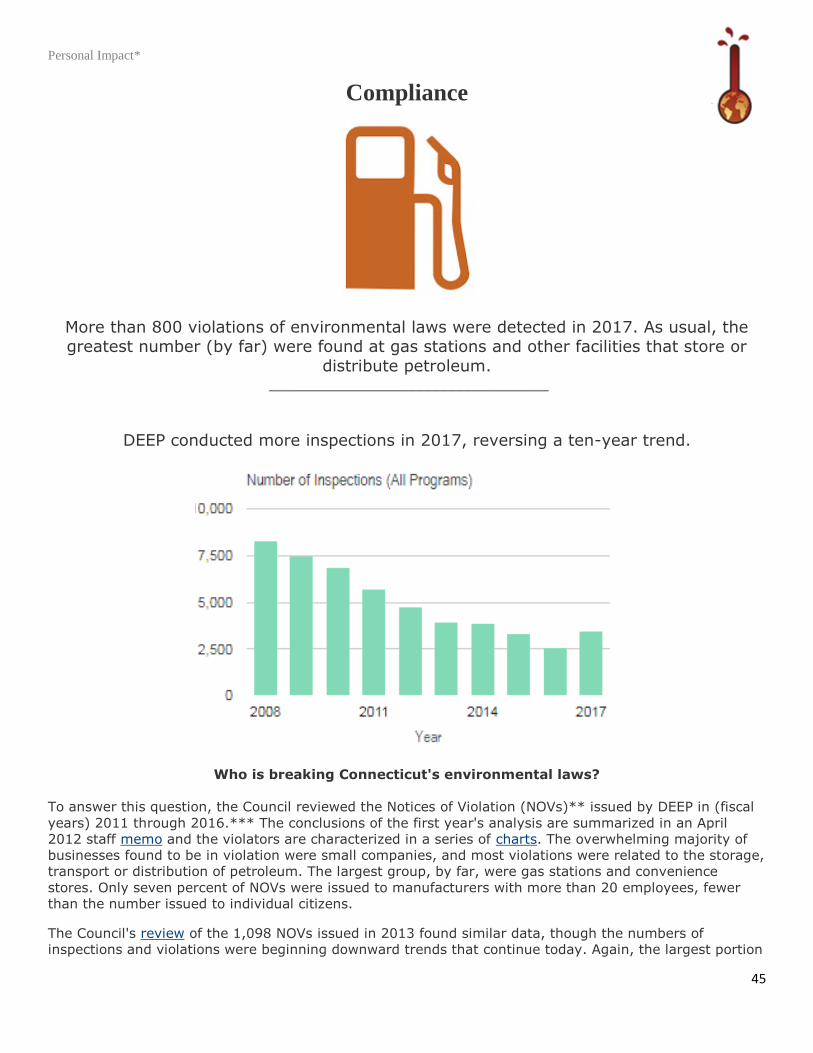
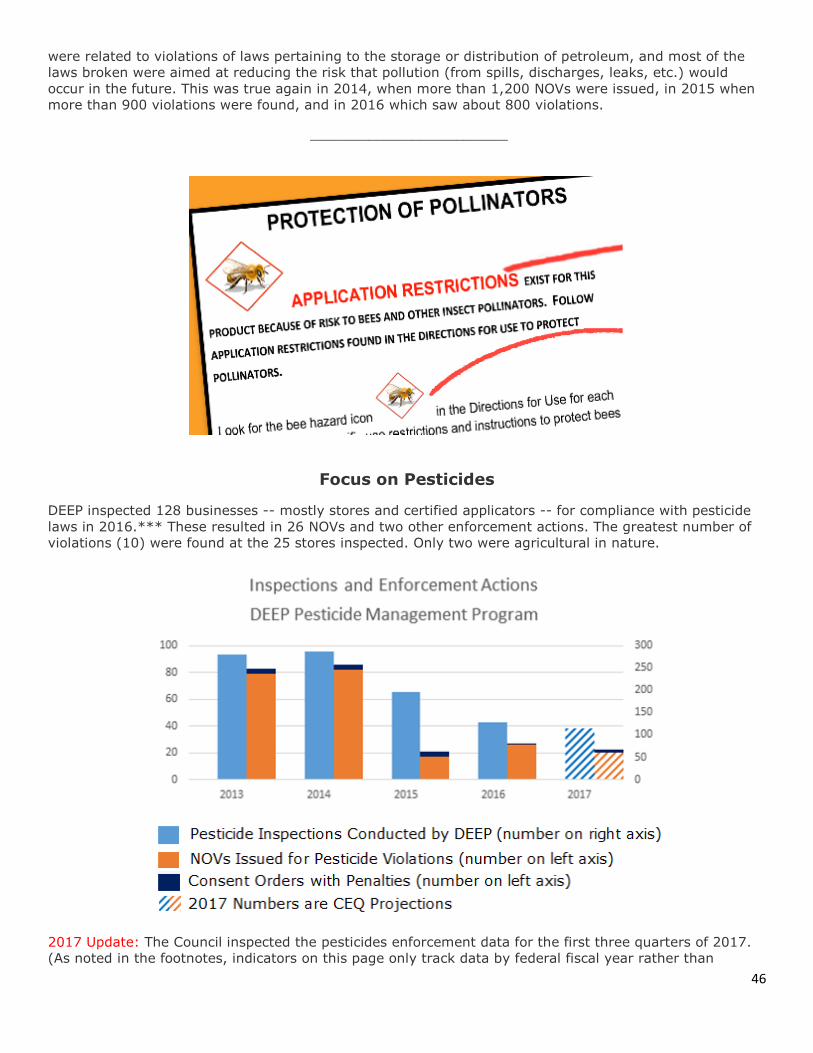
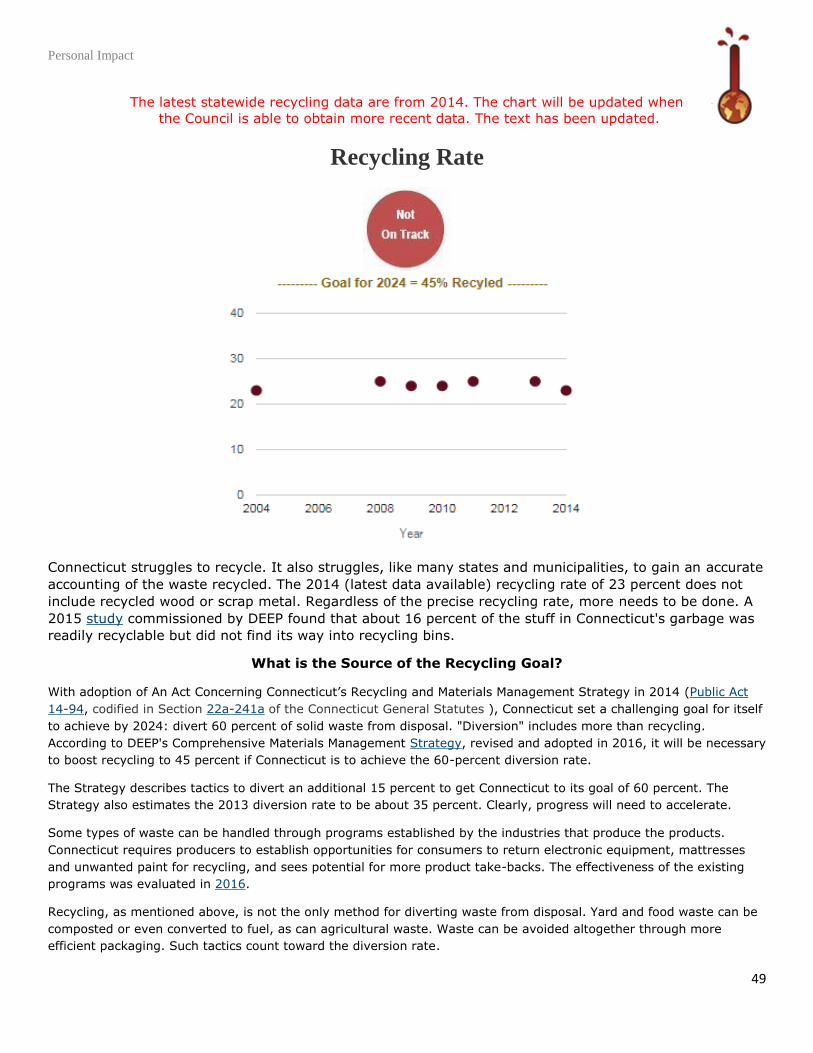
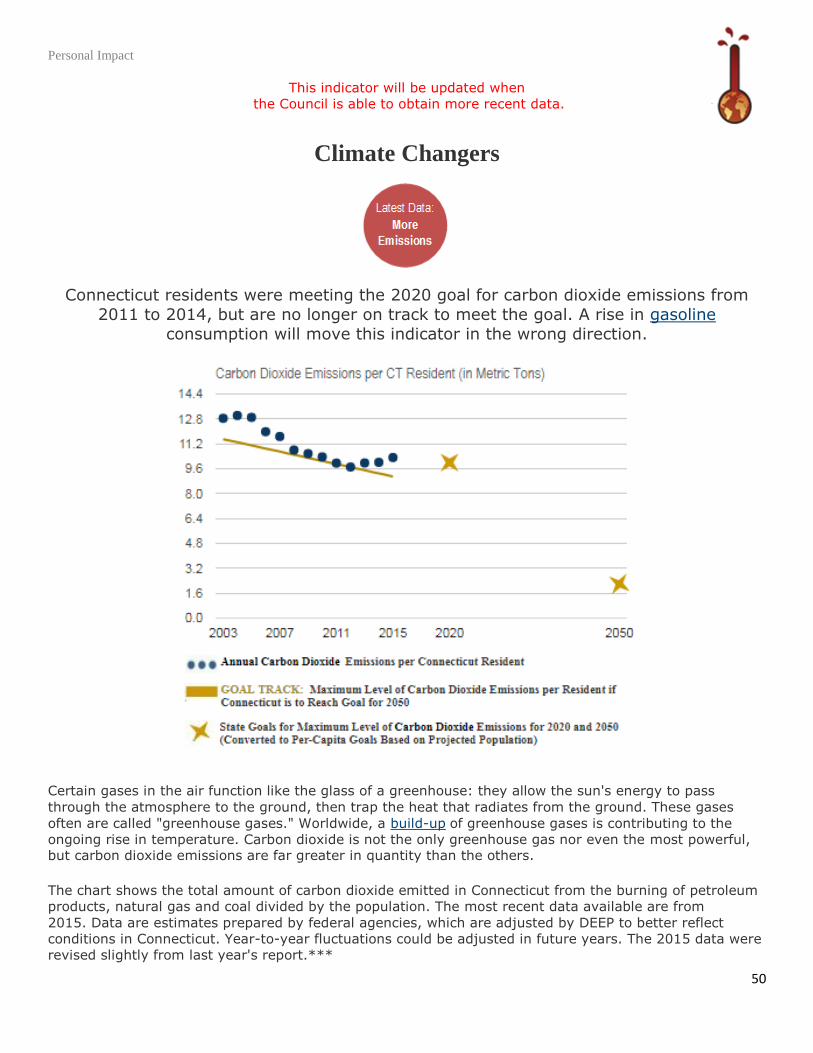
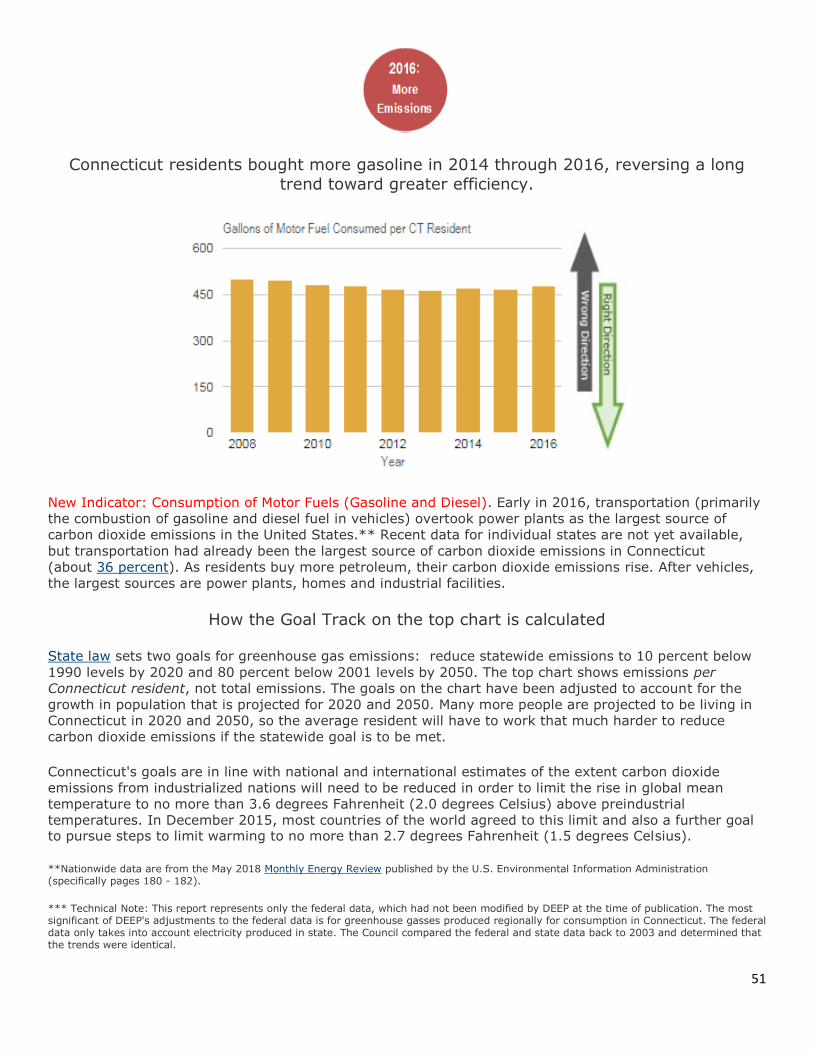
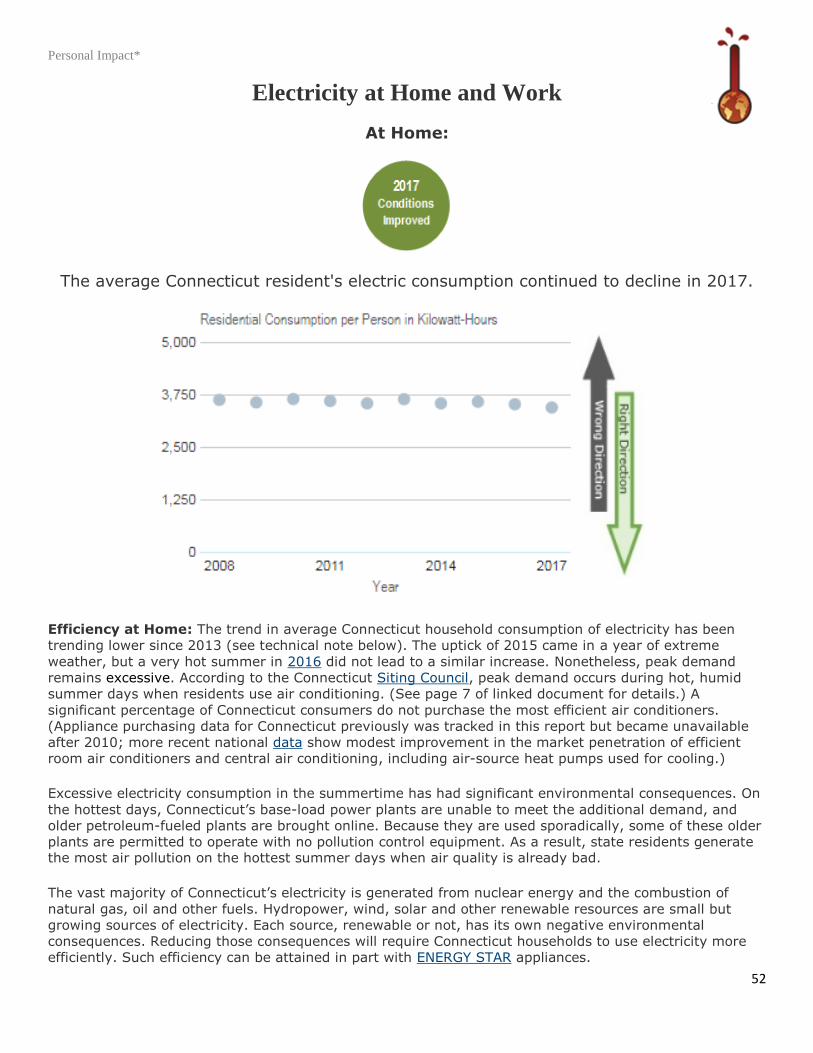
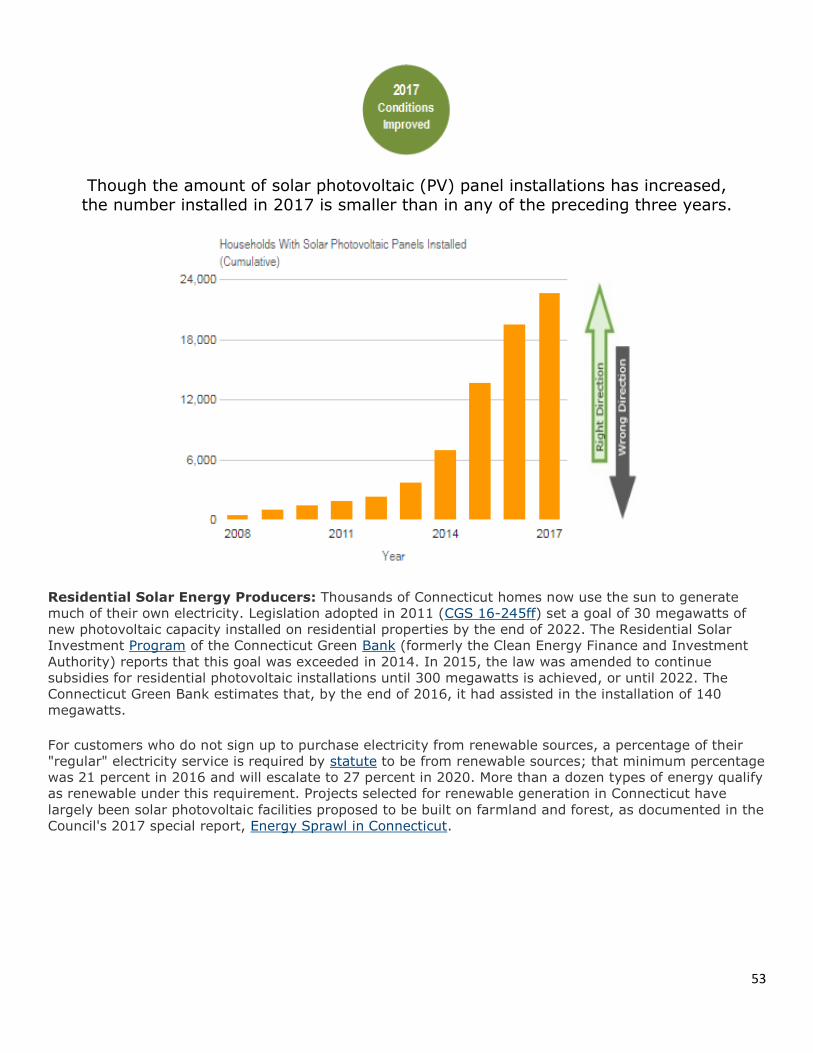
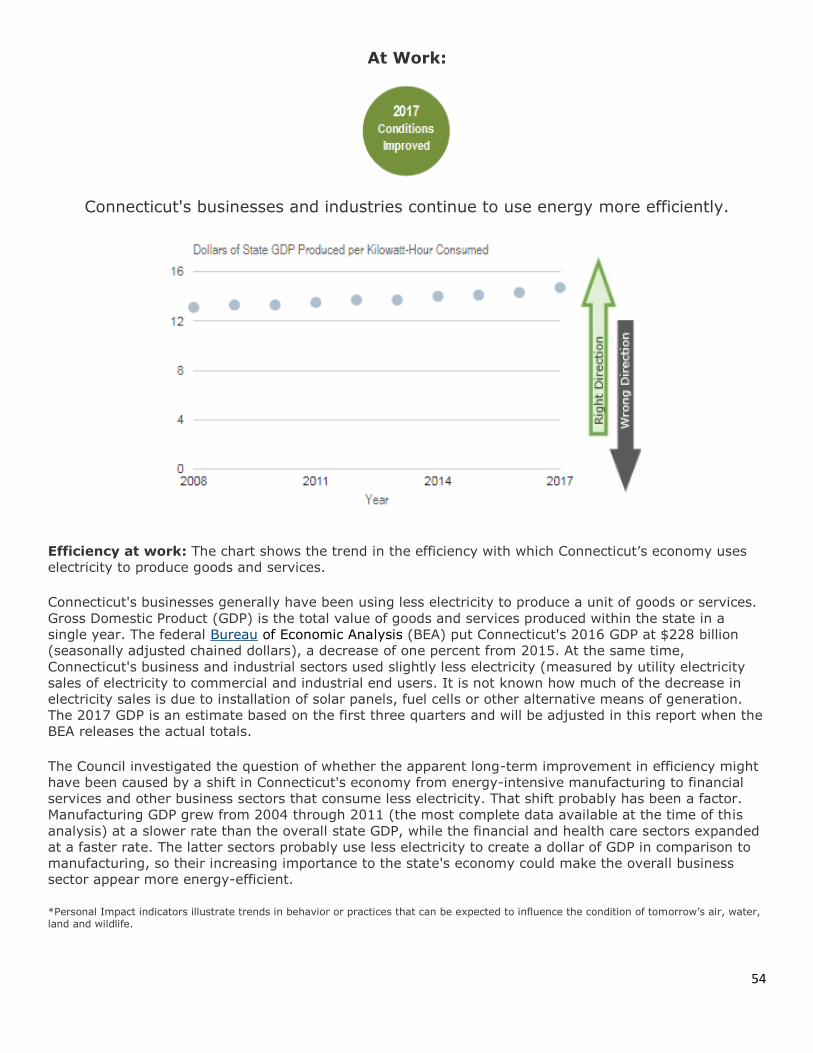
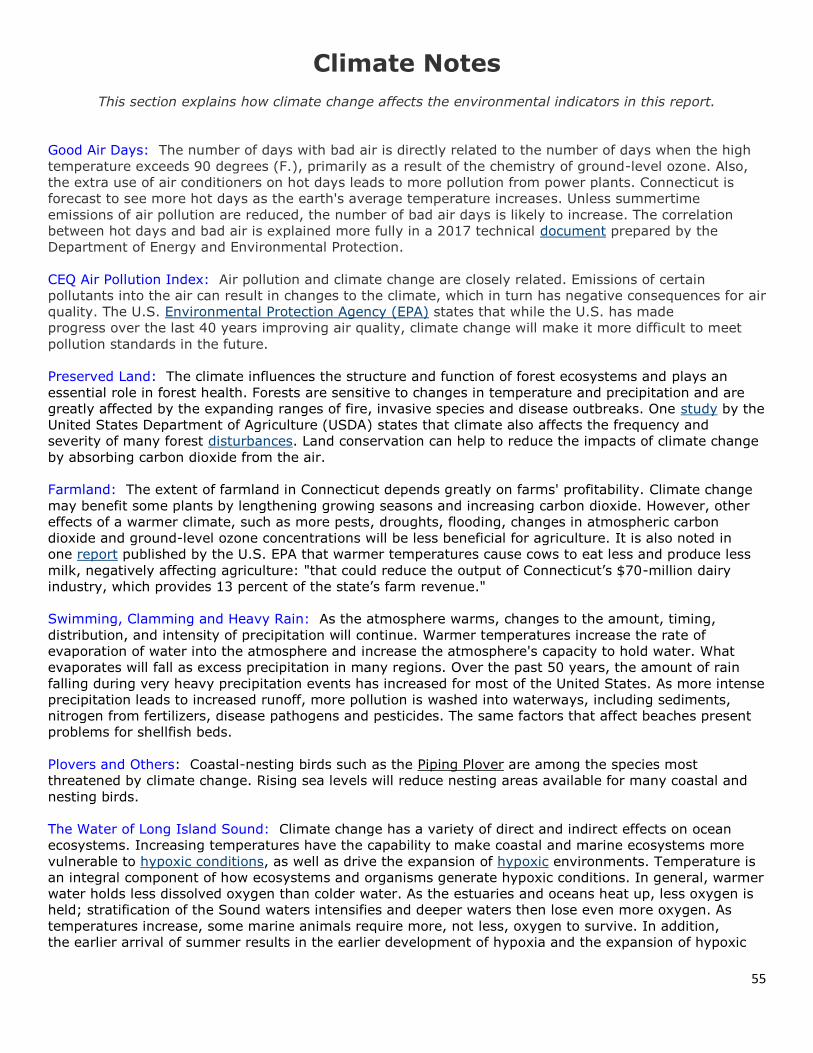