costs of fragility hip fractures globally: a systematic ...10.1007/s00198-017-4153... · costs of...
TRANSCRIPT

1
Costs of fragility hip fractures globally:
a systematic review and meta-regression analysis
Online Appendices
Appendix 1 – Search terms used in databases ....................................................................................... 2
Appendix 2 – Data extraction proforma ................................................................................................. 5
Appendix 3 – Quality checklist ................................................................................................................ 7
Appendix 4 – Table of included Studies .................................................................................................. 8
Appendix 5 – Supplementary Tables and Figures ................................................................................. 23

2
Appendix 1 – Search terms used in databases
Table A.1.1 – Search strategy for identifying relevant studies in Embase
Embase Searches
1 exp healthcare cost/
2 exp costs/
3 exp economics/
4 exp hip fracture/
5 exp femur neck fracture/
6 exp femur intertrochanteric fracture/
7 exp femur pertrochanteric fracture/
8 exp femur subtrochanteric fracture/
9 exp femur trochanteric fracture/
10 exp fragility fracture/
11 fracture/
12 osteoporo*.mp.
13 11 and 12
14 ("neck of femur" adj2 fracture*).mp.
15 ("femoral neck" adj2 fracture*).mp.
16 ((fracture* adj2 fragility) and (hip* or femur* or femor*)).mp.
17 1 or 2 or 3
18 4 or 5 or 6 or 7 or 8 or 9 or 10 or 13 or 14 or 15 or 16
19 17 and 18
20 limit 19 to yr="1990 -Current"
Table A.1.2 – Search strategy for identifying relevant studies in Medline
Medline Searches
1 exp economics/
2 cost*.mp.
3 osteoporo*.mp.
4 exp fracture bone/
5 3 and 4
6 exp osteoporotic fractures/
7 exp hip fracture/
8 ("neck of femur" adj2 fracture*).mp.
9 ("femoral neck" adj2 fracture*).mp.
10 (fracture* adj2 fragility).mp.
11 hip Fractures/ec [Economics]
12 1 or 2
13 5 or 6 or 7 or 8 or 9 or 10
14 12 and 13
15 11 or 14
16 exp animals/ not humans.sh.
17 15 not 16
18 limit 17 to yr="1990 -Current"
3
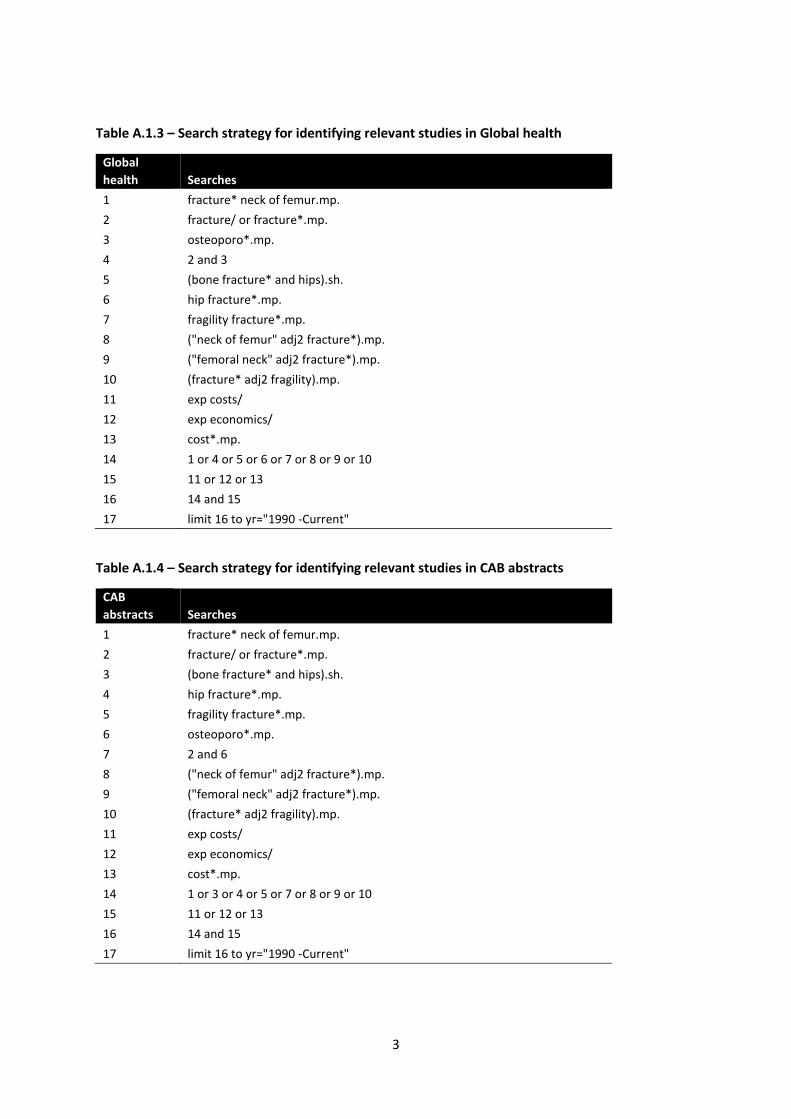
Table A.1.3 – Search strategy for identifying relevant studies in Global health
Global
health Searches
1 fracture* neck of femur.mp.
2 fracture/ or fracture*.mp.
3 osteoporo*.mp.
4 2 and 3
5 (bone fracture* and hips).sh.
6 hip fracture*.mp.
7 fragility fracture*.mp.
8 ("neck of femur" adj2 fracture*).mp.
9 ("femoral neck" adj2 fracture*).mp.
10 (fracture* adj2 fragility).mp.
11 exp costs/
12 exp economics/
13 cost*.mp.
14 1 or 4 or 5 or 6 or 7 or 8 or 9 or 10
15 11 or 12 or 13
16 14 and 15
17 limit 16 to yr="1990 -Current"
Table A.1.4 – Search strategy for identifying relevant studies in CAB abstracts
CAB
abstracts Searches
1 fracture* neck of femur.mp.
2 fracture/ or fracture*.mp.
3 (bone fracture* and hips).sh.
4 hip fracture*.mp.
5 fragility fracture*.mp.
6 osteoporo*.mp.
7 2 and 6
8 ("neck of femur" adj2 fracture*).mp.
9 ("femoral neck" adj2 fracture*).mp.
10 (fracture* adj2 fragility).mp.
11 exp costs/
12 exp economics/
13 cost*.mp.
14 1 or 3 or 4 or 5 or 7 or 8 or 9 or 10
15 11 or 12 or 13
16 14 and 15
17 limit 16 to yr="1990 -Current"

4
Table A.1.5 – Search strategy for identifying relevant studies in Econlit
Econlit Searches
1 ((fracture* neck of femur) OR (fracture* hip) OR (fragility fracture*) OR
(osteoporo* fracture*) OR (fracture* adj2 "neck of femur") OR ("femoral
neck" adj2 fracture*) OR (fracture* adj2 fragility))
2 (cost* OR (healthcare cost*) OR economic*)
3 1 and 2
Table A.1.6 – Search strategy for identifying relevant studies in NHS EED & HTA
NHS EED &
HTA Searches
1 (hip adj2 fracture*) IN NHSEED, HTA
2 (osteoporo* adj2 fracture*) IN NHSEED, HTA
3 (fragility adj2 fracture*) IN NHSEED, HTA
4 (fracture* adj2 neck of femur) IN NHSEED, HTA
5 #1 OR #2 OR #3 OR #4
Table A.1.7 – Search strategy for identifying relevant studies in Web of science
Web of science
(Databases=SCI-
EXPANDED,
SSCI, CPCI-S,
CPCI-SSH) Searches
1 Topic=(cost*)
2 Topic=(economic*)
3 Topic=((osteoporo* NEAR/2 fracture*))
4 Topic=((fracture* NEAR/2 hip))
5 Topic=(("fracture*" NEAR/2 "neck of femur"))
6 Topic=((fragility NEAR/2 fracture*))
7 #2 OR #1
8 #6 OR #5 OR #4 OR #3
9 #8 AND #7
10 Filter = years 1990 to current

5
Appendix 2 – Data extraction proforma
1. Authors and publication date: …………………………………………………………………………………………
2. Country and region: ………………………………………………………………………………………………………
3. Study design:
Randomised control trial Prospective observational study
Cross-sectional study Retrospective observational study
4. Costing methodology:
National Reference costs Own costs (finance department)
Combination of national reference and own costs
5. Economic perspective of analysis:
Societal Healthcare system
Healthcare provider Third party payer
6. Currency: ……………………………………………………………………………………………………………………
7. Exchange rate used if not local currency: …………………………………………………………………
8. Year of costing: ……………………………………………………………………………………………………………………
9. Discount rate used: …………………………………………… Not used N/A
10. Sample size: ……………………………………………………………………………………………………………………
11. Proportion of the sample that are female: …………………………………………………………………
12. Mean age of sample: ………………………………………………………………………………………………………
13. Follow-up period of analysis: …………………………………………………………………………………………
14. Length of stay of index hospitalisation episode: …………………………………………………………………

6
15. Categories of care included:
Healthcare
Inpatient Index hospitalisation
Other inpatient
Rehabilitation Index rehabilitation
Other rehabilitation
Index “Superspell“
Community healthcare
Medication
Outpatient
Total Healthcare
Social care
Social care in the patient’s home
Social care – residential/care home
Home modification/medical equipment
Total Social Care
Total Health and Social Care
Productivity loss and informal care
Out of Pocket Expense
Income foregone by patient
Income foregone by caregiver
Total Productivity loss and informal care
Other
Total
16. Results:
Reported Cost CI/SD/SE Category of care Subgroup
1.
2.
3.
4.
n.

7
Appendix 3 – Quality checklist
CHECKLIST Yes No N/A
Study Design
1. The research question is stated
2. Economic perspective of the study is clearly stated and
justified
Data collection
3. Details of the subjects is provided
4. Indirect costs reported separately
5. Methods for estimation of unit costs and quantities is
adequately described
6. Currency and price data are reported
7. Details of adjustments for inflation or currency conversion
are reported
Analysis and interpretation of results
8. Time horizon of the study is reported
9. Discount rate is stated
10. Details of statistical tests and confidence intervals reported
11. Sensitivity analysis is performed
12. The study question is answered
13. Conclusions follow on for the data
14. Conclusions are accompanied by caveats
Questions 4, 7 and 9 were not applicable to all studies, resulting in the maximum achievable score
ranging from 11 to 14. Quality score for each study was calculated by dividing the score by the
maximum score achievable, with equal weighting assigned to each point.
8
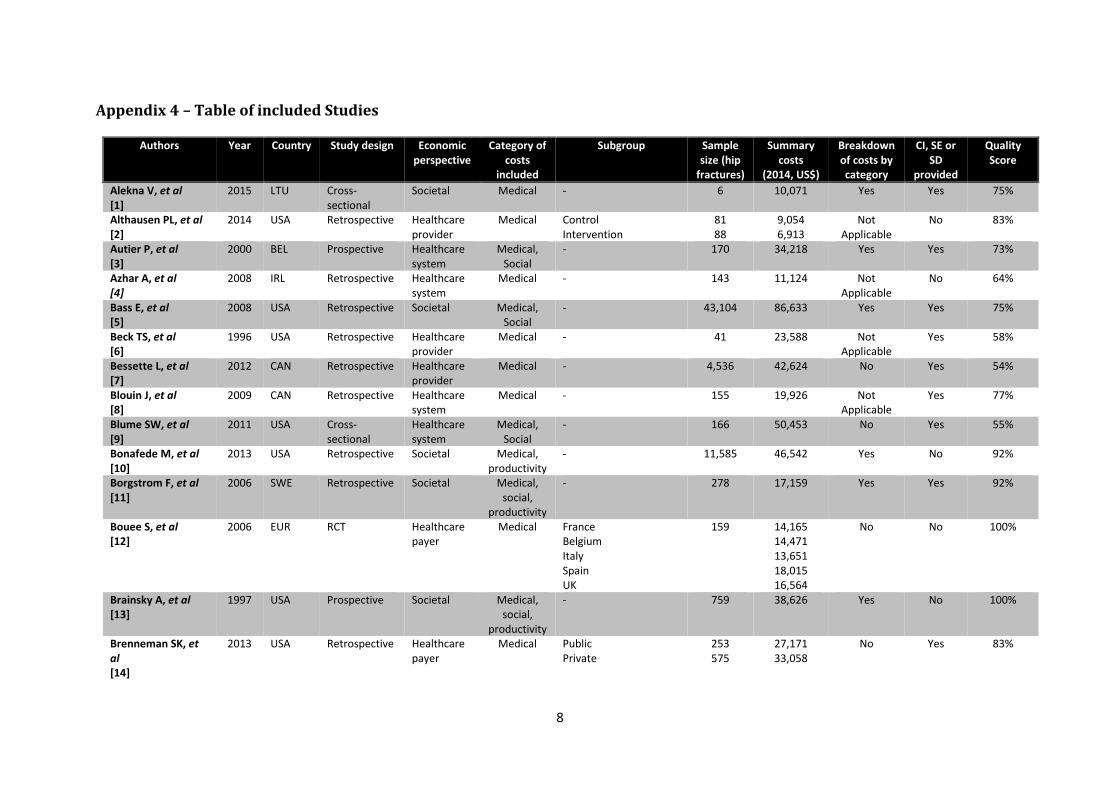
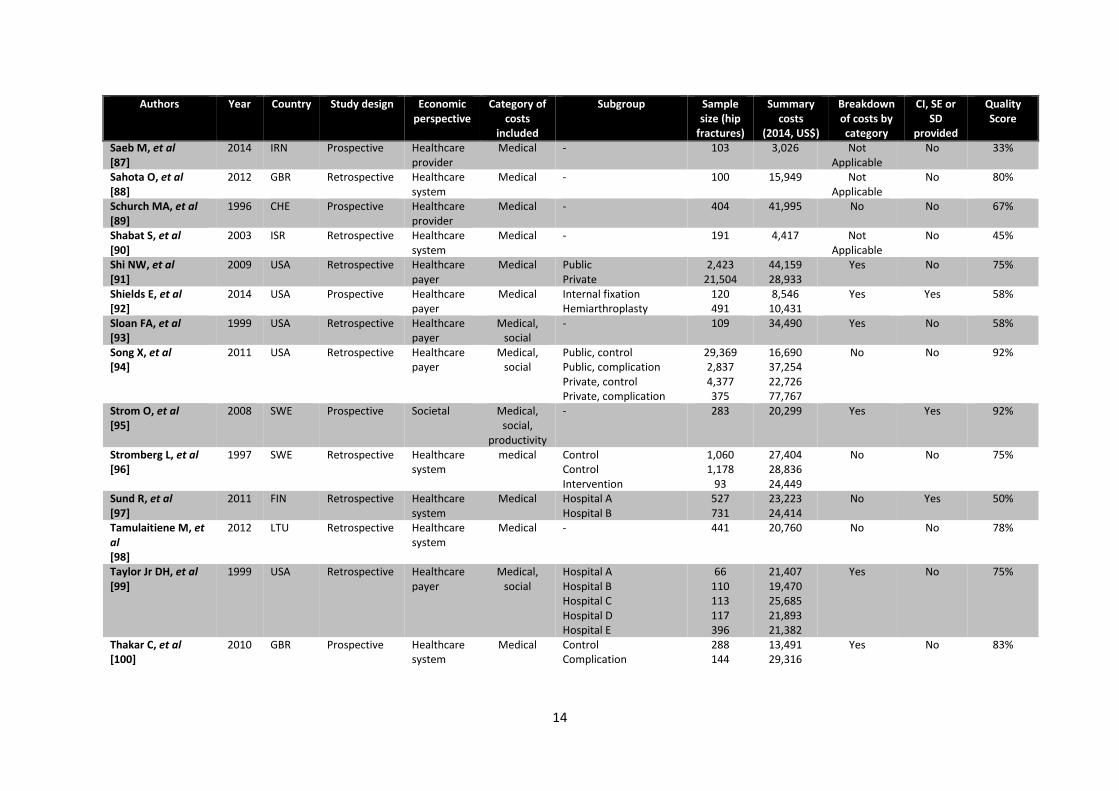
Appendix 4 – Table of included Studies
Authors Year Country Study design Economic perspective
Category of costs
included
Subgroup Sample size (hip
fractures)
Summary costs
(2014, US$)
Breakdown of costs by category
CI, SE or SD
provided
Quality Score
Alekna V, et al [1]
2015 LTU Cross-sectional
Societal Medical - 6 10,071 Yes Yes 75%
Althausen PL, et al [2]
2014 USA Retrospective Healthcare provider
Medical Control Intervention
81 88
9,054 6,913
Not Applicable
No 83%
Autier P, et al [3]
2000 BEL Prospective Healthcare system
Medical, Social
- 170 34,218 Yes Yes 73%
Azhar A, et al [4]
2008 IRL Retrospective Healthcare system
Medical - 143 11,124 Not Applicable
No 64%
Bass E, et al [5]
2008 USA Retrospective Societal Medical, Social
- 43,104 86,633 Yes Yes 75%
Beck TS, et al [6]
1996 USA Retrospective Healthcare provider
Medical - 41 23,588 Not Applicable
Yes 58%
Bessette L, et al [7]
2012 CAN Retrospective Healthcare provider
Medical - 4,536 42,624 No Yes 54%
Blouin J, et al [8]
2009 CAN Retrospective Healthcare system
Medical - 155 19,926 Not Applicable
Yes 77%
Blume SW, et al [9]
2011 USA Cross-sectional
Healthcare system
Medical, Social
- 166 50,453 No Yes 55%
Bonafede M, et al [10]
2013 USA Retrospective Societal Medical, productivity
- 11,585 46,542 Yes No 92%
Borgstrom F, et al [11]
2006 SWE Retrospective Societal Medical, social,
productivity
- 278 17,159 Yes Yes 92%
Bouee S, et al [12]
2006 EUR RCT Healthcare payer
Medical France Belgium Italy Spain UK
159 14,165 14,471 13,651 18,015 16,564
No No 100%
Brainsky A, et al [13]
1997 USA Prospective Societal Medical, social,
productivity
- 759 38,626 Yes No 100%
Brenneman SK, et al [14]
2013 USA Retrospective Healthcare payer
Medical Public Private
253 575
27,171 33,058
No Yes 83%

9
Authors Year Country Study design Economic perspective
Category of costs
included
Subgroup Sample size (hip
fractures)
Summary costs
(2014, US$)
Breakdown of costs by category
CI, SE or SD
provided
Quality Score
Brooks JM, et al [15]
2009 USA RCT Healthcare provider
Medical Control Intervention
720 658
9,195 7,481
Not Applicable
No 50%
Bubshait D, et al [16]
2007 SAU Retrospective Healthcare provider
Medical Female Men
20 23
51,823 44,932
Not Applicable
Yes 67%
Cameron ID, et al [17]
1994 AUS RCT Healthcare payer
Medical, social
Control Intervention
125 127
15,695 13,032
Yes Yes 92%
Carey D, et al [18]
2005 IRL Retrospective Healthcare provider
Medical, social
- 841 11,669 Not Applicable
No 50%
Centers for Disease Control Prevention [19]
1996 USA Retrospective Healthcare payer
Medical - 9,343 32,492 No No 50%
Chen L, et al [20]
2007 SGP Prospective Healthcare payer
Medical - 70 14,674 Not Applicable
Yes 75%
Christensen L, et al [21]
2010 USA Retrospective Healthcare payer
Medical Public Private
1,702 1,711
38,804 44,200
Yes Yes 83%
Clancy T, et al [22]
1998 USA Retrospective Healthcare provider
Medical - 153 13,836 Not Applicable
No 42%
Clark P, et al [23]
2008 MEX Cross-sectional
Healthcare provider
Medical, productivity
Public Public Private Private
61 118 20 19
1,991 4,841 7,662
17,009
Yes No 62%
Colla CH, et al [24]
2010 USA Retrospective Healthcare payer
Medical - 38,346 12,392 Yes Yes 67%
Cotter PE, et al [25]
2006 IRL Retrospective Healthcare system
Medical - 5 18,250 Yes No 50%
Cox MA, et al [26]
1993 NZL Retrospective Healthcare provider
Medical Female 65-74 Female 75+ Male
16 94 21
6,326 9,032 6,987
Yes No 50%
Cui Z, et al [27]
2015 USA Retrospective Healthcare payer
Medical Control Complication Complication
29,831 3,948 1,214
21,974 23,655 21,308
Not Applicable
Yes 92%
Dai KR, et al [28]
2007 CHN Retrospective Healthcare provider
Medical, productivity
- 101 6,820 Yes Yes 62%
De Laet CEDH, et al [29]
1999 NLD Prospective Healthcare system
Medical, social
- 44 38,489 Yes Yes 83%

10
Authors Year Country Study design Economic perspective
Category of costs
included
Subgroup Sample size (hip
fractures)
Summary costs
(2014, US$)
Breakdown of costs by category
CI, SE or SD
provided
Quality Score
Della Rocca GJ, et al [30]
2013 USA Prospective Healthcare payer
Medical Control Intervention
31 115
41,281 55,977
Not Applicable
Yes 42%
Duclos A, et al [31]
2010 FRA Retrospective Healthcare provider
Medical - 6,019 24,983 Yes Yes 100%
Edwards C, et al [32]
2008 GBR Retrospective Healthcare provider
Medical Control Complication
80 80
16,033 46,322
Not Applicable
No 67%
Eekman DA, et al [33]
2014 NLD Prospective Societal Medical, social,
productivity
- 4 16,674 Yes Yes 86%
Espino D, et al [34]
2008 USA Retrospective Healthcare payer
Medical Hispanic Black White
2,842 3,623
119,909
20,308 26,372 22,636
Not Applicable
Yes 58%
Farnworth MG, et al [35]
1994 AUS Prospective Healthcare provider
Medical Control Intervention
71 67
13,161 10,984
Yes No 58%
Findorff MJ, et al [36]
2007 USA RCT Healthcare payer
Medical, social
- 4 40,675 No No 33%
French FH, et al [37]
1995 GBR Prospective Healthcare system
Medical Control Complicated
50 10
7,095 8,395
Yes Yes 75%
Frihagen F, et al [38]
2010 NOR RCT Societal Medical, social
Hemiarthroplasty Internal fixation
110 112
47,857 58,479
Yes Yes 100%
Gabriel SE, et al [39]
2002 USA Retrospective Healthcare provider
Medical - 187 16,161 No No 67%
Galbraith JG, et al [40]
2011 IRL Prospective Healthcare provider
Medical - 4 22,541 Not Applicable
No 33%
Garcia AE, et al [41]
2012 USA Retrospective Healthcare provider
Medical - 660 34,279 Not Applicable
No 50%
Gill B, et al [42]
2007 USA Retrospective Healthcare provider
Medical Inter-medullary nail Internal fixation
44 51
33,933 33,001
Not Applicable
Yes 25%
Gutierrez L, et al [43]
2011 GBR Retrospective Healthcare system
Medical, productivity
- 2,427 8,773 Yes Yes 75%
Heinrich S, et al [44]
2011 DEU Retrospective Healthcare payer
Medical, social
- 1,525 10,770 Yes Yes 100%
Hirose J, et al [45]
2008 JPN Retrospective Healthcare provider
Medical Control Complication
650 163
14,049 20,638
Not Applicable
No 50%
11
Authors Year Country Study design Economic perspective
Category of costs
included
Subgroup Sample size (hip
fractures)
Summary costs
(2014, US$)
Breakdown of costs by category
CI, SE or SD
provided
Quality Score
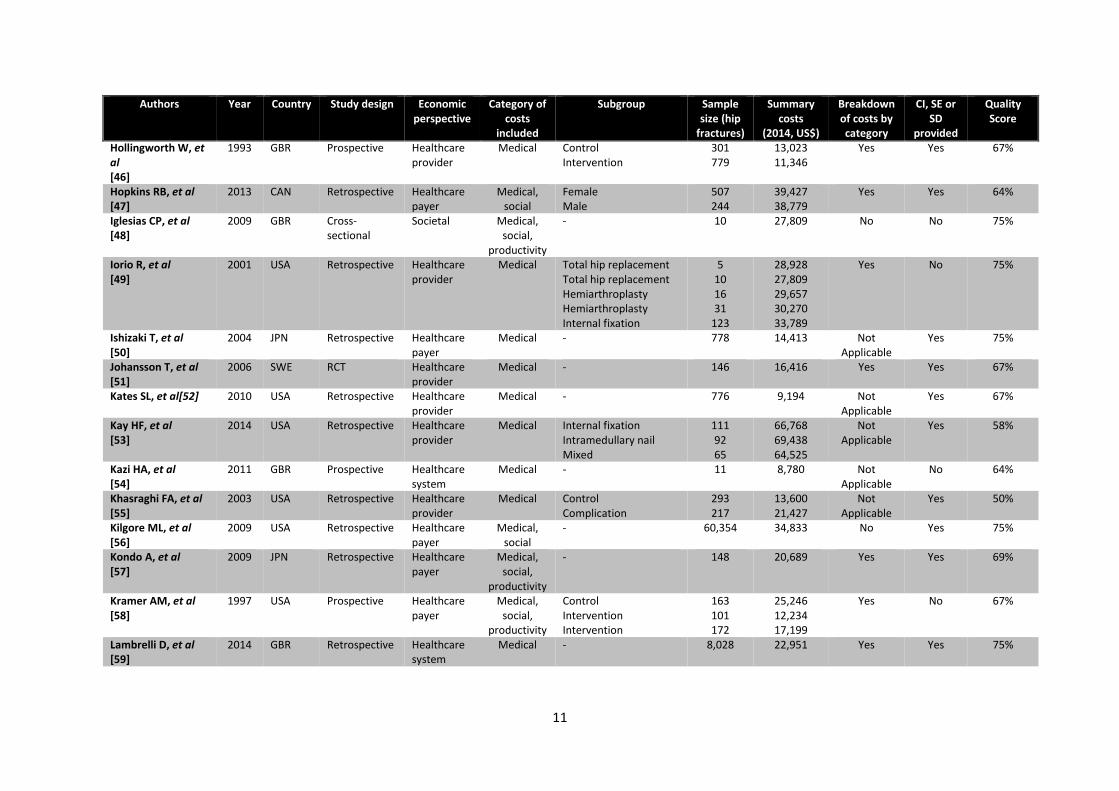
Hollingworth W, et al [46]
1993 GBR Prospective Healthcare provider
Medical Control Intervention
301 779
13,023 11,346
Yes Yes 67%
Hopkins RB, et al [47]
2013 CAN Retrospective Healthcare payer
Medical, social
Female Male
507 244
39,427 38,779
Yes Yes 64%
Iglesias CP, et al [48]
2009 GBR Cross-sectional
Societal Medical, social,
productivity
- 10 27,809 No No 75%
Iorio R, et al [49]
2001 USA Retrospective Healthcare provider
Medical Total hip replacement Total hip replacement Hemiarthroplasty Hemiarthroplasty Internal fixation
5 10 16 31
123
28,928 27,809 29,657 30,270 33,789
Yes No 75%
Ishizaki T, et al [50]
2004 JPN Retrospective Healthcare payer
Medical - 778 14,413 Not Applicable
Yes 75%
Johansson T, et al [51]
2006 SWE RCT Healthcare provider
Medical - 146 16,416 Yes Yes 67%
Kates SL, et al[52] 2010 USA Retrospective Healthcare provider
Medical - 776 9,194 Not Applicable
Yes 67%
Kay HF, et al [53]
2014 USA Retrospective Healthcare provider
Medical Internal fixation Intramedullary nail Mixed
111 92 65
66,768 69,438 64,525
Not Applicable
Yes 58%
Kazi HA, et al [54]
2011 GBR Prospective Healthcare system
Medical - 11 8,780 Not Applicable
No 64%
Khasraghi FA, et al [55]
2003 USA Retrospective Healthcare provider
Medical Control Complication
293 217
13,600 21,427
Not Applicable
Yes 50%
Kilgore ML, et al [56]
2009 USA Retrospective Healthcare payer
Medical, social
- 60,354 34,833 No Yes 75%
Kondo A, et al [57]
2009 JPN Retrospective Healthcare payer
Medical, social,
productivity
- 148 20,689 Yes Yes 69%
Kramer AM, et al [58]
1997 USA Prospective Healthcare payer
Medical, social,
productivity
Control Intervention Intervention
163 101 172
25,246 12,234 17,199
Yes No 67%
Lambrelli D, et al [59]
2014 GBR Retrospective Healthcare system
Medical - 8,028 22,951 Yes Yes 75%
12
Authors Year Country Study design Economic perspective
Category of costs
included
Subgroup Sample size (hip
fractures)
Summary costs
(2014, US$)
Breakdown of costs by category
CI, SE or SD
provided
Quality Score
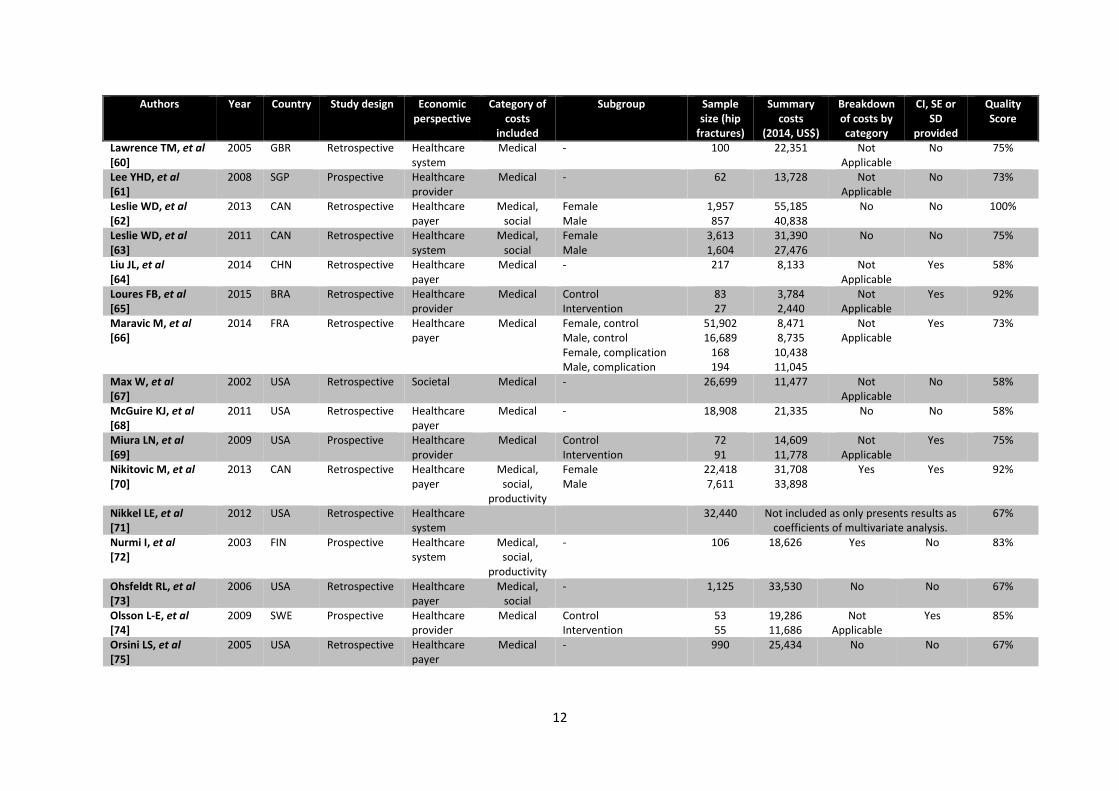
Lawrence TM, et al [60]
2005 GBR Retrospective Healthcare system
Medical - 100 22,351 Not Applicable
No 75%
Lee YHD, et al [61]
2008 SGP Prospective Healthcare provider
Medical - 62 13,728 Not Applicable
No 73%
Leslie WD, et al [62]
2013 CAN Retrospective Healthcare payer
Medical, social
Female Male
1,957 857
55,185 40,838
No No 100%
Leslie WD, et al [63]
2011 CAN Retrospective Healthcare system
Medical, social
Female Male
3,613 1,604
31,390 27,476
No No 75%
Liu JL, et al [64]
2014 CHN Retrospective Healthcare payer
Medical - 217 8,133 Not Applicable
Yes 58%
Loures FB, et al [65]
2015 BRA Retrospective Healthcare provider
Medical Control Intervention
83 27
3,784 2,440
Not Applicable
Yes 92%
Maravic M, et al [66]
2014 FRA Retrospective Healthcare payer
Medical Female, control Male, control Female, complication Male, complication
51,902 16,689
168 194
8,471 8,735
10,438 11,045
Not Applicable
Yes 73%
Max W, et al [67]
2002 USA Retrospective Societal Medical - 26,699 11,477 Not Applicable
No 58%
McGuire KJ, et al [68]
2011 USA Retrospective Healthcare payer
Medical - 18,908 21,335 No No 58%
Miura LN, et al [69]
2009 USA Prospective Healthcare provider
Medical Control Intervention
72 91
14,609 11,778
Not Applicable
Yes 75%
Nikitovic M, et al [70]
2013 CAN Retrospective Healthcare payer
Medical, social,
productivity
Female Male
22,418 7,611
31,708 33,898
Yes Yes 92%
Nikkel LE, et al [71]
2012 USA Retrospective Healthcare system
32,440 Not included as only presents results as coefficients of multivariate analysis.
67%
Nurmi I, et al [72]
2003 FIN Prospective Healthcare system
Medical, social,
productivity
- 106 18,626 Yes No 83%
Ohsfeldt RL, et al [73]
2006 USA Retrospective Healthcare payer
Medical, social
- 1,125 33,530 No No 67%
Olsson L-E, et al [74]
2009 SWE Prospective Healthcare provider
Medical Control Intervention
53 55
19,286 11,686
Not Applicable
Yes 85%
Orsini LS, et al [75]
2005 USA Retrospective Healthcare payer
Medical - 990 25,434 No No 67%

13
Authors Year Country Study design Economic perspective
Category of costs
included
Subgroup Sample size (hip
fractures)
Summary costs
(2014, US$)
Breakdown of costs by category
CI, SE or SD
provided
Quality Score
Oster G, et al [76]
2004 USA Retrospective Healthcare payer
Medical Control Complication Complication
198 40 59
43,147 76,417 54,210
Yes Yes 75%
Palmer SJ, et al [77]
2000 GBR Prospective Healthcare system
Medical Hemiarthroplasty, control Internal fixation, control Internal fixation, control Hemiarthroplasty, complication Internal fixation, complication Internal fixation, complication
864
634
1,246
44
54
146
10,612
7,559
12,030
24,755
24,809
15,543
No No 83%
Papakonstantinou VV, et al [78]
2008 GRC Prospective Healthcare provider
Medical Internal fixation Hemiarthroplasty
82 91
3,836 7,389
Not Applicable
No 75%
Pike C, et al [79]
2010 USA Retrospective Healthcare payer
Medical Public Private
7,997 255
40,702 21,259
No Yes 92%
Polder JJ, et al [80]
2003 NLD Prospective Societal Medical, social,
productivity
Control Intervention
102 106
25,077 23,349
Yes Yes 100%
Pollard TCB, et al [81]
2006 GBR Retrospective Healthcare system
Medical Control Complication
122 61
12,875 43,589
Not Applicable
No 83%
Qu B, et al [82]
2014 CHN Prospective Societal Medical, social,
productivity
- 437 10,160 Yes Yes 77%
Randell A, et al [83]
1995 AUS Retrospective Healthcare system
Medical, social
Female Male
17 9
22,138 15,018
No No 75%
Reginster JY, et al [84]
1999 BEL Retrospective Healthcare payer
Medical - 2,374 13,639 Not Applicable
Yes 91%
Rogmark C, et al [85]
2003 SWE RCT Healthcare system
Medical, social
Arthroplasty Internal fixation
32 36
20,689 28,896
No No 75%
Roy A, et al [86]
2006 USA Retrospective Healthcare provider
Medical Control Intervention
71 47
16,325 14,062
Not Applicable
Yes 42%
14
Authors Year Country Study design Economic perspective
Category of costs
included
Subgroup Sample size (hip
fractures)
Summary costs
(2014, US$)
Breakdown of costs by category
CI, SE or SD
provided
Quality Score
Saeb M, et al [87]
2014 IRN Prospective Healthcare provider
Medical - 103 3,026 Not Applicable
No 33%
Sahota O, et al [88]
2012 GBR Retrospective Healthcare system
Medical - 100 15,949 Not Applicable
No 80%
Schurch MA, et al [89]
1996 CHE Prospective Healthcare provider
Medical - 404 41,995 No No 67%
Shabat S, et al [90]
2003 ISR Retrospective Healthcare system
Medical - 191 4,417 Not Applicable
No 45%
Shi NW, et al [91]
2009 USA Retrospective Healthcare payer
Medical Public Private
2,423 21,504
44,159 28,933
Yes No 75%
Shields E, et al [92]
2014 USA Prospective Healthcare payer
Medical Internal fixation Hemiarthroplasty
120 491
8,546 10,431
Yes Yes 58%
Sloan FA, et al [93]
1999 USA Retrospective Healthcare payer
Medical, social
- 109 34,490 Yes No 58%
Song X, et al [94]
2011 USA Retrospective Healthcare payer
Medical, social
Public, control Public, complication Private, control Private, complication
29,369 2,837 4,377 375
16,690 37,254 22,726 77,767
No No 92%
Strom O, et al [95]
2008 SWE Prospective Societal Medical, social,
productivity
- 283 20,299 Yes Yes 92%
Stromberg L, et al [96]
1997 SWE Retrospective Healthcare system
medical Control Control Intervention
1,060 1,178
93
27,404 28,836 24,449
No No 75%
Sund R, et al [97]
2011 FIN Retrospective Healthcare system
Medical Hospital A Hospital B
527 731
23,223 24,414
No Yes 50%
Tamulaitiene M, et al [98]
2012 LTU Retrospective Healthcare system
Medical - 441 20,760 No No 78%
Taylor Jr DH, et al [99]
1999 USA Retrospective Healthcare payer
Medical, social
Hospital A Hospital B Hospital C Hospital D Hospital E
66 110 113 117 396
21,407 19,470 25,685 21,893 21,382
Yes No 75%
Thakar C, et al [100]
2010 GBR Prospective Healthcare system
Medical Control Complication
288 144
13,491 29,316
Yes No 83%

15
Authors Year Country Study design Economic perspective
Category of costs
included
Subgroup Sample size (hip
fractures)
Summary costs
(2014, US$)
Breakdown of costs by category
CI, SE or SD
provided
Quality Score
Thakore RV, et al [101]
2014 USA Retrospective Healthcare payer
Medical Complication Complication Complication
58 118 371
11,449 16,305 12,767
Not Applicable
Yes 67%
Tow BPB, et al [102]
2009 SGP Retrospective Healthcare provider
Medical Control Complication
33 33
8,326 8,690
Not Applicable
No 50%
van Balen R, et al [103]
2002 NLD Prospective Healthcare provider
Medical, social
Control Intervention
102 106
25,077 23,349
Yes Yes 75%
Viswanathan H, et al [104]
2012 USA Retrospective Healthcare payer
Medical, social
- 158 28,391 No Yes 92%
Waaler Bjornelv GM, et al [105]
2012 NOR RCT Societal Medical, social,
productivity
Hemiarthroplasty Internal fixation
80 86
53,337 70,886
No Yes 79%
Wiktorowicz ME, et al [106]
2001 CAN Retrospective Societal Medical, social,
productivity
Home dwelling Home to institution Institution to institution
338 61
105
24,402 50,386 38,488
Yes Yes 92%
Wong MK, et al [107]
2002 SGP Retrospective Healthcare system
Medical - 274 10,501 Not Applicable
No 42%
Woolcott JC, et al [108]
2012 CAN Prospective Healthcare provider
medical - 18 34,820 No Yes 75%
Woratanarat P, et al [109]
2005 THA Prospective Healthcare payer
Medical, productivity
- 37 13,429 No No 77%
Wyers CE, et al [110]
2013 NLD RCT Societal Medical, social,
productivity
Control Intervention
79 73
28,744 29,318
Yes Yes 92%
Zethraeus N, et al [111]
1997 SWE Retrospective Healthcare system
Medical, social
- 1,709 38,698 Yes No 82%
Zhao Y, et al [112]
2013 USA Retrospective Healthcare payer
Medical, social
Public, control Public, complication Public, complication Private, control Private, complication Private, complication
22,522 839
2,761 4,574 132 394
30,034 44,547 50,931 41,190 96,060 72,537
No Yes 83%
Zielinski SM, et al [113]
2014 NLD RCT Societal Medical, social
- 248 24,387 Yes Yes 92%

16
Bibliography for included studies 1. Alekna V, Stukas R, Tamulaityte-Morozoviene I, Surkiene G, Tamulaitiene M (2015) Self-reported consequences and healthcare costs of falls among elderly women. Medicina (Kaunas) 51 (1):57-62. doi:http://dx.doi.org/10.1016/j.medici.2015.01.008 2. Althausen PL, Lu M, Thomas KC, Shannon SF, Biagi BN, Boyden EM (2014) Implant Standardization for Hemiarthroplasty: Implementation of a Pricing Matrix System at a Level II Community Based Trauma System. Journal of Arthroplasty 29 (4):781-785. doi:http://dx.doi.org/10.1016/j.arth.2013.07.006 3. Autier P, Haentjens P, Bentin J, Baillon JM, Grivegnee AR, Closon MC, Boonen S (2000) Costs induced by hip fractures: a prospective controlled study in Belgium. Belgian Hip Fracture Study Group. Osteoporosis International 11 (5):373-380 4. Azhar A, Lim C, Kelly E, O'Rourke K, Dudeney S, Hurson B, Quinlan W (2008) Cost induced by hip fractures. Irish Medical Journal 101 (7):213-215 5. Bass E, French DD, Bradham DD (2008) A national perspective of Medicare expenditures for elderly veterans with hip fractures. J Am Med Dir Assoc 9 (2):114-119. doi:10.1016/j.jamda.2007.10.001 6. Beck TS, Brinker MR, Daum WJ (1996) In-hospital charges associated with the treatment of adult femoral neck fractures. American journal of orthopedics (Belle Mead, NJ) 25 (9):608-612 7. Bessette L, Jean S, Lapointe-Garant MP, Belzile EL, Davison KS, Ste-Marie LG, Brown JP (2012) Direct medical costs attributable to peripheral fractures in Canadian post-menopausal women. Osteoporosis International 23 (6):1757-1768. doi:10.1007/s00198-011-1785-9 8. Blouin J, Dragomir A, Fredette M, Ste-Marie LG, Fernandes JC, Perreault S (2009) Comparison of direct health care costs related to the pharmacological treatment of osteoporosis and to the management of osteoporotic fractures among compliant and noncompliant users of alendronate and risedronate: a population-based study. Osteoporosis International 20 (9):1571-1581. doi:10.1007/s00198-008-0818-5 9. Blume SW, Curtis JR (2011) Medical costs of osteoporosis in the elderly Medicare population. Osteoporosis International 22 (6):1835-1844. doi:10.1007/s00198-010-1419-7 10. Bonafede M, Espindle D, Bower AG (2013) The direct and indirect costs of long bone fractures in a working age US population. Journal of Medical Economics 16 (1):169-178. doi:http://dx.doi.org/10.3111/13696998.2012.737391 11. Borgstrom F, Zethraeus N, Johnell O, Lidgren L, Ponzer S, Svensson O, Abdon P, Ornstein E, Lunsjo K, Thorngren KG, Sernbo I, Rehnberg C, Jonsson B (2006) Costs and quality of life associated with osteoporosis-related fractures in Sweden. Osteoporosis International 17 (5):637-650. doi:10.1007/s00198-005-0015-8 12. Bouee S, Lafuma A, Fagnani F, Meunier PJ, Reginster JY (2006) Estimation of direct unit costs associated with non-vertebral osteoporotic fractures in five European countries. Rheumatology international 26 (12):1063-1072. doi:10.1007/s00296-006-0180-x 13. Brainsky A, Glick H, Lydick E, Epstein R, Fox KM, Hawkes W, Michael Kashner T, Zimmerman SI, Magaziner J (1997) The economic cost of hip fractures in community-dwelling older adults: A prospective study. Journal of the American Geriatrics Society 45 (3):281-287 14. Brenneman SK, Yurgin N, Fan Y (2013) Cost and management of males with closed fractures. Osteoporosis International 24 (3):825-833. doi:10.1007/s00198-012-2067-x 15. Brooks JM, Titler MG, Ardery G, Herr K (2009) Effect of Evidence-Based Acute Pain Management Practices on Inpatient Costs. Health Serv Res 44 (1):245-263. doi:10.1111/j.1475-6773.2008.00912.x 16. Bubshait D, Sadat-Ali M (2007) Economic implications of osteoporosis-related femoral fractures in Saudi Arabian society. Calcif Tissue Int 81 (6):455-458. doi:10.1007/s00223-007-9090-5 17. Cameron ID, Lyle DM, Quine S (1994) Cost effectiveness of accelerated rehabilitation after proximal femoral fracture. Journal of Clinical Epidemiology 47 (11):1307-1313

17
18. Carey D, Laffoy M (2005) Hospitalisations due to falls in older persons. Irish Medical Journal 98 (6):179-181 19. Centers for Disease Control and Prevention (1996) Incidence and costs to Medicare of fractures among Medicare beneficiaries aged > or = 65 years--United States, July 1991-June 1992. MMWR Morb Mortal Wkly Rep 45 (41):877-883 20. Chen L-T, Lee JAY, Chua BSY, Howe T-S (2007) Hip fractures in the elderly: the impact of comorbid illnesses on hospitalisation costs. Ann Acad Med Singapore 36 (9):784-787 21. Christensen L, Iqbal S, Macarios D, Badamgarav E, Harley C (2010) Cost of fractures commonly associated with osteoporosis in a managed-care population. Journal of Medical Economics 13 (2):302-313. doi:http://dx.doi.org/10.3111/13696998.2010.488969 22. Clancy T, Kitchen S, Churchill P, Covington D, Hundley J, Maxwell JG (1998) DRG reimbursement: Geriatric hip fractures in the community hospital trauma center. SouthMedJ 91 (5):457-461 23. Clark P, Carlos F, Barrera C, Guzman J, Maetzel A, Lavielle P, Ramirez E, Robinson V, Rodriguez-Cabrera R, Tamayo J, Tugwell P (2008) Direct costs of osteoporosis and hip fracture: an analysis for the Mexican healthcare system. Osteoporosis International 19 (3):269-276. doi:10.1007/s00198-007-0496-8 24. Colla CH, Escarce JJ, Buntin MB, Sood N (2010) Effects of Competition on the Cost and Quality of Inpatient Rehabilitation Care under Prospective Payment. Health Serv Res 45 (6):1981-2006. doi:10.1111/j.1475-6773.2010.01190.x 25. Cotter PE, Timmons S, O'Connor M, Twomey C, O'Mahony D (2006) The financial implications of falls in older people for an acute hospital. Irish Journal of Medical Science 175 (2):11-13 26. Cox MA, Bowie R, Horne G (1993) Hip fractures: an increasing health care cost. Journal of Orthopaedic Trauma 7 (1):52-57 27. Cui Z, Schoenfeld MJ, Bush EN, Chen Y, Burge R (2015) Characteristics of hip fracture patients with and without muscle atrophy/weakness: Predictors of negative economic outcomes. Journal of Medical Economics 18 (1):1-11. doi:http://dx.doi.org/10.3111/13696998.2014.969433 28. Dai KR, Zhang QY, Fan T, Sen SBS, Osteoporotic Hip Fracture China S (2007) Estimation of resource utilization associated with osteoporotic hip fracture and level of post-acute care in China. Curr Med Res Opin 23 (12):2937-2943. doi:10.1185/030079907x233061 29. De Laet CEDH, Van Hout BA, Burger H, Weel AEAM, Hofman A, Pols HAP (1999) Incremental cost of medical care after hip fracture and first vertebral fracture: The Rotterdam Study. Osteoporosis International 10 (1):66-72. doi:http://dx.doi.org/10.1007/s001980050196 30. Della Rocca GJ, Moylan KC, Crist BD, Volgas DA, Stannard JP, Mehr DR (2013) Comanagement of geriatric patients with hip fractures: a retrospective, controlled, cohort study. Geriatric Orthopaedic Surgery and Rehabilitation 4 (1):10-15 31. Duclos A, Couray-Targe S, Randrianasolo M, Hedoux S, Couris CM, Colin C, Schott AM (2010) Burden of hip fracture on inpatient care: a before and after population-based study. Osteoporosis International 21 (9):1493-1501. doi:10.1007/s00198-009-1087-7 32. Edwards C, Counsell A, Boulton C, Moran CG (2008) Early infection after hip fracture surgery: risk factors, costs and outcome. Journal of Bone and Joint Surgery, British 90 (6):770-777. doi:http://dx.doi.org/10.1302/0301-620X.90B6.20194 33. Eekman DA, ter Wee MM, Coupe VM, Erisek-Demirtas S, Kramer MH, Lems WF (2014) Indirect costs account for half of the total costs of an osteoporotic fracture: a prospective evaluation. Osteoporosis International 25 (1):195-204. doi:http://dx.doi.org/10.1007/s00198-013-2505-4 34. Espino DV, Silva Ross J, Oakes SL, Becho J, Wood RC (2008) Characteristics of hip fractures among hospitalized elder Mexican American Black and White Medicare beneficiaries in the Southwestern United States. Aging Clin Exp Res 20 (4):344-348 35. Farnworth MG, Kenny P, Shiell A (1994) The costs and effects of early discharge in the management of fractured hip.[Erratum appears in Age Ageing. 1995 Jul;24(4):367; PMID: 7484498]. Age Ageing 23 (3):190-194
18
36. Findorff MJ, Wyman JF, Nyman JA, Croghan CF (2007) Measuring the Direct Healthcare Costs of a Fall Injury Event. Nursing Research 56 (4):283-287. doi:10.1097/01.NNR.0000280613.90694.b2 37. French FH, Torgerson DJ, Porter RW (1995) Cost analysis of fracture of the neck of femur. Age Ageing 24 (3):185-189 38. Frihagen F, Waaler GM, Madsen JE, Nordsletten L, Aspaas S, Aas E (2010) The cost of hemiarthroplasty compared to that of internal fixation for femoral neck fractures: 2-year results involving 222 patients based on a randomized controlled trial. Acta Orthopaedica 81 (4):446-452. doi:http://dx.doi.org/10.3109/17453674.2010.492763 39. Gabriel SE, Tosteson ANA, Leibson CL, Crowson CS, Pond GR, Hammond CS, Melton LJ (2002) Direct medical costs attributable to osteoporotic fractures. Osteoporosis International 13 (4):323-330. doi:10.1007/s001980200033 40. Galbraith JG, Butler JS, Memon AR, Dolan MA, Harty JA (2011) Cost Analysis of a Falls-prevention Program in an Orthopaedic Setting. Clin Orthop Rel Res 469 (12):3462-3468. doi:10.1007/s11999-011-1932-9 41. Garcia AE, Bonnaig JV, Yoneda ZT, Richards JE, Ehrenfeld JM, Obremskey WT, Jahangir AA, Sethi MK (2012) Patient Variables Which May Predict Length of Stay and Hospital Costs in Elderly Patients With Hip Fracture. Journal of Orthopaedic Trauma 26 (11):620-623. doi:10.1097/BOT.0b013e3182695416 42. Gill JB, Jensen L, Chin PC, Rafiei P, Reddy K, Schutt RC, Jr. (2007) Intertrochanteric hip fractures treated with the trochanteric fixation nail and sliding hip screw. J Surg Orthop Adv 16 (2):62-66 43. Gutierrez L, Roskell N, Castellsague J, Beard S, Rycroft C, Abeysinghe S, Shannon P, Robbins S, Gitlin M (2011) Study of the incremental cost and clinical burden of hip fractures in postmenopausal women in the United Kingdom. Journal of Medical Economics 14 (1):99-107. doi:http://dx.doi.org/10.3111/13696998.2010.547967 44. Heinrich S, Rapp K, Rissmann U, Becker C, Konig HH (2011) Service Use and Costs of Incident Femoral Fractures in Nursing Home Residents in Germany: The Bavarian Fall and Fracture Prevention Project (BF2P2). J Am Med Dir Assoc 12 (6):459-466. doi:10.1016/j.jamda.2010.11.008 45. Hirose J, Mizuta H, Ide J, Nakamura E, Takada K (2008) E-PASS for predicting postoperative risk with hip fracture: a multicenter study. Clin Orthop 466 (11):2833-2841. doi:http://dx.doi.org/10.1007/s11999-008-0377-2 46. Hollingworth W, Todd C, Parker M, Roberts JA, Williams R (1993) Cost analysis of early discharge after hip fracture. Bmj 307 (6909):903-906 47. Hopkins RB, Tarride JE, Leslie WD, Metge C, Lix LM, Morin S, Finlayson G, Azimaee M, Pullenayegum E, Goeree R, Adachi JD, Papaioannou A, Thabane L (2013) Estimating the excess costs for patients with incident fractures, prevalent fractures, and nonfracture osteoporosis. Osteoporosis International 24 (2):581-593. doi:10.1007/s00198-012-1997-7 48. Iglesias CP, Manca A, Torgerson DJ (2009) The health-related quality of life and cost implications of falls in elderly women. Osteoporosis International 20 (6):869-878. doi:10.1007/s00198-008-0753-5 49. Iorio R, Healy WL, Lemos DW, Appleby D, Lucchesi CA, Saleh KJ (2001) Displaced femoral neck fractures in the elderly: outcomes and cost effectiveness. Clin Orthop (383):229-242 50. Ishizaki T, Imanaka Y, Oh E, Kuwabara K, Hirose M, Hayashida K, Harada Y (2004) Association of hospital resource use with comorbidity status and patient age among hip fracture patients in Japan. Health Policy 69 (2):179-187. doi:10.1016/j.healthpol.2003.12.018 51. Johansson T, Bachrach-Lindstrom M, Aspenberg P, Jonsson D, Wahlstrom O (2006) The total costs of a displaced femoral neck fracture: comparison of internal fixation and total hip replacement. A randomised study of 146 hips. Int Orthop 30 (1):1-6 52. Kates SL, Blake D, Bingham KW, Kates OS, Mendelson DA, Friedman SM (2010) Comparison of an organized geriatric fracture program to United States government data. Geriatr 1 (1):15-21. doi:http://dx.doi.org/10.1177/2151458510382231

19
53. Kay HF, Sathiyakumar V, Yoneda ZT, Lee YM, Jahangir AA, Ehrenfeld JM, Obremskey WT, Apfeld JC, Sethi MK (2014) The effects of American society of anesthesiologists physical status on length of stay and inpatient cost in the surgical treatment of isolated orthopaedic fractures. Journal of Orthopaedic Trauma 28 (7):e153-e159. doi:http://dx.doi.org/10.1097/01.bot.0000437568.84322.cd 54. Kazi HA, Acharya A (2011) Comparison of trauma and elective income in a district general hospital. British Journal of Medical Practitioners 4 (4) 55. Khasraghi FA, Lee EJ, Christmas C, Wenz JF (2003) The economic impact of medical complications in geriatric patients with hip fracture. Orthopedics 26 (1):49-53 56. Kilgore ML, Morrisey MA, Becker DJ, Gary LC, Curtis JR, Saag KG, Yun H, Matthews R, Smith W, Taylor A, Arora T, Delzell E (2009) Health care expenditures associated with skeletal fractures among medicare beneficiaries, 1999-2005. Journal of Bone and Mineral Research 24 (12):2050-2055. doi:http://dx.doi.org/10.1359/jbmr.090523 57. Kondo A, Zierler BK, Isokawa Y, Hagino H, Ito Y (2009) Comparison of outcomes and costs after hip fracture surgery in three hospitals that have different care systems in Japan. Health Policy 91 (2):204-210. doi:10.1016/j.healthpol.2008.12.006 58. Kramer AM, Steiner JF, Schlenker RE, Eilertsen TB, Hrincevich CA, Tropea DA, Ahmad LA, Eckhoff DG (1997) Outcomes and costs after hip fracture and stroke: a comparison of rehabilitation settings. Journal of the American Medical Association 277 (5):396-404 59. Lambrelli D, Burge R, Raluy-Callado M, Chen SY, Wu N, Schoenfeld MJ (2014) Retrospective database study to assess the economic impact of hip fracture in the United Kingdom. Journal of Medical Economics 17 (11):817-825. doi:http://dx.doi.org/10.3111/13696998.2014.959588 60. Lawrence TM, White CT, Wenn R, Moran CG (2005) The current hospital costs of treating hip fractures. Injury-International Journal of the Care of the Injured 36 (1):88-91. doi:10.1016/j.injury.2004.06.015 61. Lee YHD, Lim YW, Lam KS (2008) Economic cost of osteoporotic hip fractures in Singapore. Singap Med J 49 (12):980-984 62. Leslie WD, Lix LM, Finlayson GS, Metge CJ, Morin SN, Majumdar SR (2013) Direct healthcare costs for 5 years post-fracture in Canada: a long-term population-based assessment. Osteoporosis International 24 (5):1697-1705. doi:http://dx.doi.org/10.1007/s00198-012-2232-2 63. Leslie WD, Metge CJ, Azimaee M, Lix LM, Finlayson GS, Morin SN, Caetano P (2011) Direct Costs of Fractures in Canada and Trends 1996-2006: A Population-Based Cost-of-Illness Analysis. Journal of Bone and Mineral Research 26 (10):2419-2429. doi:10.1002/jbmr.457 64. Liu JL, Wang XL, Gong MW, Mai HX, Pei SJ, Yuan WX, Zhang H (2014) Comparative outcomes of peripheral nerve blocks versus general anesthesia for hip fractures in geriatric Chinese patients. Patient Prefer Adherence 8:651-659. doi:http://dx.doi.org/10.2147/PPA.S61903 65. Loures FB, Chaoubah A, Oliveira VM, Almeida AM, Campos EM, Paiva EP (2015) Economic analysis of surgical treatment of hip fracture in older adults. Rev Saude Publica 49:1-7 66. Maravic M, Ostertag A, Torres PU, Cohen-Solal M (2014) Incidence and risk factors for hip fractures in dialysis patients. Osteoporosis International 25 (1):159-165. doi:http://dx.doi.org/10.1007/s00198-013-2435-1 67. Max W, Sinnot P, Kao C, Sung HY, Rice DP (2002) The burden of osteoporosis in California, 1998. Osteoporosis International 13 (6):493-500. doi:10.1007/s001980200060 68. McGuire KJ, Chacko AT, Bernstein J (2011) Cost-effectiveness of Teaching Hospitals for the Operative Management of Hip Fractures. Orthopedics 34 (10):E598-E601. doi:10.3928/01477447-20110826-17 69. Miura LN, DiPiero AR, Homer LD (2009) Effects of a Geriatrician-Led Hip Fracture Program: Improvements in Clinical and Economic Outcomes. Journal of the American Geriatrics Society 57 (1):159-167. doi:10.1111/j.1532-5415.2008.02069.x 70. Nikitovic M, Wodchis WP, Krahn MD, Cadarette SM (2013) Direct health-care costs attributed to hip fractures among seniors: a matched cohort study. Osteoporosis International 24 (2):659-669. doi:10.1007/s00198-012-2034-6

20
71. Nikkel LE, Fox EJ, Black KP, Davis C, Andersen L, Hollenbeak CS (2012) Impact of Comorbidities on Hospitalization Costs Following Hip Fracture. J Bone Joint Surg-Am Vol 94A (1):9-17. doi:10.2106/jbjs.j.01077 72. Nurmi I, Narinen A, Luthje P, Tanninen S (2003) Cost analysis of hip fracture treatment among the elderly for the public health services: a 1-year prospective study in 106 consecutive patients. Archives of Orthopaedic and Trauma Surgery 123 (10):551-554. doi:10.1007/s00402-003-0583-z 73. Ohsfeldt RL, Borisov NN, Sheer RL (2006) Fragility fracture-related direct medical costs in the first year following a nonvertebral fracture in a managed care setting. Osteoporosis International 17 (2):252-258. doi:10.1007/s00198-005-1993-2 74. Olsson L-E, Hansson E, Ekman I, Karlsson J (2009) A cost-effectiveness study of a patient-centred integrated care pathway. J Adv Nurs 65 (8):1626-1635. doi:http://dx.doi.org/10.1111/j.1365-2648.2009.05017.x 75. Orsini LS, Rousculp MD, Long SR, Wang SH (2005) Health care utilization and expenditures in the United States: a study of osteoporosis-related fractures. Osteoporosis International 16 (4):359-371. doi:10.1007/s00198-004-1694-2 76. Oster G, Ollendorf DA, Vera-Llonch M, Hagiwara M, Berger A, Edelsberg J (2004) Economic consequences of venous thromboembolism following major orthopedic surgery. Annals of Pharmacotherapy 38 (3):377-382. doi:10.1345/aph.1C518 77. Palmer SJ, Parker MJ, Hollingworth W (2000) The cost and implications of reoperation after surgery for fracture of the hip. The Journal of bone and joint surgery British volume 82 (6):864-866 78. Papakonstantinou VV, Kaitelidou D, Gkolfinopoulou KD, Siskou OC, Papapolychroniou T, Baltopoulos P, Liaropoulos L (2008) Extracapsular hip fracture management: Cost-consequences analysis of two alternative operative methods. Int J Technol Assess Health Care 24 (2):221-227. doi:10.1017/s0266462308080306 79. Pike C, Birnbaum HG, Schiller M, Sharma H, Burge R, Edgell ET (2010) Direct and Indirect Costs of Non-Vertebral Fracture Patients with Osteoporosis in the US. PharmacoEconomics 28 (5):395-409 80. Polder JJ, van Balen R, Steyerberg EW, Cools HJ, Habbema JD (2003) A cost-minimisation study of alternative discharge policies after hip fracture repair. Health economics 12 (2):87-100. doi:10.1002/hec.690 81. Pollard TCB, Newman JE, Barlow NJ, Price JD, Willett KM (2006) Deep wound infection after proximal femoral fracture: consequences and costs. Journal of Hospital Infection 63 (2):133-139. doi:10.1016/j.jhin.2006.01.015 82. Qu B, Ma Y, Yan M, Wu HH, Fan L, Liao DF, Pan XM, Hong Z (2014) The economic burden of fracture patients with osteoporosis in western China. Osteoporosis International 25 (7):1853-1860 83. Randell A, Sambrook PN, Nguyen TV, Lapsley H, Jones G, Kelly PJ, Eisman JA (1995) Direct clinical and welfare costs of osteoporotic fractures in elderly men and women. Osteoporosis International 5 (6):427-432. doi:10.1007/bf01626603 84. Reginster JY, Gillet P, Sedrine WB, Brands G, Ethgen O, De Froidmont C, Gosset C (1999) Direct costs of hip fractures in patients over 60 years of age in Belgium. PharmacoEconomics 15 (5):507-514. doi:http://dx.doi.org/10.2165/00019053-199915050-00008 85. Rogmark C, Carlsson A, Johnell O, Sernbo I (2003) Costs of internal fixation and arthroplasty for displaced femoral neck fractures: A randomized study of 68 patients. Acta Orthopaedica Scandinavica 74 (3):293-298. doi:http://dx.doi.org/10.1080/00016470310014210 86. Roy A, Heckman MG, Roy V (2006) Associations between the hospitalist model of care and quality-of-care-related outcomes in patients undergoing hip fracture surgery. Mayo Clinic Proceedings 81 (1):28-31 87. Saeb M, Beyranvand M, Basiri Z, Haghparast-Bidgoli H (2014) The hospital resource utilization associated with osteoporotic hip fractures in Kermanshah, Iran. Journal of injury & violence research 6 (1):16-20 88. Sahota O, Morgan N, Moran CG (2012) The direct cost of acute hip fracture care in care home residents in the UK. Osteoporosis International 23 (3):917-920. doi:10.1007/s00198-011-1651-9

21
89. Schurch MA, Rizzoli R, Mermillod B, Vasey H, Michel JP, Bonjour JP (1996) A prospective study on socioeconomic aspects of fracture of the proximal femur. Journal of Bone and Mineral Research 11 (12):1935-1942 90. Shabat S, Heller E, Mann G, Gepstein R, Fredman B, Nyska M (2003) Economic consequences of operative delay for hip fractures in a non-profit institution. Orthopedics 26 (12):1197-1199 91. Shi NW, Foley K, Lenhart G, Badamgarav E (2009) Direct healthcare costs of hip, vertebral, and non-hip, non-vertebral fractures. Bone 45 (6):1084-1090. doi:10.1016/j.bone.2009.07.086 92. Shields E, Kates SL (2014) Revision rates and cumulative financial burden in patients treated with hemiarthroplasty compared to cannulated screws after femoral neck fractures. Arch Orthop Trauma Surg 134 (12):1667-1671. doi:http://dx.doi.org/10.1007/s00402-014-2096-3 93. Sloan FA, Taylor DH, Picone G (1999) Costs and outcomes of hip fracture and stroke, 1984 to 1994. Am J Public Health 89 (6):935-937. doi:10.2105/ajph.89.6.935 94. Song X, Shi NW, Badamgarav E, Kallich J, Varker H, Lenhart G, Curtis JR (2011) Cost burden of second fracture in the US Health System. Bone 48 (4):828-836. doi:10.1016/j.bone.2010.12.021 95. Strom O, Borgstrom F, Zethraeus N, Johnell O, Lidgren L, Ponzer S, Svensson O, Abdon P, Ornstein E, Ceder L, Thorngren KG, Sernbo I, Jonsson B (2008) Long-term cost and effect on quality of life of osteoporosis-related fractures in Sweden. Acta Orthopaedica 79 (2):269-280. doi:10.1080/17453670710015094 96. Stromberg L, Ohlen G, Svensson O (1997) Prospective payment systems and hip fracture treatment costs. Acta Orthopaedica Scandinavica 68 (1):6-12 97. Sund R, Juntunen M, Luthje P, Huusko T, Hakkinen U (2011) Monitoring the performance of hip fracture treatment in Finland. Ann Med 43:S39-S46. doi:10.3109/07853890.2011.586360 98. Tamulaitiene M, Alekna V (2012) Incidence and direct hospitalisation costs of hip fractures in Vilnius, capital of Lithuania, in 2010. BMC Public Health 12. doi:10.1186/1471-2458-12-495 99. Taylor Jr DH, Whellan DJ, Sloan FA (1999) Effects of admission to a teaching hospital on the cost and quality of care for medicare beneficiaries. New England Journal of Medicine 340 (4):293-299. doi:http://dx.doi.org/10.1056/NEJM199901283400408 100. Thakar C, Alsousou J, Hamilton TW, Willett K (2010) The cost and consequences of proximal femoral fractures which require further surgery following initial fixation. J Bone Joint Surg-Br Vol 92B (12):1669-1677. doi:10.1302/0301-620x.92b12.25021 101. Thakore RV, Lee YM, Sathiyakumar V, Obremskey WT, Sethi MK (2014) Geriatric Hip Fractures and Inpatient Services: Predicting Hospital Charges Using the ASA Score. Curr Gerontol Geriatr Res 2014:923717. doi:http://dx.doi.org/10.1155/2014/923717 102. Tow BPB, Chua BSY, Fook-Chong S, Sen Howe T (2009) Concurrent fractures of the hip and wrist: A matched analysis of elderly patients. Injury-International Journal of the Care of the Injured 40 (4):385-387. doi:10.1016/j.injury.2008.09.013 103. van Balen R, Steyerberg EW, Cools HJM, Polder JJ, Habbema JDF (2002) Early discharge of hip fracture patients from hospital: transfer of costs from hospital to nursing home. Acta Orthopaedica Scandinavica 73 (5):491-495 104. Viswanathan HN, Curtis JR, Yu J, White J, Stolshek BS, Merinar C, Balasubramanian A, Kallich JD, Adams JL, Wade SW (2012) Direct healthcare costs of osteoporosis-related fractures in managed care patients receiving pharmacological osteoporosis therapy. Appl Health Econ Health Policy 10 (3):163-173. doi:http://dx.doi.org/10.2165/11598590-000000000-00000 105. Waaler Bjornelv GM, Frihagen F, Madsen JE, Nordsletten L, Aas E (2012) Hemiarthroplasty compared to internal fixation with percutaneous cannulated screws as treatment of displaced femoral neck fractures in the elderly: cost-utility analysis performed alongside a randomized, controlled trial. Osteoporosis International 23 (6):1711-1719. doi:http://dx.doi.org/10.1007/s00198-011-1772-1 106. Wiktorowicz ME, Goeree R, Papaioannou A, Adachi JD, Papadimitropoulos E (2001) Economic implications of hip fracture: Health service use, institutional care and cost in Canada. Osteoporosis International 12 (4):271-278. doi:10.1007/s001980170116

22
107. Wong MK, Arjandas, Ching LK, Lim SL, Lo NN (2002) Osteoporotic hip fractures in Singapore--costs and patient's outcome. Ann Acad Med Singapore 31 (1):3-7 108. Woolcott JC, Khan KM, Mitrovic S, Anis AH, Marra CA (2012) The cost of fall related presentations to the ED: A prospective, in-person, patient-tracking analysis of health resource utilization. Osteoporosis International 23 (5):1513-1519. doi:10.1007/s00198-011-1764-1 109. Woratanarat P, Wajanavisit W, Lertbusayanukul C, Loahacharoensombat W, Ongphiphatanakul B (2005) Cost analysis of osteoporotic hip fractures. J Med Assoc Thai 88 Suppl 5:S96-104 110. Wyers CE, Reijven PLM, Evers SMAA, Willems PC, Heyligers IC, Verburg AD, van Helden S, Dagnelie PC (2013) Cost-effectiveness of nutritional intervention in elderly subjects after hip fracture. A randomized controlled trial. Osteoporosis International 24 (1):151-162. doi:http://dx.doi.org/10.1007/s00198-012-2009-7 111. Zethraeus N, Stromberg L, Jonsson B, Svensson O, Ohlen G (1997) The cost of a hip fracture. Estimates for 1,709 patients in Sweden. Acta Orthopaedica Scandinavica 68 (1):13-17 112. Zhao Y, Chen S-Y, Lee Y-C, Wu N (2013) Clinical and economic characteristics of hip fracture patients with and without muscle atrophy/weakness in the United States. Arch Osteoporos 8 (1-2):127. doi:http://dx.doi.org/10.1007/s11657-013-0127-2 113. Zielinski SM, Bouwmans CA, Heetveld MJ, Bhandari M, Patka P, Van Lieshout EM (2014) The societal costs of femoral neck fracture patients treated with internal fixation. Osteoporosis International 25 (3):875-885. doi:http://dx.doi.org/10.1007/s00198-013-2487-2

23
Appendix 5 – Supplementary Tables and Figures
Table A5.1 – Number of included studies (left hand axis, bars) and mean quality of studies (right hand axis, circles with 95% confidence intervals) by year (n=113)
Table A5.2 - Follow-up period of included studies (n=113)
Time horizon Number of studies
Index hospitalisation or “superspell” 48
3 months 2
4 months 3
6 months 9
12 months 38
14 months 1
18 months 1
24 months 8
36 months 2
60 months 1
0%
10%
20%
30%
40%
50%
60%
70%
80%
90%
100%
0
2
4
6
8
10
12
Me
an S
tud
y Q
ual
ity
Nu
mb
er
of
Stu
die
s
Year of Publication
Number of studies Mean study quality

24
Table A5.3 – Distribution of included studies by country and region (n=113)
Country Number of
Studies % a Region Regional total
United States of America 42 37.2% North America
50
Canada 8 7.1%
Great Britain 12 10.6% Western Europe
40
Sweden 7 6.2%
Netherlands 6 5.3%
Ireland 4 3.5%
Belgium 2 1.8%
Finland 2 1.8%
France 2 1.8%
Norway 2 1.8%
Germany 1 0.9%
Greece 1 0.9%
5 European countries (UK, France, Belgium, Italy, Spain)
1 0.9%
Singapore 4 3.5% Asia 11
China 3 2.7%
Japan 3 2.7%
Thailand 1 0.9%
Australia 3 2.7% Australasia 4
New Zealand 1 0.9%
Brazil 1 0.9% Latin America
3
Chile 1 0.9%
Mexico 1 0.9%
Iran 1 0.9% Middle East 3
Israel 1 0.9%
Saudi Arabia 1 0.9%
Lithuania 2 1.8% Eastern Europe
2
a – Values do not sum to 100% due to rounding

25
Figure A5.4 - Categories of care used for assigning costs.
Table A5.5 - Number of reported costs and costs with standard errors for index hospitalisation, index rehabilitation and index “Superspell”.
Category of care Observations Observations
with SD Pooled mean cost ($, 2014)
SE
Index Hospitalisation a 126 64 10,075 894
Index rehabilitation b 32 4 7,496 4,688
Index “Superspell” c 29 5 11,767 571
a – index hospitalisation relates to the initial inpatient episode immediately following hip fracture b – index rehabilitation related to rehabilitation care provided immediately following hip fracture (either in an acute hospital or in a rehabilitation ward) c – Index Superspell is a summary cost combining the cost of index hospitalisation and index rehabilitation.
Total costs
MedicalInpatient
• index hospitalisation
• other inpatient
Rehabilitation
• Index rehab
• other rehabOutpatient Primary care
Medications / Pharmacy
Social care
Social care in the home
Social care -residential /
nursing home
Medical equipment / Home modificationProductivity loss and
informal care
Out of pocket expenses
Income foregone by patient
Income foregone by relative / carer
Other
26
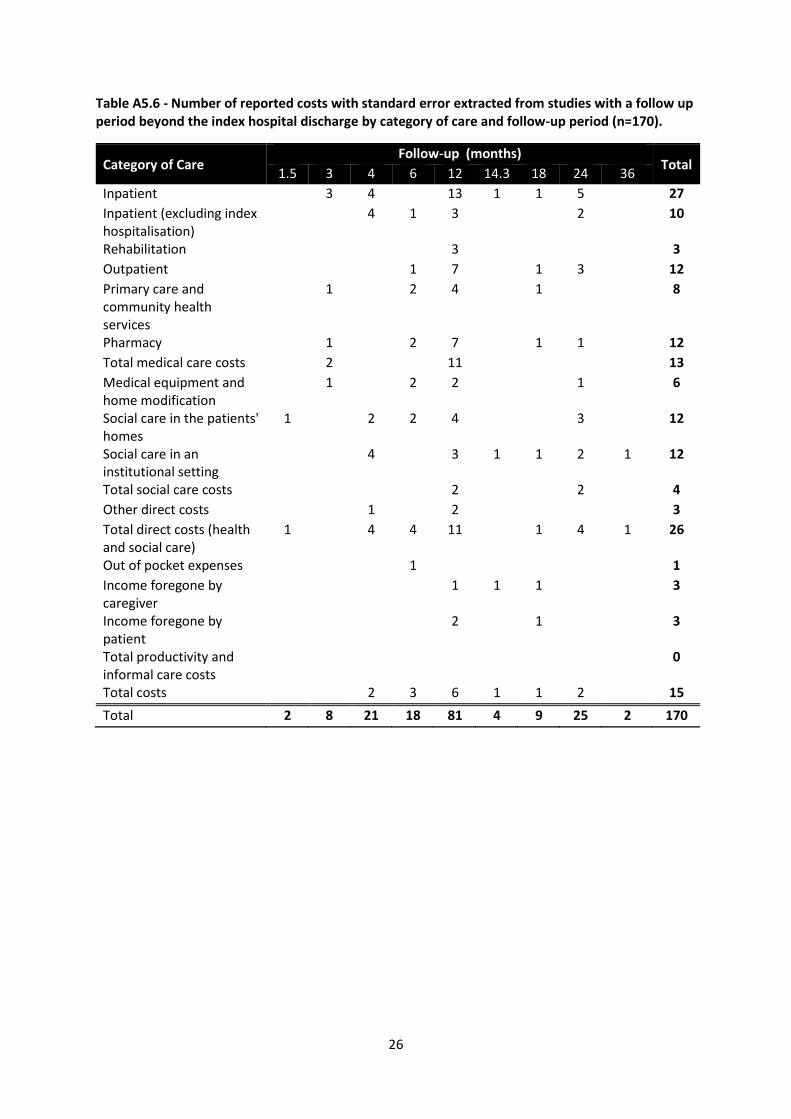
Table A5.6 - Number of reported costs with standard error extracted from studies with a follow up period beyond the index hospital discharge by category of care and follow-up period (n=170).
Category of Care Follow-up (months)
Total 1.5 3 4 6 12 14.3 18 24 36
Inpatient 3 4 13 1 1 5 27
Inpatient (excluding index hospitalisation)
4 1 3 2 10
Rehabilitation 3 3
Outpatient 1 7 1 3 12
Primary care and community health services
1 2 4 1 8
Pharmacy 1 2 7 1 1 12
Total medical care costs 2 11 13
Medical equipment and home modification
1 2 2 1 6
Social care in the patients' homes
1 2 2 4 3 12
Social care in an institutional setting
4 3 1 1 2 1 12
Total social care costs 2 2 4
Other direct costs 1 2 3
Total direct costs (health and social care)
1 4 4 11 1 4 1 26
Out of pocket expenses 1 1
Income foregone by caregiver
1 1 1 3
Income foregone by patient
2 1 3
Total productivity and informal care costs
0
Total costs 2 3 6 1 1 2 15
Total 2 8 21 18 81 4 9 25 2 170

27
Figure A5.7 - Scatter plot of cost of index hospitalisation against mean length of stay comparing
North American studies (black circles) to studies from other regions (grey circles). Solid horizontal
line = pooled mean cost of index hospitalisation ($10,075). Size of circle represents the weighting
of each observation. (n =64)
0
20
00
040
00
060
00
080
00
0
Inde
x h
osp
italis
ation
cost (U
S$, 2
01
4)
0 20 40 60 80Length of stay (days)

28
Table A5.8 - Univariate and multivariate analysis of index hospitalisation costs.
Univariate Multivariate (n=59)
Variable Marginal cost ($, 2014)
p-value Marginal cost ($, 2014)
p-value
Country and Healthcare system factors
GDP per capita -0.048 0.671 - -
Healthcare expenditure per capita -0.027 0.967 - -
% of healthcare expenditure, public -56.52 0.502 - -
Region North America (n=38)
Baseline - -
Western Europe (n=16)
-3,575 0.049 - -
Asia (n=4) -429 0.836 - -
Australasia (n=2) -910 0.556 - -
Latin America (n=2) -10,428 <0.001 - -
Middle East (n=2) 35,068 <0.001 - -
US vs. non-US studies US studies (n=35) Baseline Baseline
Non-US studies (n=29)
-4,248 0.157 10,701 0.001
Study design factors
Year of study a -389 <0.001 -292 <0.001
RCT vs. observational studies
Observational studies (N=59)
Baseline - -
RCT (n=5) 2,002 0.038 - -
Control vs. Intervention groups (n = 16) b
Control groups (n=8)
Baseline - -
Intervention group (n=8)
-1,738 <0.001 - -
Hip fracture with complications vs. hip fractures without complications (n=21) c
No complications (n=8)
Baseline - -
With complications (n=13)
1,352 <0.001 - -
Costs vs. Charges, US studies only (n=35)
Costs (n=23) Baseline - -
Charges (n=12) 6,779 0.099 - -
Demographic factors
Older age -103 0.031 - -
Gender Male Baseline Baseline
Female -332 <0.001 -134 0.001
Length of stay (n = 59) 205 <0.001 3,437 <0.001
Length of stay x non-US - - -3,304 <0.001
Intercept - - 2,481
Random effect (SD) - - 1,162
Intracluster correlation coefficient (ICC) - - 0.939
n=64 unless otherwise specified
a – centred to 1990
b – not including the cost of implementing the intervention
c – six studies reported index hospitalisation costs for both patients with no complications and
patients with complications. All costs for patients developing complications were included, as

29
defined by each study. Costs related to a range of different complication, from mild (e.g. electrolyte
abnormalities) through to severe (e.g. ischaemic events, deep wound infections and death)