cost-effectiveness of viral load monitoring in resource ... · cost-effectiveness of viral load...
TRANSCRIPT
Cost-effectiveness of viral load monitoring in resource-limited
settings Linda-Gail Bekker- a NON-economist!
Desmond Tutu HIV Centre IDM and Medicine
University of Cape Town South Africa
Interest 2014.

Who HASN’T used this slide???
Who HASN’T used this slide???
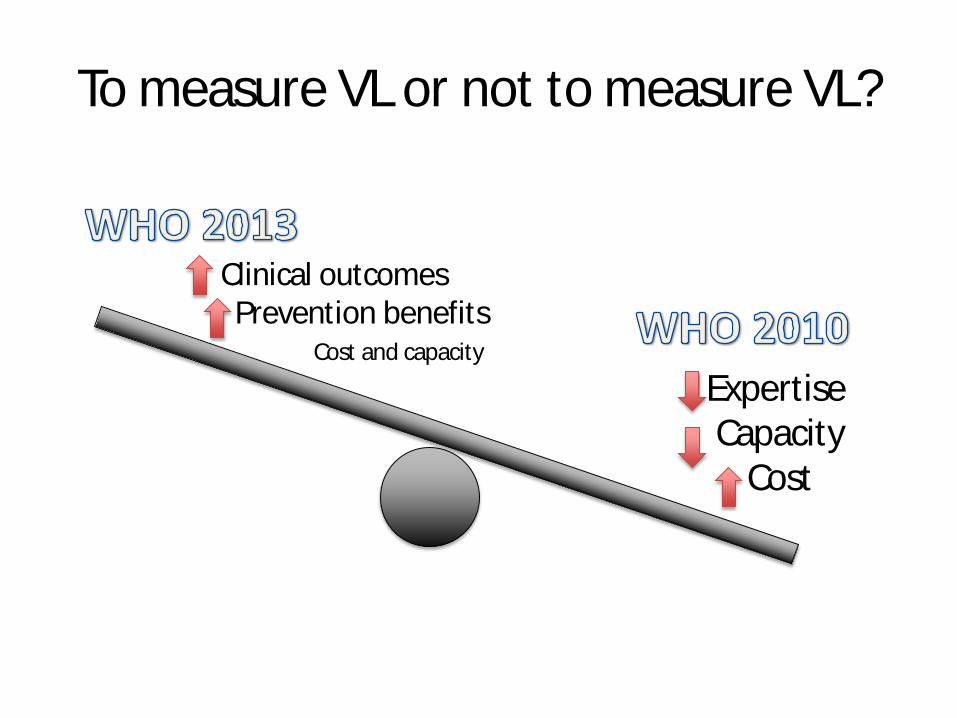
To measure VL or not to measure VL?
Expertise Capacity
Cost
Clinical outcomes Prevention benefits
Cost and capacity

STATUS QUO IN DEVELOPING COUNTRIES
Ø No monitoring – DOTS and clinical parameters
Ø Limited monitoring – clinical, CD4s and Hb
Ø Extended monitoring – viral loads, CD4’s and toxicity monitoring
• All secondary level Plus
• Full chemistry • Viral load • Infant antigen testing • Other TB diagnostics
• All primary level Plus
• Second serological method for HIV diagnos • FBC and differential • ALT • CD4 cell count • TB cultures
• Rapid HIV ab testing • Hb (if using ZDV) • Pregnancy • Referral for sputum TB (if no microscope) • Infant HIV ab testing
Regional referral centres (level 3)
District hospitals (level 2)
Primary health care (level 1)
Tiered laboratory capability
PATIENTS
TESTS

WHO 2013
• Revisions to consolidated guidelines on ART recommend viral load as the preferred monitoring approach (as opposed to clinical or immunological monitoring)
Viral load is recommended as the preferred monitoring approach to diagnose and confirm ARV treatment failure. (strong recommendation, low-quality evidence) . If viral load is not routinely available, CD4 count and clinical monitoring should be used to diagnose treatment failure (strong recommendation, moderate-quality evidence) .

Threshold for failure
• Since several clinical and epidemiological studies show that the risk of HIV transmission is very low when the viral load is lower than 1000 copies/ml, the Guidelines Development Group also recommended reducing the viral load threshold for treatment failure from 5000 copies/ml to 1000 copies/ml.

Rationale
• The main rationale for recommending viral load monitoring as the preferred approach compared with immunological and clinical monitoring is to provide an early and more accurate indication of treatment failure and the need to switch to second-line drugs, reducing the accumulation of drug-resistance mutations and improving clinical outcomes. Measuring viral load can also help to discriminate between treatment failure and non-adherence and can serve as a proxy for the risk of transmission at the population level.

What about Costs?
DIRECT COSTS/SAVINGS • Laboratory set up
– Infrastructure – Laboratory staff and training
• Cost of test
– Courier costs – Lab reagents – Lab staff time
INDIRECT COSTS/SAVINGS • Resources used elsewhere
– to treat more people – Access better drugs – Access 3rd line
• Longer durability on first line – Second/third line costs
• Less resistance mutations – Clin/CD4 poor sensitivity – More drug options for long term
• Switching to 2nd line needlessly – Clin/CD4 poor specificity
• Prevention benefits
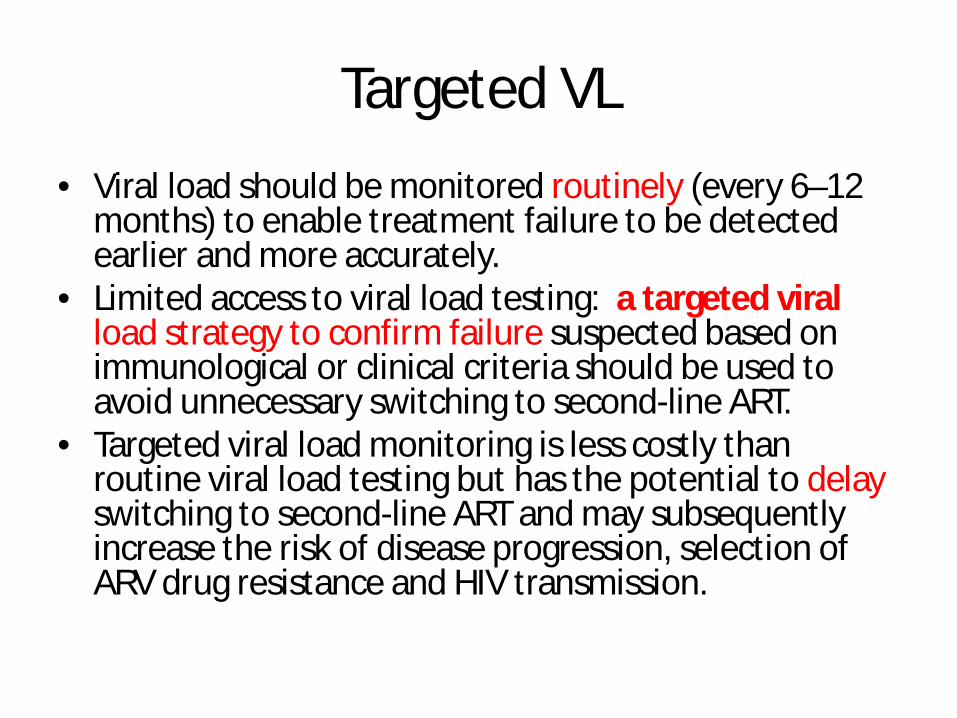
Targeted VL • Viral load should be monitored routinely (every 6–12
months) to enable treatment failure to be detected earlier and more accurately.
• Limited access to viral load testing: a targeted viral load strategy to confirm failure suspected based on immunological or clinical criteria should be used to avoid unnecessary switching to second-line ART.
• Targeted viral load monitoring is less costly than routine viral load testing but has the potential to delay switching to second-line ART and may subsequently increase the risk of disease progression, selection of ARV drug resistance and HIV transmission.

Children
• As more children start ART earlier and at higher CD4 counts, viral load monitoring to detect treatment failure and lack of adherence will be increasingly beneficial.
• In addition, viral load may be instrumental for implementing treatment strategies to preserve second-line options as children age (such as switching from LPV/r to an NNRTI once virological suppression is sustained)
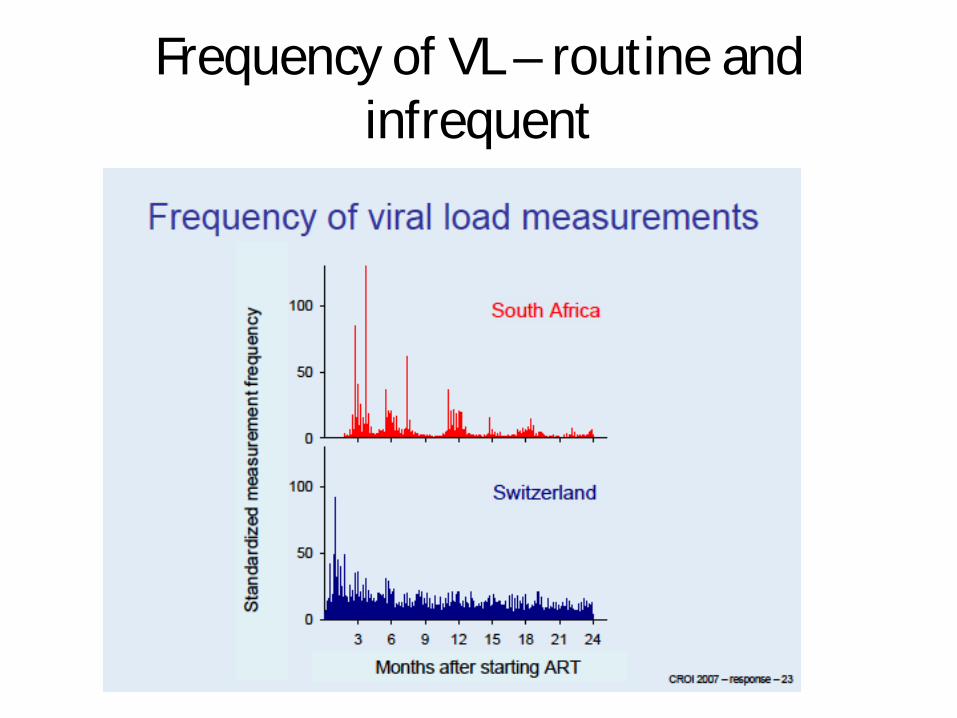
Frequency of VL – routine and infrequent


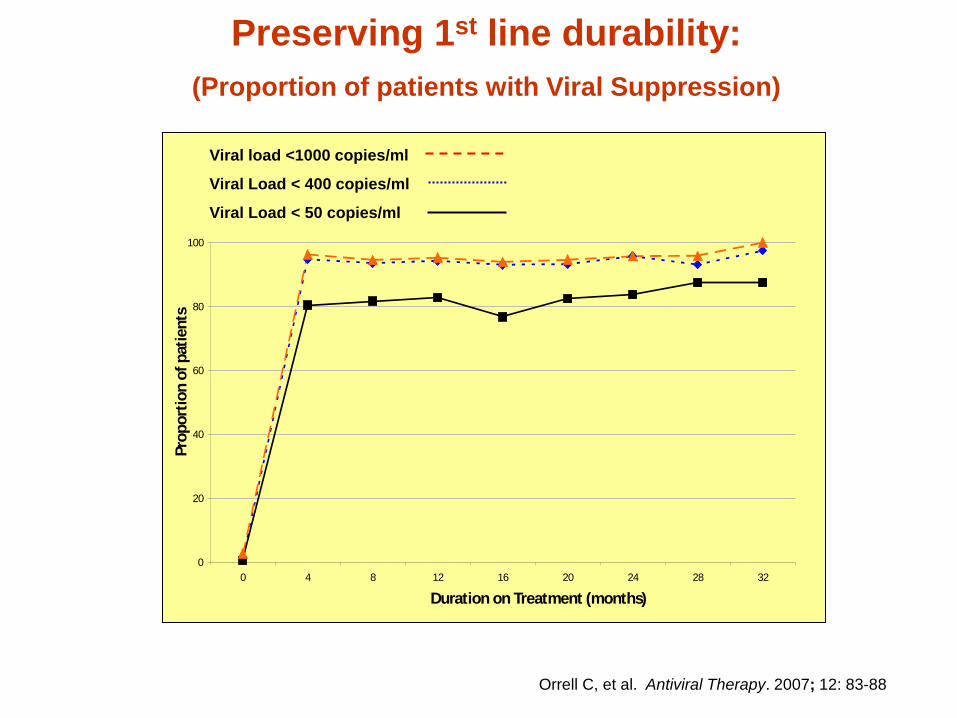
Preserving 1st line durability: (Proportion of patients with Viral Suppression)
0
20
40
60
80
100
0 4 8 12 16 20 24 28 32
Duration on Treatment (months)
Prop
ortio
n of
pat
ient
s
Viral load <1000 copies/ml
Viral Load < 400 copies/ml
Viral Load < 50 copies/ml
Orrell C, et al. Antiviral Therapy. 2007; 12: 83-88
Pro
porti
on o
f pat
ient
s on
pro
gram
0 20
40
60
80
10
0
0 4 8 12 16 20 24 28 32
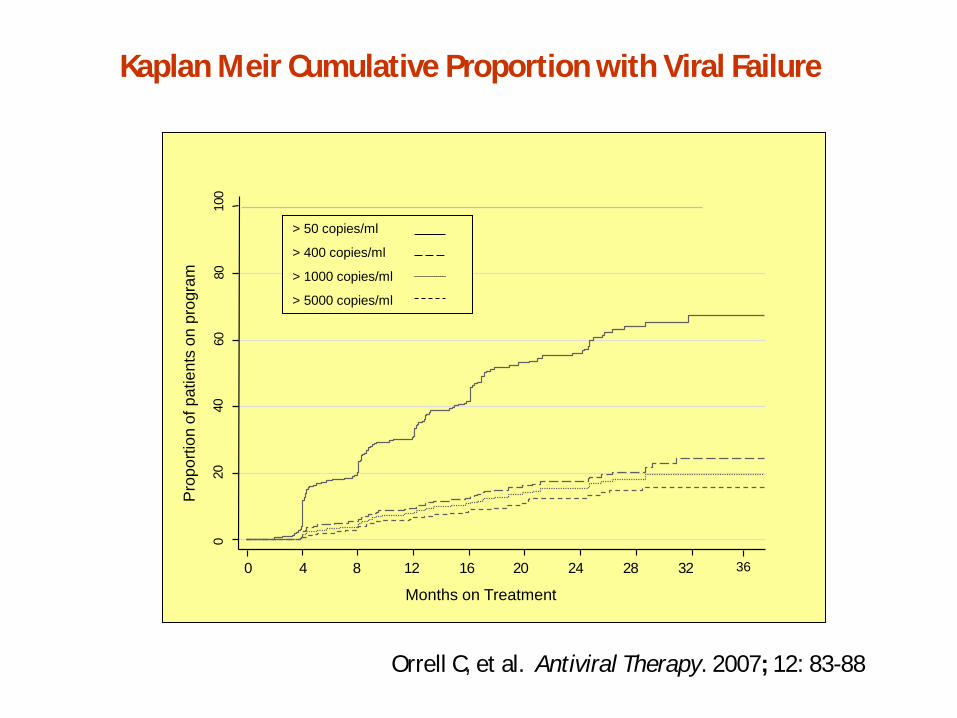
> 50 copies/ml
> 400 copies/ml
> 1000 copies/ml
> 5000 copies/ml
Kaplan Meir Cumulative Proportion with Viral Failure
Orrell C, et al. Antiviral Therapy. 2007; 12: 83-88
Months on Treatment
36

929 641 421 328 229 162 127 86 51
0.00
0.
05
0.10
0.
15
0.20
0.
25
0 4 8 12 16 20 24 28 32 36
Duration on Treatment (months)
First HIV RNA >1000cpm
First and second consecutive HIV RNA >1000cpml
65%
Kaplan Meier Cumulative Proportion with Initial and Repeat VL >1000 cpm
Intensification of adherence support
Orrell C, et al.
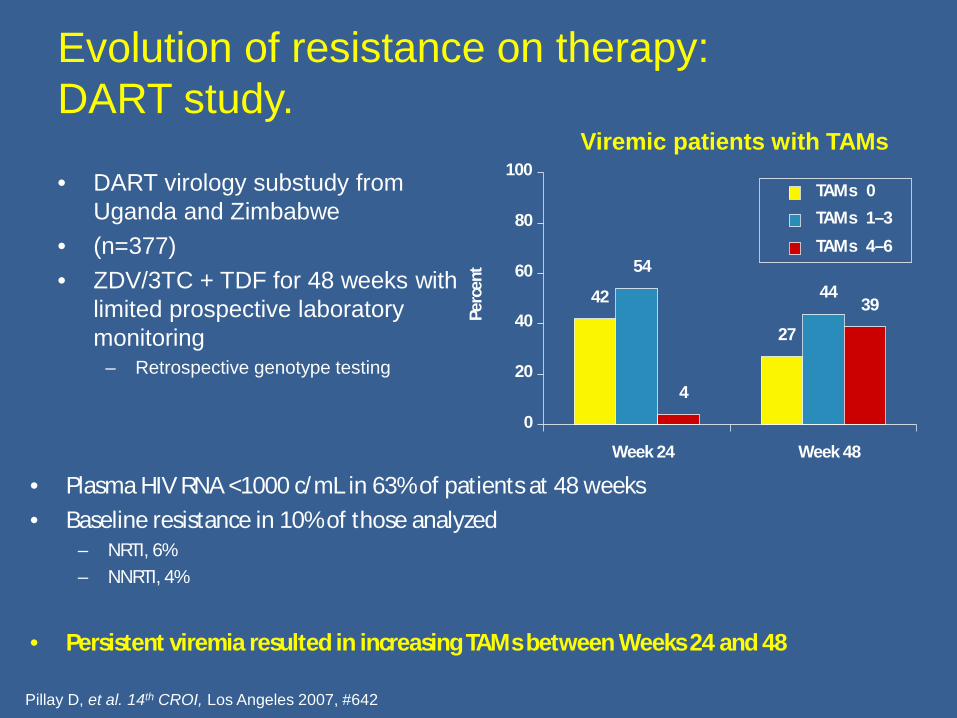
Evolution of resistance on therapy: DART study.
• DART virology substudy from Uganda and Zimbabwe
• (n=377) • ZDV/3TC + TDF for 48 weeks with
limited prospective laboratory monitoring
– Retrospective genotype testing
Pillay D, et al. 14th CROI, Los Angeles 2007, #642
Viremic patients with TAMs
• Plasma HIV RNA <1000 c/mL in 63% of patients at 48 weeks • Baseline resistance in 10% of those analyzed
– NRTI, 6% – NNRTI, 4%
• Persistent viremia resulted in increasing TAMs between Weeks 24 and 48
42
27
54 44
4
39
0
20
40
60
80
100
Week 24 Week 48 Pe
rcen
t
TAMs 0
TAMs 1–3
TAMs 4–6
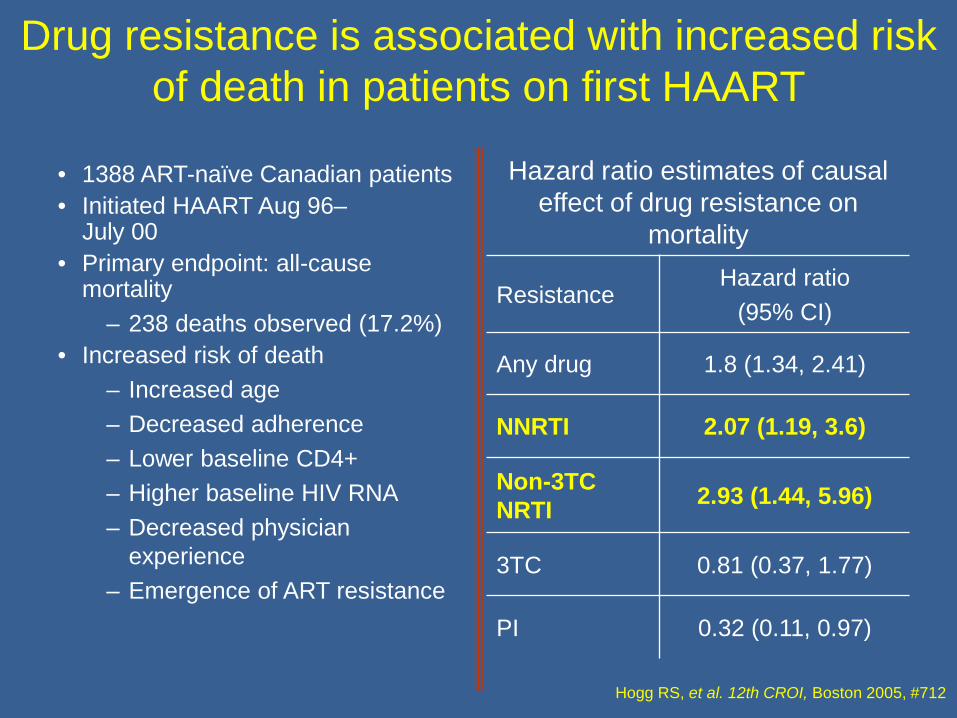
Drug resistance is associated with increased risk of death in patients on first HAART
• 1388 ART-naïve Canadian patients • Initiated HAART Aug 96–
July 00 • Primary endpoint: all-cause
mortality – 238 deaths observed (17.2%)
• Increased risk of death – Increased age – Decreased adherence – Lower baseline CD4+ – Higher baseline HIV RNA – Decreased physician
experience – Emergence of ART resistance
Hazard ratio estimates of causal effect of drug resistance on
mortality
Resistance Hazard ratio
(95% CI)
Any drug 1.8 (1.34, 2.41)
NNRTI 2.07 (1.19, 3.6)
Non-3TC NRTI 2.93 (1.44, 5.96)
3TC 0.81 (0.37, 1.77)
PI 0.32 (0.11, 0.97)
Hogg RS, et al. 12th CROI, Boston 2005, #712
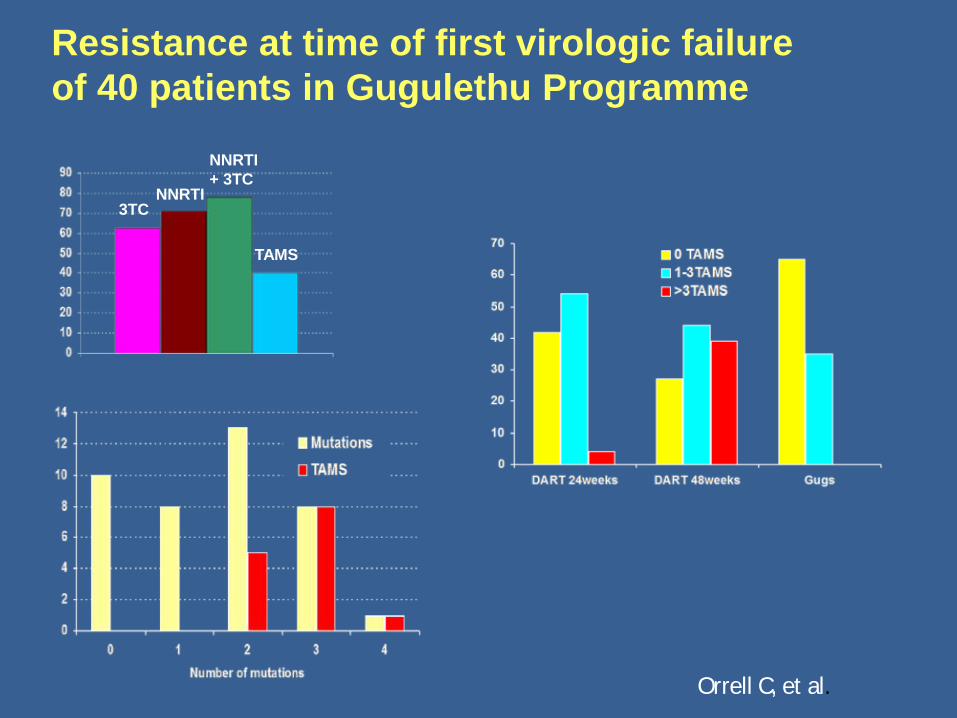
3TC NNRTI
NNRTI + 3TC
TAMS
Resistance at time of first virologic failure of 40 patients in Gugulethu Programme
Orrell C, et al.
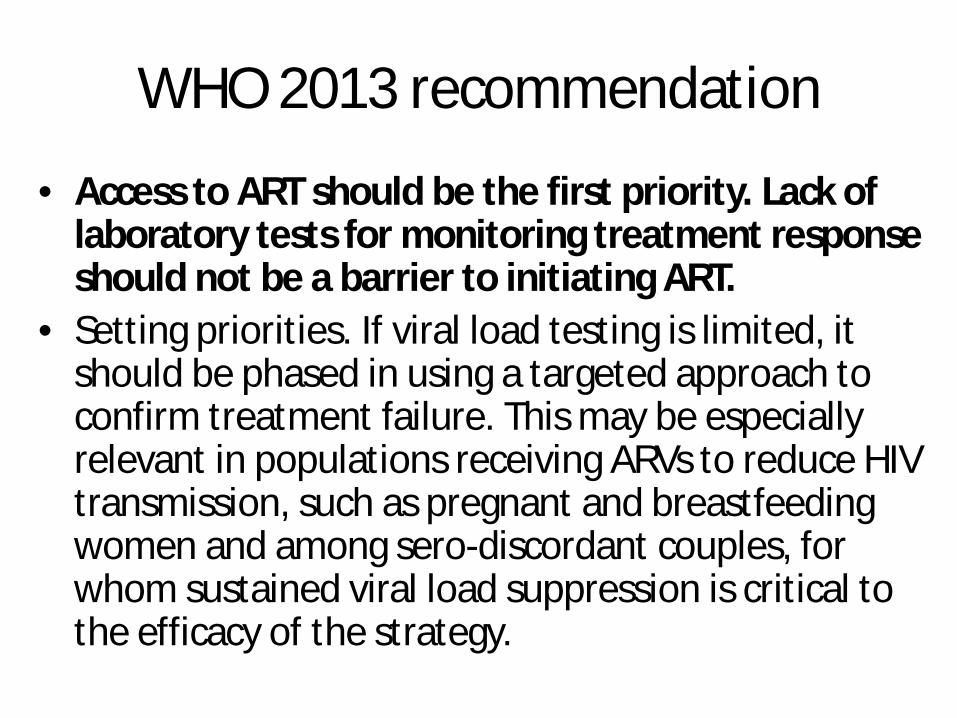
WHO 2013 recommendation
• Access to ART should be the first priority. Lack of laboratory tests for monitoring treatment response should not be a barrier to initiating ART.
• Setting priorities. If viral load testing is limited, it should be phased in using a targeted approach to confirm treatment failure. This may be especially relevant in populations receiving ARVs to reduce HIV transmission, such as pregnant and breastfeeding women and among sero-discordant couples, for whom sustained viral load suppression is critical to the efficacy of the strategy.
Cost effectiveness of different strategies to monitor adults on
antiretroviral treatment: a combined analysis of three
mathematical models. Keebler D, et al. Lancet Glob Health
2014:2:e35-43
Methods
• Modeling studies between 2007-2012. • Assessed effect of patient monitoring
strategies on health outcomes in a simulated population over time
• Cost effectiveness analysis.
Detail: • Range of monitoring strategies: clinical, CD4 cell count,
and viral load monitoring, alone and together, at different frequencies and with different criteria for switching to second-line therapies.
• Used 3 independently constructed and validated models simultaneously.
• Estimated costs on the basis of resource use projected in the models and associated unit costs;
• Quantified impact as disability-adjusted life years (DALYs) averted.
• Compared alternatives using incremental cost effectiveness (ICER) analysis.

Models
• HIV synthesis model- Philips and colleagues : Univ College , London
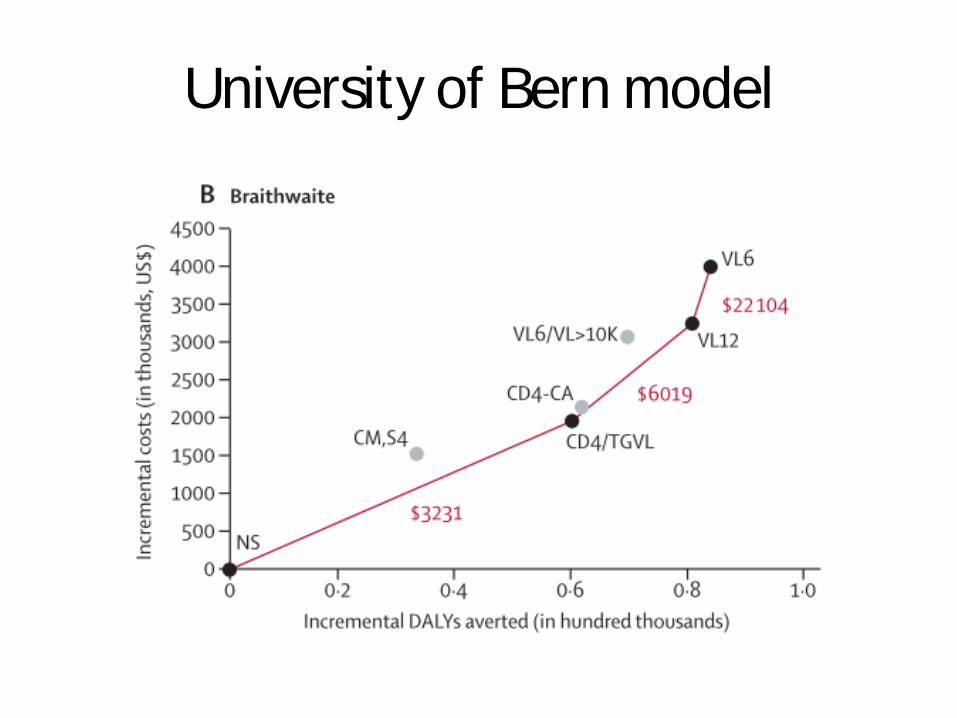
• Estill and Colleagues- University of Bern, Bern • Braithwaite and Colleagues-New York University,
NYC.
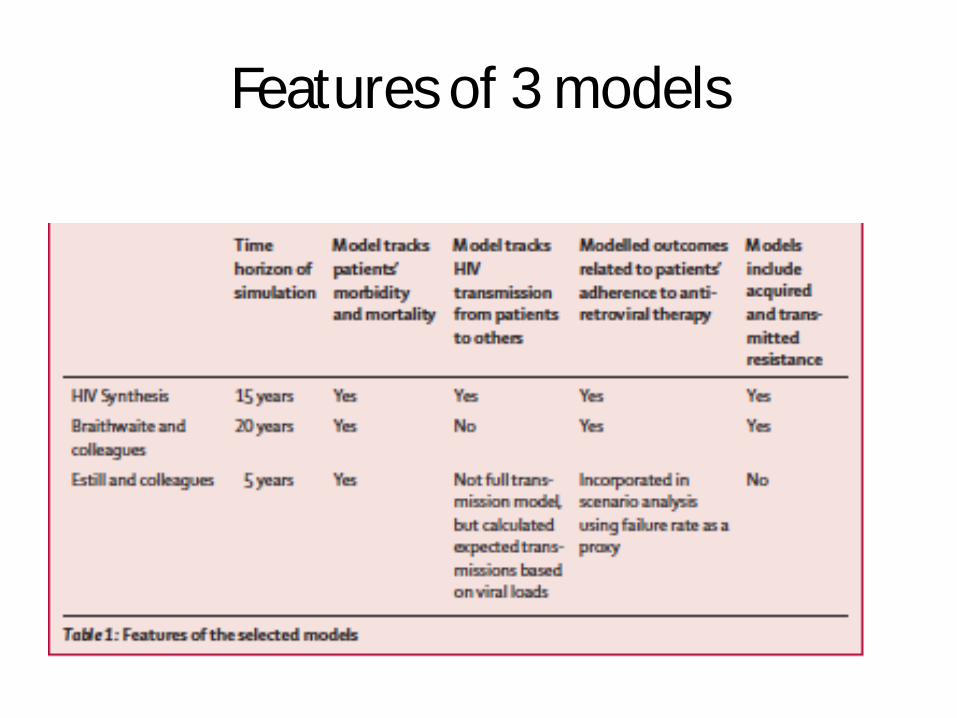
Features of 3 models
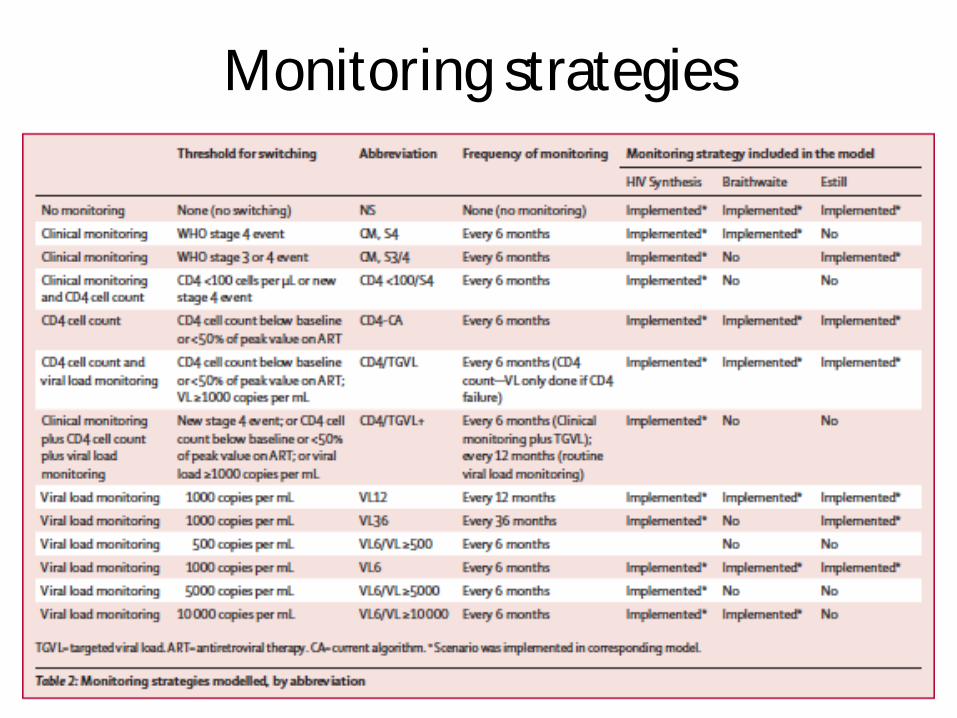
Monitoring strategies

Estill
University of Bern model
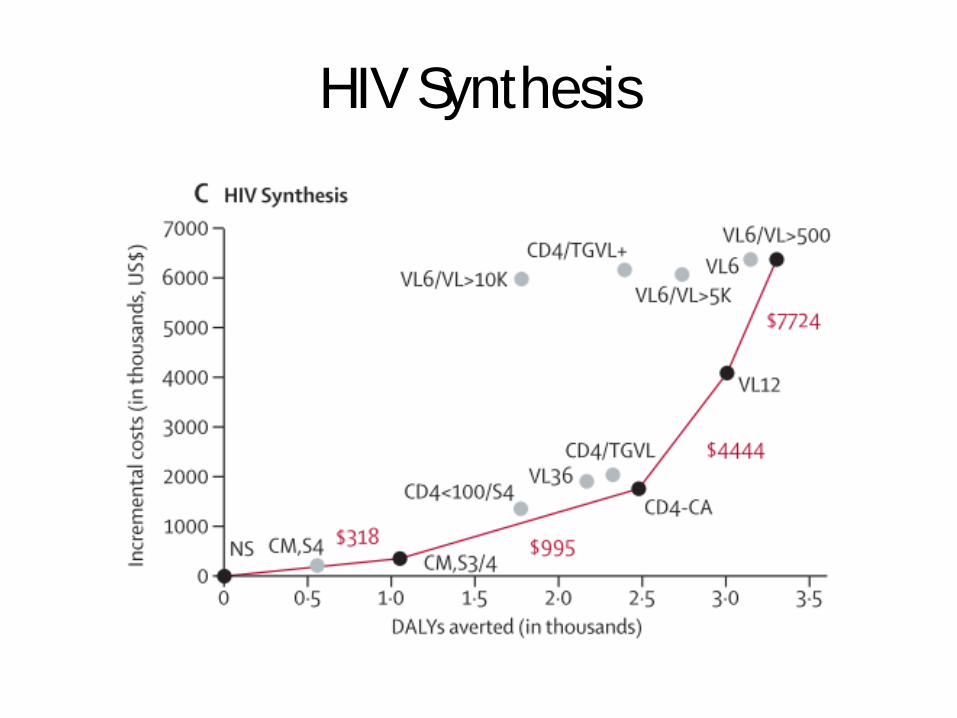
HIV Synthesis

Outcomes: • Clinical monitoring delivers benefit compared with a
hypothetical baseline scenario with no monitoring or switching.
• Regular CD4 cell count monitoring confers a benefit over clinical monitoring alone, at an incremental cost that makes it affordable in more settings ( VL currently more expensive).
• Viral load monitoring without CD4 cell count every 6–12 months provides the greatest reductions in morbidity and mortality, but incurs a high cost per DALY averted. – Weighed against health gains if implemented instead of
increasing antiretroviral therapy coverage or expanding antiretroviral therapy eligibility.
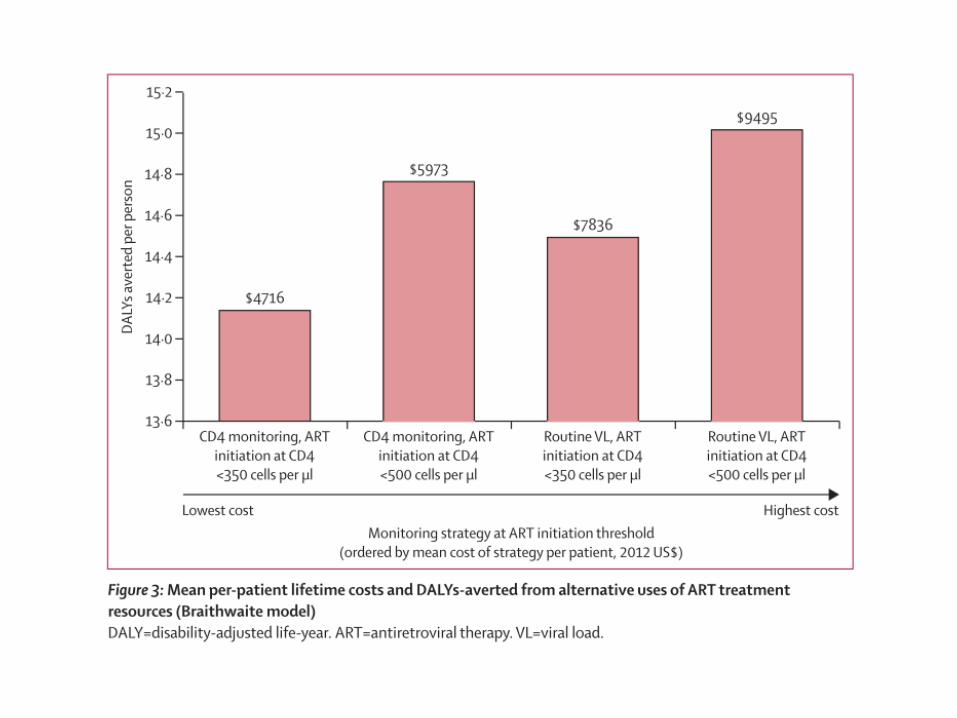
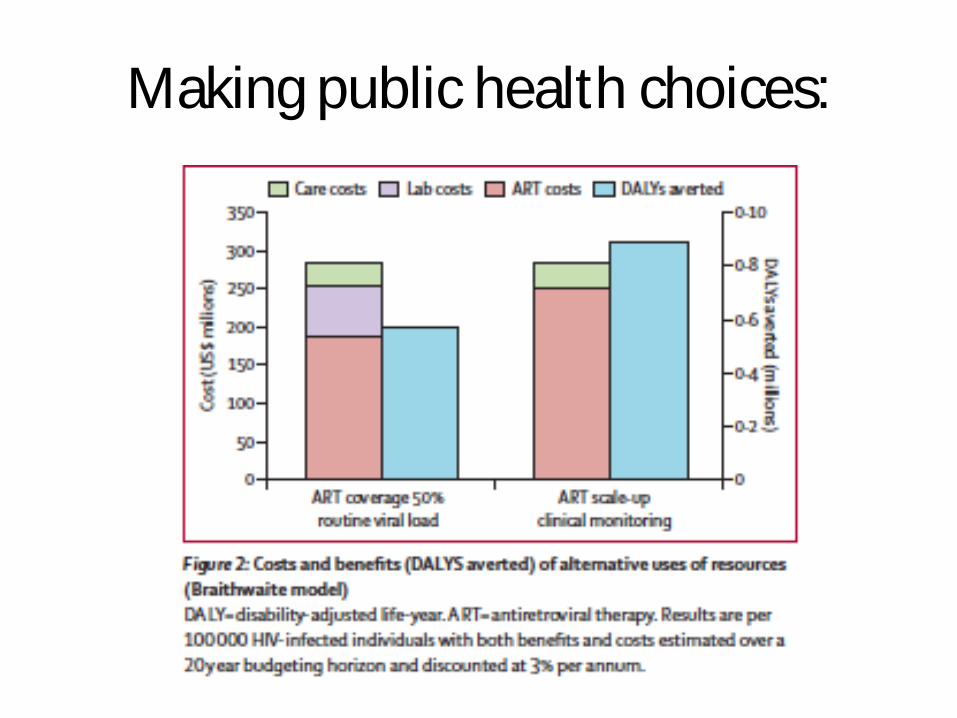
Making public health choices:

Model Conclusions
• Priority for HIV programmes – expand ART coverage, firstly at CD4 < 350, and
then at a CD4 < 500, using lower-cost clinical or CD4 monitoring.
• Then, consider VL monitoring. – Lower test costs and/or newly developed POC
technologies could increase the cost-effectiveness.
Overall conclusions
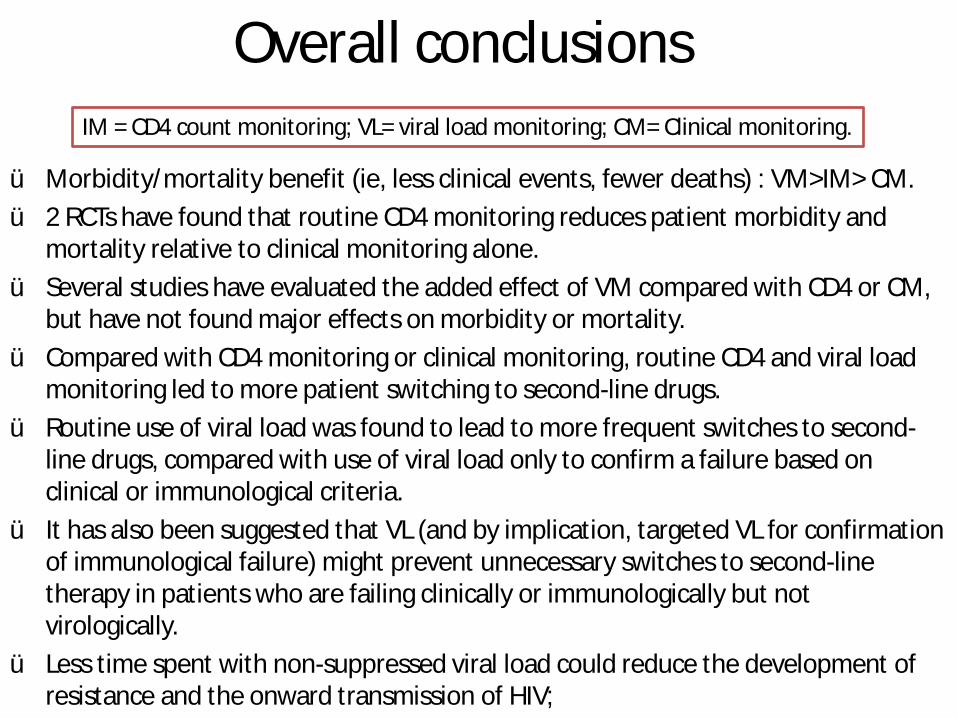
ü Morbidity/mortality benefit (ie, less clinical events, fewer deaths) : VM>IM> CM. ü 2 RCTs have found that routine CD4 monitoring reduces patient morbidity and
mortality relative to clinical monitoring alone. ü Several studies have evaluated the added effect of VM compared with CD4 or CM,
but have not found major effects on morbidity or mortality. ü Compared with CD4 monitoring or clinical monitoring, routine CD4 and viral load
monitoring led to more patient switching to second-line drugs. ü Routine use of viral load was found to lead to more frequent switches to second-
line drugs, compared with use of viral load only to confirm a failure based on clinical or immunological criteria.
ü It has also been suggested that VL (and by implication, targeted VL for confirmation of immunological failure) might prevent unnecessary switches to second-line therapy in patients who are failing clinically or immunologically but not virologically.
ü Less time spent with non-suppressed viral load could reduce the development of resistance and the onward transmission of HIV;
IM = CD4 count monitoring; VL= viral load monitoring; CM= Clinical monitoring.
Cost-effectiveness of laboratory monitoring for management of HIV treatment in
sub-Saharan Africa: a model-based analysis.
Hamers R, et al. for the ART-A Consortium.
AIDS 2012, 26:1663–1672
THE OTHER SIDE OF THE COIN:

Model A Markov Model to compare the cost-effectiveness of three different strategies for long-term monitoring of antiretroviral therapy (ART) failure and regimen switching in sub-Saharan Africa: a symptom-based approach, or monitoring of either CD4 cell counts or plasma viral load (pVL) at 6 and 12 months. • Hypothetical HIV-infected adult population who began
first-line ART and subsequently had up to 6 years of follow-up.
• Main outcome measures: Total cost, life expectancy and incremental cost-effectiveness ratio (ICER).

Markov model
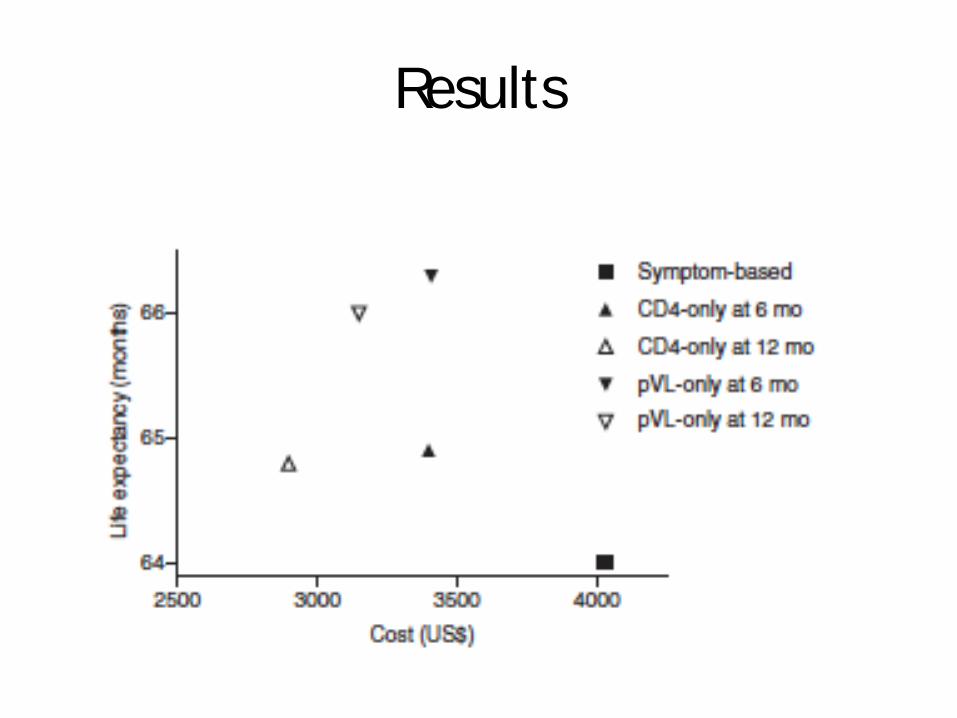
Results

Results • CM yielded a life expectancy of 64.0 months at a
total cost of US$ 4028 per person. • All laboratory-based strategies (6 or 12 mo), were
cost-saving and improved life expectancy, compared with a symptom based approach.
• The life-expectancy gain was larger for VL than for CD4 strategies at 6-monthly (2.3 and 0.9 months, respectively) and 12-monthly testing (2.0 and 0.8 months, respectively).
• Cost-savings of 6-monthly VL or CD4 testing were similar (US$ 630 and 621, respectively), whereas 12-monthly CD4 cell counts were more cost saving than 12-monthly VL (US$ 1132 and 880, respectively).
ICERs
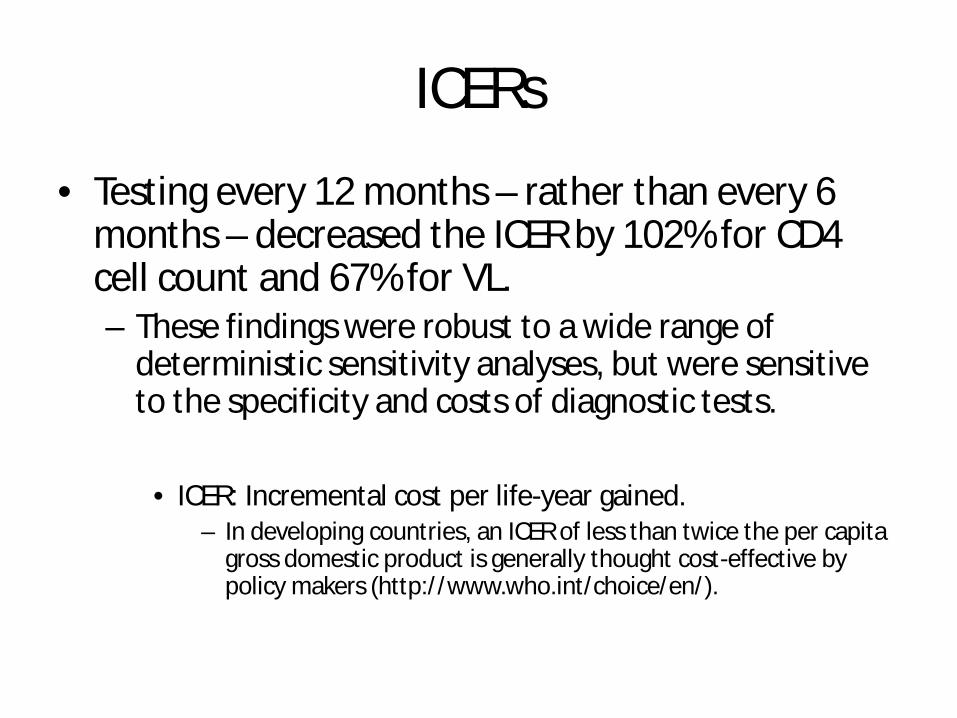
• Testing every 12 months – rather than every 6 months – decreased the ICER by 102% for CD4 cell count and 67% for VL. – These findings were robust to a wide range of
deterministic sensitivity analyses, but were sensitive to the specificity and costs of diagnostic tests.
• ICER: Incremental cost per life-year gained.
– In developing countries, an ICER of less than twice the per capita gross domestic product is generally thought cost-effective by policy makers (http://www.who.int/choice/en/).

Model Conclusions
• Additional diagnostic costs are balanced by cost-savings from avoiding unnecessary switching due to misdiagnosis of ART failure.
• Routine VL monitoring may be preferred as a replacement for CD4 cell counts because of its additional public health advantages in preventing drug-resistance, supporting adherence and reducing HIV transmission.
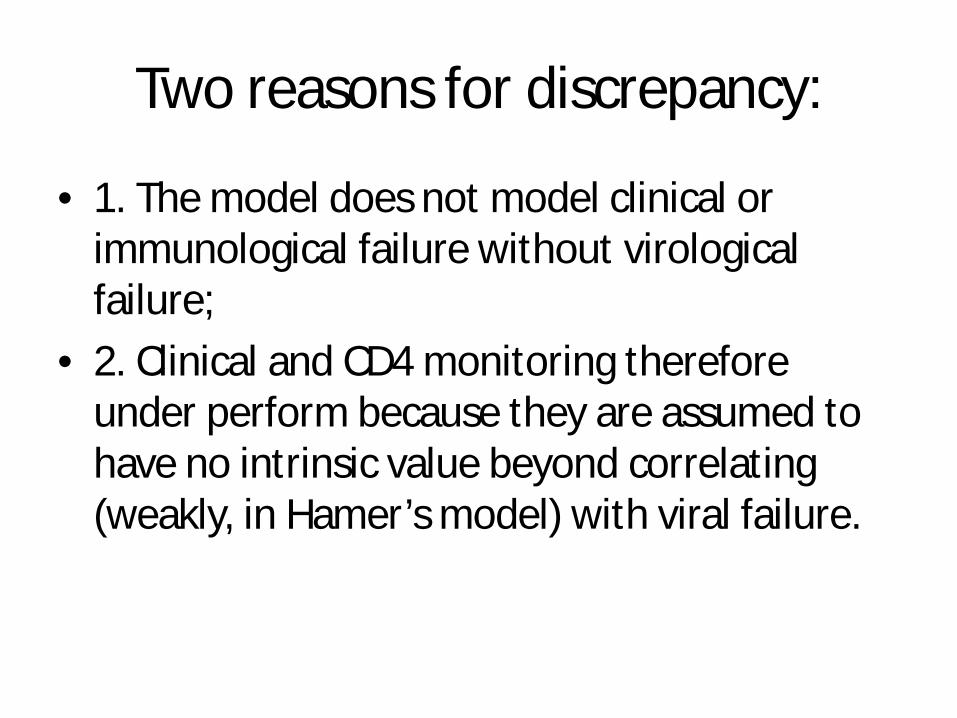
Two reasons for discrepancy:
• 1. The model does not model clinical or immunological failure without virological failure;
• 2. Clinical and CD4 monitoring therefore under perform because they are assumed to have no intrinsic value beyond correlating (weakly, in Hamer’s model) with viral failure.
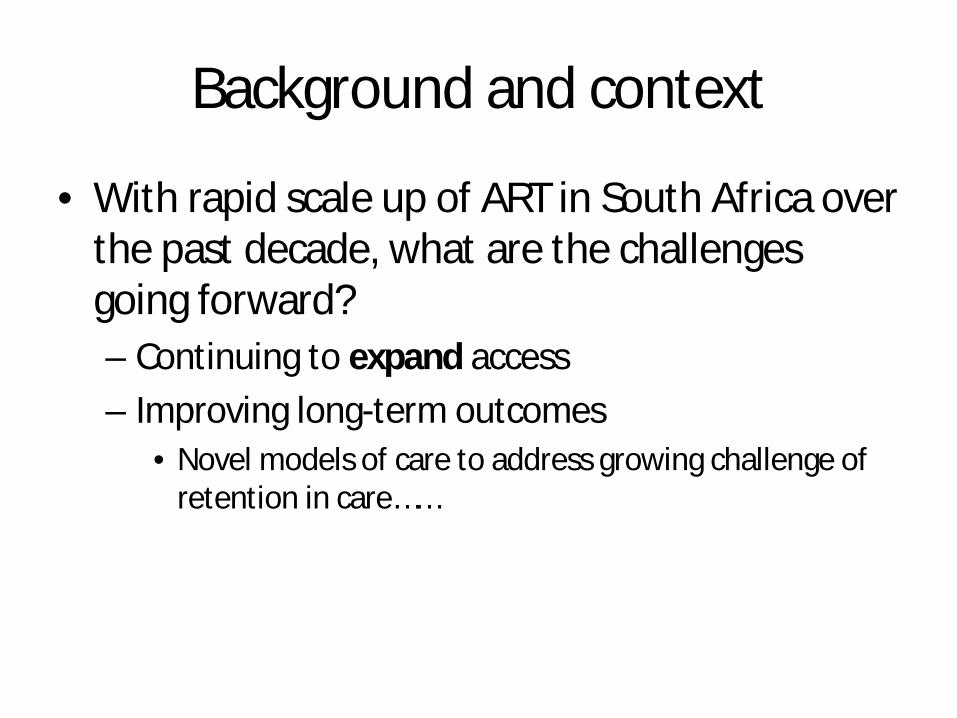
Background and context
• With rapid scale up of ART in South Africa over the past decade, what are the challenges going forward? – Continuing to expand access – Improving long-term outcomes
• Novel models of care to address growing challenge of retention in care……

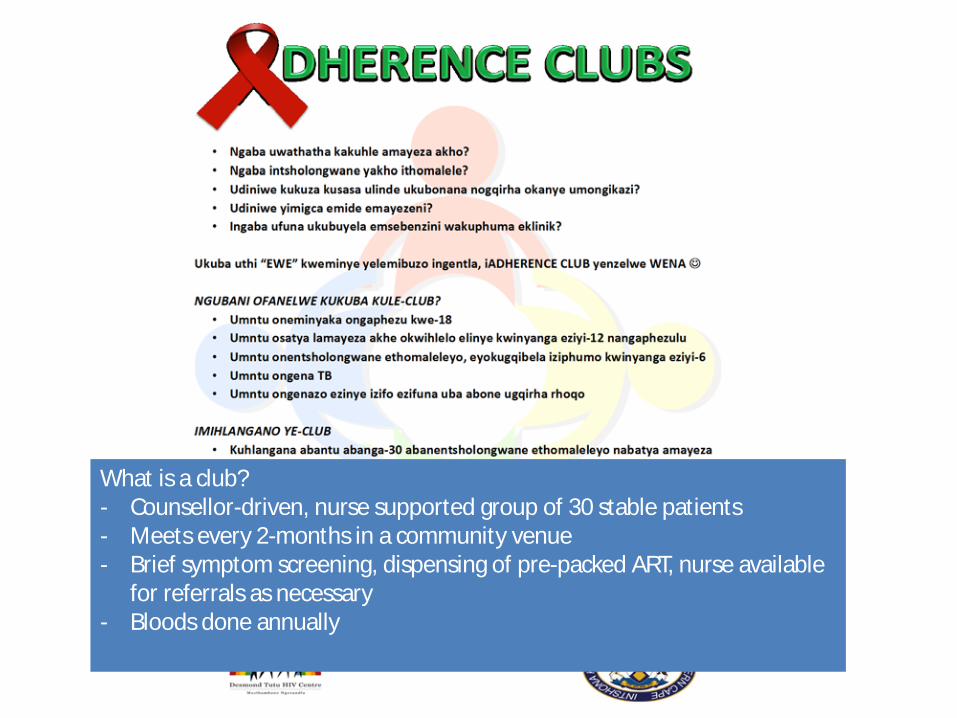
What is a club? - Counsellor-driven, nurse supported group of 30 stable patients - Meets every 2-months in a community venue - Brief symptom screening, dispensing of pre-packed ART, nurse available
for referrals as necessary - Bloods done annually

Club eligibility: - On ART for 12+ months - Last two consecutive viral loads suppressed - No other chronic conditions that require more frequent clinical care
What is a club? - Counsellor-driven, nurse supported group of 30 stable patients - Meets every 2-months in a community venue - Brief symptom screening, dispensing of pre-packed ART, nurse available
for referrals as necessary - Bloods done annually
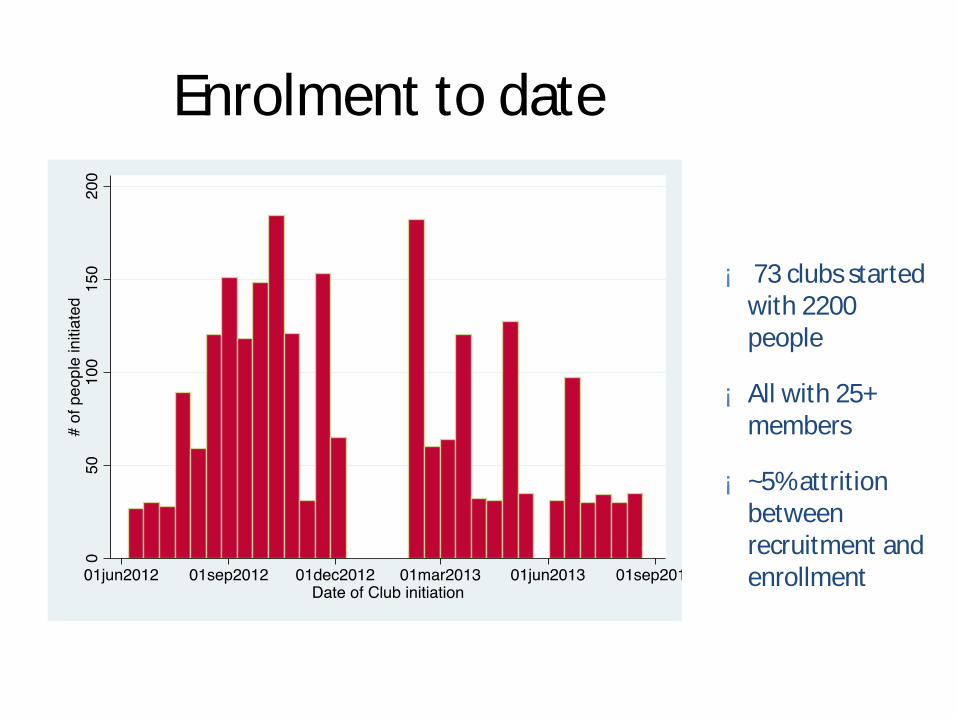
Enrolment to date
¡ 73 clubs started with 2200 people
¡ All with 25+ members
¡ ~5% attrition between recruitment and enrollment
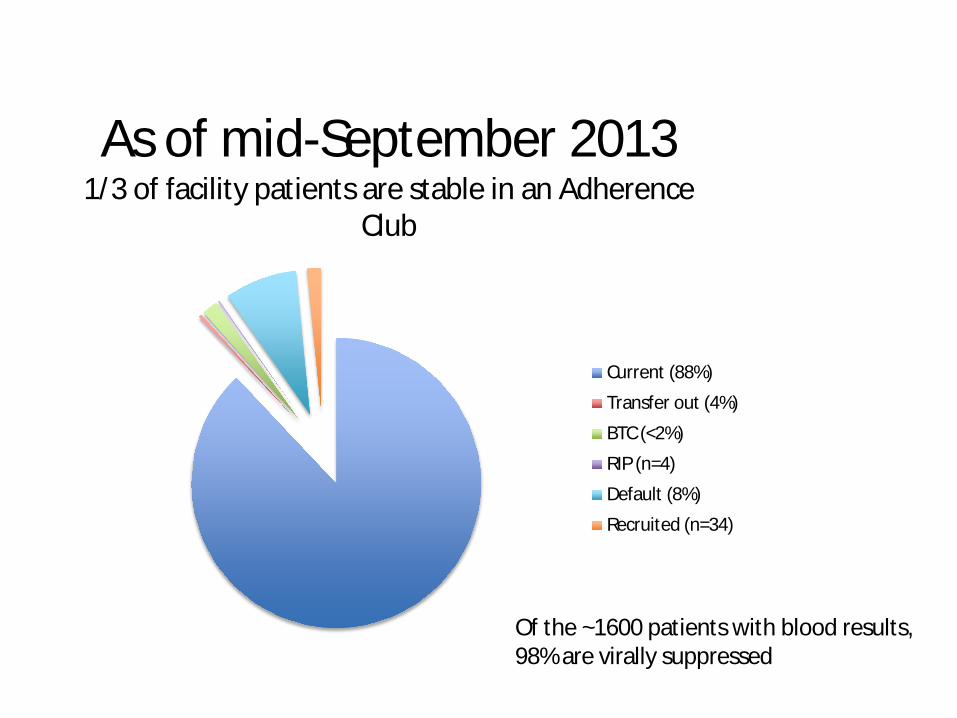
As of mid-September 2013 1/3 of facility patients are stable in an Adherence
Club
Current (88%)
Transfer out (4%)
BTC (<2%)
RIP (n=4)
Default (8%)
Recruited (n=34)
Of the ~1600 patients with blood results, 98% are virally suppressed
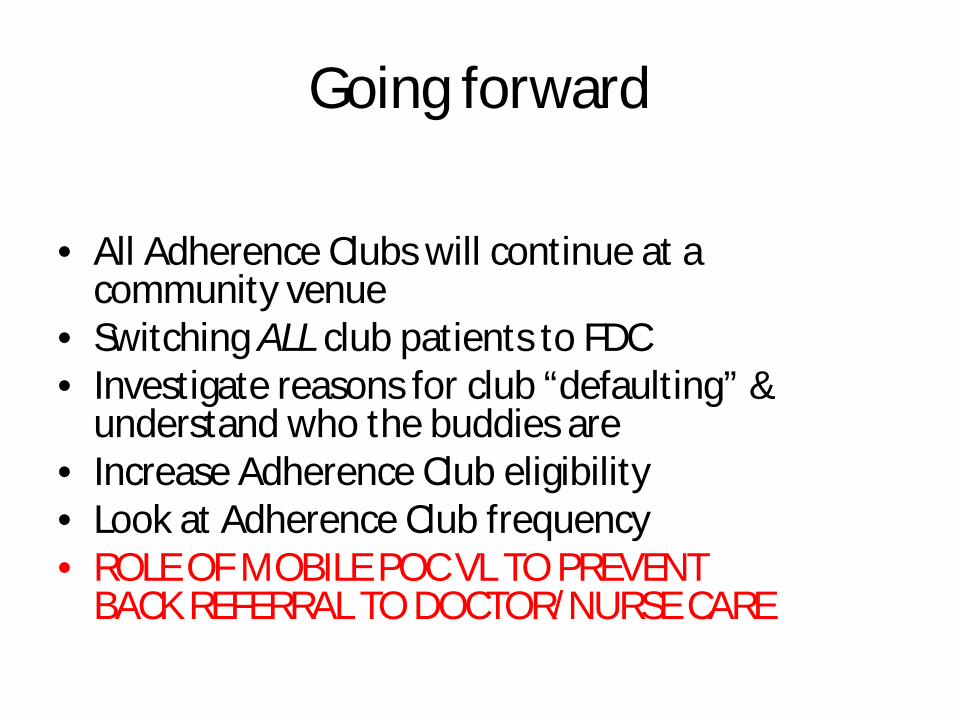
Going forward
• All Adherence Clubs will continue at a community venue
• Switching ALL club patients to FDC • Investigate reasons for club “defaulting” &
understand who the buddies are • Increase Adherence Club eligibility • Look at Adherence Club frequency • ROLE OF MOBILE POC VL TO PREVENT
BACK REFERRAL TO DOCTOR/NURSE CARE

Holiday ART supply
• In 2012/2013, some Clubs received 2 months of ART and some received 4 months of ART – Compare the outcomes of these two groups
• 4 months after the final club visit in 2012: – 4.0% had defaulted club care
• 4m: 41 of 1054 (3.9%), 2m: 33 of 806 (4.1%), p-value=0.823
– 3.6% were not virally suppressed • 4m: 31 of 842 (3.7%), 2m: 23 of 665 (3.5%), p-value =
0.817
Now, ALL clubs will receive 4-months over the holidays and clubs will therefore meet 5 times per year (2m, 2m, 2m, 2m 4m).
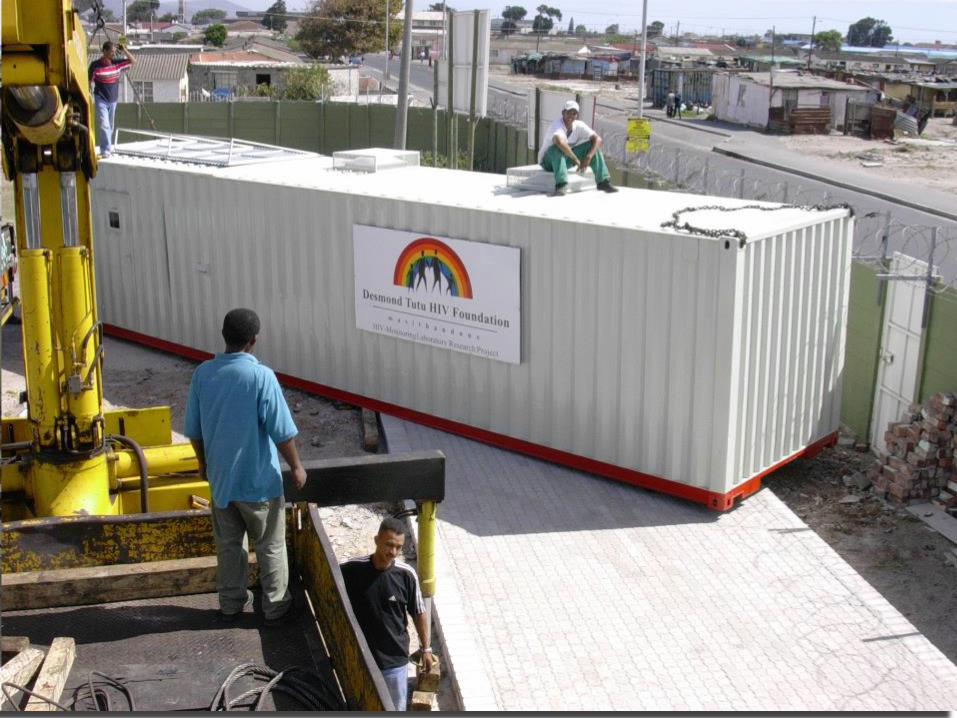
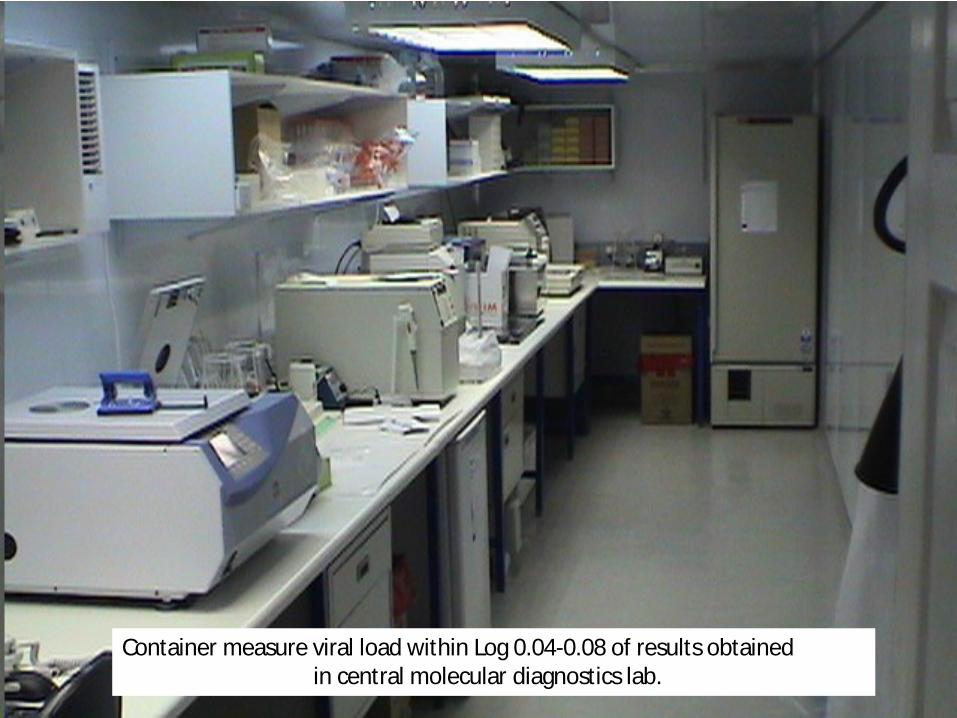
Container measure viral load within Log 0.04-0.08 of results obtained in central molecular diagnostics lab.

ART : A model for PHC delivery
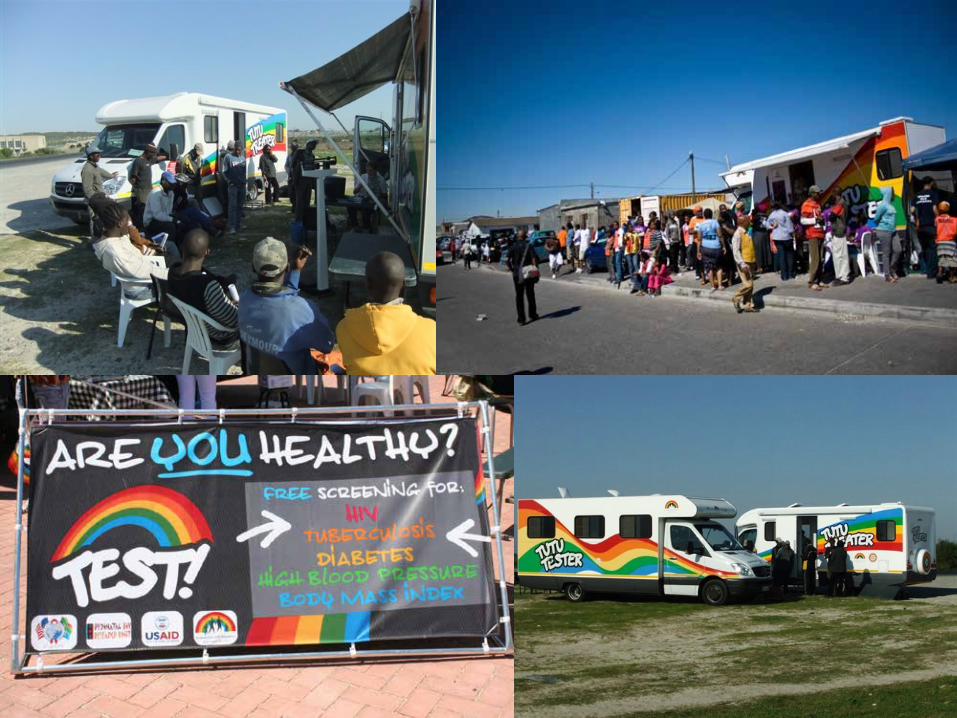
• Out of facilities • In the community • Led by trained peers • Task shifting • Task sharing • Job creation • Health on foot • Health on wheels • Health in homes!!!
WITH NO COMPROMISE IN QUALITY

Overall conclusions
• All the models agree that viral load monitoring is a good thing!
• There are gains on DALYS, ICERS, lifetime • Problem is COST per unit. • Both models agree frequency can be minimised. • Unit cost of test needs to come down. • Role of decentralized POC VL also still to be fully
explored. • CD4 could then be kept only for eligibility • Targeted VL with CD4/CM may be part of a
phased approach.

Monitoring for all!!
Thanks
• Modelers and their papers • Anna Grimsrud- adherence clubs • Hanan-CRUSAID clinic • Tutu Tester team • Toga and Togatainer