cortical inhibition in attention deficit hyperactivity disorder: new insights from the...
TRANSCRIPT
BRAINA JOURNAL OF NEUROLOGY
Cortical inhibition in attention deficithyperactivity disorder: new insights fromthe electroencephalographic response totranscranial magnetic stimulationSarah Bruckmann,1,2 Daniela Hauk,1,2 Veit Roessner,3 Franz Resch,1 Christine M. Freitag,4
Thomas Kammer,5 Ulf Ziemann,6 Aribert Rothenberger,7 Matthias Weisbrod2 andStephan Bender1,3,4
1 Department for Child and Adolescent Psychiatry, Centre for Psychosocial Medicine, University of Heidelberg, Blumenstr. 8, 69115 Heidelberg,
Germany
2 Section for Experimental Psychopathology, Centre for Psychosocial Medicine, University of Heidelberg, Voßstr. 4, 69115 Heidelberg, Germany
3 Child and Adolescent Psychiatric Hospital, University of Technology, Dresden, Fetscherstraße 74, 01307 Dresden, Germany
4 Department of Child and Adolescent Psychiatry, Psychosomatics and Psychotherapy, Goethe University Frankfurt/Main, Deutschordenstraße 50,
60528 Frankfurt/Main, Germany
5 Department of Psychiatry, University of Ulm, Leimgrubenweg 12, 89075 Ulm, Germany
6 Department of Neurology, Goethe University Frankfurt/Main, Schleusenweg 2-16, 60528 Frankfurt/Main, Germany
7 Department for Child and Adolescent Psychiatry an Psychotherapy, University of Gottingen, von-Siebold-Str. 5, 37075 Gottingen, Germany
Correspondence to: Stephan Bender,
Child and Adolescent Psychiatric Hospital,
Medical Faculty Carl Gustav Carus,
University of Technology,
Dresden, Fetscherstr. 74,
D-01307 Dresden, Germany
E-mail: [email protected]
Attention deficit hyperactivity disorder is one of the most frequent neuropsychiatric disorders in childhood. Transcranial mag-
netic stimulation studies based on muscle responses (motor-evoked potentials) suggested that reduced motor inhibition con-
tributes to hyperactivity, a core symptom of the disease. Here we employed the N100 component of the electroencephalographic
response to transcranial magnetic stimulation as a novel marker for a direct assessment of cortical inhibitory processes, which
has not been examined in attention deficit hyperactivity disorder so far. We further investigated to what extent affected children
were able to regulate motor cortical inhibition, and whether effects of age on the electroencephalographic response to tran-
scranial magnetic stimulation were compatible with either a delay in brain maturation or a qualitatively different development.
N100 amplitude evoked by transcranial magnetic stimulation and its age-dependent development were assessed in 20 children
with attention deficit hyperactivity disorder and 19 healthy control children (8–14 years) by 64-channel electroencephalography.
Amplitude and latency of the N100 component were compared at rest, during response preparation in a forewarned motor
reaction time task and during movement execution. The amplitude of the N100 component at rest was significantly lower and
its latency tended to be shorter in children with attention deficit hyperactivity disorder. Only in controls, N100 amplitude to
transcranial magnetic stimulation was reduced by response preparation. During movement execution, N100 amplitude decreased
while motor evoked potential amplitudes showed facilitation, indicating that the electroencephalographic response to transcra-
nial magnetic stimulation provides further information on cortical excitability independent of motor evoked potential amplitudes
doi:10.1093/brain/aws071 Brain 2012: 135; 2215–2230 | 2215
Received September 15, 2011. Revised December 22, 2011. Accepted January 26, 2012. Advance Access publication April 3, 2012
� The Author (2012). Published by Oxford University Press on behalf of the Guarantors of Brain. All rights reserved.
For Permissions, please email: [email protected]
at University of B
righton on July 15, 2014http://brain.oxfordjournals.org/
Dow
nloaded from
and spinal influences. Children with attention deficit hyperactivity disorder showed a smaller N100 amplitude reduction during
movement execution compared with control children. The N100 amplitude evoked by transcranial magnetic stimulation
decreased with increasing age in both groups. The N100 reduction in children with attention deficit hyperactivity disorder at
all ages suggests a qualitative difference rather than delayed development of cortical inhibition in this disease. Findings further
suggest that top-down control of motor cortical inhibition is reduced in children with attention deficit hyperactivity disorder. We
conclude that evoked potentials in response to transcranial magnetic stimulation are a promising new marker of cortical
inhibition in attention deficit hyperactivity disorder during childhood.
Keywords: ADHD; TMS-evoked EEG potential; contingent negative variation; motor cortex inhibition; development
Abbreviations: ADHD = attention deficit hyperactivity disorder; CNV = contingent negative variation; MEP = motor-evokedpotential; TMS = transcranial magnetic stimulation
IntroductionAttention deficit hyperactivity disorder (ADHD) is one of the most
frequently diagnosed neuropsychiatric disorders in childhood. A
core symptom is motor hyperactivity (Biederman, 2005; Spencer
et al., 2007). Previous studies using transcranial magnetic stimu-
lation (TMS) in combination with motor-evoked potentials (MEPs;
muscle contraction in response to TMS) have reported deficits in
specific inhibitory functions of the motor loop in ADHD (Moll
et al., 2000, 2001a, b; Gilbert et al., 2005; Gilbert, 2006;
Buchmann et al., 2007). Therefore, a disturbed balance between
motor facilitation and motor inhibition has been proposed to
underlie motor hyperactivity in children with ADHD (Moll et al.,
2000, 2001a, b; Buchmann et al., 2007). Still it remains unclear to
what extent these inhibitory deficits can be influenced by cognitive
control. Impaired cortical inhibitory function due to inefficient top-
down regulation of executive control systems may play an import-
ant role in the pathophysiology of ADHD (Sergeant, 2000).
The electroencephalographic response following TMS (Komssi
et al., 2004; Komssi and Kahkonen, 2006) after 100 ms
(TMS-evoked N100) is of special interest for the investigation of
cortical inhibitory deficits in ADHD. The highly reproducible
(Lioumis et al., 2009; Ilmoniemi and Kicic, 2010) TMS-evoked
N100 allows a non-invasive investigation of cortical excitability
and is thought to reflect cortical inhibition (Nikulin et al., 2003;
Bender et al., 2005a). In contrast to MEPs, which are potentially
affected by a combination of cortical, subcortical and spinal mech-
anisms (Kiers et al., 1993), the TMS-evoked N100 directly assesses
cortical responses to TMS without influences of spinal inhibitory
mechanisms (Nikulin et al., 2003; Bender et al., 2005a; Ilmoniemi
and Kicic, 2010). In healthy subjects, the TMS-evoked N100 com-
ponent decreases during motor cortex disinhibition related to
movement execution (Nikulin et al., 2003) and motor response
preparation (Bender et al., 2005a) and increases during response
inhibition (Bonnard et al., 2009). Therefore, the TMS-evoked
N100 is considered to be a marker of motor cortex inhibition
influenced by cortico–striato–thalamo–cortical loops (Bender
et al., 2005a). The exact molecular mechanisms underlying
TMS-evoked N100 are still unclear and have yet to be disen-
tangled by pharmacological studies.
Investigation of the TMS-evoked N100 in children with ADHD
at rest and during response preparation might provide evidence to
what extent top-down control contributes to reduced motor
cortex inhibition in ADHD. To the best of our knowledge, the
TMS-evoked N100 has not yet been investigated in ADHD.
Another important question is whether the deficiency of motor
cortex inhibition in ADHD reflects a true qualitative deficit or
just a developmental delay. MEP-based inhibition measures such
as short interval intracortical inhibition to paired pulses, which
have been examined in ADHD previously, show an increase
during development in childhood and early adolescence (Mall
et al., 2004; Walther et al., 2009). Thus, both a delayed devel-
opment as well as inhibitory deficits could explain reduced short
interval intracortical inhibition. The idea of a cortical developmen-
tal delay underlying ADHD symptoms (Kinsbourne, 1973; Denckla
and Rudel, 1978; Mostofsky et al., 2003) was supported by neu-
roimaging studies that demonstrated immature prefrontal brain
regions responsible for motor control in children with ADHD
(Rubia et al., 2000). Furthermore, there seems to be a general
delay in cortical maturation with differing regional maturational
trajectories, most prominent in prefrontal regions, in volumetric
MRI studies (Shaw et al., 2007).
Measurements of the TMS-evoked N100 will allow a distinction
between a general developmental delay and a persisting inhibitory
deficit because its amplitude and latency correlate negatively with
age (Bender et al., 2005a). Thus, a TMS-evoked N100 amplitude
reduction in ADHD would point towards a qualitatively reduced
inhibition while a TMS-evoked N100 amplitude increase would
point towards a developmental delay. The different effects of
age on both parameters in cross-sectional studies underline that
TMS-evoked N100 and paired pulse short interval intracortical in-
hibition reflect different forms of cortical inhibition.
We hypothesize an impaired cortical inhibitory function due to
an intrinsic inhibitory deficit in children with ADHD reflected by
smaller TMS-evoked N100 amplitudes compared with healthy chil-
dren. Moreover, the influence of selective attention and motor
preparation in a forewarned reaction time task (contingent nega-
tive variation; CNV) is investigated, presuming that an ineffective
executive control function in children with ADHD results in a
smaller effect of motor preparation on TMS-evoked N100 com-
pared with healthy controls. According to previous results (Nikulin
et al., 2003), we further hypothesize that during movement exe-
cution TMS-evoked N100 amplitudes should be even more
strongly reduced than during motor preparation in the
2216 | Brain 2012: 135; 2215–2230 S. Bruckmann et al.
at University of B
righton on July 15, 2014http://brain.oxfordjournals.org/
Dow
nloaded from

CNV task. A clear dissociation between a facilitation of MEP amp-
litudes and a TMS-evoked N100 reduction during movement exe-
cution is expected. Such dissociation between MEP- and
TMS-evoked N100 amplitudes would suggest that the analysis
of TMS-evoked EEG potentials provides additional information in-
dependent of the conventional measurement of MEP amplitudes.
Materials and methods
SubjectsA group of 20 right-handed (assessed by the Edinburgh Handedness
Inventory; Oldfield, 1971) children with ADHD and a gender- and
age-matched group of 19 right-handed healthy controls were exam-
ined. Due to different effects of TMS applied to the motor cortex of
the dominant and the non-dominant hemisphere (Semmler and
Nordstrom, 1998; De Gennaro et al., 2004), only right-handed chil-
dren were included. Control children were recruited from primary and
high schools in Heidelberg, whereas children with ADHD were re-
cruited on an outpatient basis. Detailed characteristics of the study
samples can be found in Table 1.
The diagnosis of combined-type ADHD was based on the research
criteria of the DSM-IV. Therefore, we applied the Kiddie-Schedule for
Affective Disorders and Schizophrenia (Ambrosini et al., 1989) and a
validated German ADHD-rating scale (Fremdbeurteilungsbogen
Hyperkinetisches Syndrom; Dopfner and Lehmkuhl, 2000; Erhart
et al., 2008) measuring DSM-IV-based ADHD symptoms. The
Kiddie-Schedule for Affective Disorders and Schizophrenia was also
used to exclude any other psychiatric disorders within both groups.
Each subject received a general clinical and neurological examination.
All children with ADHD included in the study suffered from the com-
bined type of ADHD according to DSM-IV criteria. The ADHD rating
scale scores are given in Table 1. Predominantly inattentive children
were not included, since the study focused on the motor system.
Children with ADHD did not fulfil the criteria of any other neurological
or psychiatric disorder such as dyslexia, dyscalculia, autism spectrum
disorder, tic disorder/Gilles de la Tourette syndrome or obsessive–com-
pulsive disorder (exclusion criteria). Four children with ADHD had a
comorbid oppositional defiant disorder.
A corrected visual acuity 50.8 and a normal intelligence level
(IQ4 80) were required for all participants (Table 1). IQ was evalu-
ated with a short form of the German version of the Wechsler intel-
ligence test for children (WISC/HAWIK III; Tewes and Wechsler, 2000)
including four subtests (Schallberger, 2005). Subjects with a positive
personal or family history of epilepsy or any kind of seizures in their
individual history were excluded. Furthermore, medication with any
kind of psychoactive drug except stimulant medication (methylphen-
idate) served as exclusion criterion. Fourteen subjects with ADHD
received medical treatment (four with immediate release methylphen-
idate, seven with long acting methylphenidate, three with a combin-
ation of extended and immediate release methylphenidate) whereas
six subjects were medication-naıve. The medication was stopped 60 h
prior to the recordings (Moll et al., 2001b). Whenever necessary, chil-
dren were examined on a Monday morning with medication being
withdrawn over the weekend.
All children showed a reliable resting motor threshold 4100% of
maximum stimulator output (Magstim 200; Magstim Ltd.). Similar to
previous studies, the TMS procedure was well tolerated by all partici-
pants (Garvey and Gilbert, 2004; Gilbert et al., 2004).
The study was approved by the local ethics committee and the
purpose and methods of the study were explained in an age-related
way to the children. Informed written consent was obtained by all
participants and their parents in accordance with the Declaration of
Helsinki.
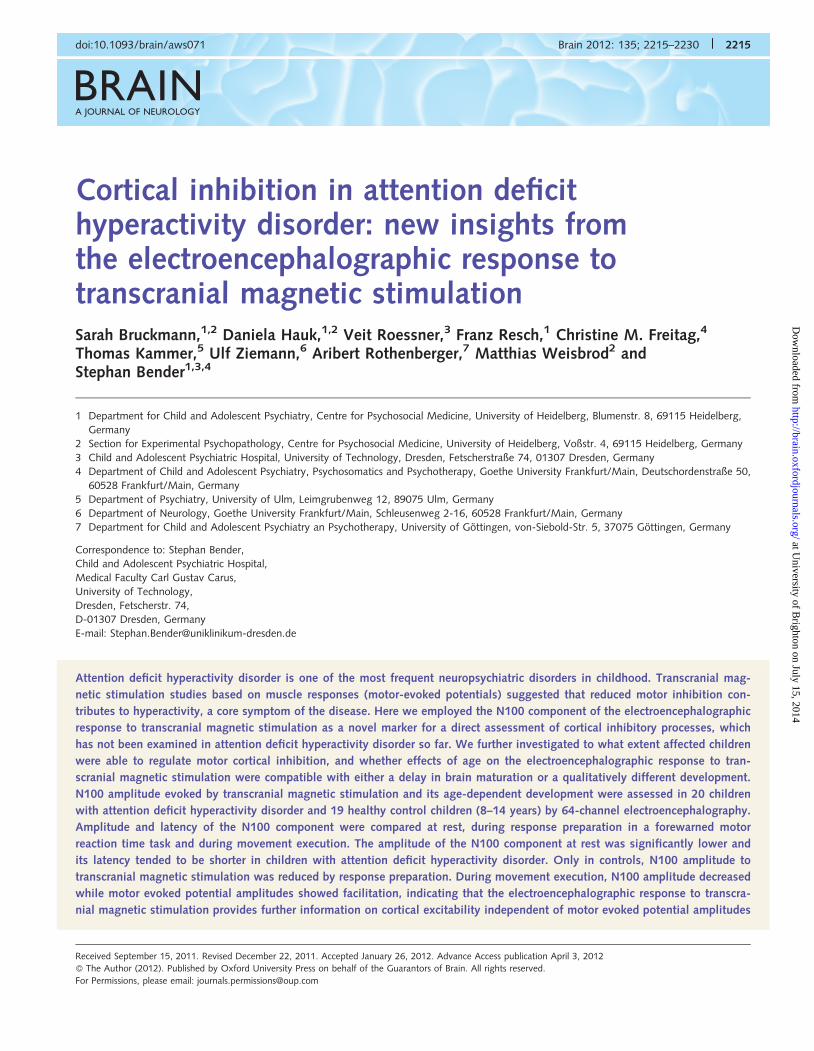
Contingent negative variation taskForty CNV trials were recorded using a visual warning stimulus S1 [a
white exclamation mark on 34 � 27 cm (width � height) black back-
ground that was presented for 150 ms] and a visual imperative stimu-
lus S2 (a white line drawing of a hand on a 34 � 27 cm black
background) on a computer screen at 1 m distance. Intertrial intervals
varied randomly from 7 s to 15 s. Stimulus onset asynchrony between
S1 and S2 was 3 s. Subjects were instructed to respond as fast as
possible when S2 occurred by pressing a red button with the index
finger of their dominant right hand.
The CNV paradigm was implemented by Presentation (Version
14.2., Neurobehavioural Systems Inc.). Two different combinations
of CNV and TMS were assessed: TMS during the intertrial intervals
Table 1 Detailed characteristics of the study samples
Diagnostic group ADHD Controls
Sample size (n) 20 19
Age (mean � SD) 11.4 � 1.7 years 12.2 � 2.0 years
Age range 8.8–14.0 years 8.2–14.8 years
Gender 18 males, 2 females 17 males, 2 females
Handedness (EHI; mean � SD) 91 � 11 87 � 16
IQ (mean � SD) 106.9 � 10.6 116.6 � 10.4
IQ range 81–130 97–132
FBB-HKS total (mean � SD) 2.2 � 0.4 –
FBB-HKS ‘hyperactivity and impulsivity’ (mean � SD) 2.1 � 0.4 –
Resting motor threshold (mean � SD) 79 � 14% 76 � 12%
EHI = Edinburgh Handedness Inventory; FBB-HKS = validated German version of the ADHD rating scale (20 items according DSM IV and ICD-10 ADHD criteria, scored bythe parents of the child: 0 = not present, 1 = mildly present, criterion not fulfilled, 2 = clearly present, criterion fulfilled, 3 = extremely severe).The FBB-HKS total score is the mean of all 20 items, while the hyperactive-impulsive subscore excludes the nine DSM IV inattention items. Norms indicate for example that
for 7 to 10-year-old boys an FBB-HKS total score42.15 corresponds to a Conners parent rating scale t-score of �70 (about two standard deviations above the mean). Thegroup mean value of 2.2 indicates that either about all hyperactivity-impulsivity items were clearly fulfilled with clinically relevant impairment or some items were evencoded as ‘extremely severe’.
A combined TMS-EEG approach in ADHD Brain 2012: 135; 2215–2230 | 2217
at University of B
righton on July 15, 2014http://brain.oxfordjournals.org/
Dow
nloaded from
(while subjects were resting) or TMS during the late part of the
CNV (late CNV), which is supposed to reflect sensory attention and
motor preparation. During the CNV task, 20 TMS pulses were applied
during the intertrial intervals and 20 pulses during late CNV. In add-
ition, 20 CNV trials and 20 intertrial intervals were recorded without
TMS. The different conditions varied randomly. In trials with TMS
during late CNV (2.8 s after onset of S1), S2 was delayed until 0.5 s
after TMS (3.3 s after onset of S1) in order to avoid interference be-
tween processes related to TMS and to presentation of S2 (Fig. 1).
Late CNV amplitude was investigated in trials with TMS only in order
to evaluate the effect of motor preparation on the TMS-evoked N100
component. This was determined as the mean amplitude 500–30 ms
before TMS.
Transcranial magnetic stimulationMonophasic single-pulse TMS was applied using a Magstim 200
stimulator with a 13 cm diameter circular coil that was positioned
over the vertex and oriented tangentially to the skull on the left
hemisphere. The current flow within the coil was oriented
counter-clockwise when viewed from above to stimulate preferentially
the left motor cortex (Di Lazzaro et al., 1998, 2001). Stimulation was
performed over the hand area of the motor cortex and the coil
position resulting in maximum MEP amplitude in the right first dorsal
interosseous muscle was marked on the electrode caps. The weight of
the coil was carried by a tripod stand while an assistant assured a
constant positioning of the coil during recordings.
Resting motor threshold was determined as the lowest intensity that
reliably produced MEP amplitude of at least 50 mV in the relaxed right
first dorsal interosseous muscle in at least 5 of 10 trials (Rossini et al.,
1994; Paus et al., 2001). Relaxation of the first dorsal interosseous
muscle was controlled by acoustic feedback. Children were hearing-
protected against the clicks of the TMS coil by earplugs. We refrained
from using a masking noise against bone conduction because of its
possible detrimental effects on the subject’s vigilance level (Bender
et al., 2005). Instead, we performed spatiotemporal source analysis
to separate motor cortex responses to TMS from possible confounding
influences by volume conduction of auditory evoked potentials (see
below).
For TMS during the CNV task, intensity was set to 105% resting
motor threshold to obtain reliable MEPs. In cases where 105% resting
motor threshold exceeded the maximum stimulator output, intensity
was set to 100% (one control subject, resting motor threshold: 96%
maximum stimulator output; one subject with ADHD, resting motor
threshold: 100% maximum stimulator output). Resting motor thresh-
old is higher in children than in adults (Nezu et al., 1997), and the
additional distance between the coil and the scalp caused by the EEG
electrode cap further increases resting motor threshold despite the use
of flat electrodes. The results were not affected by the single subject
with ADHD with the slightly lower relative stimulus intensity. On aver-
age children with ADHD were stimulated with slightly higher absolute
stimulation intensities than the control group (resting motor threshold
was 79 � 14% maximum stimulator output in children with ADHD
and 76 � 12% maximum stimulator output in healthy controls). As
TMS-evoked N100 amplitude increases with increasing TMS-intensity
(Komssi et al., 2004; Bender et al., 2005a), this means that, if any-
thing, decreases of TMS-evoked N100 amplitude in ADHD would be
underestimated.
In order to confirm the inhibitory nature of TMS-evoked N100, a
subsample of 17 healthy controls and 12 children with ADHD partici-
pated in a second task, in which the subjects themselves pressed the
button that triggered the magnetic stimulation by an abduction move-
ment of their right index finger. TMS intensity was again 105% of the
resting motor threshold. This way we could compare TMS-evoked
N100 as well as MEP amplitudes during movement execution with
the respective measurements at rest (Nikulin et al., 2003).
Electroencephalographic recordingsContinuous direct current EEG from 64 channels at a sampling rate of
500 Hz was recorded (BrainAmps MR plus, BrainProducts) against a
recording reference near the vertex. Sixty-four sintered silver/silver
chloride electrodes (impedances 5 10 k�) were fixed by using differ-
ent sized equidistant electrode caps (Easycap GmbH). Vertical
electrooculogram was recorded from an electrode attached 1 cm
below the left eye, whereas horizontal electrooculogram was recorded
from electrodes 1 cm lateral to the outer canthi. TMS and EEG were
synchronized by transistor–transistor logic triggers in the CNV task
(Presentation, Version 14.2., Neurobehavioural Systems Inc.). The
stimulation software sent triggers to both the EEG recording system
and to the magnetic stimulator. In trials with self-paced movements,
the EEG was segmented on the onset of the TMS artefact in the EEG.
We checked that the steep rise of the TMS artefact assured that this
procedure introduced no jitter exceeding the jitter of the trigger timing
in the CNV task, i.e. the broad TMS-evoked N100 component did not
differ in amplitude regardless of whether it was calculated by segmen-
tation on TMS triggers or the onset of the TMS artefact.
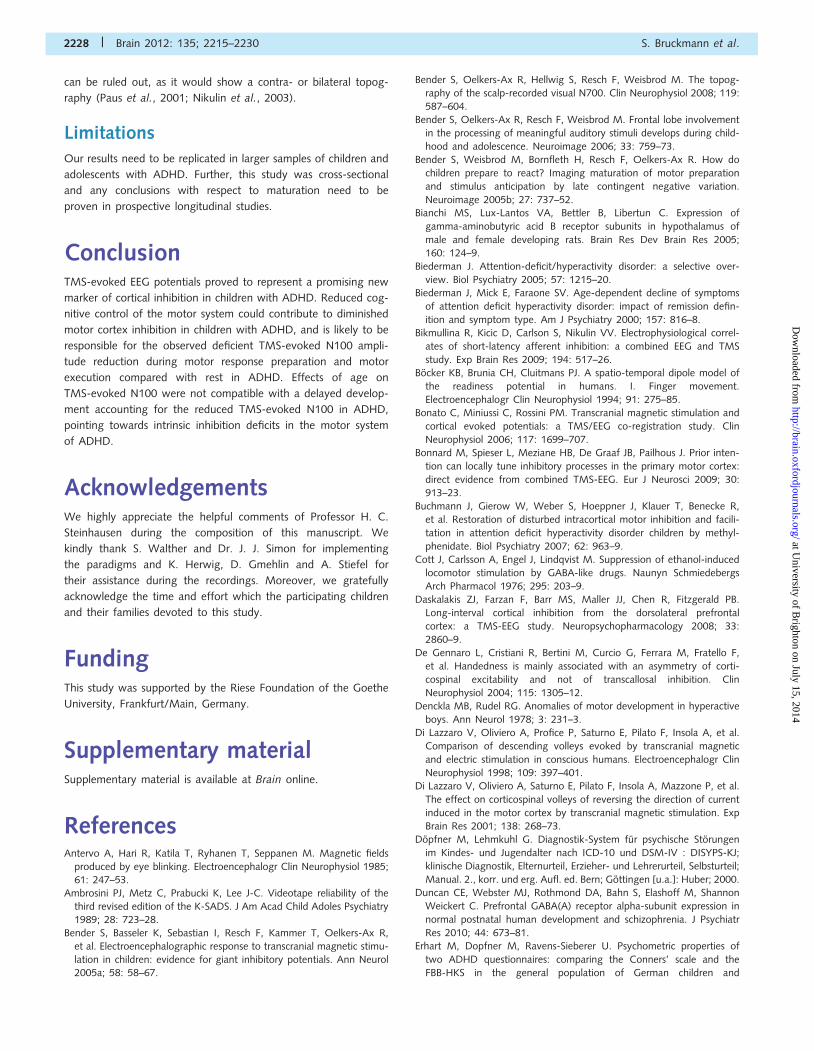
Figure 1 Timing of the contingent negative variation task and TMS. In trials without TMS, stimulus onset asynchrony between S1 and S2
was 3 s. In trials with TMS during late CNV (2.8 s after onset of S1, red flash), S2 was delayed until 0.5 s after TMS (3.3 s after onset of S1)
in order to avoid interference between processes related to TMS and to presentation of S2. The CNV task always preceded the self-paced
movement task, where subjects pressed the button that triggered TMS on the stimulator at irregular intervals varying between �5 and
20 s. TMS-evoked N100 responses to stimulation during response preparation (late CNV) and during movement execution were compared
with TMS-evoked N100 responses to randomly intercalated stimulations during the intertrial intervals.
2218 | Brain 2012: 135; 2215–2230 S. Bruckmann et al.
at University of B
righton on July 15, 2014http://brain.oxfordjournals.org/
Dow
nloaded from
Motor-evoked potential recordingsSurface EMG of the right first dorsal interosseous muscle was recorded
from silver/silver chloride self-adhesive electrodes in a belly tendon
montage by a Jaeger-Toennies Neuroscreen. Epochs lasted from
180 ms before the TMS pulse to 420 ms afterwards in EMG recordings.
Electrode impedances were kept below 10 k�. Data were sampled at
2560 Hz and a bandpass filter of 20–1000 Hz was employed. MEP
peak-to-peak amplitudes were determined for the different experi-
mental conditions. Due to technical problems for n = 2 (CNV para-
digm) or n = 3 (self-paced movement paradigm) healthy controls, no
MEP measurements could be obtained. We made sure that the re-
ported effects on TMS-evoked N100 amplitude were not produced
by extreme values in these subjects for which no MEP data were
available.
Signal preprocessingEEG-data analysis was processed via Brain Vision Analyzer (Brain
Products GmbH) and BESA (BESA GmbH). Offline, recordings were
transformed to an average reference.
For the investigation of TMS-evoked N100 at rest (TMS during
intertrial intervals in the CNV task), EEG data were segmented based
on TMS triggers into epochs of 2 s (0.5 s before TMS and 1.5 s after
TMS). For analysis of TMS-evoked N100 during response preparation
(TMS during late CNV), EEG data were segmented based on the
warning stimulus into epochs of 5.3 s (3.8 s before and 1.5 s after
TMS-stimulus).
Recordings 500–30 ms before TMS stimulus were chosen as baseline
to avoid contamination of the EEG response by the TMS artefact.
When TMS was applied during response preparation (late CNV), the
baseline referred to the 1000 ms before the warning stimulus, in order
to avoid effects of a baseline shift by late CNV amplitude.
A visual artefact rejection was applied as we did not want to rely
upon automatic rejection procedures in the presence of TMS-induced
artefacts. Far less than one-third of all trials had to be removed be-
cause of artefacts. Artefact rejection was conducted by a person who
was blind to the study hypotheses. While artefact rejection reduced
signal variance, it did not introduce systematic changes compared with
averages of the uncorrected data. Leads with electrode polarization
artefacts due to the position of the stimulation coil (most often F1)
were excluded and interpolated by nearest neighbours. Only trials with
correct response within 1 s after the presentation of S2 were included
for further analysis.
The TMS-evoked N100 component could be clearly separated from
the TMS-induced artefact (Bender et al., 2005a). The TMS-induced
artefact was further reduced by a principal component analysis-based
correction algorithm (BESA GmbH) described by Litvak et al. (2007).
Additionally, a low-pass filter for the EEG signal (high cut-off 20 Hz;
slope 48 dB/octave) was applied.
Data analysisThe TMS-evoked N100 was determined as the highest negative peak
at C3, i.e. ipsilateral to TMS, in the interval 80–200 ms after TMS. This
broad time window was chosen to take into account the long
TMS-evoked N100 latencies of children (Bender et al., 2005a). C3
electrode was chosen according to previous reports that indicated a
maximum of TMS-evoked EEG response of motor cortex and
TMS-evoked N100 amplitude slightly posterior and ventral to C3 for
left-hemispheric TMS or C4 for right-hemispheric TMS (Paus et al.,
2001; Nikulin et al., 2003; Bender et al., 2005a; Bonato et al., 2006).
By visual inspection, it was confirmed for every participant that there
was only one distinct negative peak in this latency range. The
TMS-evoked N100 was calculated as the mean amplitude in the
time window �20 ms around the TMS-evoked N100 peak.
TMS-evoked N100 latency was determined as the time from TMS to
the N100 peak at C3.
The amplitude of late CNV was determined at electrode C3 as the
mean potential amplitude from 500 ms to 30 ms before TMS in order
to check for possible confounding effects of baseline shifts produced
by late CNV amplitude on TMS-evoked N100 amplitude.
Source modellingTime-variant, spatially stagnant, current dipoles were used to model
electrically active brain areas minimizing residual variance and dipole
energy (Picton et al., 1995). A four-shell spherical sphere head model
was applied (BESA research 5.3; BESA GmbH). The model was fitted
on the grand average of the control group at rest in order to obtain a
model that describes the most reliable characteristics of the spatiotem-
poral data matrix (Bocker et al., 1994; Bender et al., 2005b). Scalp
topography during TMS-evoked N100 showed two pronounced
maxima (Fig. 2), left centroparietal negativity and a less lateralized
prefrontal positivity. The time courses of these two peaks differed
slightly from each other (cf. source waveforms of dipoles 1 and 2 in
Fig. 3). Thus, a single dipolar source was insufficient to explain the
surface topography, and a careful assessment of ocular artefacts was
necessary.
We applied the ocular artefact correction algorithm according to
Gratton et al. (1983) as implemented in Brain Vision Analyzer. Since
the TMS-artefact can considerably distort the calculated propagation
factors, we ‘cut the TMS artefact out’ (Taylor et al., 2010) up to the
start of the rise of the TMS-evoked N100 component (0–60 ms).
However, this procedure could not remove time-locked blinks in re-
sponse to TMS. Blink potentials are mainly caused by currents flowing
from the positively charged cornea to the anterior forehead when the
eyelids slide down (Matsuo et al., 1975; Antervo et al., 1985). Thus,
blinks produce a slightly lower negativity below and a stronger posi-
tivity above the eye (Picton et al., 2000; Bender et al., 2008). During
early TMS-evoked N100 (60–110 ms), the frontopolar positivity was
accompanied by a smaller infraorbital negativity, a hint towards
time-locked blinks in response to the TMS (single trial example in
Supplementary Fig. 1). Therefore, we modelled an additional dipole
source. The effects on the scalp EEG electrodes can be modelled by a
radially oriented equivalent dipole near the eyes (Lins et al., 1993),
influences on central and more posterior electrodes are minor (Picton
et al., 2000).
We obtained a stable two dipole solution, regardless of the fitting
procedure. In order to minimize the overlap between the two gener-
ators of the frontopolar positive and the centroparietal negative peaks,
we started by fitting a dipole on the descending flank of the
TMS-evoked N100 peak in C3 (130–200 ms), after the end of the
negative peak in the infraorbital channel (Supplementary Fig. 1). A
second dipole source was fitted on the ascending flank of the
TMS-evoked N100 peak in Fp1 (60–110 ms) with the first dipole still
active. Finally, the two sources were refit together in order to avoid
distortions in the modelling of the left central dipole due to any re-
maining blink influences. The genetic algorithm implemented in BESA
applied to the ascending TMS-evoked N100 (60–110 ms) also yielded
the same reliable two-dipole solution with a stable source in the left
precentral region and one frontopolar source from different starting
points. Also, when starting with temporal tangential dipoles, the dipole
was fitted to the left precentral area. Remaining residual variance did
A combined TMS-EEG approach in ADHD Brain 2012: 135; 2215–2230 | 2219
at University of B
righton on July 15, 2014http://brain.oxfordjournals.org/
Dow
nloaded from
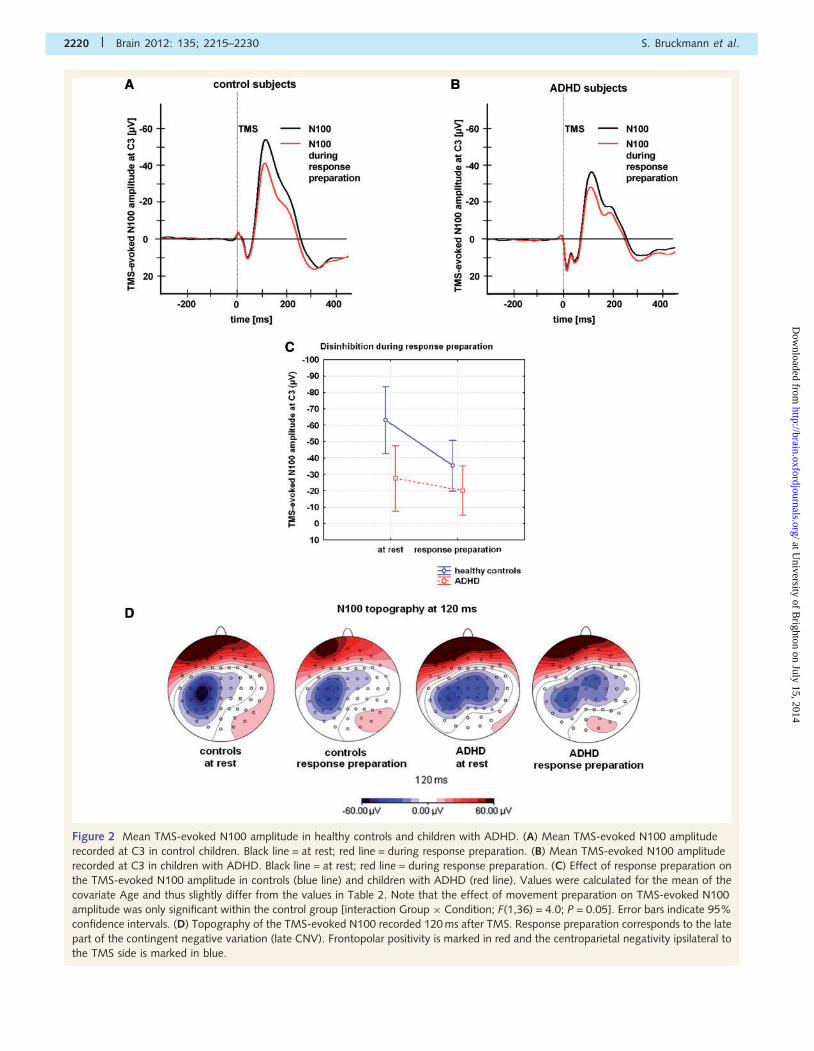
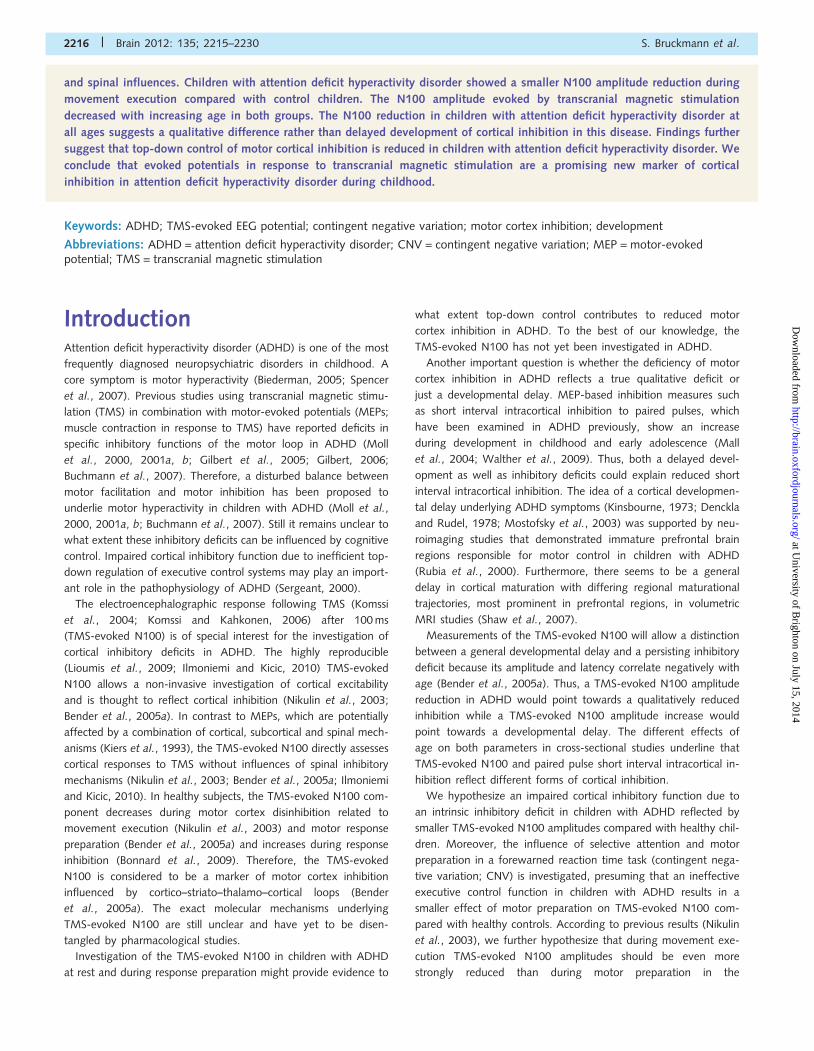
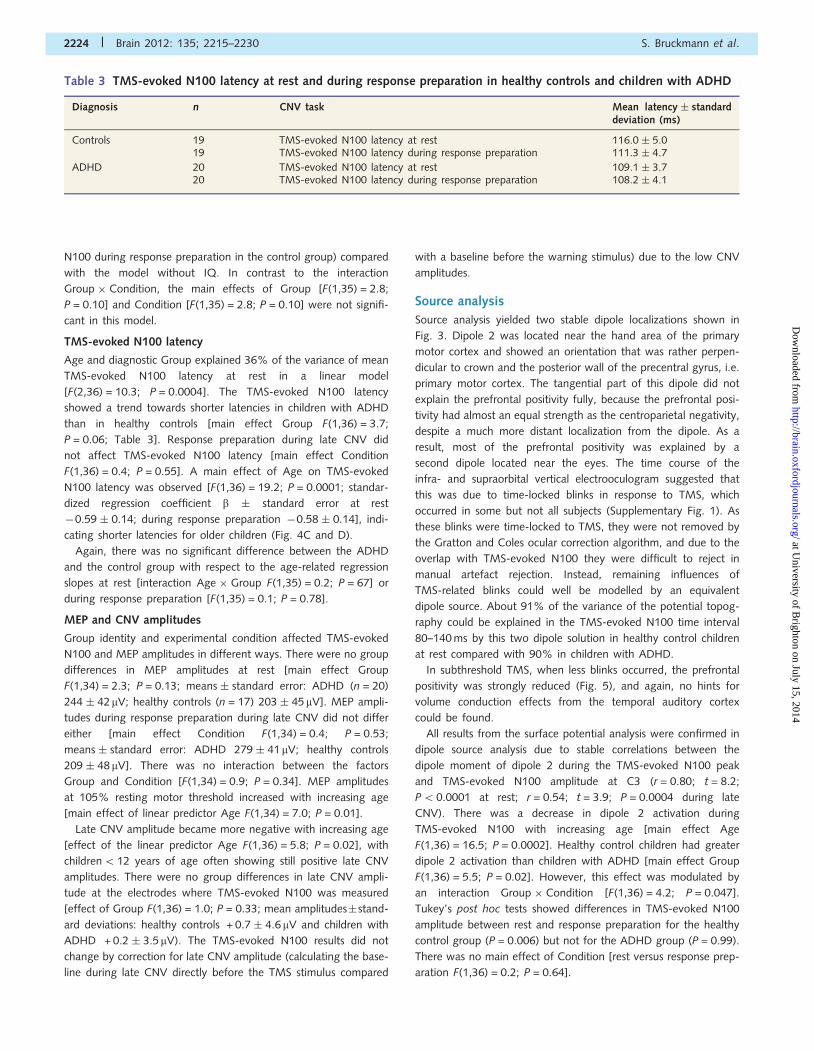
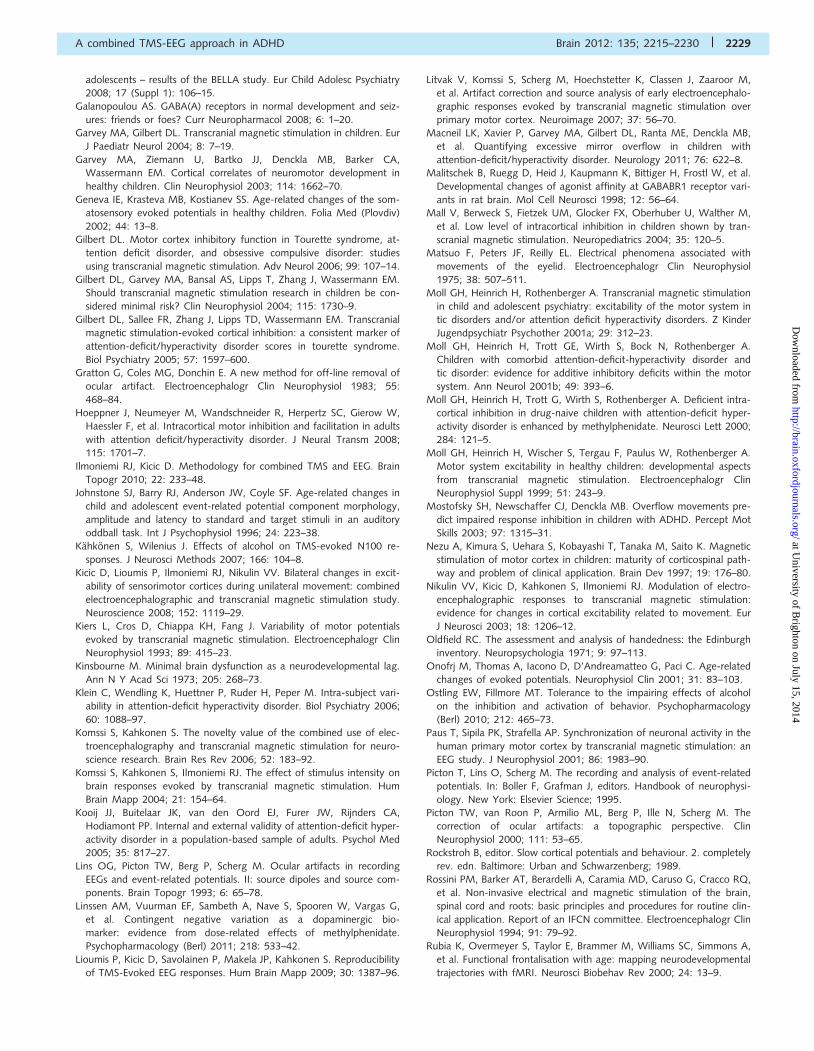
Figure 2 Mean TMS-evoked N100 amplitude in healthy controls and children with ADHD. (A) Mean TMS-evoked N100 amplitude
recorded at C3 in control children. Black line = at rest; red line = during response preparation. (B) Mean TMS-evoked N100 amplitude
recorded at C3 in children with ADHD. Black line = at rest; red line = during response preparation. (C) Effect of response preparation on
the TMS-evoked N100 amplitude in controls (blue line) and children with ADHD (red line). Values were calculated for the mean of the
covariate Age and thus slightly differ from the values in Table 2. Note that the effect of movement preparation on TMS-evoked N100
amplitude was only significant within the control group [interaction Group � Condition; F(1,36) = 4.0; P = 0.05]. Error bars indicate 95%
confidence intervals. (D) Topography of the TMS-evoked N100 recorded 120 ms after TMS. Response preparation corresponds to the late
part of the contingent negative variation (late CNV). Frontopolar positivity is marked in red and the centroparietal negativity ipsilateral to
the TMS side is marked in blue.
2220 | Brain 2012: 135; 2215–2230 S. Bruckmann et al.
at University of B
righton on July 15, 2014http://brain.oxfordjournals.org/
Dow
nloaded from
not point towards an additional generator and consisted of low amp-
litude widespread potentials.
The model was applied to all individual averages, and the mean
dipole moments in the TMS-evoked N100 time interval �20 ms
around the TMS-evoked N100 peak on dipole 2 was exported for
statistical analysis. These source waveforms indicate the level of activ-
ity in the respective dipoles, and thus allow a determination of the
extent to which the surface potential is explained by activity in the
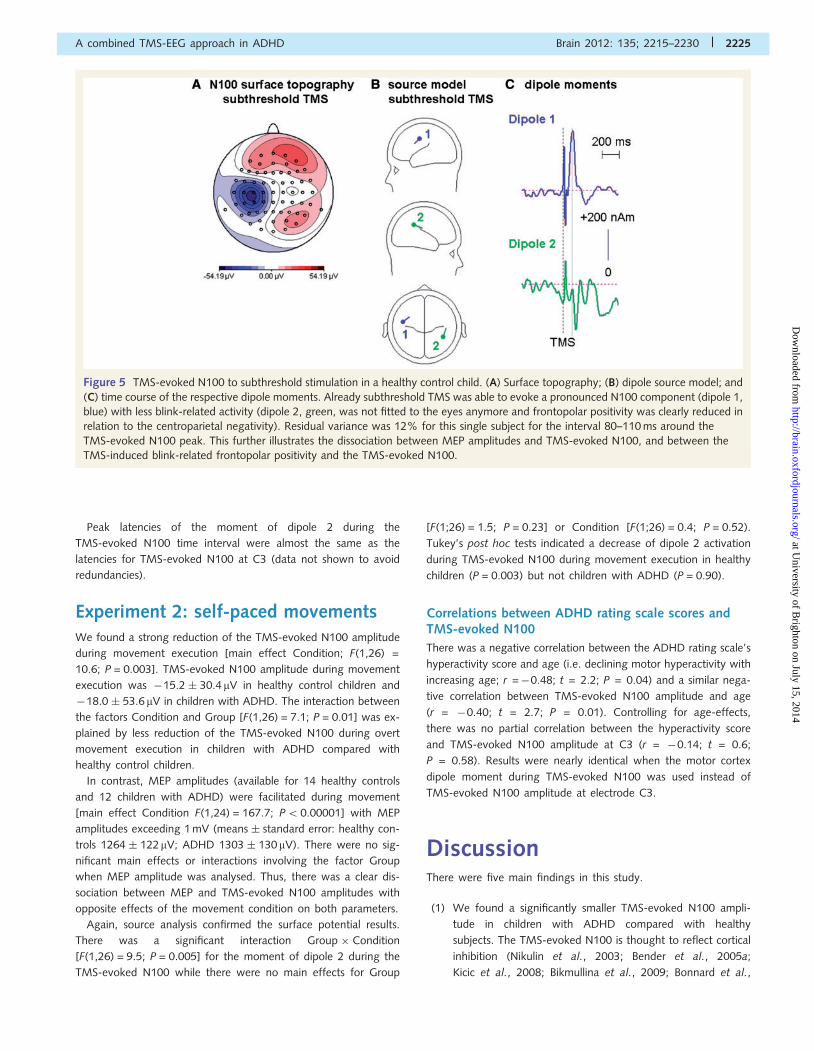
Figure 3 Source analysis of TMS-evoked N100 in subjects with ADHD and typically-developing control children. (A) Dipole source
localization and orientation in the healthy control group (grand average). Dipole 1 (red) was located near the eyes with a rather radial
orientation that has been described for blink-related potentials. Dipole 2 (blue) was located near the stimulated primary motor cortex hand
area and showed a mostly radial orientation. There is also a smaller tangential component with an orientation perpendicular to the
posterior wall of the precentral gyrus. (B) Timecourse of the respective dipole moments in healthy control children. Dipole 1 peaked slightly
earlier than dipole 2. On the single subject level, there was no constant temporal relationship between the two peaks, pointing towards
two independent sources. The black bar marks the ‘cut out’ time interval around the TMS artefact. The cutting out procedure is established
in the literature and was used to avoid distortions of the ocular correction factors by the TMS artefact. (C) Surface topography of
TMS-evoked N100 and surface topographies explained by dipole 1 and dipole 2. While dipole 1 accounts for a large part of the
frontopolar positivity, dipole 2 explains the ipsilateral centroparietal negativity together with a small part of the frontopolar positivity. Note
that there was no deep temporal positivity in TMS-evoked N100 surface topography, indicating no prominent contribution of temporal
sources to centroparietal TMS-evoked N100 by a tangentially oriented source in the temporal auditory cortex. (D) Localization of dipole 2
in a standard brain. (E) Dipole model for the ADHD group (grand average, dipole orientations refitted). (F) Time course of the respective
dipole moments in children with ADHD (compare with Fig. 3B).
A combined TMS-EEG approach in ADHD Brain 2012: 135; 2215–2230 | 2221
at University of B
righton on July 15, 2014http://brain.oxfordjournals.org/
Dow
nloaded from
respective equivalent dipole. Dipole source localizations were kept con-
stant when applied to individual averages, given the considerably
lower signal-to-noise ratio of the individual data sets, however,
dipole orientation was refit in order to adjust for individual differences
in the anatomy of gyri and sulci (Picton et al., 1995; Bender et al.,
2006). We made sure that refitting dipole orientations only resulted in
minor adjustments and the spatial filter characteristics of the dipoles
were maintained.
The localization of the left central dipole was confirmed by a source
analysis of TMS-evoked N100 following subthreshold TMS, which
evoked no EMG response. In this condition, TMS-induced blinks
were much less common or absent. The result of this control experi-
ment is illustrated in a representative healthy control child.
Statistical analyses
Experiment 1: contingent negative variation task
In two separate analyses, the main target parameters TMS-evoked
N100 amplitude and latency were tested in parallel general linear
models with the categorical between subject predictor diagnostic
Group (ADHD versus healthy controls), the repeated measurement
factor Condition (at rest versus response preparation) and the linear
predictor Age. MEP amplitudes were examined in the same way, in
order to assess whether TMS-evoked EEG potentials were independent
of changes in MEP amplitude. Significant main effects and interactions
were further examined by Tukey’s honestly significant difference post
hoc tests. In order to test for maturational differences between the
groups, we tested for significantly different age-related regression
slopes for TMS-evoked N100 (interaction Age � Group) in two separ-
ate multifactorial regression analyses for TMS-evoked N100 at rest and
during response preparation (Statistica, StatSoft Inc.).
The same analyses were repeated with the dipole moment of dipole
2 (Fig. 3) during the TMS-evoked N100 peak in order to exclude any
influences of artificial sources (auditory responses to the coil click,
TMS-related blinks) on our results. Dipole 2 served as a spatial filter
assessing specifically potentials that are in agreement with primary and
premotor cortex activation. Two-sided t-tests were used when appro-
priate for comparison of two means only. The significance level
was 0.05.
Experiment 2: self-paced movements
Group differences and influences of movement execution on
TMS-evoked N100 amplitude were assessed in a general linear
model with the repeated measurement factor Condition (TMS-
evoked N100 to a single TMS pulse at rest versus TMS-evoked
N100 to TMS during movement execution), the categorical predictor
Group (ADHD versus healthy controls) and the linear predictor Age.
Again, the influences of the factors Condition and Group were
examined for MEP amplitudes in order to exclude that findings with
respect to TMS-evoked N100 amplitude were a consequence of dif-
ferences in cortical excitation reflected by MEP amplitudes.
Surface electrode TMS-evoked N100 analyses were confirmed by
parallel analyses on the TMS-evoked N100 peak in the source wave-
form of dipole 2 (Fig. 3) as a spatial filter to isolate the potential
topography that is compatible with (pre/primary) motor cortex
activation.
Results
Experiment 1
Behavioural data
Reaction time in the CNV-task (mean � SD) was 275 � 58 ms in
children with ADHD and 301 � 54 ms in healthy control children.
It did not differ significantly between the two groups (t = 1.5;
P = 0.15).
Resting motor threshold of ADHD and control children (Table 1)
did not differ (t = 0.8; P = 0.42).
Electrophysiological data
TMS-evoked N100 amplitude
Time-course and topography of the TMS-evoked potential are
illustrated in Fig. 2A, B and D. For mean values and standard
deviations see Table 2. The topography of TMS-evoked N100
at rest showed an ipsilateral centroparietal negativity and a
frontopolar positivity with both potentials decreasing during
response preparation.
The factors Age and diagnostic Group explained 28% of the
variance of the TMS-evoked N100 amplitudes at rest in the re-
spective linear model [F(2,36) = 7.0; P = 0.003].
The TMS-evoked N100 amplitude was smaller in children with
ADHD than in healthy control children [main effect Group
F(1,36) = 4.8; P = 0.04; Fig. 2 and Table 2]. Response preparation
and sensory attention during the CNV task resulted in a decrease
of TMS-evoked N100 amplitude when compared with the rest
condition [main effect Condition F(1,36) = 5.0; P = 0.03].
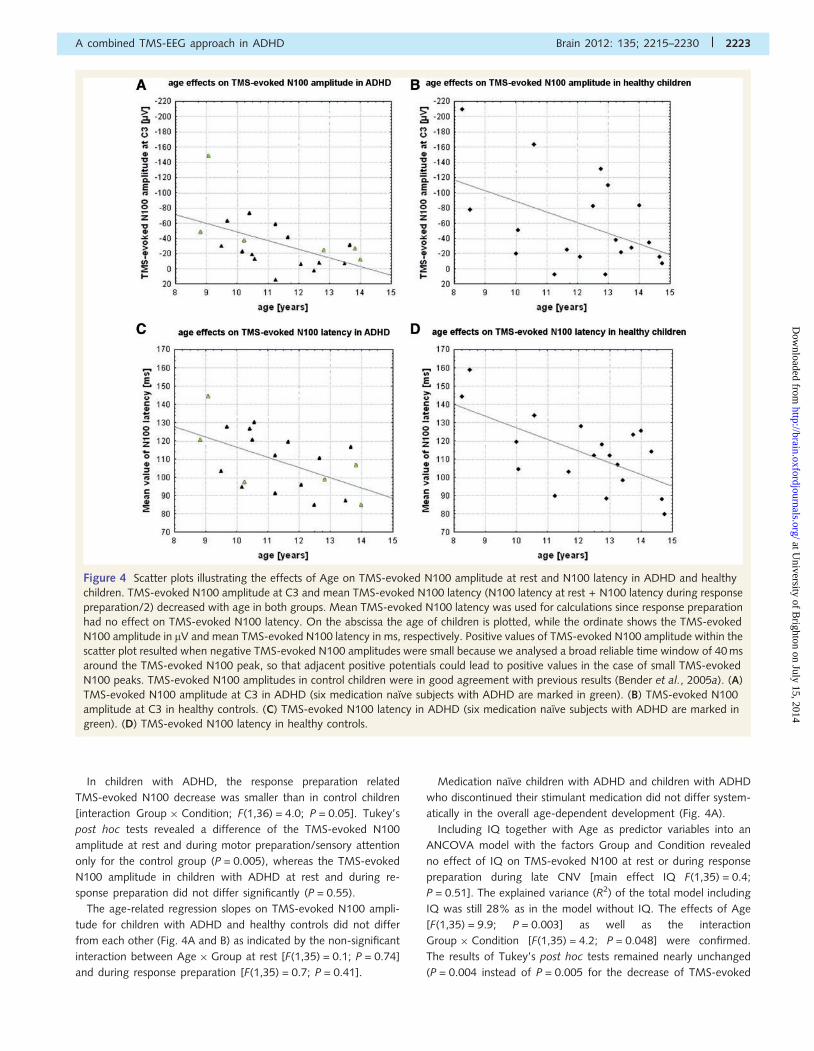
TMS-evoked N100 amplitudes declined with increasing Age
[F(1,36) = 10.5; P = 0.003; standardized regression coefficient
b�standard error at rest 0.47 � 0.14; during response preparation
0.41 � 0.15; Fig. 4A and B]. The positive regression coefficients
indicate a decrease of the negative TMS-evoked N100 amplitude
with increasing age.
Table 2 TMS-evoked N100 amplitude recorded at C3 at rest and during response preparation (lateral CNV) in healthycontrols and children with ADHD
Diagnostic group n CNV-task Mean amplitude �standard deviation (mV)
Controls 19 TMS-evoked N100 at rest �58.0 � 13.719 TMS-evoked N100 during response preparation �32.1 � 8.3
ADHD 20 TMS-evoked N100 at rest �32.4 � 7.920 TMS-evoked N100 during response preparation �23.2 � 7.8
2222 | Brain 2012: 135; 2215–2230 S. Bruckmann et al.
at University of B
righton on July 15, 2014http://brain.oxfordjournals.org/
Dow
nloaded from
In children with ADHD, the response preparation related
TMS-evoked N100 decrease was smaller than in control children
[interaction Group � Condition; F(1,36) = 4.0; P = 0.05]. Tukey’s
post hoc tests revealed a difference of the TMS-evoked N100
amplitude at rest and during motor preparation/sensory attention
only for the control group (P = 0.005), whereas the TMS-evoked
N100 amplitude in children with ADHD at rest and during re-
sponse preparation did not differ significantly (P = 0.55).
The age-related regression slopes on TMS-evoked N100 ampli-
tude for children with ADHD and healthy controls did not differ
from each other (Fig. 4A and B) as indicated by the non-significant
interaction between Age � Group at rest [F(1,35) = 0.1; P = 0.74]
and during response preparation [F(1,35) = 0.7; P = 0.41].
Medication naıve children with ADHD and children with ADHD
who discontinued their stimulant medication did not differ system-
atically in the overall age-dependent development (Fig. 4A).
Including IQ together with Age as predictor variables into an
ANCOVA model with the factors Group and Condition revealed
no effect of IQ on TMS-evoked N100 at rest or during response
preparation during late CNV [main effect IQ F(1,35) = 0.4;
P = 0.51]. The explained variance (R2) of the total model including
IQ was still 28% as in the model without IQ. The effects of Age
[F(1,35) = 9.9; P = 0.003] as well as the interaction
Group � Condition [F(1,35) = 4.2; P = 0.048] were confirmed.
The results of Tukey’s post hoc tests remained nearly unchanged
(P = 0.004 instead of P = 0.005 for the decrease of TMS-evoked
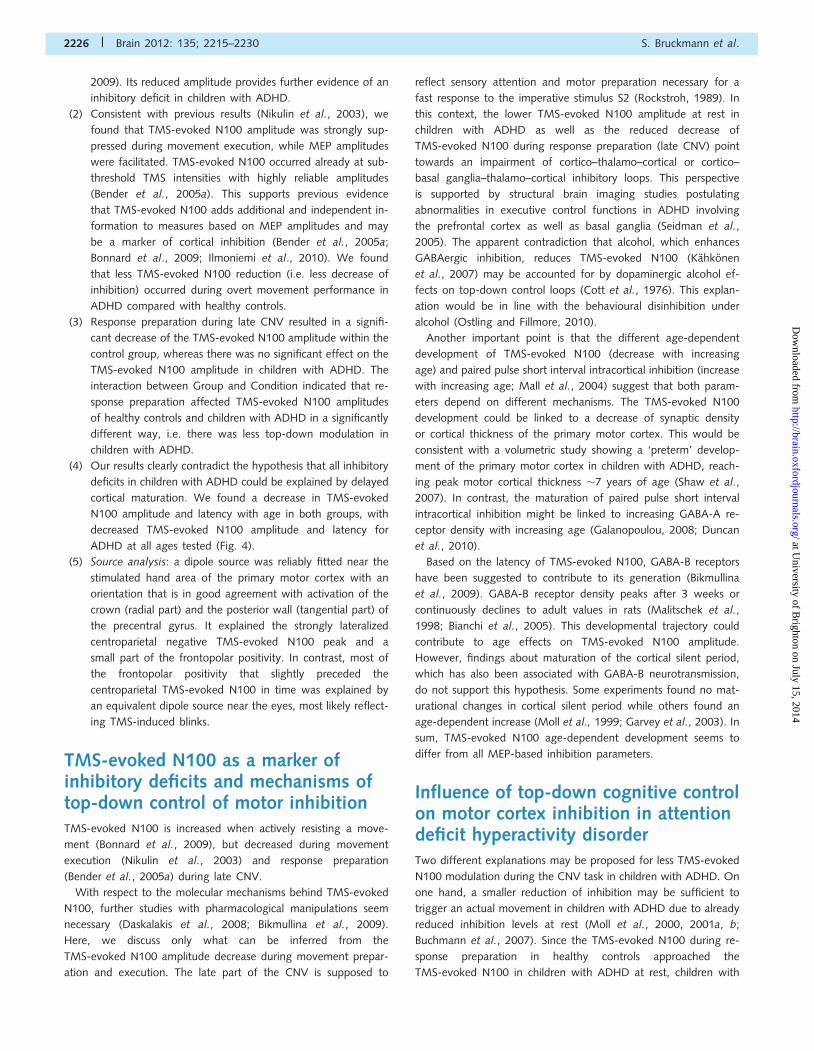
Figure 4 Scatter plots illustrating the effects of Age on TMS-evoked N100 amplitude at rest and N100 latency in ADHD and healthy
children. TMS-evoked N100 amplitude at C3 and mean TMS-evoked N100 latency (N100 latency at rest + N100 latency during response
preparation/2) decreased with age in both groups. Mean TMS-evoked N100 latency was used for calculations since response preparation
had no effect on TMS-evoked N100 latency. On the abscissa the age of children is plotted, while the ordinate shows the TMS-evoked
N100 amplitude in mV and mean TMS-evoked N100 latency in ms, respectively. Positive values of TMS-evoked N100 amplitude within the
scatter plot resulted when negative TMS-evoked N100 amplitudes were small because we analysed a broad reliable time window of 40 ms
around the TMS-evoked N100 peak, so that adjacent positive potentials could lead to positive values in the case of small TMS-evoked
N100 peaks. TMS-evoked N100 amplitudes in control children were in good agreement with previous results (Bender et al., 2005a). (A)
TMS-evoked N100 amplitude at C3 in ADHD (six medication naıve subjects with ADHD are marked in green). (B) TMS-evoked N100
amplitude at C3 in healthy controls. (C) TMS-evoked N100 latency in ADHD (six medication naıve subjects with ADHD are marked in
green). (D) TMS-evoked N100 latency in healthy controls.
A combined TMS-EEG approach in ADHD Brain 2012: 135; 2215–2230 | 2223
at University of B
righton on July 15, 2014http://brain.oxfordjournals.org/
Dow
nloaded from
N100 during response preparation in the control group) compared
with the model without IQ. In contrast to the interaction
Group � Condition, the main effects of Group [F(1,35) = 2.8;
P = 0.10] and Condition [F(1,35) = 2.8; P = 0.10] were not signifi-
cant in this model.
TMS-evoked N100 latency
Age and diagnostic Group explained 36% of the variance of mean
TMS-evoked N100 latency at rest in a linear model
[F(2,36) = 10.3; P = 0.0004]. The TMS-evoked N100 latency
showed a trend towards shorter latencies in children with ADHD
than in healthy controls [main effect Group F(1,36) = 3.7;
P = 0.06; Table 3]. Response preparation during late CNV did
not affect TMS-evoked N100 latency [main effect Condition
F(1,36) = 0.4; P = 0.55]. A main effect of Age on TMS-evoked
N100 latency was observed [F(1,36) = 19.2; P = 0.0001; standar-
dized regression coefficient b � standard error at rest
�0.59 � 0.14; during response preparation �0.58 � 0.14], indi-
cating shorter latencies for older children (Fig. 4C and D).
Again, there was no significant difference between the ADHD
and the control group with respect to the age-related regression
slopes at rest [interaction Age � Group F(1,35) = 0.2; P = 67] or
during response preparation [F(1,35) = 0.1; P = 0.78].
MEP and CNV amplitudes
Group identity and experimental condition affected TMS-evoked
N100 and MEP amplitudes in different ways. There were no group
differences in MEP amplitudes at rest [main effect Group
F(1,34) = 2.3; P = 0.13; means � standard error: ADHD (n = 20)
244 � 42 mV; healthy controls (n = 17) 203 � 45 mV]. MEP ampli-
tudes during response preparation during late CNV did not differ
either [main effect Condition F(1,34) = 0.4; P = 0.53;
means � standard error: ADHD 279 � 41 mV; healthy controls
209 � 48 mV]. There was no interaction between the factors
Group and Condition [F(1,34) = 0.9; P = 0.34]. MEP amplitudes
at 105% resting motor threshold increased with increasing age
[main effect of linear predictor Age F(1,34) = 7.0; P = 0.01].
Late CNV amplitude became more negative with increasing age
[effect of the linear predictor Age F(1,36) = 5.8; P = 0.02], with
children512 years of age often showing still positive late CNV
amplitudes. There were no group differences in late CNV ampli-
tude at the electrodes where TMS-evoked N100 was measured
[effect of Group F(1,36) = 1.0; P = 0.33; mean amplitudes�stand-
ard deviations: healthy controls + 0.7 � 4.6 mV and children with
ADHD + 0.2 � 3.5mV). The TMS-evoked N100 results did not
change by correction for late CNV amplitude (calculating the base-
line during late CNV directly before the TMS stimulus compared
with a baseline before the warning stimulus) due to the low CNV
amplitudes.
Source analysis
Source analysis yielded two stable dipole localizations shown in
Fig. 3. Dipole 2 was located near the hand area of the primary
motor cortex and showed an orientation that was rather perpen-
dicular to crown and the posterior wall of the precentral gyrus, i.e.
primary motor cortex. The tangential part of this dipole did not
explain the prefrontal positivity fully, because the prefrontal posi-
tivity had almost an equal strength as the centroparietal negativity,
despite a much more distant localization from the dipole. As a
result, most of the prefrontal positivity was explained by a
second dipole located near the eyes. The time course of the
infra- and supraorbital vertical electrooculogram suggested that
this was due to time-locked blinks in response to TMS, which
occurred in some but not all subjects (Supplementary Fig. 1). As
these blinks were time-locked to TMS, they were not removed by
the Gratton and Coles ocular correction algorithm, and due to the
overlap with TMS-evoked N100 they were difficult to reject in
manual artefact rejection. Instead, remaining influences of
TMS-related blinks could well be modelled by an equivalent
dipole source. About 91% of the variance of the potential topog-
raphy could be explained in the TMS-evoked N100 time interval
80–140 ms by this two dipole solution in healthy control children
at rest compared with 90% in children with ADHD.
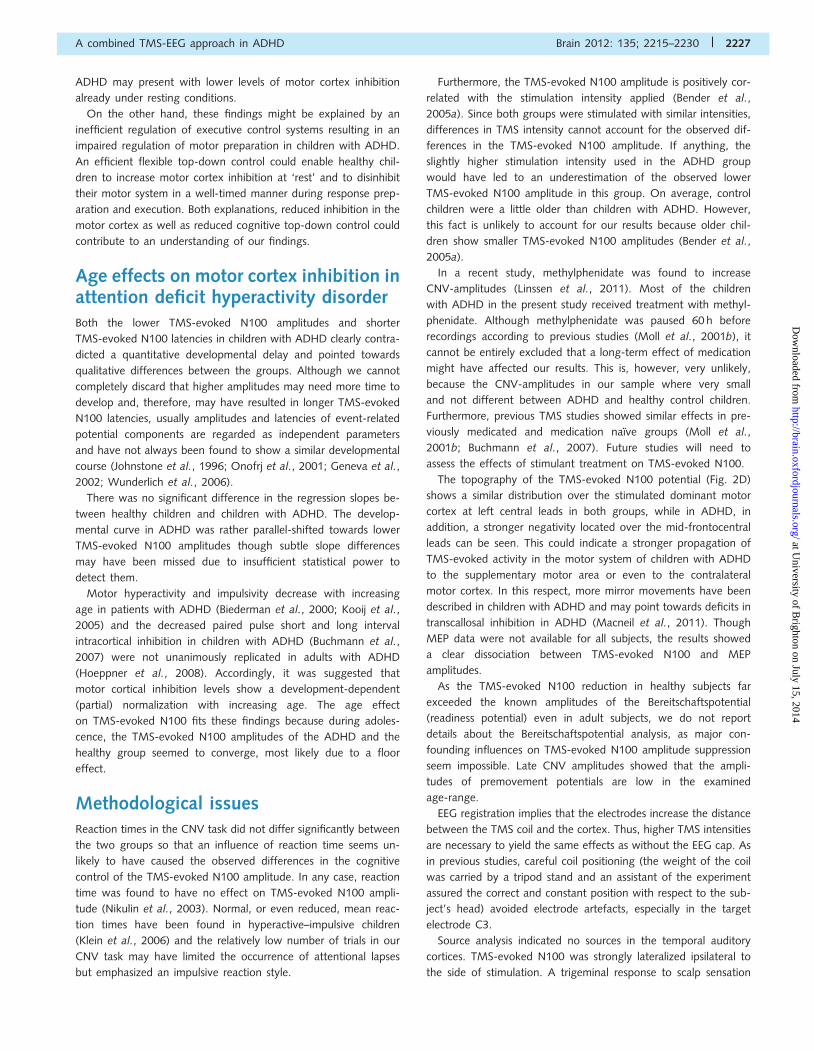
In subthreshold TMS, when less blinks occurred, the prefrontal
positivity was strongly reduced (Fig. 5), and again, no hints for
volume conduction effects from the temporal auditory cortex
could be found.
All results from the surface potential analysis were confirmed in
dipole source analysis due to stable correlations between the
dipole moment of dipole 2 during the TMS-evoked N100 peak
and TMS-evoked N100 amplitude at C3 (r = 0.80; t = 8.2;
P50.0001 at rest; r = 0.54; t = 3.9; P = 0.0004 during late
CNV). There was a decrease in dipole 2 activation during
TMS-evoked N100 with increasing age [main effect Age
F(1,36) = 16.5; P = 0.0002]. Healthy control children had greater
dipole 2 activation than children with ADHD [main effect Group
F(1,36) = 5.5; P = 0.02]. However, this effect was modulated by
an interaction Group � Condition [F(1,36) = 4.2; P = 0.047].
Tukey’s post hoc tests showed differences in TMS-evoked N100
amplitude between rest and response preparation for the healthy
control group (P = 0.006) but not for the ADHD group (P = 0.99).
There was no main effect of Condition [rest versus response prep-
aration F(1,36) = 0.2; P = 0.64].
Table 3 TMS-evoked N100 latency at rest and during response preparation in healthy controls and children with ADHD
Diagnosis n CNV task Mean latency � standarddeviation (ms)
Controls 19 TMS-evoked N100 latency at rest 116.0 � 5.019 TMS-evoked N100 latency during response preparation 111.3 � 4.7
ADHD 20 TMS-evoked N100 latency at rest 109.1 � 3.720 TMS-evoked N100 latency during response preparation 108.2 � 4.1
2224 | Brain 2012: 135; 2215–2230 S. Bruckmann et al.
at University of B
righton on July 15, 2014http://brain.oxfordjournals.org/
Dow
nloaded from
Peak latencies of the moment of dipole 2 during the
TMS-evoked N100 time interval were almost the same as the
latencies for TMS-evoked N100 at C3 (data not shown to avoid
redundancies).
Experiment 2: self-paced movementsWe found a strong reduction of the TMS-evoked N100 amplitude
during movement execution [main effect Condition; F(1,26) =
10.6; P = 0.003]. TMS-evoked N100 amplitude during movement
execution was �15.2 � 30.4mV in healthy control children and
�18.0 � 53.6 mV in children with ADHD. The interaction between
the factors Condition and Group [F(1,26) = 7.1; P = 0.01] was ex-
plained by less reduction of the TMS-evoked N100 during overt
movement execution in children with ADHD compared with
healthy control children.
In contrast, MEP amplitudes (available for 14 healthy controls
and 12 children with ADHD) were facilitated during movement
[main effect Condition F(1,24) = 167.7; P50.00001] with MEP
amplitudes exceeding 1 mV (means � standard error: healthy con-
trols 1264 � 122mV; ADHD 1303 � 130mV). There were no sig-
nificant main effects or interactions involving the factor Group
when MEP amplitude was analysed. Thus, there was a clear dis-
sociation between MEP and TMS-evoked N100 amplitudes with
opposite effects of the movement condition on both parameters.
Again, source analysis confirmed the surface potential results.
There was a significant interaction Group � Condition
[F(1,26) = 9.5; P = 0.005] for the moment of dipole 2 during the
TMS-evoked N100 while there were no main effects for Group
[F(1;26) = 1.5; P = 0.23] or Condition [F(1;26) = 0.4; P = 0.52).
Tukey’s post hoc tests indicated a decrease of dipole 2 activation
during TMS-evoked N100 during movement execution in healthy
children (P = 0.003) but not children with ADHD (P = 0.90).
Correlations between ADHD rating scale scores andTMS-evoked N100
There was a negative correlation between the ADHD rating scale’s
hyperactivity score and age (i.e. declining motor hyperactivity with
increasing age; r =�0.48; t = 2.2; P = 0.04) and a similar nega-
tive correlation between TMS-evoked N100 amplitude and age
(r = �0.40; t = 2.7; P = 0.01). Controlling for age-effects,
there was no partial correlation between the hyperactivity score
and TMS-evoked N100 amplitude at C3 (r = �0.14; t = 0.6;
P = 0.58). Results were nearly identical when the motor cortex
dipole moment during TMS-evoked N100 was used instead of
TMS-evoked N100 amplitude at electrode C3.
DiscussionThere were five main findings in this study.
(1) We found a significantly smaller TMS-evoked N100 ampli-
tude in children with ADHD compared with healthy
subjects. The TMS-evoked N100 is thought to reflect cortical
inhibition (Nikulin et al., 2003; Bender et al., 2005a;
Kicic et al., 2008; Bikmullina et al., 2009; Bonnard et al.,
Figure 5 TMS-evoked N100 to subthreshold stimulation in a healthy control child. (A) Surface topography; (B) dipole source model; and
(C) time course of the respective dipole moments. Already subthreshold TMS was able to evoke a pronounced N100 component (dipole 1,
blue) with less blink-related activity (dipole 2, green, was not fitted to the eyes anymore and frontopolar positivity was clearly reduced in
relation to the centroparietal negativity). Residual variance was 12% for this single subject for the interval 80–110 ms around the
TMS-evoked N100 peak. This further illustrates the dissociation between MEP amplitudes and TMS-evoked N100, and between the
TMS-induced blink-related frontopolar positivity and the TMS-evoked N100.
A combined TMS-EEG approach in ADHD Brain 2012: 135; 2215–2230 | 2225
at University of B
righton on July 15, 2014http://brain.oxfordjournals.org/
Dow
nloaded from
2009). Its reduced amplitude provides further evidence of an
inhibitory deficit in children with ADHD.
(2) Consistent with previous results (Nikulin et al., 2003), we
found that TMS-evoked N100 amplitude was strongly sup-
pressed during movement execution, while MEP amplitudes
were facilitated. TMS-evoked N100 occurred already at sub-
threshold TMS intensities with highly reliable amplitudes
(Bender et al., 2005a). This supports previous evidence
that TMS-evoked N100 adds additional and independent in-
formation to measures based on MEP amplitudes and may
be a marker of cortical inhibition (Bender et al., 2005a;
Bonnard et al., 2009; Ilmoniemi et al., 2010). We found
that less TMS-evoked N100 reduction (i.e. less decrease of
inhibition) occurred during overt movement performance in
ADHD compared with healthy controls.
(3) Response preparation during late CNV resulted in a signifi-
cant decrease of the TMS-evoked N100 amplitude within the
control group, whereas there was no significant effect on the
TMS-evoked N100 amplitude in children with ADHD. The
interaction between Group and Condition indicated that re-
sponse preparation affected TMS-evoked N100 amplitudes
of healthy controls and children with ADHD in a significantly
different way, i.e. there was less top-down modulation in
children with ADHD.
(4) Our results clearly contradict the hypothesis that all inhibitory
deficits in children with ADHD could be explained by delayed
cortical maturation. We found a decrease in TMS-evoked
N100 amplitude and latency with age in both groups, with
decreased TMS-evoked N100 amplitude and latency for
ADHD at all ages tested (Fig. 4).
(5) Source analysis: a dipole source was reliably fitted near the
stimulated hand area of the primary motor cortex with an
orientation that is in good agreement with activation of the
crown (radial part) and the posterior wall (tangential part) of
the precentral gyrus. It explained the strongly lateralized
centroparietal negative TMS-evoked N100 peak and a
small part of the frontopolar positivity. In contrast, most of
the frontopolar positivity that slightly preceded the
centroparietal TMS-evoked N100 in time was explained by
an equivalent dipole source near the eyes, most likely reflect-
ing TMS-induced blinks.
TMS-evoked N100 as a marker ofinhibitory deficits and mechanisms oftop-down control of motor inhibitionTMS-evoked N100 is increased when actively resisting a move-
ment (Bonnard et al., 2009), but decreased during movement
execution (Nikulin et al., 2003) and response preparation
(Bender et al., 2005a) during late CNV.
With respect to the molecular mechanisms behind TMS-evoked
N100, further studies with pharmacological manipulations seem
necessary (Daskalakis et al., 2008; Bikmullina et al., 2009).
Here, we discuss only what can be inferred from the
TMS-evoked N100 amplitude decrease during movement prepar-
ation and execution. The late part of the CNV is supposed to
reflect sensory attention and motor preparation necessary for a
fast response to the imperative stimulus S2 (Rockstroh, 1989). In
this context, the lower TMS-evoked N100 amplitude at rest in
children with ADHD as well as the reduced decrease of
TMS-evoked N100 during response preparation (late CNV) point
towards an impairment of cortico–thalamo–cortical or cortico–
basal ganglia–thalamo–cortical inhibitory loops. This perspective
is supported by structural brain imaging studies postulating
abnormalities in executive control functions in ADHD involving
the prefrontal cortex as well as basal ganglia (Seidman et al.,
2005). The apparent contradiction that alcohol, which enhances
GABAergic inhibition, reduces TMS-evoked N100 (Kahkonen
et al., 2007) may be accounted for by dopaminergic alcohol ef-
fects on top-down control loops (Cott et al., 1976). This explan-
ation would be in line with the behavioural disinhibition under
alcohol (Ostling and Fillmore, 2010).
Another important point is that the different age-dependent
development of TMS-evoked N100 (decrease with increasing
age) and paired pulse short interval intracortical inhibition (increase
with increasing age; Mall et al., 2004) suggest that both param-
eters depend on different mechanisms. The TMS-evoked N100
development could be linked to a decrease of synaptic density
or cortical thickness of the primary motor cortex. This would be
consistent with a volumetric study showing a ‘preterm’ develop-
ment of the primary motor cortex in children with ADHD, reach-
ing peak motor cortical thickness �7 years of age (Shaw et al.,
2007). In contrast, the maturation of paired pulse short interval
intracortical inhibition might be linked to increasing GABA-A re-
ceptor density with increasing age (Galanopoulou, 2008; Duncan
et al., 2010).
Based on the latency of TMS-evoked N100, GABA-B receptors
have been suggested to contribute to its generation (Bikmullina
et al., 2009). GABA-B receptor density peaks after 3 weeks or
continuously declines to adult values in rats (Malitschek et al.,
1998; Bianchi et al., 2005). This developmental trajectory could
contribute to age effects on TMS-evoked N100 amplitude.
However, findings about maturation of the cortical silent period,
which has also been associated with GABA-B neurotransmission,
do not support this hypothesis. Some experiments found no mat-
urational changes in cortical silent period while others found an
age-dependent increase (Moll et al., 1999; Garvey et al., 2003). In
sum, TMS-evoked N100 age-dependent development seems to
differ from all MEP-based inhibition parameters.
Influence of top-down cognitive controlon motor cortex inhibition in attentiondeficit hyperactivity disorderTwo different explanations may be proposed for less TMS-evoked
N100 modulation during the CNV task in children with ADHD. On
one hand, a smaller reduction of inhibition may be sufficient to
trigger an actual movement in children with ADHD due to already
reduced inhibition levels at rest (Moll et al., 2000, 2001a, b;
Buchmann et al., 2007). Since the TMS-evoked N100 during re-
sponse preparation in healthy controls approached the
TMS-evoked N100 in children with ADHD at rest, children with
2226 | Brain 2012: 135; 2215–2230 S. Bruckmann et al.
at University of B
righton on July 15, 2014http://brain.oxfordjournals.org/
Dow
nloaded from
ADHD may present with lower levels of motor cortex inhibition
already under resting conditions.
On the other hand, these findings might be explained by an
inefficient regulation of executive control systems resulting in an
impaired regulation of motor preparation in children with ADHD.
An efficient flexible top-down control could enable healthy chil-
dren to increase motor cortex inhibition at ‘rest’ and to disinhibit
their motor system in a well-timed manner during response prep-
aration and execution. Both explanations, reduced inhibition in the
motor cortex as well as reduced cognitive top-down control could
contribute to an understanding of our findings.
Age effects on motor cortex inhibition inattention deficit hyperactivity disorderBoth the lower TMS-evoked N100 amplitudes and shorter
TMS-evoked N100 latencies in children with ADHD clearly contra-
dicted a quantitative developmental delay and pointed towards
qualitative differences between the groups. Although we cannot
completely discard that higher amplitudes may need more time to
develop and, therefore, may have resulted in longer TMS-evoked
N100 latencies, usually amplitudes and latencies of event-related
potential components are regarded as independent parameters
and have not always been found to show a similar developmental
course (Johnstone et al., 1996; Onofrj et al., 2001; Geneva et al.,
2002; Wunderlich et al., 2006).
There was no significant difference in the regression slopes be-
tween healthy children and children with ADHD. The develop-
mental curve in ADHD was rather parallel-shifted towards lower
TMS-evoked N100 amplitudes though subtle slope differences
may have been missed due to insufficient statistical power to
detect them.
Motor hyperactivity and impulsivity decrease with increasing
age in patients with ADHD (Biederman et al., 2000; Kooij et al.,
2005) and the decreased paired pulse short and long interval
intracortical inhibition in children with ADHD (Buchmann et al.,
2007) were not unanimously replicated in adults with ADHD
(Hoeppner et al., 2008). Accordingly, it was suggested that
motor cortical inhibition levels show a development-dependent
(partial) normalization with increasing age. The age effect
on TMS-evoked N100 fits these findings because during adoles-
cence, the TMS-evoked N100 amplitudes of the ADHD and the
healthy group seemed to converge, most likely due to a floor
effect.
Methodological issuesReaction times in the CNV task did not differ significantly between
the two groups so that an influence of reaction time seems un-
likely to have caused the observed differences in the cognitive
control of the TMS-evoked N100 amplitude. In any case, reaction
time was found to have no effect on TMS-evoked N100 ampli-
tude (Nikulin et al., 2003). Normal, or even reduced, mean reac-
tion times have been found in hyperactive–impulsive children
(Klein et al., 2006) and the relatively low number of trials in our
CNV task may have limited the occurrence of attentional lapses
but emphasized an impulsive reaction style.
Furthermore, the TMS-evoked N100 amplitude is positively cor-
related with the stimulation intensity applied (Bender et al.,
2005a). Since both groups were stimulated with similar intensities,
differences in TMS intensity cannot account for the observed dif-
ferences in the TMS-evoked N100 amplitude. If anything, the
slightly higher stimulation intensity used in the ADHD group
would have led to an underestimation of the observed lower
TMS-evoked N100 amplitude in this group. On average, control
children were a little older than children with ADHD. However,
this fact is unlikely to account for our results because older chil-
dren show smaller TMS-evoked N100 amplitudes (Bender et al.,
2005a).
In a recent study, methylphenidate was found to increase
CNV-amplitudes (Linssen et al., 2011). Most of the children
with ADHD in the present study received treatment with methyl-
phenidate. Although methylphenidate was paused 60 h before
recordings according to previous studies (Moll et al., 2001b), it
cannot be entirely excluded that a long-term effect of medication
might have affected our results. This is, however, very unlikely,
because the CNV-amplitudes in our sample where very small
and not different between ADHD and healthy control children.
Furthermore, previous TMS studies showed similar effects in pre-
viously medicated and medication naıve groups (Moll et al.,
2001b; Buchmann et al., 2007). Future studies will need to
assess the effects of stimulant treatment on TMS-evoked N100.
The topography of the TMS-evoked N100 potential (Fig. 2D)
shows a similar distribution over the stimulated dominant motor
cortex at left central leads in both groups, while in ADHD, in
addition, a stronger negativity located over the mid-frontocentral
leads can be seen. This could indicate a stronger propagation of
TMS-evoked activity in the motor system of children with ADHD
to the supplementary motor area or even to the contralateral
motor cortex. In this respect, more mirror movements have been
described in children with ADHD and may point towards deficits in
transcallosal inhibition in ADHD (Macneil et al., 2011). Though
MEP data were not available for all subjects, the results showed
a clear dissociation between TMS-evoked N100 and MEP
amplitudes.
As the TMS-evoked N100 reduction in healthy subjects far
exceeded the known amplitudes of the Bereitschaftspotential
(readiness potential) even in adult subjects, we do not report
details about the Bereitschaftspotential analysis, as major con-
founding influences on TMS-evoked N100 amplitude suppression
seem impossible. Late CNV amplitudes showed that the ampli-
tudes of premovement potentials are low in the examined
age-range.
EEG registration implies that the electrodes increase the distance
between the TMS coil and the cortex. Thus, higher TMS intensities
are necessary to yield the same effects as without the EEG cap. As
in previous studies, careful coil positioning (the weight of the coil
was carried by a tripod stand and an assistant of the experiment
assured the correct and constant position with respect to the sub-
ject’s head) avoided electrode artefacts, especially in the target
electrode C3.
Source analysis indicated no sources in the temporal auditory
cortices. TMS-evoked N100 was strongly lateralized ipsilateral to
the side of stimulation. A trigeminal response to scalp sensation
A combined TMS-EEG approach in ADHD Brain 2012: 135; 2215–2230 | 2227
at University of B
righton on July 15, 2014http://brain.oxfordjournals.org/
Dow
nloaded from
can be ruled out, as it would show a contra- or bilateral topog-
raphy (Paus et al., 2001; Nikulin et al., 2003).
LimitationsOur results need to be replicated in larger samples of children and
adolescents with ADHD. Further, this study was cross-sectional
and any conclusions with respect to maturation need to be
proven in prospective longitudinal studies.
ConclusionTMS-evoked EEG potentials proved to represent a promising new
marker of cortical inhibition in children with ADHD. Reduced cog-
nitive control of the motor system could contribute to diminished
motor cortex inhibition in children with ADHD, and is likely to be
responsible for the observed deficient TMS-evoked N100 ampli-
tude reduction during motor response preparation and motor
execution compared with rest in ADHD. Effects of age on
TMS-evoked N100 were not compatible with a delayed develop-
ment accounting for the reduced TMS-evoked N100 in ADHD,
pointing towards intrinsic inhibition deficits in the motor system
of ADHD.
AcknowledgementsWe highly appreciate the helpful comments of Professor H. C.
Steinhausen during the composition of this manuscript. We
kindly thank S. Walther and Dr. J. J. Simon for implementing
the paradigms and K. Herwig, D. Gmehlin and A. Stiefel for
their assistance during the recordings. Moreover, we gratefully
acknowledge the time and effort which the participating children
and their families devoted to this study.
FundingThis study was supported by the Riese Foundation of the Goethe
University, Frankfurt/Main, Germany.
Supplementary materialSupplementary material is available at Brain online.
ReferencesAntervo A, Hari R, Katila T, Ryhanen T, Seppanen M. Magnetic fields
produced by eye blinking. Electroencephalogr Clin Neurophysiol 1985;
61: 247–53.
Ambrosini PJ, Metz C, Prabucki K, Lee J-C. Videotape reliability of the
third revised edition of the K-SADS. J Am Acad Child Adoles Psychiatry
1989; 28: 723–28.
Bender S, Basseler K, Sebastian I, Resch F, Kammer T, Oelkers-Ax R,
et al. Electroencephalographic response to transcranial magnetic stimu-
lation in children: evidence for giant inhibitory potentials. Ann Neurol
2005a; 58: 58–67.
Bender S, Oelkers-Ax R, Hellwig S, Resch F, Weisbrod M. The topog-
raphy of the scalp-recorded visual N700. Clin Neurophysiol 2008; 119:
587–604.
Bender S, Oelkers-Ax R, Resch F, Weisbrod M. Frontal lobe involvement
in the processing of meaningful auditory stimuli develops during child-
hood and adolescence. Neuroimage 2006; 33: 759–73.
Bender S, Weisbrod M, Bornfleth H, Resch F, Oelkers-Ax R. How do
children prepare to react? Imaging maturation of motor preparation
and stimulus anticipation by late contingent negative variation.
Neuroimage 2005b; 27: 737–52.Bianchi MS, Lux-Lantos VA, Bettler B, Libertun C. Expression of
gamma-aminobutyric acid B receptor subunits in hypothalamus of
male and female developing rats. Brain Res Dev Brain Res 2005;
160: 124–9.
Biederman J. Attention-deficit/hyperactivity disorder: a selective over-
view. Biol Psychiatry 2005; 57: 1215–20.Biederman J, Mick E, Faraone SV. Age-dependent decline of symptoms
of attention deficit hyperactivity disorder: impact of remission defin-
ition and symptom type. Am J Psychiatry 2000; 157: 816–8.
Bikmullina R, Kicic D, Carlson S, Nikulin VV. Electrophysiological correl-
ates of short-latency afferent inhibition: a combined EEG and TMS
study. Exp Brain Res 2009; 194: 517–26.
Bocker KB, Brunia CH, Cluitmans PJ. A spatio-temporal dipole model of
the readiness potential in humans. I. Finger movement.
Electroencephalogr Clin Neurophysiol 1994; 91: 275–85.
Bonato C, Miniussi C, Rossini PM. Transcranial magnetic stimulation and
cortical evoked potentials: a TMS/EEG co-registration study. Clin
Neurophysiol 2006; 117: 1699–707.
Bonnard M, Spieser L, Meziane HB, De Graaf JB, Pailhous J. Prior inten-
tion can locally tune inhibitory processes in the primary motor cortex:
direct evidence from combined TMS-EEG. Eur J Neurosci 2009; 30:
913–23.
Buchmann J, Gierow W, Weber S, Hoeppner J, Klauer T, Benecke R,
et al. Restoration of disturbed intracortical motor inhibition and facili-
tation in attention deficit hyperactivity disorder children by methyl-
phenidate. Biol Psychiatry 2007; 62: 963–9.
Cott J, Carlsson A, Engel J, Lindqvist M. Suppression of ethanol-induced
locomotor stimulation by GABA-like drugs. Naunyn Schmiedebergs
Arch Pharmacol 1976; 295: 203–9.
Daskalakis ZJ, Farzan F, Barr MS, Maller JJ, Chen R, Fitzgerald PB.
Long-interval cortical inhibition from the dorsolateral prefrontal
cortex: a TMS-EEG study. Neuropsychopharmacology 2008; 33:
2860–9.
De Gennaro L, Cristiani R, Bertini M, Curcio G, Ferrara M, Fratello F,
et al. Handedness is mainly associated with an asymmetry of corti-
cospinal excitability and not of transcallosal inhibition. Clin
Neurophysiol 2004; 115: 1305–12.
Denckla MB, Rudel RG. Anomalies of motor development in hyperactive
boys. Ann Neurol 1978; 3: 231–3.
Di Lazzaro V, Oliviero A, Profice P, Saturno E, Pilato F, Insola A, et al.
Comparison of descending volleys evoked by transcranial magnetic
and electric stimulation in conscious humans. Electroencephalogr Clin
Neurophysiol 1998; 109: 397–401.Di Lazzaro V, Oliviero A, Saturno E, Pilato F, Insola A, Mazzone P, et al.
The effect on corticospinal volleys of reversing the direction of current
induced in the motor cortex by transcranial magnetic stimulation. Exp
Brain Res 2001; 138: 268–73.
Dopfner M, Lehmkuhl G. Diagnostik-System fur psychische Storungen
im Kindes- und Jugendalter nach ICD-10 und DSM-IV : DISYPS-KJ;
klinische Diagnostik, Elternurteil, Erzieher- und Lehrerurteil, Selbsturteil;
Manual. 2., korr. und erg. Aufl. ed. Bern; Gottingen [u.a.]: Huber; 2000.
Duncan CE, Webster MJ, Rothmond DA, Bahn S, Elashoff M, Shannon
Weickert C. Prefrontal GABA(A) receptor alpha-subunit expression in
normal postnatal human development and schizophrenia. J Psychiatr
Res 2010; 44: 673–81.Erhart M, Dopfner M, Ravens-Sieberer U. Psychometric properties of
two ADHD questionnaires: comparing the Conners’ scale and the
FBB-HKS in the general population of German children and
2228 | Brain 2012: 135; 2215–2230 S. Bruckmann et al.
at University of B
righton on July 15, 2014http://brain.oxfordjournals.org/
Dow
nloaded from
adolescents – results of the BELLA study. Eur Child Adolesc Psychiatry
2008; 17 (Suppl 1): 106–15.
Galanopoulou AS. GABA(A) receptors in normal development and seiz-
ures: friends or foes? Curr Neuropharmacol 2008; 6: 1–20.
Garvey MA, Gilbert DL. Transcranial magnetic stimulation in children. Eur
J Paediatr Neurol 2004; 8: 7–19.
Garvey MA, Ziemann U, Bartko JJ, Denckla MB, Barker CA,
Wassermann EM. Cortical correlates of neuromotor development in
healthy children. Clin Neurophysiol 2003; 114: 1662–70.
Geneva IE, Krasteva MB, Kostianev SS. Age-related changes of the som-
atosensory evoked potentials in healthy children. Folia Med (Plovdiv)
2002; 44: 13–8.Gilbert DL. Motor cortex inhibitory function in Tourette syndrome, at-
tention deficit disorder, and obsessive compulsive disorder: studies
using transcranial magnetic stimulation. Adv Neurol 2006; 99: 107–14.
Gilbert DL, Garvey MA, Bansal AS, Lipps T, Zhang J, Wassermann EM.
Should transcranial magnetic stimulation research in children be con-
sidered minimal risk? Clin Neurophysiol 2004; 115: 1730–9.
Gilbert DL, Sallee FR, Zhang J, Lipps TD, Wassermann EM. Transcranial
magnetic stimulation-evoked cortical inhibition: a consistent marker of
attention-deficit/hyperactivity disorder scores in tourette syndrome.
Biol Psychiatry 2005; 57: 1597–600.
Gratton G, Coles MG, Donchin E. A new method for off-line removal of
ocular artifact. Electroencephalogr Clin Neurophysiol 1983; 55:
468–84.
Hoeppner J, Neumeyer M, Wandschneider R, Herpertz SC, Gierow W,
Haessler F, et al. Intracortical motor inhibition and facilitation in adults
with attention deficit/hyperactivity disorder. J Neural Transm 2008;
115: 1701–7.
Ilmoniemi RJ, Kicic D. Methodology for combined TMS and EEG. Brain
Topogr 2010; 22: 233–48.
Johnstone SJ, Barry RJ, Anderson JW, Coyle SF. Age-related changes in
child and adolescent event-related potential component morphology,
amplitude and latency to standard and target stimuli in an auditory
oddball task. Int J Psychophysiol 1996; 24: 223–38.
Kahkonen S, Wilenius J. Effects of alcohol on TMS-evoked N100 re-
sponses. J Neurosci Methods 2007; 166: 104–8.
Kicic D, Lioumis P, Ilmoniemi RJ, Nikulin VV. Bilateral changes in excit-
ability of sensorimotor cortices during unilateral movement: combined
electroencephalographic and transcranial magnetic stimulation study.
Neuroscience 2008; 152: 1119–29.
Kiers L, Cros D, Chiappa KH, Fang J. Variability of motor potentials
evoked by transcranial magnetic stimulation. Electroencephalogr Clin
Neurophysiol 1993; 89: 415–23.
Kinsbourne M. Minimal brain dysfunction as a neurodevelopmental lag.
Ann N Y Acad Sci 1973; 205: 268–73.
Klein C, Wendling K, Huettner P, Ruder H, Peper M. Intra-subject vari-
ability in attention-deficit hyperactivity disorder. Biol Psychiatry 2006;
60: 1088–97.Komssi S, Kahkonen S. The novelty value of the combined use of elec-
troencephalography and transcranial magnetic stimulation for neuro-
science research. Brain Res Rev 2006; 52: 183–92.
Komssi S, Kahkonen S, Ilmoniemi RJ. The effect of stimulus intensity on
brain responses evoked by transcranial magnetic stimulation. Hum
Brain Mapp 2004; 21: 154–64.
Kooij JJ, Buitelaar JK, van den Oord EJ, Furer JW, Rijnders CA,
Hodiamont PP. Internal and external validity of attention-deficit hyper-
activity disorder in a population-based sample of adults. Psychol Med
2005; 35: 817–27.
Lins OG, Picton TW, Berg P, Scherg M. Ocular artifacts in recording
EEGs and event-related potentials. II: source dipoles and source com-
ponents. Brain Topogr 1993; 6: 65–78.
Linssen AM, Vuurman EF, Sambeth A, Nave S, Spooren W, Vargas G,
et al. Contingent negative variation as a dopaminergic bio-
marker: evidence from dose-related effects of methylphenidate.
Psychopharmacology (Berl) 2011; 218: 533–42.
Lioumis P, Kicic D, Savolainen P, Makela JP, Kahkonen S. Reproducibility
of TMS-Evoked EEG responses. Hum Brain Mapp 2009; 30: 1387–96.
Litvak V, Komssi S, Scherg M, Hoechstetter K, Classen J, Zaaroor M,
et al. Artifact correction and source analysis of early electroencephalo-
graphic responses evoked by transcranial magnetic stimulation over
primary motor cortex. Neuroimage 2007; 37: 56–70.
Macneil LK, Xavier P, Garvey MA, Gilbert DL, Ranta ME, Denckla MB,
et al. Quantifying excessive mirror overflow in children with
attention-deficit/hyperactivity disorder. Neurology 2011; 76: 622–8.Malitschek B, Ruegg D, Heid J, Kaupmann K, Bittiger H, Frostl W, et al.
Developmental changes of agonist affinity at GABABR1 receptor vari-
ants in rat brain. Mol Cell Neurosci 1998; 12: 56–64.Mall V, Berweck S, Fietzek UM, Glocker FX, Oberhuber U, Walther M,
et al. Low level of intracortical inhibition in children shown by tran-
scranial magnetic stimulation. Neuropediatrics 2004; 35: 120–5.
Matsuo F, Peters JF, Reilly EL. Electrical phenomena associated with
movements of the eyelid. Electroencephalogr Clin Neurophysiol
1975; 38: 507–511.
Moll GH, Heinrich H, Rothenberger A. Transcranial magnetic stimulation
in child and adolescent psychiatry: excitability of the motor system in
tic disorders and/or attention deficit hyperactivity disorders. Z Kinder
Jugendpsychiatr Psychother 2001a; 29: 312–23.Moll GH, Heinrich H, Trott GE, Wirth S, Bock N, Rothenberger A.
Children with comorbid attention-deficit-hyperactivity disorder and
tic disorder: evidence for additive inhibitory deficits within the motor
system. Ann Neurol 2001b; 49: 393–6.
Moll GH, Heinrich H, Trott G, Wirth S, Rothenberger A. Deficient intra-
cortical inhibition in drug-naive children with attention-deficit hyper-
activity disorder is enhanced by methylphenidate. Neurosci Lett 2000;
284: 121–5.
Moll GH, Heinrich H, Wischer S, Tergau F, Paulus W, Rothenberger A.
Motor system excitability in healthy children: developmental aspects
from transcranial magnetic stimulation. Electroencephalogr Clin
Neurophysiol Suppl 1999; 51: 243–9.Mostofsky SH, Newschaffer CJ, Denckla MB. Overflow movements pre-
dict impaired response inhibition in children with ADHD. Percept Mot
Skills 2003; 97: 1315–31.
Nezu A, Kimura S, Uehara S, Kobayashi T, Tanaka M, Saito K. Magnetic
stimulation of motor cortex in children: maturity of corticospinal path-
way and problem of clinical application. Brain Dev 1997; 19: 176–80.
Nikulin VV, Kicic D, Kahkonen S, Ilmoniemi RJ. Modulation of electro-
encephalographic responses to transcranial magnetic stimulation:
evidence for changes in cortical excitability related to movement. Eur
J Neurosci 2003; 18: 1206–12.Oldfield RC. The assessment and analysis of handedness: the Edinburgh
inventory. Neuropsychologia 1971; 9: 97–113.
Onofrj M, Thomas A, Iacono D, D’Andreamatteo G, Paci C. Age-related
changes of evoked potentials. Neurophysiol Clin 2001; 31: 83–103.
Ostling EW, Fillmore MT. Tolerance to the impairing effects of alcohol
on the inhibition and activation of behavior. Psychopharmacology
(Berl) 2010; 212: 465–73.Paus T, Sipila PK, Strafella AP. Synchronization of neuronal activity in the
human primary motor cortex by transcranial magnetic stimulation: an
EEG study. J Neurophysiol 2001; 86: 1983–90.
Picton T, Lins O, Scherg M. The recording and analysis of event-related
potentials. In: Boller F, Grafman J, editors. Handbook of neurophysi-
ology. New York: Elsevier Science; 1995.
Picton TW, van Roon P, Armilio ML, Berg P, Ille N, Scherg M. The
correction of ocular artifacts: a topographic perspective. Clin
Neurophysiol 2000; 111: 53–65.
Rockstroh B, editor. Slow cortical potentials and behaviour. 2. completely
rev. edn. Baltimore: Urban and Schwarzenberg; 1989.
Rossini PM, Barker AT, Berardelli A, Caramia MD, Caruso G, Cracco RQ,
et al. Non-invasive electrical and magnetic stimulation of the brain,
spinal cord and roots: basic principles and procedures for routine clin-
ical application. Report of an IFCN committee. Electroencephalogr Clin
Neurophysiol 1994; 91: 79–92.Rubia K, Overmeyer S, Taylor E, Brammer M, Williams SC, Simmons A,
et al. Functional frontalisation with age: mapping neurodevelopmental
trajectories with fMRI. Neurosci Biobehav Rev 2000; 24: 13–9.
A combined TMS-EEG approach in ADHD Brain 2012: 135; 2215–2230 | 2229
at University of B
righton on July 15, 2014http://brain.oxfordjournals.org/
Dow
nloaded from
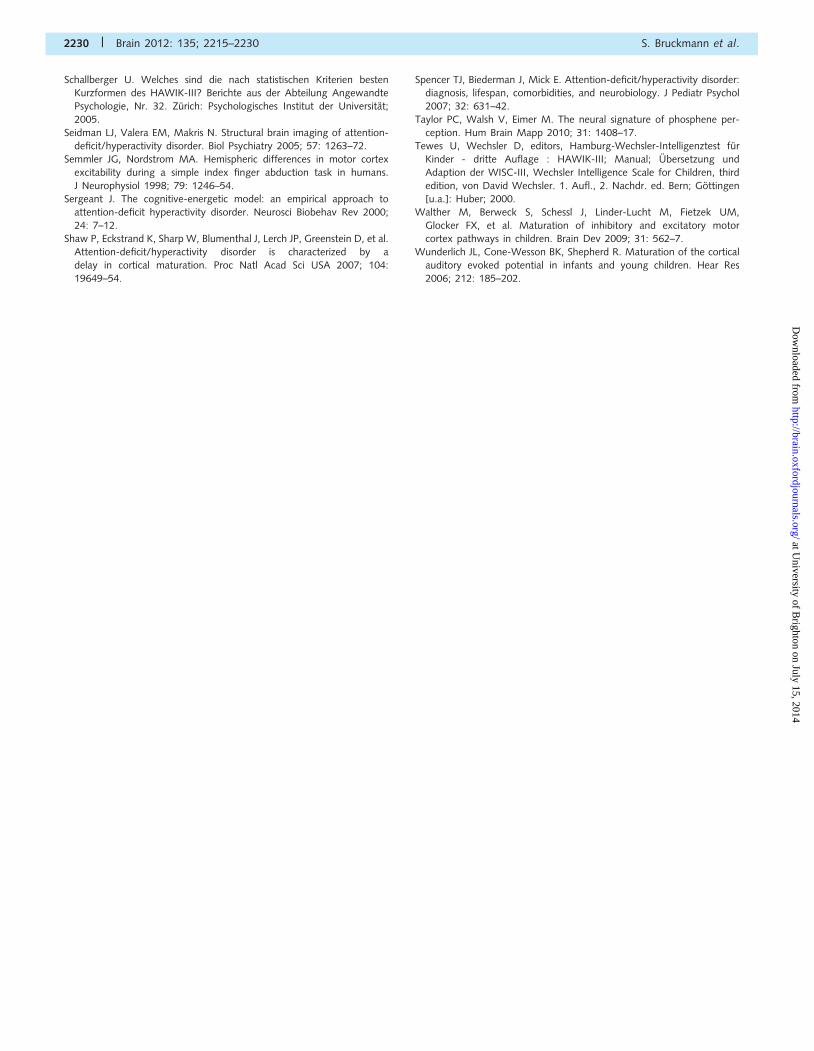
Schallberger U. Welches sind die nach statistischen Kriterien bestenKurzformen des HAWIK-III? Berichte aus der Abteilung Angewandte
Psychologie, Nr. 32. Zurich: Psychologisches Institut der Universitat;
2005.
Seidman LJ, Valera EM, Makris N. Structural brain imaging of attention-deficit/hyperactivity disorder. Biol Psychiatry 2005; 57: 1263–72.
Semmler JG, Nordstrom MA. Hemispheric differences in motor cortex
excitability during a simple index finger abduction task in humans.
J Neurophysiol 1998; 79: 1246–54.Sergeant J. The cognitive-energetic model: an empirical approach to
attention-deficit hyperactivity disorder. Neurosci Biobehav Rev 2000;
24: 7–12.Shaw P, Eckstrand K, Sharp W, Blumenthal J, Lerch JP, Greenstein D, et al.
Attention-deficit/hyperactivity disorder is characterized by a
delay in cortical maturation. Proc Natl Acad Sci USA 2007; 104:
19649–54.
Spencer TJ, Biederman J, Mick E. Attention-deficit/hyperactivity disorder:diagnosis, lifespan, comorbidities, and neurobiology. J Pediatr Psychol
2007; 32: 631–42.
Taylor PC, Walsh V, Eimer M. The neural signature of phosphene per-
ception. Hum Brain Mapp 2010; 31: 1408–17.Tewes U, Wechsler D, editors, Hamburg-Wechsler-Intelligenztest fur
Kinder - dritte Auflage : HAWIK-III; Manual; Ubersetzung und
Adaption der WISC-III, Wechsler Intelligence Scale for Children, third
edition, von David Wechsler. 1. Aufl., 2. Nachdr. ed. Bern; Gottingen[u.a.]: Huber; 2000.
Walther M, Berweck S, Schessl J, Linder-Lucht M, Fietzek UM,
Glocker FX, et al. Maturation of inhibitory and excitatory motorcortex pathways in children. Brain Dev 2009; 31: 562–7.
Wunderlich JL, Cone-Wesson BK, Shepherd R. Maturation of the cortical
auditory evoked potential in infants and young children. Hear Res
2006; 212: 185–202.
2230 | Brain 2012: 135; 2215–2230 S. Bruckmann et al.
at University of B
righton on July 15, 2014http://brain.oxfordjournals.org/
Dow
nloaded from