corruption and economic activity: micro level evidence from rural liberia
TRANSCRIPT

European Journal of Political Economy 30 (2013) 70–79
Contents lists available at SciVerse ScienceDirect
European Journal of Political Economy
j ourna l homepage: www.e lsev ie r .com/ locate /e jpe
Corruption and economic activity: Micro level evidence fromrural Liberia
Gonne Beekman a, Erwin H. Bulte a,b,⁎, Eleonora E.M. Nillesen a
a Development Economics Group, Wageningen University, P.O. Box 8130, 6700 EW Wageningen, Netherlandsb Njala University, Sierra Leone
a r t i c l e i n f o
⁎ Corresponding author. Tel.: +31 317 485286; faxE-mail address: [email protected] (E.H. Bulte).
1 See, for example, Shleifer and Vishny (1994), andgreater corruptibility may increase investments in pprovision by multi-national enterprises (Barassi and Z
0176-2680/$ – see front matter © 2013 Elsevier B.V. Ahttp://dx.doi.org/10.1016/j.ejpoleco.2013.01.005
a b s t r a c t
Article history:Received 18 April 2012Received in revised form 22 January 2013Accepted 25 January 2013Available online 9 February 2013
We study how corruption affects economic activities of households in rural Liberia. A proxy ofcorruption of community leaders is obtained by directly monitoring the diversion of inputsassociated with a development project. We measure quantities of these inputs twice; beforeand after the chief stored them, and interpret any ‘gaps’ between these measurements asindicative of diversion by the chief (or corruption). We use this ‘gap’ proxy to explain variationin economic behaviour across respondents, and find that corrupt community leaders causereduced levels of income generating activities that are economically important: corruptionleads to a 50% reduction in rice planted and to nearly equally large reductions in trade activity.
© 2013 Elsevier B.V. All rights reserved.
JEL classification:K42O12O17
Keywords:CorruptionDevelopment projectAgricultureInvestmentTrade
1. Introduction
An extensive and rapidly growing literature examines the multi-faceted relation between corruption and economicperformance. This literature has gradually shifted from analyses based on aggregate data and perception indices (e.g., Tavares,2003) to micro-based research, occasionally including experimental methods (see Serra and Wantchekon, 2012 for a recentoverview). Part of the literature considers the determinants of corruption, and probes the scope for limiting the incidence ofcorruption via various policy measures. The other part focuses on the complementary question: how does corruption affecteconomic performance? This literature increasingly reaches the conclusion that corruption is bad for growth and development.For example, while early literature on the effects of corruption produced rather mixed evidence (e.g. Mauro, 1995) andoccasionally argued that corruption may ‘grease the wheels’ of a rigid bureaucracy,1 most recent papers are rather more criticalabout the consequences of corruption. Aidt (2003) warns that the notion that efficient corruption may offset government failuresis based on ‘second-best reasoning.’ He argues corruption often creates government failure, rather than repairing it (see alsoRowley, 2000 on the difference between rent seeking and rent extraction). Aidt (2009) finds a strong negative correlationbetween growth of per capita wealth and corruption, and concludes that “corruption is much more likely to sand than to grease
: +31 317 484037.
the discussion about ‘efficient corruption’ and side payments in Aidt (2003). In line with such reasoning,ollution abatement technology (Fredriksson and Wollscheid, 2008), and offer a ‘helping hand’ for FDIhou, 2012; Egger and Winner, 2005).
ll rights reserved.

71G. Beekman et al. / European Journal of Political Economy 30 (2013) 70–79
the wheels” (p. 276). Similarly, a recent review by Olken and Pande (2012) concludes that corruption is widespread andpervasive, and induces efficiency costs. According to an estimate by the World Bank Institute (cited in Sequeira, 2012, p. 145),some 25% of African states' GDP is lost to corruption each year. Hence, the costs of rent extraction (‘grabbing’) due to corruptionwill in most circumstances outweigh the benefits of rent sharing (‘greasing’).
Corruption can undermine growth and development via various channels. Macro studies suggest that it tends to hamperinternational trade (De Jong and Bogmans, 2011) and impede country-level FDI inflow (Busse and Hefeker, 2007). In addition,corruptionmayhave adverse distributional consequences (Olken, 2006), and could have long-term consequences (e.g., by underminingthe supply of education and health care services, see, for example, Reinikka and Svensson, 2004). Amicro-oriented literature considersthe direct consequences of corruption for firms, exploring consequences for investment choices (e.g., Egger and Winner, 2006; Wei,2000). If corruption acts as a tax, or leads to uncertainty and high transaction costs (Fisman and Svensson, 2007), it drives a wedgebetween actual and privately appropriable levels of output— discouraging private levels of input supply (see also Campos et al., 1999).In addition to such under-investment, corruption may invite evasive yet costly behaviour (Sequeira and Djankov, 2010) and affect thedirection of investments. In a setting where corruption pressure is endogenous, firms may rationally invest in inefficient but malleable‘fly-by-night’ technologies to improve their bargaining position vis-à-vis corrupt bureaucrats (Svensson, 2003).
The objective of this paper is to contribute to the debate on the economic consequences of corruption by analysing howcorruption affects economic choices for a sample of smallholder farmers in rural Liberia. We analyse the causal effect of localcorruption on certain economic activities that are at the heart of Liberian policies to reduce poverty and achieve food security(e.g., Hilson and van Bockstael, 2012). While strengthening governance, at various levels including the local one, is widelyperceived as a precondition for agrarian development (World Bank, 2007), we are not aware of empirical research analysing theconsequences of corruption on production decisions of smallholder farmers in Africa. Bates (1981) argued African farmers mayopt for subsistence farming to avoid corruption in input and output markets, but this hypothesis remains to be rigorously testedusing micro data. Such testing is important as it could, for example, inform NGOs and multilateral agencies about whether or notthe quality of local governance should play a role in the design of agricultural development strategies. The urgency of thesequestions is now more pressing than ever. The majority of the world's poor continue to live in rural areas and their livelihoodstend to be intimately linked to agriculture. Moreover, agricultural development – intensification and commercialisation offarming – is prominently back on the international development agenda as a strategy to pursue sustainable and pro-poordevelopment (World Bank, 2007; Christiaensen et al., 2011).
We use an objective, rather than subjective, approach to gauge corruption. Building on a small number of recent papers weobtain two measurements of a flow of agricultural inputs allocated to the community — before and after these inputs have beengiven in custody to the local chief. We employ the ‘gap,’ if any, between these measurements as the basis for several corruptionproxies, and then seek to explain key economic variables by these corruption variables. Our main finding is that corruptionundermines productive private investments and the propensity to engage in trade. This, in turn, could sustain poverty.
This paper is organized as follows. In Section 2 we briefly summarize some key recent micro studies on corruption. Section 3sketches the context of our research, focusing on governance issues in Liberia. In Section 4 we outline our data and identificationstrategy, and Section 5 contains our results. Finally, Section 6 concludes.
2. Micro-based corruption studies: minding the gap
This paper seeks to contribute to the relatively small set of corruption studies based on micro data. While aggregatecross-country studies tend to be based on perception-based corruption measures, a strong point of much of the micro work isobjective measurement of the incidence and extent of corruption. Sequeira (2012) provides an extensive discussion of recentadvances in measuring corruption in the field.2 In addition to efforts to directly observe corruption and bribing in the field (e.g.Bertrand et al., 2007; Olken and Barron, 2009), corruption may be measured via a ‘forensic economic’ approach based on acomparison of official data and the equilibrium predictions of theoretical models (e.g., Fisman, 2001). However, the most commonapproach to measuring corruption in the field is by ‘minding gaps in the data,’ suggesting corrupt behaviour. Such gaps might beidentified in case of mismatches between different data sources; mismatches between administrative data and results from anindependent household study; or simply because two primary sources of data do not add up (as in our measurement strategy,outlined below).
An early and influential paper based on gaps in the data is Reinikka and Svensson (2004). They analysed diversion of nationalgrant money allocated to primary schools. On average, approximately 80 cents from every dollar disbursed by the nationalgovernment was diverted. Money thus stolen was perhaps used by local level officials to strengthen their patronage network orfinance political activities. In a follow-up paper, the authors investigate the impact of a possible solution: a newspaper campaignpublishing data on monthly transfers (when and howmuch) to the various districts, facilitating monitoring at the grassroots level(Reinikka and Svensson, 2011). In this context, such newspaper campaigns are cost-effective in reducing capture of public funds.
Another well-known study based on an analysis of gaps in the data is Olken (2007), who investigates corruption of a nationalroad-construction project in Indonesia, using ‘missing expenditures’ as a measure of corruption. Missing expenditures are definedas the difference between reported and actual costs of constructing the road (as estimated by a team of engineers). ‘Missingexpenditures’, thus defined, account for about 24% of the total costs of road construction. Moreover, upon combining the gap
2 See also Olken and Pande (2012) for a review of other approaches measuring corruption.

72 G. Beekman et al. / European Journal of Political Economy 30 (2013) 70–79
analysis with random assignment of communities into various anti-corruption interventions, Olken found that external audits aremore effective in reducing corruption than grass-root monitoring. In another paper, examining the workings of a subsidized ricetransfer program in Indonesia, Olken (2006) identifies gaps based on a comparison of official records and household survey data.A considerable share of the rice (18%) could not be accounted for, suggesting the presence of corruption.
Niehaus and Sukhtankar (2012) use a similar approach to study corruption in India. They compare official figures from theNational Rural Employment Guarantee programme (days worked and wages paid) to survey responses obtained from allegedbeneficiaries. By measuring corruption as the gap between reported and actual payments, they observed that an exogenous policychange in program wages makes agents cautious about future extractable rents, resulting in a dampening effect on corruption.
3. Governance in Liberia
Liberia is located on the west-African coast, sharing borders with Ivory Coast, Guinea, and Sierra Leone. The country isrecovering from a 14-year civil war that ended in 2003, which affected the lives of the great majority of its inhabitants. Manypeople lost their lives or family members, were recruited for rebel armies, or were displaced— either in Liberia or in neighbouringcountries.3 During the war, human capital was destroyed and official institutions were largely non-existent.
Liberia faces many challenges in the governance domain. Founded as a home for former African-American slaves, Liberia hasmany characteristics of a traditional settler state. A model of indirect rule was introduced, in which the settler state appoints itsnominees for chiefs from among the ranks of leading families. This system, co-opting leading members of indigenouscommunities as ‘traditional’ authorities, in effect consolidates a ranked lineage system with a small elite and large underclass.Richards (2010) provides an extensive discussion of the political economy in modern Liberia and points at “unresolved tensionsbetween indigenous communities and the settler state, political competition to control an over-centralised executive, […] anunregulated scramble for rich natural resources, and a series of gender-based and age-based tensions reflecting a failure to fullyemancipate former slave-based hinterland communities” (p. 19).
Liberian society is hierarchical, and evidence suggests that chiefs (mis)use their power for private gain (Richards and Bah,2005; Reno, 2008). These chiefs are nominated by elders, then ‘elected’ by community members, and finally approved by thegovernment. Not everybody is sufficiently ‘civilized’ to qualify as a potential chief in the class-based society of northwest Liberia(indeed: not everybody is sufficiently civilized to cast his or her vote). Chiefs come from an upper, land-owning stratum ofsociety, and chiefdom tends to be a means through which state intentions are implemented at the local level (Richards et al.,2005). Richards (2010) concludes that an autonomous chief is likely to be replaced, suggesting limited scope for the preferencesof the local populace to have the chief they want. In other words, and important for our identification strategy below, the identityof the chief is to a large extent exogenous to economic behaviour of the community members.
In light of these issues, it is no surprise that the great majority of Liberian citizens remain desperately poor. In 2011, Liberiaranked among the most impoverished countries in the world (182/187 on the Human Development Index) (UNDP, 2011). Overhalf of the Liberian population lives in rural areas (UN, 2011) and agriculture is by and large the dominant sector in Liberia,accounting for more than 70% of the country's GDP (World Bank, 2012). Farmers mainly produce for subsistence, as reflected inthe dominant crops: cassava, (paddy) rice and sugar cane. ‘Making a market’ (petty trade) is considered an important source of(extra) household income. With peace being maintained by UNMIL since 2003, the country has seen a revival of petty-trade inLiberia (Richards et al., 2005).
4. Data and identification
In this study, we explore how corruption affects two economically important activities in Liberia: rice production and pettytrade. We selected rice for its special status in Liberia: it is the key staple food – a meal without rice is not considered a true meal –and it is commonly used as payment to labourers in the diamond mines (Hilson and van Bockstael, 2012) and to feedkuu-labourers (rotational agricultural labour schemes).
4.1. Sample selection
We randomly selected 44 communities, part of an agricultural development project by an international NGO. All communitiesare located within a day drive of the capital Monrovia, but road conditions are poor. Of these communities, 22 are connected by amain road, and 22 communities have access to clean water. None of them have electricity. The most important sources ofhousehold income are subsistence agriculture, petty trade and off-farm labour (rubber tapping, coal burning and preparing localgin from sugar cane). Communities are typically very small — 45 households on average. Household surveys were carried out inOctober–December 2010, among a random selected subsample of 16–20 households in each community. We also conducted acommunity survey among community leaders. We tracked the diversion of inputs in February 2011 (see below). Survey data,
3 Official numbers do not exists, but records vary between one third and three quarters of the population. In the last year of the civil war alone, a total of500,000 internally displaced people (IDPs) were counted (Birkeland et al., 2012) — nearly 20% of the total population.
73G. Beekman et al. / European Journal of Political Economy 30 (2013) 70–79
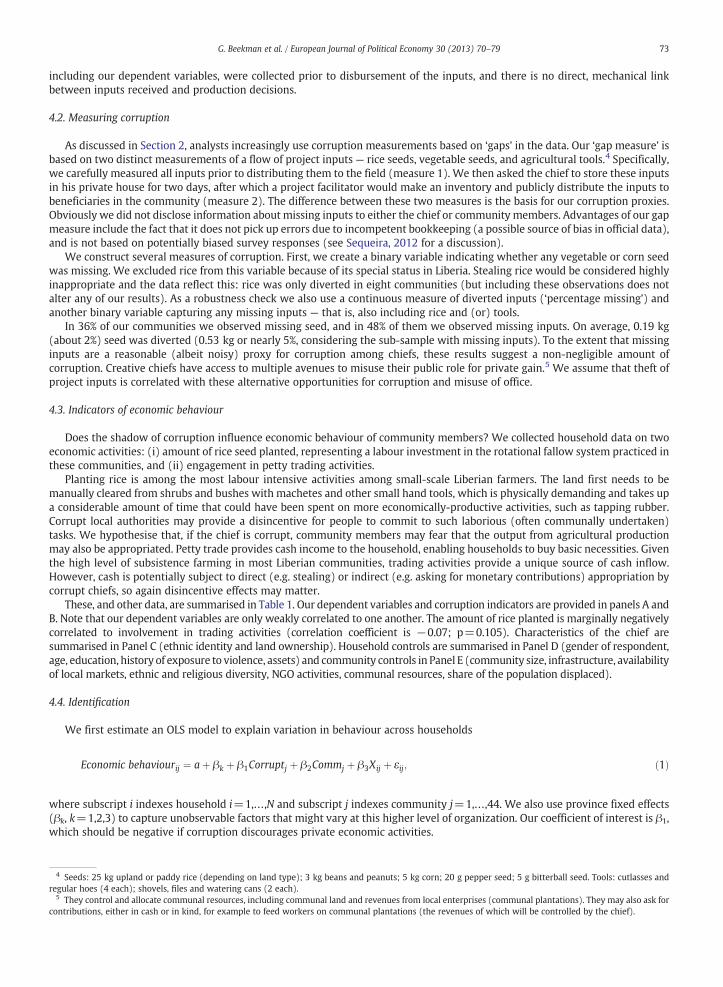
including our dependent variables, were collected prior to disbursement of the inputs, and there is no direct, mechanical linkbetween inputs received and production decisions.
4.2. Measuring corruption
As discussed in Section 2, analysts increasingly use corruption measurements based on ‘gaps’ in the data. Our ‘gap measure’ isbased on two distinct measurements of a flow of project inputs — rice seeds, vegetable seeds, and agricultural tools.4 Specifically,we carefully measured all inputs prior to distributing them to the field (measure 1). We then asked the chief to store these inputsin his private house for two days, after which a project facilitator would make an inventory and publicly distribute the inputs tobeneficiaries in the community (measure 2). The difference between these two measures is the basis for our corruption proxies.Obviously we did not disclose information about missing inputs to either the chief or community members. Advantages of our gapmeasure include the fact that it does not pick up errors due to incompetent bookkeeping (a possible source of bias in official data),and is not based on potentially biased survey responses (see Sequeira, 2012 for a discussion).
We construct several measures of corruption. First, we create a binary variable indicating whether any vegetable or corn seedwas missing. We excluded rice from this variable because of its special status in Liberia. Stealing rice would be considered highlyinappropriate and the data reflect this: rice was only diverted in eight communities (but including these observations does notalter any of our results). As a robustness check we also use a continuous measure of diverted inputs (‘percentage missing’) andanother binary variable capturing any missing inputs — that is, also including rice and (or) tools.
In 36% of our communities we observed missing seed, and in 48% of them we observed missing inputs. On average, 0.19 kg(about 2%) seed was diverted (0.53 kg or nearly 5%, considering the sub-sample with missing inputs). To the extent that missinginputs are a reasonable (albeit noisy) proxy for corruption among chiefs, these results suggest a non-negligible amount ofcorruption. Creative chiefs have access to multiple avenues to misuse their public role for private gain.5 We assume that theft ofproject inputs is correlated with these alternative opportunities for corruption and misuse of office.
4.3. Indicators of economic behaviour
Does the shadow of corruption influence economic behaviour of community members? We collected household data on twoeconomic activities: (i) amount of rice seed planted, representing a labour investment in the rotational fallow system practiced inthese communities, and (ii) engagement in petty trading activities.
Planting rice is among the most labour intensive activities among small-scale Liberian farmers. The land first needs to bemanually cleared from shrubs and bushes with machetes and other small hand tools, which is physically demanding and takes upa considerable amount of time that could have been spent on more economically-productive activities, such as tapping rubber.Corrupt local authorities may provide a disincentive for people to commit to such laborious (often communally undertaken)tasks. We hypothesise that, if the chief is corrupt, community members may fear that the output from agricultural productionmay also be appropriated. Petty trade provides cash income to the household, enabling households to buy basic necessities. Giventhe high level of subsistence farming in most Liberian communities, trading activities provide a unique source of cash inflow.However, cash is potentially subject to direct (e.g. stealing) or indirect (e.g. asking for monetary contributions) appropriation bycorrupt chiefs, so again disincentive effects may matter.
These, and other data, are summarised in Table 1. Our dependent variables and corruption indicators are provided in panels A andB. Note that our dependent variables are only weakly correlated to one another. The amount of rice planted is marginally negativelycorrelated to involvement in trading activities (correlation coefficient is −0.07; p=0.105). Characteristics of the chief aresummarised in Panel C (ethnic identity and land ownership). Household controls are summarised in Panel D (gender of respondent,age, education, history of exposure to violence, assets) and community controls in Panel E (community size, infrastructure, availabilityof local markets, ethnic and religious diversity, NGO activities, communal resources, share of the population displaced).
4.4. Identification
We first estimate an OLS model to explain variation in behaviour across households
4 Seeregular
5 Thecontribu
Economic behaviourij ¼ aþ βk þ β1Corruptj þ β2Commj þ β3Xij þ εij; ð1Þ
subscript i indexes household i=1,…,N and subscript j indexes community j=1,…,44. We also use province fixed effects
where(βk, k=1,2,3) to capture unobservable factors that might vary at this higher level of organization. Our coefficient of interest is β1,which should be negative if corruption discourages private economic activities.ds: 25 kg upland or paddy rice (depending on land type); 3 kg beans and peanuts; 5 kg corn; 20 g pepper seed; 5 g bitterball seed. Tools: cutlasses andhoes (4 each); shovels, files and watering cans (2 each).y control and allocate communal resources, including communal land and revenues from local enterprises (communal plantations). They may also ask fortions, either in cash or in kind, for example to feed workers on communal plantations (the revenues of which will be controlled by the chief).
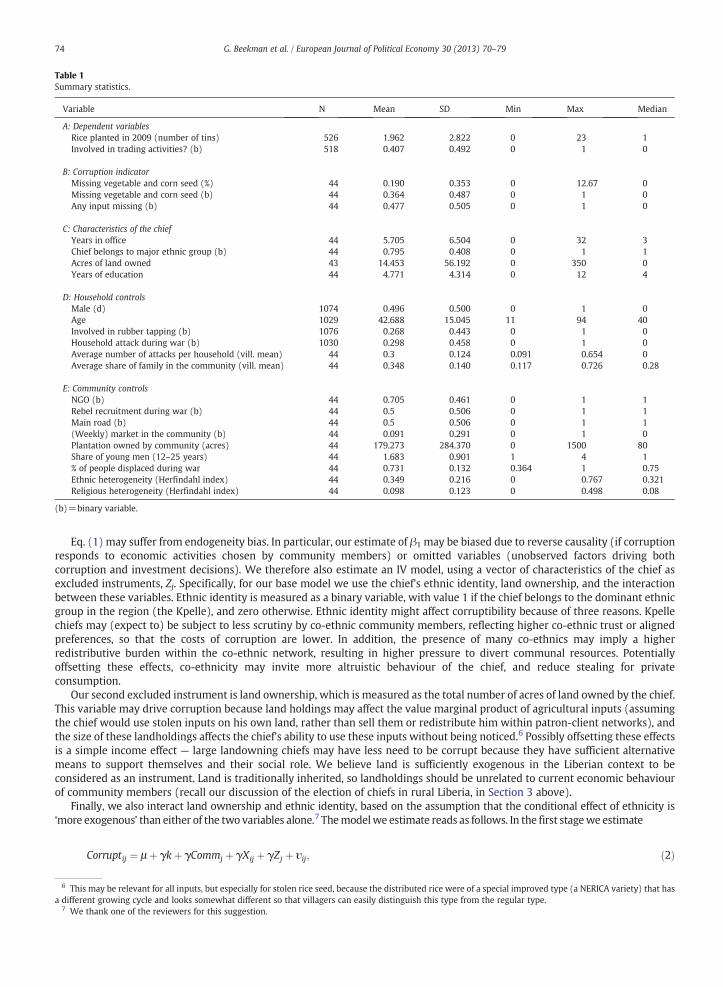
Table 1Summary statistics.
Variable N Mean SD Min Max Median
A: Dependent variablesRice planted in 2009 (number of tins) 526 1.962 2.822 0 23 1Involved in trading activities? (b) 518 0.407 0.492 0 1 0
B: Corruption indicatorMissing vegetable and corn seed (%) 44 0.190 0.353 0 12.67 0Missing vegetable and corn seed (b) 44 0.364 0.487 0 1 0Any input missing (b) 44 0.477 0.505 0 1 0
C: Characteristics of the chiefYears in office 44 5.705 6.504 0 32 3Chief belongs to major ethnic group (b) 44 0.795 0.408 0 1 1Acres of land owned 43 14.453 56.192 0 350 0Years of education 44 4.771 4.314 0 12 4
D: Household controlsMale (d) 1074 0.496 0.500 0 1 0Age 1029 42.688 15.045 11 94 40Involved in rubber tapping (b) 1076 0.268 0.443 0 1 0Household attack during war (b) 1030 0.298 0.458 0 1 0Average number of attacks per household (vill. mean) 44 0.3 0.124 0.091 0.654 0Average share of family in the community (vill. mean) 44 0.348 0.140 0.117 0.726 0.28
E: Community controlsNGO (b) 44 0.705 0.461 0 1 1Rebel recruitment during war (b) 44 0.5 0.506 0 1 1Main road (b) 44 0.5 0.506 0 1 1(Weekly) market in the community (b) 44 0.091 0.291 0 1 0Plantation owned by community (acres) 44 179.273 284.370 0 1500 80Share of young men (12–25 years) 44 1.683 0.901 1 4 1% of people displaced during war 44 0.731 0.132 0.364 1 0.75Ethnic heterogeneity (Herfindahl index) 44 0.349 0.216 0 0.767 0.321Religious heterogeneity (Herfindahl index) 44 0.098 0.123 0 0.498 0.08
(b)=binary variable.
74 G. Beekman et al. / European Journal of Political Economy 30 (2013) 70–79
Eq. (1) may suffer from endogeneity bias. In particular, our estimate of β1 may be biased due to reverse causality (if corruptionresponds to economic activities chosen by community members) or omitted variables (unobserved factors driving bothcorruption and investment decisions). We therefore also estimate an IV model, using a vector of characteristics of the chief asexcluded instruments, Zj. Specifically, for our base model we use the chief's ethnic identity, land ownership, and the interactionbetween these variables. Ethnic identity is measured as a binary variable, with value 1 if the chief belongs to the dominant ethnicgroup in the region (the Kpelle), and zero otherwise. Ethnic identity might affect corruptibility because of three reasons. Kpellechiefs may (expect to) be subject to less scrutiny by co-ethnic community members, reflecting higher co-ethnic trust or alignedpreferences, so that the costs of corruption are lower. In addition, the presence of many co-ethnics may imply a higherredistributive burden within the co-ethnic network, resulting in higher pressure to divert communal resources. Potentiallyoffsetting these effects, co-ethnicity may invite more altruistic behaviour of the chief, and reduce stealing for privateconsumption.
Our second excluded instrument is land ownership, which is measured as the total number of acres of land owned by the chief.This variable may drive corruption because land holdings may affect the value marginal product of agricultural inputs (assumingthe chief would use stolen inputs on his own land, rather than sell them or redistribute him within patron-client networks), andthe size of these landholdings affects the chief's ability to use these inputs without being noticed.6 Possibly offsetting these effectsis a simple income effect — large landowning chiefs may have less need to be corrupt because they have sufficient alternativemeans to support themselves and their social role. We believe land is sufficiently exogenous in the Liberian context to beconsidered as an instrument. Land is traditionally inherited, so landholdings should be unrelated to current economic behaviourof community members (recall our discussion of the election of chiefs in rural Liberia, in Section 3 above).
Finally, we also interact land ownership and ethnic identity, based on the assumption that the conditional effect of ethnicity is‘more exogenous’ than either of the two variables alone.7 Themodelwe estimate reads as follows. In the first stagewe estimate
6 Thisa differ
7 We
Corruptij ¼ μ þ γkþ γCommj þ γXij þ γZj þ υij; ð2Þ
may be relevant for all inputs, but especially for stolen rice seed, because the distributed rice were of a special improved type (a NERICA variety) that hasent growing cycle and looks somewhat different so that villagers can easily distinguish this type from the regular type.thank one of the reviewers for this suggestion.
8 Westatisticrestrictiremoveethnicitdepend
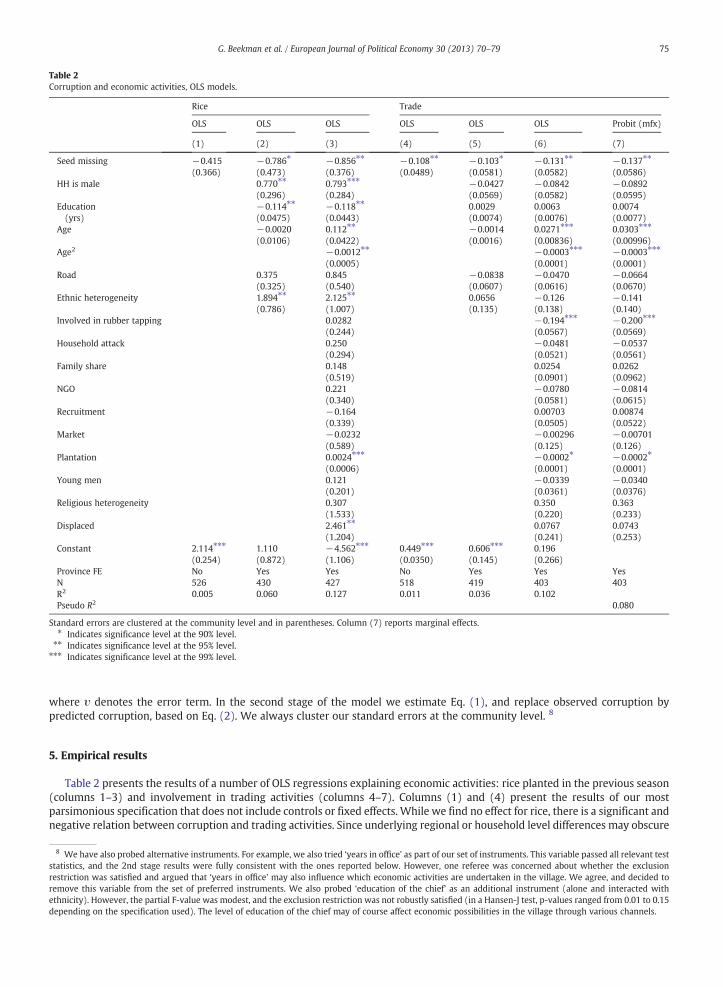
Table 2Corruption and economic activities, OLS models.
Rice Trade
OLS OLS OLS OLS OLS OLS Probit (mfx)
(1) (2) (3) (4) (5) (6) (7)
Seed missing −0.415 −0.786⁎ −0.856⁎⁎ −0.108⁎⁎ −0.103⁎ −0.131⁎⁎ −0.137⁎⁎
(0.366) (0.473) (0.376) (0.0489) (0.0581) (0.0582) (0.0586)HH is male 0.770⁎⁎ 0.793⁎⁎⁎ −0.0427 −0.0842 −0.0892
(0.296) (0.284) (0.0569) (0.0582) (0.0595)Education(yrs)
−0.114⁎⁎ −0.118⁎⁎ 0.0029 0.0063 0.0074(0.0475) (0.0443) (0.0074) (0.0076) (0.0077)
Age −0.0020 0.112⁎⁎ −0.0014 0.0271⁎⁎⁎ 0.0303⁎⁎⁎
(0.0106) (0.0422) (0.0016) (0.00836) (0.00996)Age2 −0.0012⁎⁎ −0.0003⁎⁎⁎ −0.0003⁎⁎⁎
(0.0005) (0.0001) (0.0001)Road 0.375 0.845 −0.0838 −0.0470 −0.0664
(0.325) (0.540) (0.0607) (0.0616) (0.0670)Ethnic heterogeneity 1.894⁎⁎ 2.125⁎⁎ 0.0656 −0.126 −0.141
(0.786) (1.007) (0.135) (0.138) (0.140)Involved in rubber tapping 0.0282 −0.194⁎⁎⁎ −0.200⁎⁎⁎
(0.244) (0.0567) (0.0569)Household attack 0.250 −0.0481 −0.0537
(0.294) (0.0521) (0.0561)Family share 0.148 0.0254 0.0262
(0.519) (0.0901) (0.0962)NGO 0.221 −0.0780 −0.0814
(0.340) (0.0581) (0.0615)Recruitment −0.164 0.00703 0.00874
(0.339) (0.0505) (0.0522)Market −0.0232 −0.00296 −0.00701
(0.589) (0.125) (0.126)Plantation 0.0024⁎⁎⁎ −0.0002⁎ −0.0002⁎
(0.0006) (0.0001) (0.0001)Young men 0.121 −0.0339 −0.0340
(0.201) (0.0361) (0.0376)Religious heterogeneity 0.307 0.350 0.363
(1.533) (0.220) (0.233)Displaced 2.461⁎⁎ 0.0767 0.0743
(1.204) (0.241) (0.253)Constant 2.114⁎⁎⁎ 1.110 −4.562⁎⁎⁎ 0.449⁎⁎⁎ 0.606⁎⁎⁎ 0.196
(0.254) (0.872) (1.106) (0.0350) (0.145) (0.266)Province FE No Yes Yes No Yes Yes YesN 526 430 427 518 419 403 403R2 0.005 0.060 0.127 0.011 0.036 0.102Pseudo R2 0.080
Standard errors are clustered at the community level and in parentheses. Column (7) reports marginal effects.⁎ Indicates significance level at the 90% level.
⁎⁎ Indicates significance level at the 95% level.⁎⁎⁎ Indicates significance level at the 99% level.
75G. Beekman et al. / European Journal of Political Economy 30 (2013) 70–79
υ denotes the error term. In the second stage of the model we estimate Eq. (1), and replace observed corruption by
wherepredicted corruption, based on Eq. (2). We always cluster our standard errors at the community level. 85. Empirical results
Table 2 presents the results of a number of OLS regressions explaining economic activities: rice planted in the previous season(columns 1–3) and involvement in trading activities (columns 4–7). Columns (1) and (4) present the results of our mostparsimonious specification that does not include controls or fixed effects. While we find no effect for rice, there is a significant andnegative relation between corruption and trading activities. Since underlying regional or household level differences may obscure
have also probed alternative instruments. For example, we also tried ‘years in office’ as part of our set of instruments. This variable passed all relevant tests, and the 2nd stage results were fully consistent with the ones reported below. However, one referee was concerned about whether the exclusionon was satisfied and argued that ‘years in office’ may also influence which economic activities are undertaken in the village. We agree, and decided tothis variable from the set of preferred instruments. We also probed ‘education of the chief’ as an additional instrument (alone and interacted withy). However, the partial F-value was modest, and the exclusion restriction was not robustly satisfied (in a Hansen-J test, p-values ranged from 0.01 to 0.15ing on the specification used). The level of education of the chief may of course affect economic possibilities in the village through various channels.

Table 3Corruption and economic activities, IV models.
Panel A: First stage
Dependent (binary) Seed missing
(1) (2) (3) (4)
Land ownership (chief) 0.003⁎⁎⁎ 0.027⁎⁎ 0.003⁎⁎⁎ 0.026⁎
(0.0005) (0.013) (0.0005) (0.013)Ethnicity (chief) 0.216⁎ 0.309⁎⁎ 0.217⁎ 0.312⁎⁎
(0.122) (0.136) (0.125) (0.140)Land ⁎ Ethnic −0.024⁎ −0.023⁎
(0.013) (0.013)
Panel B: Second stage
Dependent Rice planted Trading activities
Seed missing −1.435⁎⁎⁎ −1.599⁎⁎⁎ −0.252⁎⁎ −0.257⁎⁎
(0.548) (0.554) (0.123) (0.124)ControlsHousehold controls Yes Yes Yes YesCommunity controls Yes Yes Yes YesProvince FE Yes Yes Yes YesTest statisticsN 417 417 394 394Partial F excl. instr. 32.79 19.25 34.82 20.42R2 0.121 0.118 0.097 0.097Hansen-J 0.891 0.483 0.491 0.776
Standard errors clustered at the community level in parentheses. All specifications include the full set of household and community controls listed in column (3)of Table 2.
⁎ Indicates significance level at the 90% level.⁎⁎ Indicates significance level at the 95% level.
⁎⁎⁎ Indicates significance level at the 99% level.
76 G. Beekman et al. / European Journal of Political Economy 30 (2013) 70–79
the relation between corruption and economic activities, we estimate more comprehensive models in what follows. In Columns(2) and (5), we added a set of standard household demographics (gender of the household head, education, age), communitycontrols (presence of a main road, and ethnic heterogeneity), and province level fixed effects.9 For both variables we now find a(marginally) significant negative correlation. Columns (3) and (6) present a ‘full’ specification that includes other controlvariables relevant in the post-war context of rural Liberia. These include, for example, proxies for displacement, violent attacks,NGO presence, and involvement in rubber tapping. Both rice planting and trading are now significantly and negatively correlatedwith corruption. In column (7) we report the results of a Probit model (marginal effects) explaining whether or not the householdis engaged in trading. These results are very similar to the ones of the linear probability model in column (6).10
With respect to the controls we find that male household heads are more likely to plant rice, and that education reduces thisprobability (e.g. more educated people may have alternative income sources). The amount of rice planted increases with age, butonly up to age 48. Significant community level variables include belonging to an ethnically diverse community, owning acommunal plantation, and having a large percentage of displaced people. All these variables are positively associated with riceplanting. Turning to the trade models, we see that being older (more experienced) is positively associated with trading, but onlyup to age 47. It also appears as if rubber tapping is a substitute activity for trading. In communities owning a plantation, people areless likely to be involved in trading.
Summarizing the main insights of these OLS results, we find a significant negative correlation between corrupt chiefs andeconomic activities. Farmers in communities with a corrupt chief plant 1 tin of rice less, which amounts to nearly a 50% reductionin rice planted. Corrupt chiefs are also associated with a smaller probability that community members choose to engage in trade(a reduction of 13 percentage points). This, too, is an economically significant effect as, according to our data, some 40% of allhouseholds are engaged in trade. Yet, these findings may suffer from endogeneity bias and need to be interpreted with caution.We therefore proceed with our preferred IV model.
Table 3 reports the results of our IV model. While all models were estimated with the full set of controls, we only report resultsfor the corruption variable (other results are available on request). Panel A contains the results of the first stage. Columns (1) and(2) report the results for ‘planting rice’ and columns (3) and (4) for ‘involvement in trading activities’. The first stage shows that
9 Since we have a large proportion of zero's in our dependent we re-estimated columns (1)–(3) running a Tobit regression. Results are qualitatively the same.10 The reason to favour OLS over Probit or Logit models in columns (4)–(6) is that we want to be able to compare the OLS results to the outcomes of the IVestimates. Yet, since IV Probit only produces valid estimates with a continuous endogenous variable (and ours is binary) we need to resort to a 2SLS when usingthe instruments. Hence we prefer to compare our 2SLS estimates to a normal OLS with a binary dependent. All outcomes fall neatly within the predicted 0–1interval except for column (6). Here 0.11% of the estimates are predicted just below 0. We therefore re-estimate the model using Maximum Likelihood. Resultsare very similar.
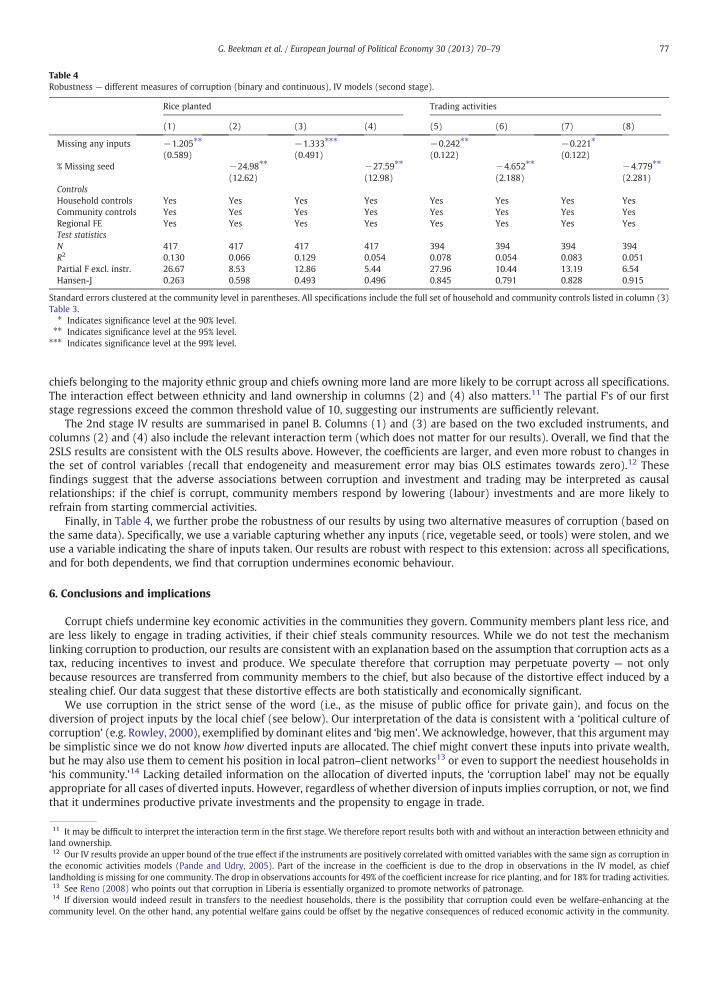
Table 4Robustness — different measures of corruption (binary and continuous), IV models (second stage).
Rice planted Trading activities
(1) (2) (3) (4) (5) (6) (7) (8)
Missing any inputs −1.205⁎⁎ −1.333⁎⁎⁎ −0.242⁎⁎ −0.221⁎
(0.589) (0.491) (0.122) (0.122)% Missing seed −24.98⁎⁎ −27.59⁎⁎ −4.652⁎⁎ −4.779⁎⁎
(12.62) (12.98) (2.188) (2.281)ControlsHousehold controls Yes Yes Yes Yes Yes Yes Yes YesCommunity controls Yes Yes Yes Yes Yes Yes Yes YesRegional FE Yes Yes Yes Yes Yes Yes Yes YesTest statisticsN 417 417 417 417 394 394 394 394R2 0.130 0.066 0.129 0.054 0.078 0.054 0.083 0.051Partial F excl. instr. 26.67 8.53 12.86 5.44 27.96 10.44 13.19 6.54Hansen-J 0.263 0.598 0.493 0.496 0.845 0.791 0.828 0.915
Standard errors clustered at the community level in parentheses. All specifications include the full set of household and community controls listed in column (3)Table 3.
⁎ Indicates significance level at the 90% level.⁎⁎ Indicates significance level at the 95% level.
⁎⁎⁎ Indicates significance level at the 99% level.
77G. Beekman et al. / European Journal of Political Economy 30 (2013) 70–79
chiefs belonging to the majority ethnic group and chiefs owning more land are more likely to be corrupt across all specifications.The interaction effect between ethnicity and land ownership in columns (2) and (4) also matters.11 The partial F's of our firststage regressions exceed the common threshold value of 10, suggesting our instruments are sufficiently relevant.
The 2nd stage IV results are summarised in panel B. Columns (1) and (3) are based on the two excluded instruments, andcolumns (2) and (4) also include the relevant interaction term (which does not matter for our results). Overall, we find that the2SLS results are consistent with the OLS results above. However, the coefficients are larger, and even more robust to changes inthe set of control variables (recall that endogeneity and measurement error may bias OLS estimates towards zero).12 Thesefindings suggest that the adverse associations between corruption and investment and trading may be interpreted as causalrelationships: if the chief is corrupt, community members respond by lowering (labour) investments and are more likely torefrain from starting commercial activities.
Finally, in Table 4, we further probe the robustness of our results by using two alternative measures of corruption (based onthe same data). Specifically, we use a variable capturing whether any inputs (rice, vegetable seed, or tools) were stolen, and weuse a variable indicating the share of inputs taken. Our results are robust with respect to this extension: across all specifications,and for both dependents, we find that corruption undermines economic behaviour.
6. Conclusions and implications
Corrupt chiefs undermine key economic activities in the communities they govern. Community members plant less rice, andare less likely to engage in trading activities, if their chief steals community resources. While we do not test the mechanismlinking corruption to production, our results are consistent with an explanation based on the assumption that corruption acts as atax, reducing incentives to invest and produce. We speculate therefore that corruption may perpetuate poverty — not onlybecause resources are transferred from community members to the chief, but also because of the distortive effect induced by astealing chief. Our data suggest that these distortive effects are both statistically and economically significant.
We use corruption in the strict sense of the word (i.e., as the misuse of public office for private gain), and focus on thediversion of project inputs by the local chief (see below). Our interpretation of the data is consistent with a ‘political culture ofcorruption’ (e.g. Rowley, 2000), exemplified by dominant elites and ‘big men’. We acknowledge, however, that this argument maybe simplistic since we do not know how diverted inputs are allocated. The chief might convert these inputs into private wealth,but he may also use them to cement his position in local patron–client networks13 or even to support the neediest households in‘his community.’14 Lacking detailed information on the allocation of diverted inputs, the ‘corruption label’ may not be equallyappropriate for all cases of diverted inputs. However, regardless of whether diversion of inputs implies corruption, or not, we findthat it undermines productive private investments and the propensity to engage in trade.
11 It may be difficult to interpret the interaction term in the first stage. We therefore report results both with and without an interaction between ethnicity andland ownership.12 Our IV results provide an upper bound of the true effect if the instruments are positively correlated with omitted variables with the same sign as corruption inthe economic activities models (Pande and Udry, 2005). Part of the increase in the coefficient is due to the drop in observations in the IV model, as chieflandholding is missing for one community. The drop in observations accounts for 49% of the coefficient increase for rice planting, and for 18% for trading activities.13 See Reno (2008) who points out that corruption in Liberia is essentially organized to promote networks of patronage.14 If diversion would indeed result in transfers to the neediest households, there is the possibility that corruption could even be welfare-enhancing at thecommunity level. On the other hand, any potential welfare gains could be offset by the negative consequences of reduced economic activity in the community.
78 G. Beekman et al. / European Journal of Political Economy 30 (2013) 70–79
At first sight, our results appear consistent with the Nietzschean perspective on underdevelopment, as discussed by Hillman(2004). According to this perspective, local elites are not constrained by ethics or rule of law, and can prey on the weak withoutrestraint. In such a setting, chiefs have the power to appropriate, and “corruption in government is simply not defined” (p. 266).Hillman then predicts that the weak have no option but to respond by under-supplying private inputs— exactly what we observein our data. However, not all evidence seamlessly fits the Nietzschean development failure paradigm. Officially, the term in officefor chiefs in Liberia is limited, and ‘electoral disapproval’may matter. Hence, ‘predation without restraint’ probably does not aptlydescribe the nature of local chiefdoms (also recall that half the chiefs in our sample did not divert inputs). Interestingly, during ourfieldwork we learned that the rotation age of chiefs varies across the Liberian landscape, occasionally in violation of formal rules.This could set the stage for an inquiry into stationary and roving bandits (e.g., McGuire and Olson, 1996; Hillman, 2004), whichwe leave for future work.
Finally, we return to the implications for agricultural development strategies and development interventions. A large literatureexplores the two-sided relation between aid and corruption, and we believe our results on the disincentive effects of corruptionspeak to this literature as well.15 Specifically, insofar as the success of development interventions varies with the provision ofcomplementary private inputs, we expect projects to be more successful in less corrupt settings.16 The main implications aretwofold. First, to enhance the direct effect of interventions, projects may try to focus on the provision of inputs that cannot easilybe stolen or arrange projects such that the flow of inputs is transparent to community members (thus enhancing local scrutiny).However, to the extent that project outputs can be appropriated by the chief, and the success of the project depends on the supplyof effort (labour) of community members, we should still expect projects to be less successful in a corrupt environment (even ifinputs themselves cannot be stolen). Therefore, and second, insofar as intervening agencies focus on promoting economic activitybased on the combination of an outside project and private effort, they may decide to target communities with chiefs that are lesscorrupt.
Acknowledgements
We would like to thank two anonymous referees and the editor, Arye L. Hillman, for valuable comments and suggestions, andFroukje Pelsma for excellent research assistance. Remaining errors are our own responsibility. This research was funded by theUnited States Institute of Peace (USIP), grant number 077-09F.
References
Aidt, T.S., 2003. Economic analysis of corruption: a survey. The Economic Journal 113, F632–F652.Aidt, T.S., 2009. Corruption, institutions, and economic development. Oxford Review of Economic Policy 25, 271–291.Barassi, M.R., Zhou, Y., 2012. The effect of corruption on FDI: a parametric and non-parametric analysis. European Journal of Political Economy 28, 302–312.Bates, R.H., 1981. States and Markets in Tropical Africa: The Political Basis of Agricultural Policy. University of California Press, Berkeley, CA.Beekman, G., Bulte, E.H., Nillesen, E.E.M., 2012. Corruption, investments and contributions to public goods: experimental evidence from rural Liberia. Unpublished
paper. Development Economics Group, Wageningen University, Wageningen.Bertrand, M., Djankov, S., Hanna, R.N., Mullainathan, S., 2007. Obtaining a driver's license in India: an experimental approach to studying corruption. Quarterly
Journal of Economics 122, 1639–1676.Birkeland, N.M., Jennings, E., Rushing, E.J. (Eds.), 2012. Global Overview 2011. People Internally Displaced by Conflict and Violence. Internal Displacement
Monitoring Centre, Norwegian Refugee Council, Geneva.Bräutigam, D.A., Knack, S., 2004. Foreign aid, institutions and governance in sub-Saharan Africa. Economic Development and Cultural Change 52, 255–285.Busse, M., Hefeker, C., 2007. Political risk, institutions and foreign direct investment. European Journal of Political Economy 23, 397–415.Campos, J.E., Lien, D., Pradhan, S., 1999. The impact of corruption on investment: predictability matters. World Development 27, 1059–1067.Christiaensen, L.J.M., Demery, L., Kuhl, J., 2011. The (evolving) role of agriculture in poverty reduction: an empirical perspective. Journal of Development
Economics 96, 239–254.Congdon Fors, H., Olsson, O., 2007. Endogenous institutional change after independence. European Economic Review 51, 1896–1921.Dalgaard, C.J., Olsson, O., 2008. Windfall gains, political economy, and economic development. Journal of African Economies 17 (Suppl. 1), 72–109.De Jong, E., Bogmans, C., 2011. Does corruption discourage international trade? European Journal of Political Economy 27, 385–398.Djankov, S., Montalvo, J.G., Reynal-Querol, M., 2008. The curse of aid. Journal of Economic Growth 13, 169–194.Doucouliagos, H., Paldam, M., 2008. Aid effectiveness on growth: a meta study. European Journal of Political Economy 24, 1–24.Doucouliagos, H., Paldam, M., 2011. The ineffectiveness of development aid on growth: An update. European Journal of Political Economy 27, 399–404.Egger, P., Winner, H., 2005. Evidence on corruption as an incentive for foreign direct investment. European Journal of Political Economy 21, 932–952.Egger, P., Winner, H., 2006. How corruption influences foreign direct investment: a panel data study. Economic Development and Cultural Change 54, 459–486.Fisman, R.J., 2001. Estimating the value of political connections. American Economic Review 91, 1095–1102.Fisman, R.J., Svensson, J., 2007. Are corruption and taxation really harmful to growth? Firm level evidence. Journal of Development Economics 83, 63–75.
15 The nature of the relation between aid and corruption, or governance more broadly, is disputed. Dalgaard and Olsson (2008), Bräutigam and Knack (2004)and Congdon Fors and Olsson (2007) analyse how institutional change responds to incentives, and demonstrate that institutional erosion can be a rationalresponse to changing economic conditions (including specific income shocks). The availability of windfalls may fuel and sustain corruption (Rowley, 2000;Djankov et al., 2008). Voors et al. (2011) find that positive income shocks induce corruption, especially in societies where corruption is already widespread.However, and in contrast, Tavares (2003) and Okada and Samreth (2012) find that foreign aid decreases corruption, possibly because of aid conditionality(requirements to improve governance). The debate about the effects of aid on institutions extends to the effect of aid on growth. For recent meta studies on thisissue, refer to Doucouliagos and Paldam (2008, 2011). Among other things, and supporting some insights obtained in the current paper, they conclude that manydevelopment projects benefitted local elites rather than the targeted beneficiaries, which may have contributed to the rather bleak effects of development aid oneconomic growth.16 This is confirmed by additional work, linking the local governance setting to choices (‘play’) in two standard behavioural experiments (Beekman et al., 2012).In communities with corrupt chiefs, villagers contribute less to public goods in public goods games. Moreover, and consistent with the evidence on these pages,they invest less in privately-profitable ‘investment games’ (lotteries). The governance environment thus affects the response of villagers to economicopportunities, as potentially provided by development interventions.
79G. Beekman et al. / European Journal of Political Economy 30 (2013) 70–79
Fredriksson, P.G., Wollscheid, J.R., 2008. The political economy of investment: the case of pollution control technology. European Journal of Political Economy 24,53–72.
Hillman, A.L., 2004. Nietzschean development failures. Public Choice 119, 263–280.Hilson, G., van Bockstael, S., 2012. Poverty and livelihood diversification in rural Liberia: exploring the linkages between artisanal diamond mining and
smallholder rice production. Journal of Development Studies 48, 413–428.Mauro, P., 1995. Corruption and growth. Quarterly Journal of Economics 110, 681–712.McGuire, M.C., Olson Jr., M., 1996. The economics of autocracy and majority rule: the invisible hand and the use of force. Journal of Economic Literature 34, 72–96.Niehaus, P., Sukhtankar, S., 2012. Corruption dynamics: the golden goose effect. CEGA WPS-022. Center for Effective Global Action.University of California,
Berkeley, CA.Okada, K., Samreth, S., 2012. The effect of foreign aid on corruption: a quantile regression approach. Economics Letters 115, 240–243.Olken, B.A., 2006. Corruption and the costs of redistribution: microevidence from Indonesia. Journal of Public Economics 90, 853–870.Olken, B.A., 2007. Monitoring corruption: evidence from a field experiment in Indonesia. Journal of Political Economy 115, 200–249.Olken, B.A., Barron, P., 2009. The simple economics of extortion: evidence from trucking in Aceh. Journal of Political Economy 117, 417–452.Olken, B.A., Pande, R., 2012. Corruption in developing countries. Annual Review of Economics 4, 479–509.Pande, R., Udry, C., 2005. Institutions and development. In: Blundell, R., Newey, W., Persson, T. (Eds.), Proceedings of the 9th World Congress of the Econometric
Society. Cambridge University Press, Cambridge UK, pp. 349–403.Reinikka, R., Svensson, J., 2004. Local capture: evidence from a central government transfer program in Uganda. Quarterly Journal of Economics 119, 679–706.Reinikka, R., Svensson, J., 2011. The power of information in public services: evidence from education in Uganda. Journal of Public Economics 95, 956–966.Reno, W., 2008. Anti-corruption efforts in Liberia: are they aimed at the right targets? International Peacekeeping 15, 387–404.Richards, P., 2010. The political economy of war and peace in Liberia. Background paper for: Societal Dynamics and Fragility: Engaging Societies in Responding to
Fragility. Social Cohesion and Violence Prevention Team. World Bank, Washington DC.Richards, P., Bah, K.A., 2005. Peace through agrarian justice. IDS Bulletin 36, 139–143.Richards, P., Archibald, S., Bruce, B., Modad, W., Mulbah, E., Varpilah, T., Vincent, J., 2005. Community cohesion in Liberia: a post-war rapid social assessment.
Social Development Papers: Conflict Prevention & Reconstruction Paper no. 21.World Bank, Washington DC.Rowley, C.K., 2000. Political culture and economic performance in sub-Saharan Africa. European Journal of Political Economy 16, 133–158.Sequeira, S., 2012. Advances in measuring corruption in the field. In: Serra, D., Wantchekon, L. (Eds.), New Advances in Experimental Research on Corruption.
Research in Experimental Economics, volume 15. Emerald, Bingley UK, pp. 145–176.Sequeira, S., Djankov, S., 2010. An empirical study of corruption in ports. MPRA Paper no. 21791. Munich Personal RePEc Archive, Munich.Serra, D., Wantchekon, L. (Eds.), 2012. New Advances in Experimental Research on Corruption. Research in Experimental Economics, volume 15. Emerald, Bingley
UK.Shleifer, A., Vishny, R., 1994. Politicians and firms. Quarterly Journal of Economics 109, 995–1025.Svensson, J., 2003. Who must pay bribes and how much? Quarterly Journal of Economics 118, 207–230.Tavares, J.A., 2003. Does foreign aid corrupt? Economics Letters 79, 99–106.UNDP, 2011. Human Development Report 2011. Sustainability and Equity: A Better Future for All. Palgrave Macmillan, Basingstoke and New York NY.United Nations, 2011. Urban population, development, and the environment 2011. United Nations, New York NY.Voors, M.J., Bulte, E.H., Damania, R., 2011. Income shocks and corruption in Africa: does a virtuous cycle exist? Journal of African Economies 20, 395–418.Wei, S.J., 2000. How taxing is corruption on international investors? The Review of Economics and Statistics 51, 25–57.World Bank, 2007. World Bank Report 2008: Agriculture for Development. World Bank, Washington DC.World Bank, 2012. World Development Indicators 2012. World Bank, Washington, DC.