corrosion inhibition of aluminum–silicon alloy in ... introduction corrosion of aluminum and its...
TRANSCRIPT

Corrosion Inhibition of Aluminum–Silicon Alloy in HydrochloricAcid Solutions Using Carbamidic Thioanhydride Derivatives
A. S. Fouda1 • F. Sh. Mohamed2 • M. W. El-Sherbeni1
Received: 10 January 2016 / Revised: 6 March 2016 / Accepted: 17 March 2016 / Published online: 15 April 2016
� Springer International Publishing Switzerland 2016
Abstract The corrosion inhibition of Al–Si alloy in 1 M
HCl solution using some carbamidic thioanhydride derivatives
at various concentrations has been studied using potentiody-
namic polarization, electrochemical impedance spectroscopy,
electrochemical frequency modulation, and hydrogen evolu-
tion techniques. Results obtained indicate that the inhibition
efficiency (% g) reached 94 % at 2 9 10-5 M concentration
and was found to increase with increasing the inhibitor con-
centrations. % g decreased with increasing the temperature.
Potentiodynamic polarization curves showed that the investi-
gated derivatives were mixed-type inhibitors. Some activation
and adsorption thermodynamic parameters (DH, DG, and DS)
were calculated and discussed. The adsorption of these
derivatives on the alloy surface was found to obey Langmuir
adsorption isotherm. The electrochemical results are in good
agreement with the calculated quantum chemical HOMO and
LUMO energies of the tested molecules.
Keywords Carbamidic thioanhydride derivatives � Al–Si
alloy � HCl � Potentiodynamic polarization � EIS � EFM �Hydrogen evolution
1 Introduction
Corrosion of aluminum and its alloys has been a subject of
numerous studies due to their high technological value, its
strength, electrical conductivity, super purity [1], and wide
range of industrial applications especially in construction,
electronics, packing, and transportation. 1 M hydrochloric
acid solution is used for pickling, chemical, and electro-
chemical etching of aluminum and its alloys. Although Al
has an adhesive protective passivating oxide film, but this
surface film is amphoteric and etching when the metal is
exposed to high concentrations of acids or bases [2]. The
main aim of many researchers is to protect the metal from
corrosive agents, so it is very important to add corrosion
inhibitors to prevent metal corrosion and minimize acid
consumption [3]. Generally, the first step in the action
mechanism of the inhibitors in aggressive acid media is the
adsorption of the inhibitors on the metal surface. Various
mechanisms have been proposed to explain the breakdown of
the passive oxide film when chloride reaches the metal film
interface. Recently, it has shown that chloride does not enter
the oxide film but it is chemisorbed on the oxide surface [4].
The choice of inhibitor is based on two considerations: first, it
could be synthesized conveniently from relatively cheap raw
materials; second, it contains the electron cloud on the aro-
matic ring or electro-negative atoms such as nitrogen and
oxygen in relatively long-chain compounds. In general,
organic compounds with oxygen, sulfur, and/or nitrogen as
polar groups and conjugated double bonds in their structures
have been reported to be good corrosion inhibitors for many
metals and alloys in corrosive media [5–23]. Polar functional
are regarded as the reaction center that stabilizes the
adsorption process [24]. The adsorption process depends on a
few factors, such as the nature and surface charge of the
metal, the adsorption mode, the chemical structure of the
metal, and the type of the electrolyte solution [25].
The aim of the present work is to study: (i) the effect of the
addition of some carbamidic thioanhydride derivatives on the
behavior of Al–Si alloy corrosion in 1 M hydrochloric acid
solution using chemical and electrochemical techniques, (ii)
& A. S. Fouda
1 Department of Chemistry, Faculty of Science, Mansoura
University, Mansoura 35516, Egypt
2 Department of Chemistry, Faculty of Science, Damietta
University, Damietta, Egypt
123
J Bio Tribo Corros (2016) 2:11
DOI 10.1007/s40735-016-0039-y
the effect of temperature on the inhibition efficiency, and (iii)
elucidate the corrosion mechanism.
2 Experimental
2.1 Materials and Reagents
Al–Si alloy that used in this study is of chemical compo-
sition: 92.482 % Al, 7.030 % Si, 0.100 % Fe, 0.003 % Mn,
0.369 % Mg, 0.002 % Ni, 0.001 % Cr, 0.003 % Zn,
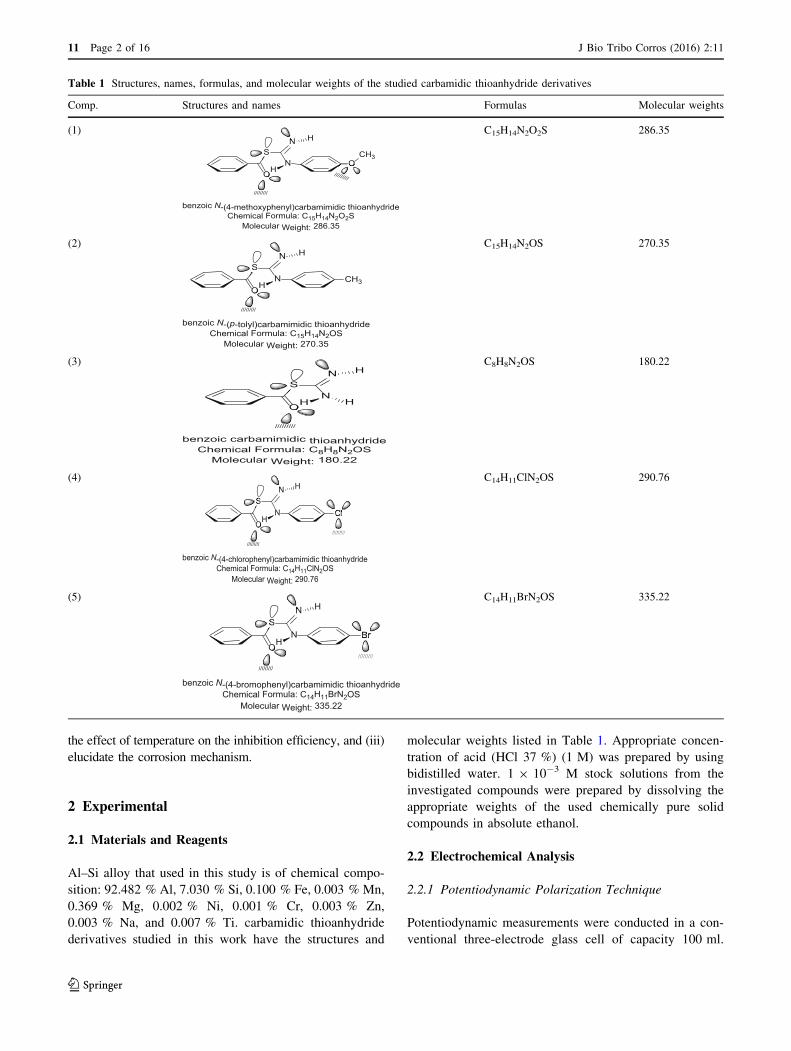
0.003 % Na, and 0.007 % Ti. carbamidic thioanhydride
derivatives studied in this work have the structures and
molecular weights listed in Table 1. Appropriate concen-
tration of acid (HCl 37 %) (1 M) was prepared by using
bidistilled water. 1 9 10-3 M stock solutions from the
investigated compounds were prepared by dissolving the
appropriate weights of the used chemically pure solid
compounds in absolute ethanol.
2.2 Electrochemical Analysis
2.2.1 Potentiodynamic Polarization Technique
Potentiodynamic measurements were conducted in a con-
ventional three-electrode glass cell of capacity 100 ml.
Table 1 Structures, names, formulas, and molecular weights of the studied carbamidic thioanhydride derivatives
Comp. Structures and names Formulas Molecular weights
(1)N
SN
O
/////////
H
H
OCH3
/////////
benzoic N-(4-methoxyphenyl)carbamimidic thioanhydrideChemical Formula: C15H14N2O2S
Molecular Weight: 286.35
C15H14N2O2S 286.35
(2)N
SN
O
/////////
H
H
CH3
benzoic N-(p-tolyl)carbamimidic thioanhydrideChemical Formula: C15H14N2OS
Molecular Weight: 270.35
C15H14N2OS 270.35
(3)N
SN
O
/////////
H
H
H
benzoic carbamimidic thioanhydrideChemical Formula: C8H8N2OS
Molecular Weight: 180.22
C8H8N2OS 180.22
(4)N
SN
O
/////////
H
H
Cl
/////////
benzoic N-(4-chlorophenyl)carbamimidic thioanhydrideChemical Formula: C14H11ClN2OS
Molecular Weight: 290.76
C14H11ClN2OS 290.76
(5)N
SN
O
/////////
H
H
Br
/////////
benzoic N-(4-bromophenyl)carbamimidic thioanhydrideChemical Formula: C14H11BrN2OS
Molecular Weight: 335.22
C14H11BrN2OS 335.22
11 Page 2 of 16 J Bio Tribo Corros (2016) 2:11
123
Three different types of electrodes were used; saturated
calomel electrode (SCE) and a platinum foil were used as
reference and auxiliary electrodes, respectively. The
working electrode was in the form of a square cut from Al–
Si alloy sheet under investigation and was embedded in a
Teflon rod with an exposed area of 1 cm2. This electrode
was immersed in 100 ml of a test solution into the polar-
ization cell. A time interval of about 30 min was given for
the system to attain a steady state [open-circuit potential
(Eocp)]. All the experiments were carried out at 25 ± 1 �Cusing an ultra-circulating thermostat. The potentiodynamic
current potential curves were recorded by changing the
electrode potential automatically from -0.5 to 1.5 mV
versus open-circuit potential (Eocp) with a scan rate of
1 mV/s.
2.2.2 Electrochemical Impedance Spectroscopy (EIS)
Technique
The cell and the apparatus used in electrochemical impe-
dance spectroscopy (EIS) technique are the same as used in
potentiodynamic polarization technique. EIS experiments
were conducted over a frequency range of 10 kHz to
100 m Hz, with a signal amplitude perturbation of 5 mV.
All impedance data were fitted to an appropriate equivalent
circuit. All the potentials reported are referred to SCE. The
impedance diagrams are given in the Nyquist and Bode
representations.
2.2.3 Electrochemical Frequency Modulation (EFM)
Technique
Electrochemical frequency modulation was carried out
using two frequencies 2 and 5 Hz. The base frequency was
0.1 Hz, so the waveform repeats after 1 s. The larger peaks
were used to calculate the corrosion current density (icorr),
the tafel slopes (bc and ba), and the causality factors CF2
and CF3. The electrode potential was allowed to stabilize
for 30 min before starting the measurements.
All the experiments were carried out at 25 ± 1 �C using
ultra-circulating thermostat. Measurements were per-
formed using Gamry instrument PCI4G750 Potentiostat/
Galvanostat/ZRA. This includes a Gamry framework sys-
tem based on the ESA 400. Gamry applications include
DC105 for DC corrosion, EIS300 for EIS, and EFM140 for
EFM measurements along with a computer for collecting
data. Echem Analyst 5.58 software was used for plotting,
graphing, and fitting data.
2.3 Hydrogen Evolution Determination
The apparatus and procedure used for hydrogen evolution
method was similar to that described in literature [26–35].
The gasometric assembly measures the volume of hydro-
gen gas evolution from the reaction system. Six Al–Si alloy
coupons of dimension 2 cm 9 2 cm 9 0.05 cm were used
in the experiments for test solutions containing 1 M HCl
with the five different concentrations of investigated inhi-
bitors from 1 9 10-6 M to 20 9 10-6 M and the blank at
30 �C. A 50 ml of each test solution was introduced into the
reaction vessel connected to a burette through a delivery
tube. The initial volume of air in the burette was recorded.
Thereafter, one Al–Si alloy coupon was dropped into the
corroded solution and the reaction vessel quickly closed.
Variation in the volume of hydrogen gas evolved with time
was recorded every 1 min. for 60 min. Each experiment was
conducted on a fresh specimen of alloy coupon.
3 Results and Discussion
3.1 Potentiodynamic Polarization Measurements
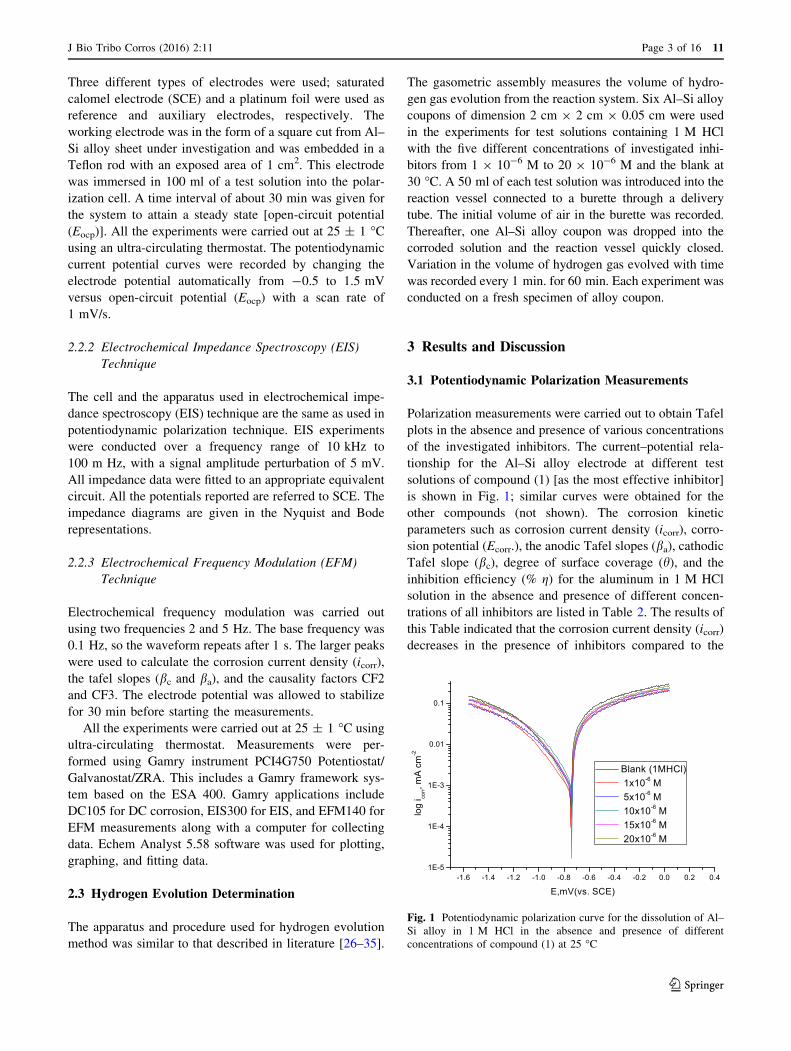
Polarization measurements were carried out to obtain Tafel
plots in the absence and presence of various concentrations
of the investigated inhibitors. The current–potential rela-
tionship for the Al–Si alloy electrode at different test
solutions of compound (1) [as the most effective inhibitor]
is shown in Fig. 1; similar curves were obtained for the
other compounds (not shown). The corrosion kinetic
parameters such as corrosion current density (icorr), corro-
sion potential (Ecorr.), the anodic Tafel slopes (ba), cathodic
Tafel slope (bc), degree of surface coverage (h), and the
inhibition efficiency (% g) for the aluminum in 1 M HCl
solution in the absence and presence of different concen-
trations of all inhibitors are listed in Table 2. The results of
this Table indicated that the corrosion current density (icorr)
decreases in the presence of inhibitors compared to the
1E-5
1E-4
1E-3
0.01
0.1
-1.6 -1.4 -1.2 -1.0 -0.8 -0.6 -0.4 -0.2 0.0 0.2 0.4
log
i corr, m
A cm
-2
Blank (1MHCl) 1x10⁻⁶ M 5x10⁻⁶ M 10x10-6 M 15x10-6 M 20x10-6 M
E,mV(vs. SCE)
Fig. 1 Potentiodynamic polarization curve for the dissolution of Al–
Si alloy in 1 M HCl in the absence and presence of different
concentrations of compound (1) at 25 �C
J Bio Tribo Corros (2016) 2:11 Page 3 of 16 11
123
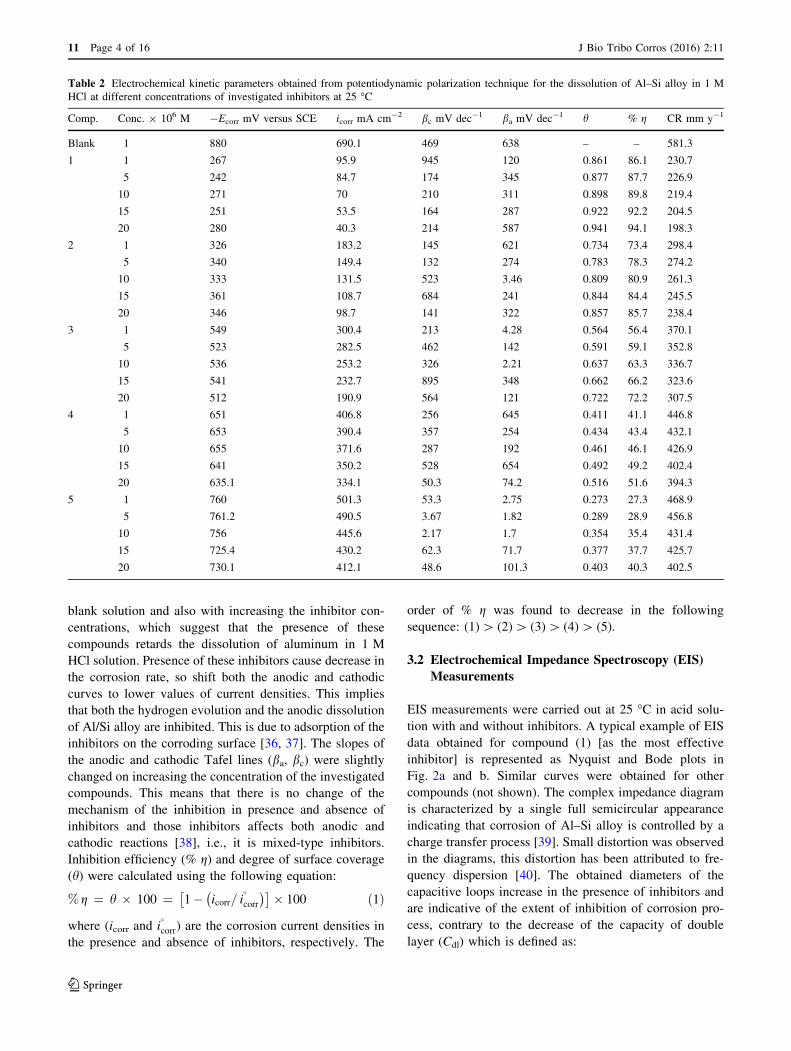
blank solution and also with increasing the inhibitor con-
centrations, which suggest that the presence of these
compounds retards the dissolution of aluminum in 1 M
HCl solution. Presence of these inhibitors cause decrease in
the corrosion rate, so shift both the anodic and cathodic
curves to lower values of current densities. This implies
that both the hydrogen evolution and the anodic dissolution
of Al/Si alloy are inhibited. This is due to adsorption of the
inhibitors on the corroding surface [36, 37]. The slopes of
the anodic and cathodic Tafel lines (ba, bc) were slightly
changed on increasing the concentration of the investigated
compounds. This means that there is no change of the
mechanism of the inhibition in presence and absence of
inhibitors and those inhibitors affects both anodic and
cathodic reactions [38], i.e., it is mixed-type inhibitors.
Inhibition efficiency (% g) and degree of surface coverage
(h) were calculated using the following equation:
% g ¼ h � 100 ¼ 1� icorr= i�
corr
� �� �� 100 ð1Þ
where (icorr and i�
corr) are the corrosion current densities in
the presence and absence of inhibitors, respectively. The
order of % g was found to decrease in the following
sequence: (1)[ (2)[ (3)[ (4)[ (5).
3.2 Electrochemical Impedance Spectroscopy (EIS)
Measurements
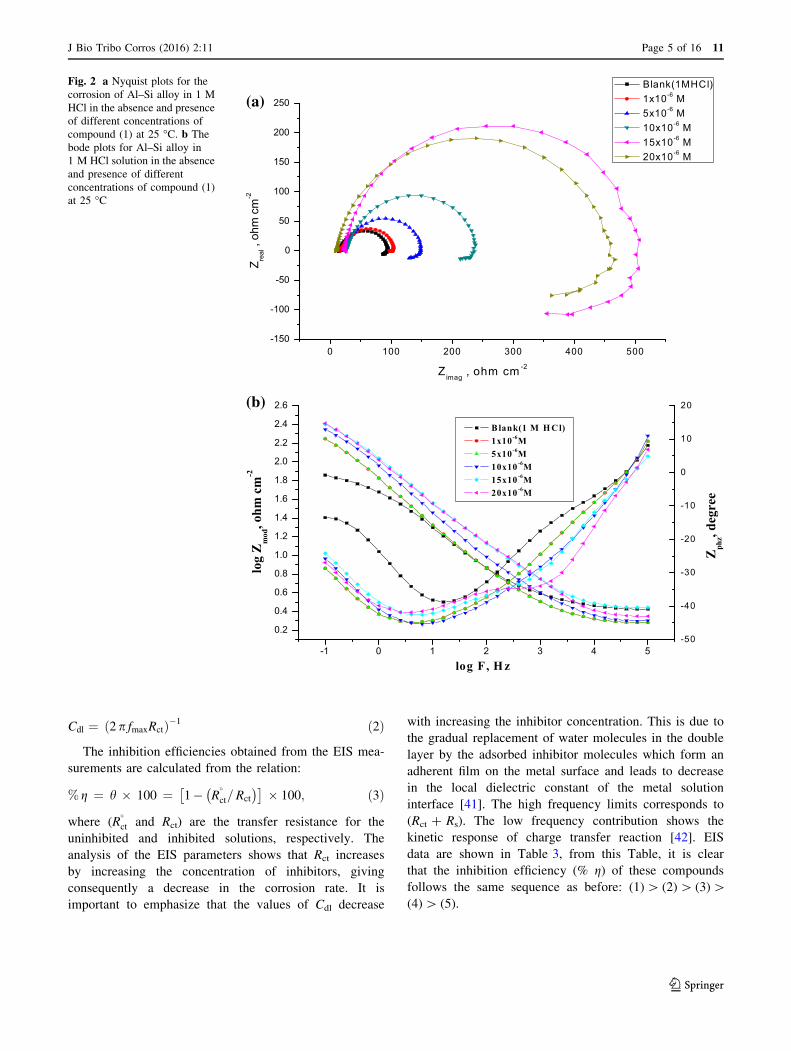
EIS measurements were carried out at 25 �C in acid solu-
tion with and without inhibitors. A typical example of EIS
data obtained for compound (1) [as the most effective
inhibitor] is represented as Nyquist and Bode plots in
Fig. 2a and b. Similar curves were obtained for other
compounds (not shown). The complex impedance diagram
is characterized by a single full semicircular appearance
indicating that corrosion of Al–Si alloy is controlled by a
charge transfer process [39]. Small distortion was observed
in the diagrams, this distortion has been attributed to fre-
quency dispersion [40]. The obtained diameters of the
capacitive loops increase in the presence of inhibitors and
are indicative of the extent of inhibition of corrosion pro-
cess, contrary to the decrease of the capacity of double
layer (Cdl) which is defined as:
Table 2 Electrochemical kinetic parameters obtained from potentiodynamic polarization technique for the dissolution of Al–Si alloy in 1 M
HCl at different concentrations of investigated inhibitors at 25 �C
Comp. Conc. 9 106 M -Ecorr mV versus SCE icorr mA cm-2 bc mV dec-1 ba mV dec-1 h % g CR mm y-1
Blank 1 880 690.1 469 638 – – 581.3
1 1 267 95.9 945 120 0.861 86.1 230.7
5 242 84.7 174 345 0.877 87.7 226.9
10 271 70 210 311 0.898 89.8 219.4
15 251 53.5 164 287 0.922 92.2 204.5
20 280 40.3 214 587 0.941 94.1 198.3
2 1 326 183.2 145 621 0.734 73.4 298.4
5 340 149.4 132 274 0.783 78.3 274.2
10 333 131.5 523 3.46 0.809 80.9 261.3
15 361 108.7 684 241 0.844 84.4 245.5
20 346 98.7 141 322 0.857 85.7 238.4
3 1 549 300.4 213 4.28 0.564 56.4 370.1
5 523 282.5 462 142 0.591 59.1 352.8
10 536 253.2 326 2.21 0.637 63.3 336.7
15 541 232.7 895 348 0.662 66.2 323.6
20 512 190.9 564 121 0.722 72.2 307.5
4 1 651 406.8 256 645 0.411 41.1 446.8
5 653 390.4 357 254 0.434 43.4 432.1
10 655 371.6 287 192 0.461 46.1 426.9
15 641 350.2 528 654 0.492 49.2 402.4
20 635.1 334.1 50.3 74.2 0.516 51.6 394.3
5 1 760 501.3 53.3 2.75 0.273 27.3 468.9
5 761.2 490.5 3.67 1.82 0.289 28.9 456.8
10 756 445.6 2.17 1.7 0.354 35.4 431.4
15 725.4 430.2 62.3 71.7 0.377 37.7 425.7
20 730.1 412.1 48.6 101.3 0.403 40.3 402.5
11 Page 4 of 16 J Bio Tribo Corros (2016) 2:11
123
Cdl ¼ 2 p fmaxRctð Þ�1 ð2Þ
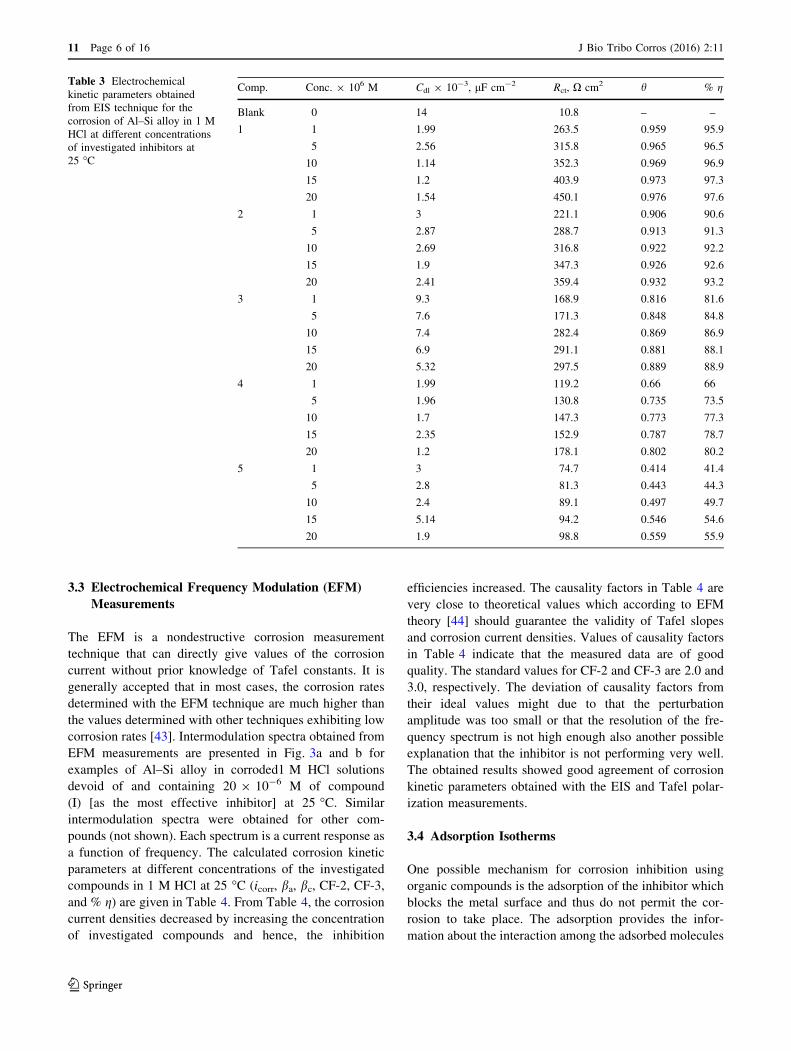
The inhibition efficiencies obtained from the EIS mea-
surements are calculated from the relation:
% g ¼ h � 100 ¼ 1� R�
ct=Rct
� �� �� 100; ð3Þ
where (R�ct and Rct) are the transfer resistance for the
uninhibited and inhibited solutions, respectively. The
analysis of the EIS parameters shows that Rct increases
by increasing the concentration of inhibitors, giving
consequently a decrease in the corrosion rate. It is
important to emphasize that the values of Cdl decrease
with increasing the inhibitor concentration. This is due to
the gradual replacement of water molecules in the double
layer by the adsorbed inhibitor molecules which form an
adherent film on the metal surface and leads to decrease
in the local dielectric constant of the metal solution
interface [41]. The high frequency limits corresponds to
(Rct ? Rs). The low frequency contribution shows the
kinetic response of charge transfer reaction [42]. EIS
data are shown in Table 3, from this Table, it is clear
that the inhibition efficiency (% g) of these compounds
follows the same sequence as before: (1)[ (2)[ (3)[(4)[ (5).
0 100 200 300 400 500-150
-100
-50
0
50
100
150
200
250
Blank(1MHCl) 1x10⁻⁶ M 5x10⁻⁶ M 10x10-6 M 15x10-6 M 20x10-6 M
Z real ,
ohm
cm
-2
Z imag , ohm cm -2
-1 0 1 2 3 4 5
0.2
0.4
0.6
0.8
1.0
1.2
1.4
1.6
1.8
2.0
2.2
2.4
2.6
B lank(1 M H Cl) 1x10⁻⁶M 5x10⁻⁶M 10x10-6M 15x10-6M 20x10-6M
Zph
z, deg
ree
log F, H z
log
Zm
od, o
hm c
m-2
-50
-40
-30
-20
-10
0
10
20
(a)
(b)
Fig. 2 a Nyquist plots for the
corrosion of Al–Si alloy in 1 M
HCl in the absence and presence
of different concentrations of
compound (1) at 25 �C. b The
bode plots for Al–Si alloy in
1 M HCl solution in the absence
and presence of different
concentrations of compound (1)
at 25 �C
J Bio Tribo Corros (2016) 2:11 Page 5 of 16 11
123
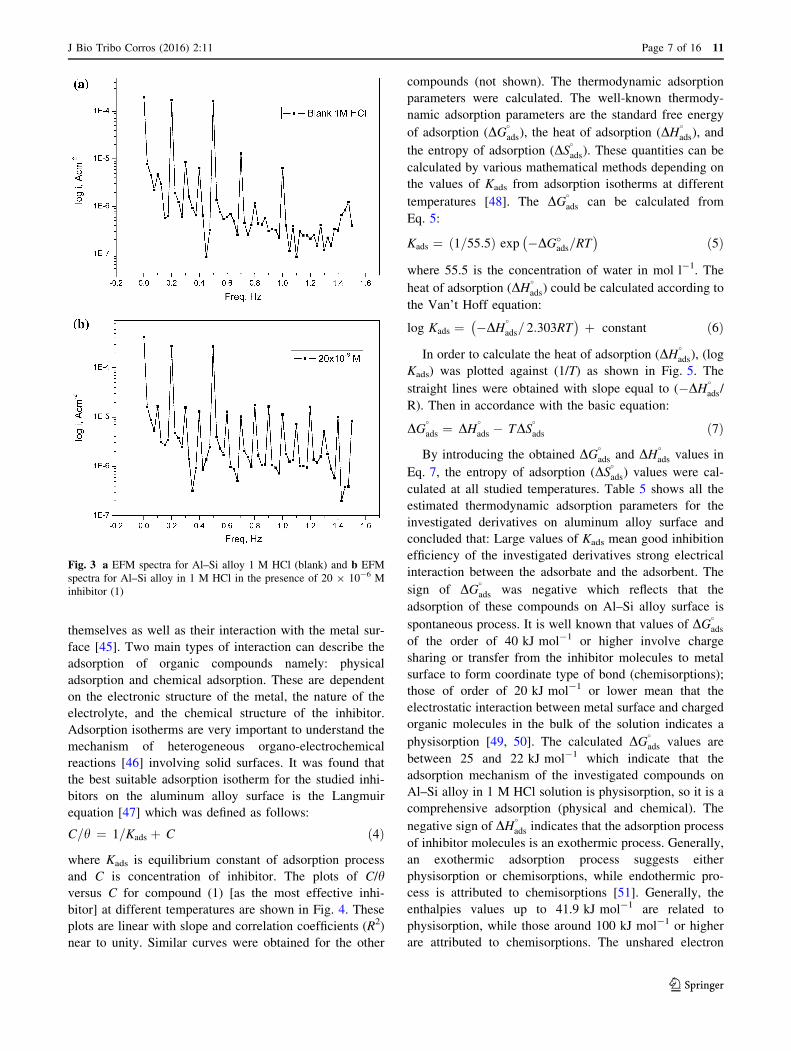
3.3 Electrochemical Frequency Modulation (EFM)
Measurements
The EFM is a nondestructive corrosion measurement
technique that can directly give values of the corrosion
current without prior knowledge of Tafel constants. It is
generally accepted that in most cases, the corrosion rates
determined with the EFM technique are much higher than
the values determined with other techniques exhibiting low
corrosion rates [43]. Intermodulation spectra obtained from
EFM measurements are presented in Fig. 3a and b for
examples of Al–Si alloy in corroded1 M HCl solutions
devoid of and containing 20 9 10-6 M of compound
(I) [as the most effective inhibitor] at 25 �C. Similar
intermodulation spectra were obtained for other com-
pounds (not shown). Each spectrum is a current response as
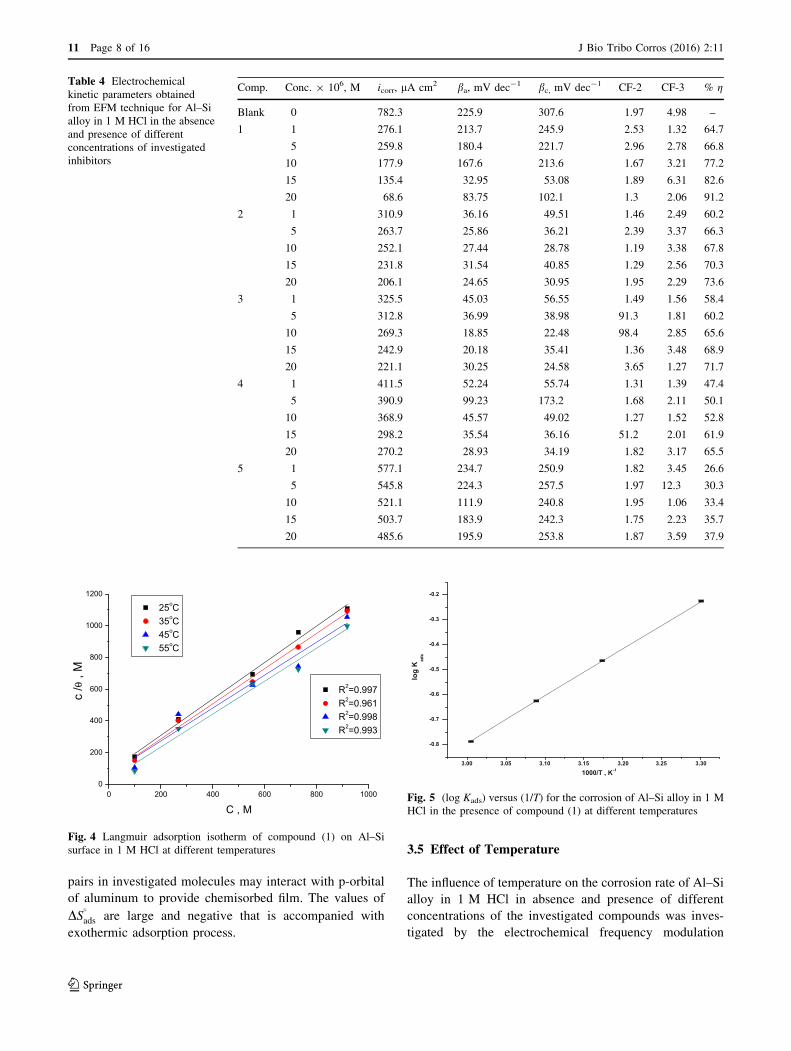
a function of frequency. The calculated corrosion kinetic
parameters at different concentrations of the investigated
compounds in 1 M HCl at 25 �C (icorr, ba, bc, CF-2, CF-3,
and % g) are given in Table 4. From Table 4, the corrosion
current densities decreased by increasing the concentration
of investigated compounds and hence, the inhibition
efficiencies increased. The causality factors in Table 4 are
very close to theoretical values which according to EFM
theory [44] should guarantee the validity of Tafel slopes
and corrosion current densities. Values of causality factors
in Table 4 indicate that the measured data are of good
quality. The standard values for CF-2 and CF-3 are 2.0 and
3.0, respectively. The deviation of causality factors from
their ideal values might due to that the perturbation
amplitude was too small or that the resolution of the fre-
quency spectrum is not high enough also another possible
explanation that the inhibitor is not performing very well.
The obtained results showed good agreement of corrosion
kinetic parameters obtained with the EIS and Tafel polar-
ization measurements.
3.4 Adsorption Isotherms
One possible mechanism for corrosion inhibition using
organic compounds is the adsorption of the inhibitor which
blocks the metal surface and thus do not permit the cor-
rosion to take place. The adsorption provides the infor-
mation about the interaction among the adsorbed molecules
Table 3 Electrochemical
kinetic parameters obtained
from EIS technique for the
corrosion of Al–Si alloy in 1 M
HCl at different concentrations
of investigated inhibitors at
25 �C
Comp. Conc. 9 106 M Cdl 9 10-3, lF cm-2 Rct, X cm2 h % g
Blank 0 14 10.8 – –
1 1 1.99 263.5 0.959 95.9
5 2.56 315.8 0.965 96.5
10 1.14 352.3 0.969 96.9
15 1.2 403.9 0.973 97.3
20 1.54 450.1 0.976 97.6
2 1 3 221.1 0.906 90.6
5 2.87 288.7 0.913 91.3
10 2.69 316.8 0.922 92.2
15 1.9 347.3 0.926 92.6
20 2.41 359.4 0.932 93.2
3 1 9.3 168.9 0.816 81.6
5 7.6 171.3 0.848 84.8
10 7.4 282.4 0.869 86.9
15 6.9 291.1 0.881 88.1
20 5.32 297.5 0.889 88.9
4 1 1.99 119.2 0.66 66
5 1.96 130.8 0.735 73.5
10 1.7 147.3 0.773 77.3
15 2.35 152.9 0.787 78.7
20 1.2 178.1 0.802 80.2
5 1 3 74.7 0.414 41.4
5 2.8 81.3 0.443 44.3
10 2.4 89.1 0.497 49.7
15 5.14 94.2 0.546 54.6
20 1.9 98.8 0.559 55.9
11 Page 6 of 16 J Bio Tribo Corros (2016) 2:11
123
themselves as well as their interaction with the metal sur-
face [45]. Two main types of interaction can describe the
adsorption of organic compounds namely: physical
adsorption and chemical adsorption. These are dependent
on the electronic structure of the metal, the nature of the
electrolyte, and the chemical structure of the inhibitor.
Adsorption isotherms are very important to understand the
mechanism of heterogeneous organo-electrochemical
reactions [46] involving solid surfaces. It was found that
the best suitable adsorption isotherm for the studied inhi-
bitors on the aluminum alloy surface is the Langmuir
equation [47] which was defined as follows:
C=h ¼ 1=Kads þ C ð4Þ
where Kads is equilibrium constant of adsorption process
and C is concentration of inhibitor. The plots of C/hversus C for compound (1) [as the most effective inhi-
bitor] at different temperatures are shown in Fig. 4. These
plots are linear with slope and correlation coefficients (R2)
near to unity. Similar curves were obtained for the other
compounds (not shown). The thermodynamic adsorption
parameters were calculated. The well-known thermody-
namic adsorption parameters are the standard free energy
of adsorption (DG�ads), the heat of adsorption (DH
�ads), and
the entropy of adsorption (DS�
ads). These quantities can be
calculated by various mathematical methods depending on
the values of Kads from adsorption isotherms at different
temperatures [48]. The DG�
ads can be calculated from
Eq. 5:
Kads ¼ 1=55:5ð Þ exp �DG�ads=RT
� �ð5Þ
where 55.5 is the concentration of water in mol l-1. The
heat of adsorption (DH�ads) could be calculated according to
the Van’t Hoff equation:
log Kads ¼ �DH�
ads= 2:303RT� �
þ constant ð6Þ
In order to calculate the heat of adsorption (DH�
ads), (log
Kads) was plotted against (1/T) as shown in Fig. 5. The
straight lines were obtained with slope equal to (�DH�ads/
R). Then in accordance with the basic equation:
DG�
ads ¼ DH�
ads � TDS�
ads ð7Þ
By introducing the obtained DG�ads and DH
�ads values in
Eq. 7, the entropy of adsorption (DS�
ads) values were cal-
culated at all studied temperatures. Table 5 shows all the
estimated thermodynamic adsorption parameters for the
investigated derivatives on aluminum alloy surface and
concluded that: Large values of Kads mean good inhibition
efficiency of the investigated derivatives strong electrical
interaction between the adsorbate and the adsorbent. The
sign of DG�ads was negative which reflects that the
adsorption of these compounds on Al–Si alloy surface is
spontaneous process. It is well known that values of DG�
ads
of the order of 40 kJ mol-1 or higher involve charge
sharing or transfer from the inhibitor molecules to metal
surface to form coordinate type of bond (chemisorptions);
those of order of 20 kJ mol-1 or lower mean that the
electrostatic interaction between metal surface and charged
organic molecules in the bulk of the solution indicates a
physisorption [49, 50]. The calculated DG�ads values are
between 25 and 22 kJ mol-1 which indicate that the
adsorption mechanism of the investigated compounds on
Al–Si alloy in 1 M HCl solution is physisorption, so it is a
comprehensive adsorption (physical and chemical). The
negative sign of DH�
ads indicates that the adsorption process
of inhibitor molecules is an exothermic process. Generally,
an exothermic adsorption process suggests either
physisorption or chemisorptions, while endothermic pro-
cess is attributed to chemisorptions [51]. Generally, the
enthalpies values up to 41.9 kJ mol-1 are related to
physisorption, while those around 100 kJ mol-1 or higher
are attributed to chemisorptions. The unshared electron
Fig. 3 a EFM spectra for Al–Si alloy 1 M HCl (blank) and b EFM
spectra for Al–Si alloy in 1 M HCl in the presence of 20 9 10-6 M
inhibitor (1)
J Bio Tribo Corros (2016) 2:11 Page 7 of 16 11
123
pairs in investigated molecules may interact with p-orbital
of aluminum to provide chemisorbed film. The values of
DS�
ads are large and negative that is accompanied with
exothermic adsorption process.
3.5 Effect of Temperature
The influence of temperature on the corrosion rate of Al–Si
alloy in 1 M HCl in absence and presence of different
concentrations of the investigated compounds was inves-
tigated by the electrochemical frequency modulation
3.00 3.05 3.10 3.15 3.20 3.25 3.30
-0.8
-0.7
-0.6
-0.5
-0.4
-0.3
-0.2
log
Kad
s
1000/T , K-1
Fig. 5 (log Kads) versus (1/T) for the corrosion of Al–Si alloy in 1 M
HCl in the presence of compound (1) at different temperatures
Table 4 Electrochemical
kinetic parameters obtained
from EFM technique for Al–Si
alloy in 1 M HCl in the absence
and presence of different
concentrations of investigated
inhibitors
Comp. Conc. 9 106, M icorr, lA cm2 ba, mV dec-1 bc, mV dec-1 CF-2 CF-3 % g
Blank 0 782.3 225.9 307.6 1.97 4.98 –
1 1 276.1 213.7 245.9 2.53 1.32 64.7
5 259.8 180.4 221.7 2.96 2.78 66.8
10 177.9 167.6 213.6 1.67 3.21 77.2
15 135.4 32.95 53.08 1.89 6.31 82.6
20 68.6 83.75 102.1 1.3 2.06 91.2
2 1 310.9 36.16 49.51 1.46 2.49 60.2
5 263.7 25.86 36.21 2.39 3.37 66.3
10 252.1 27.44 28.78 1.19 3.38 67.8
15 231.8 31.54 40.85 1.29 2.56 70.3
20 206.1 24.65 30.95 1.95 2.29 73.6
3 1 325.5 45.03 56.55 1.49 1.56 58.4
5 312.8 36.99 38.98 91.3 1.81 60.2
10 269.3 18.85 22.48 98.4 2.85 65.6
15 242.9 20.18 35.41 1.36 3.48 68.9
20 221.1 30.25 24.58 3.65 1.27 71.7
4 1 411.5 52.24 55.74 1.31 1.39 47.4
5 390.9 99.23 173.2 1.68 2.11 50.1
10 368.9 45.57 49.02 1.27 1.52 52.8
15 298.2 35.54 36.16 51.2 2.01 61.9
20 270.2 28.93 34.19 1.82 3.17 65.5
5 1 577.1 234.7 250.9 1.82 3.45 26.6
5 545.8 224.3 257.5 1.97 12.3 30.3
10 521.1 111.9 240.8 1.95 1.06 33.4
15 503.7 183.9 242.3 1.75 2.23 35.7
20 485.6 195.9 253.8 1.87 3.59 37.9
0 200 400 600 800 10000
200
400
600
800
1000
1200
c /θ
, M
C , M
R2=0.997 R2=0.961 R2=0.998 R2=0.993
25oC 35oC 45oC 55oC
Fig. 4 Langmuir adsorption isotherm of compound (1) on Al–Si
surface in 1 M HCl at different temperatures
11 Page 8 of 16 J Bio Tribo Corros (2016) 2:11
123
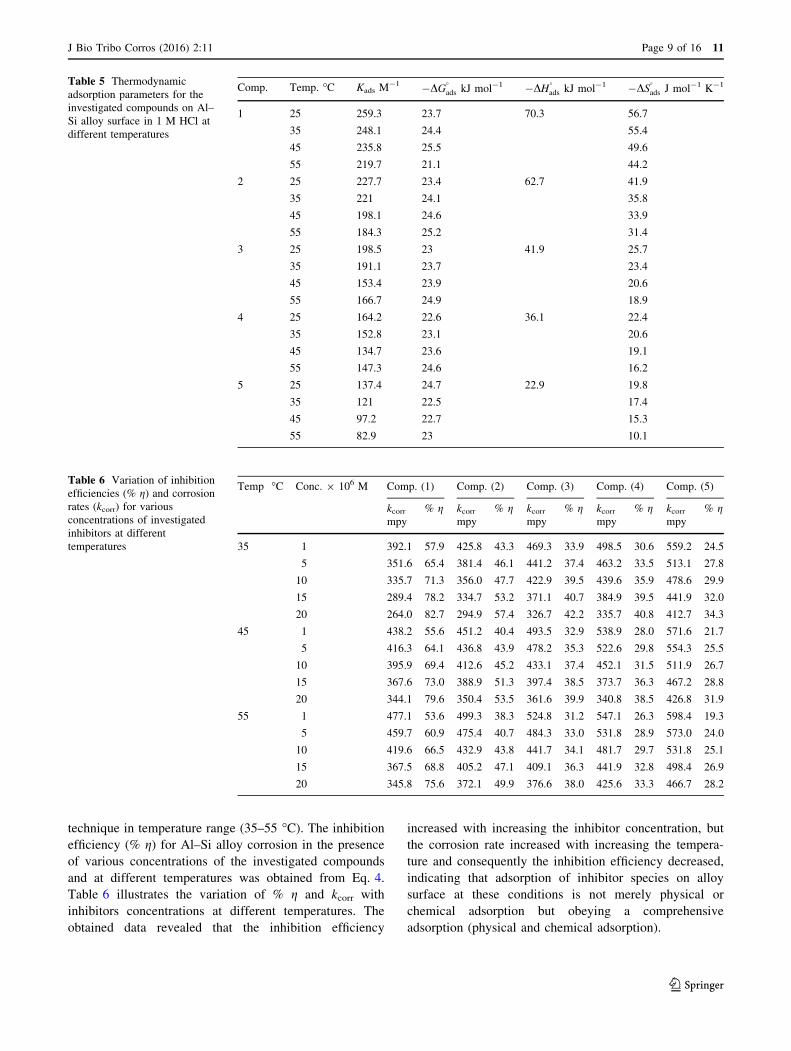
technique in temperature range (35–55 �C). The inhibition
efficiency (% g) for Al–Si alloy corrosion in the presence
of various concentrations of the investigated compounds
and at different temperatures was obtained from Eq. 4.
Table 6 illustrates the variation of % g and kcorr with
inhibitors concentrations at different temperatures. The
obtained data revealed that the inhibition efficiency
increased with increasing the inhibitor concentration, but
the corrosion rate increased with increasing the tempera-
ture and consequently the inhibition efficiency decreased,
indicating that adsorption of inhibitor species on alloy
surface at these conditions is not merely physical or
chemical adsorption but obeying a comprehensive
adsorption (physical and chemical adsorption).
Table 6 Variation of inhibition
efficiencies (% g) and corrosion
rates (kcorr) for various
concentrations of investigated
inhibitors at different
temperatures
Temp �C Conc. 9 106 M Comp. (1) Comp. (2) Comp. (3) Comp. (4) Comp. (5)
kcorr
mpy
% g kcorr
mpy
% g kcorr
mpy
% g kcorr
mpy
% g kcorr
mpy
% g
35 1 392.1 57.9 425.8 43.3 469.3 33.9 498.5 30.6 559.2 24.5
5 351.6 65.4 381.4 46.1 441.2 37.4 463.2 33.5 513.1 27.8
10 335.7 71.3 356.0 47.7 422.9 39.5 439.6 35.9 478.6 29.9
15 289.4 78.2 334.7 53.2 371.1 40.7 384.9 39.5 441.9 32.0
20 264.0 82.7 294.9 57.4 326.7 42.2 335.7 40.8 412.7 34.3
45 1 438.2 55.6 451.2 40.4 493.5 32.9 538.9 28.0 571.6 21.7
5 416.3 64.1 436.8 43.9 478.2 35.3 522.6 29.8 554.3 25.5
10 395.9 69.4 412.6 45.2 433.1 37.4 452.1 31.5 511.9 26.7
15 367.6 73.0 388.9 51.3 397.4 38.5 373.7 36.3 467.2 28.8
20 344.1 79.6 350.4 53.5 361.6 39.9 340.8 38.5 426.8 31.9
55 1 477.1 53.6 499.3 38.3 524.8 31.2 547.1 26.3 598.4 19.3
5 459.7 60.9 475.4 40.7 484.3 33.0 531.8 28.9 573.0 24.0
10 419.6 66.5 432.9 43.8 441.7 34.1 481.7 29.7 531.8 25.1
15 367.5 68.8 405.2 47.1 409.1 36.3 441.9 32.8 498.4 26.9
20 345.8 75.6 372.1 49.9 376.6 38.0 425.6 33.3 466.7 28.2
Table 5 Thermodynamic
adsorption parameters for the
investigated compounds on Al–
Si alloy surface in 1 M HCl at
different temperatures
Comp. Temp. �C Kads M-1 �DG�
ads kJ mol-1 �DH�
ads kJ mol-1 �DS�
ads J mol-1 K-1
1 25 259.3 23.7 70.3 56.7
35 248.1 24.4 55.4
45 235.8 25.5 49.6
55 219.7 21.1 44.2
2 25 227.7 23.4 62.7 41.9
35 221 24.1 35.8
45 198.1 24.6 33.9
55 184.3 25.2 31.4
3 25 198.5 23 41.9 25.7
35 191.1 23.7 23.4
45 153.4 23.9 20.6
55 166.7 24.9 18.9
4 25 164.2 22.6 36.1 22.4
35 152.8 23.1 20.6
45 134.7 23.6 19.1
55 147.3 24.6 16.2
5 25 137.4 24.7 22.9 19.8
35 121 22.5 17.4
45 97.2 22.7 15.3
55 82.9 23 10.1
J Bio Tribo Corros (2016) 2:11 Page 9 of 16 11
123
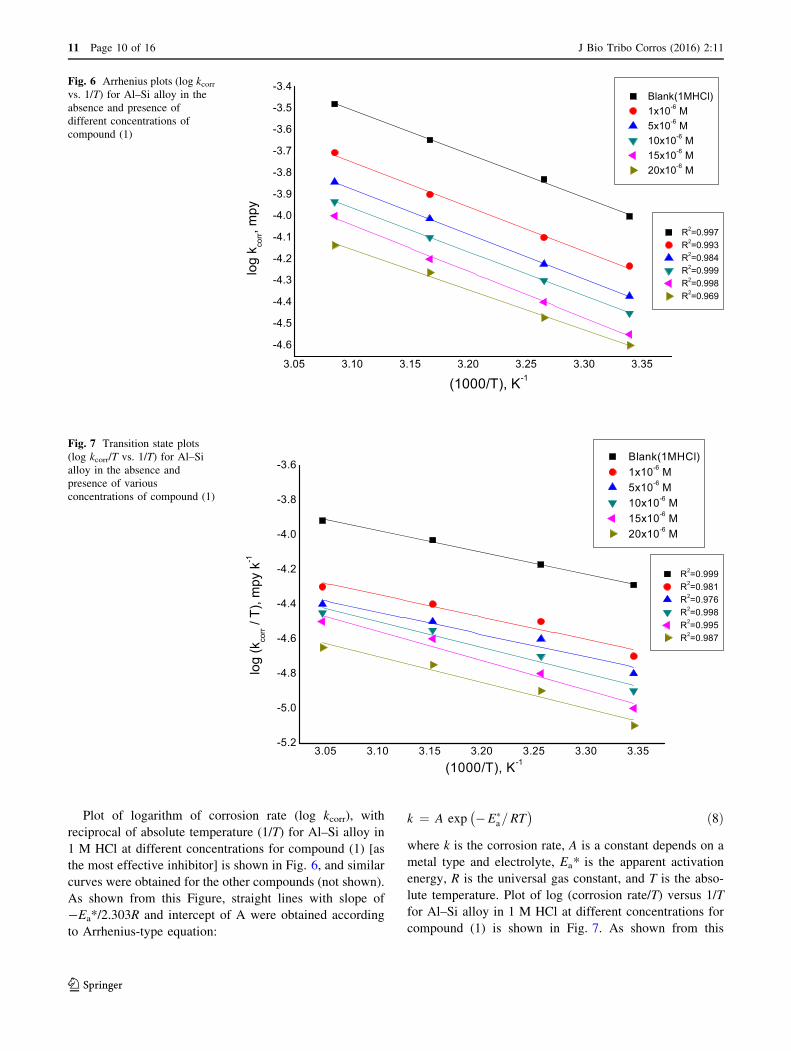
Plot of logarithm of corrosion rate (log kcorr), with
reciprocal of absolute temperature (1/T) for Al–Si alloy in
1 M HCl at different concentrations for compound (1) [as
the most effective inhibitor] is shown in Fig. 6, and similar
curves were obtained for the other compounds (not shown).
As shown from this Figure, straight lines with slope of
-Ea*/2.303R and intercept of A were obtained according
to Arrhenius-type equation:
k ¼ A exp �E�a=RT
� �ð8Þ
where k is the corrosion rate, A is a constant depends on a
metal type and electrolyte, Ea* is the apparent activation
energy, R is the universal gas constant, and T is the abso-
lute temperature. Plot of log (corrosion rate/T) versus 1/T
for Al–Si alloy in 1 M HCl at different concentrations for
compound (1) is shown in Fig. 7. As shown from this
3.05 3.10 3.15 3.20 3.25 3.30 3.35
-4.6
-4.5
-4.4
-4.3
-4.2
-4.1
-4.0
-3.9
-3.8
-3.7
-3.6
-3.5
-3.4
log
k corr, m
py
(1000/T), K-1
R2=0.997 R2=0.993 R2=0.984 R2=0.999 R2=0.998 R2=0.969
Blank(1MHCl) 1x10⁻⁶ M 5x10⁻⁶ M 10x10-6 M 15x10-6 M 20x10-6 M
Fig. 6 Arrhenius plots (log kcorr
vs. 1/T) for Al–Si alloy in the
absence and presence of
different concentrations of
compound (1)
3.05 3.10 3.15 3.20 3.25 3.30 3.35-5.2
-5.0
-4.8
-4.6
-4.4
-4.2
-4.0
-3.8
-3.6
(1000/T), K-1
log
(kco
rr /
T), m
py k
-1
R2=0.999 R2=0.981 R2=0.976 R2=0.998 R2=0.995 R2=0.987
Blank(1MHCl) 1x10⁻⁶ M 5x10⁻⁶ M 10x10-6 M 15x10-6 M 20x10-6 M
Fig. 7 Transition state plots
(log kcorr/T vs. 1/T) for Al–Si
alloy in the absence and
presence of various
concentrations of compound (1)
11 Page 10 of 16 J Bio Tribo Corros (2016) 2:11
123
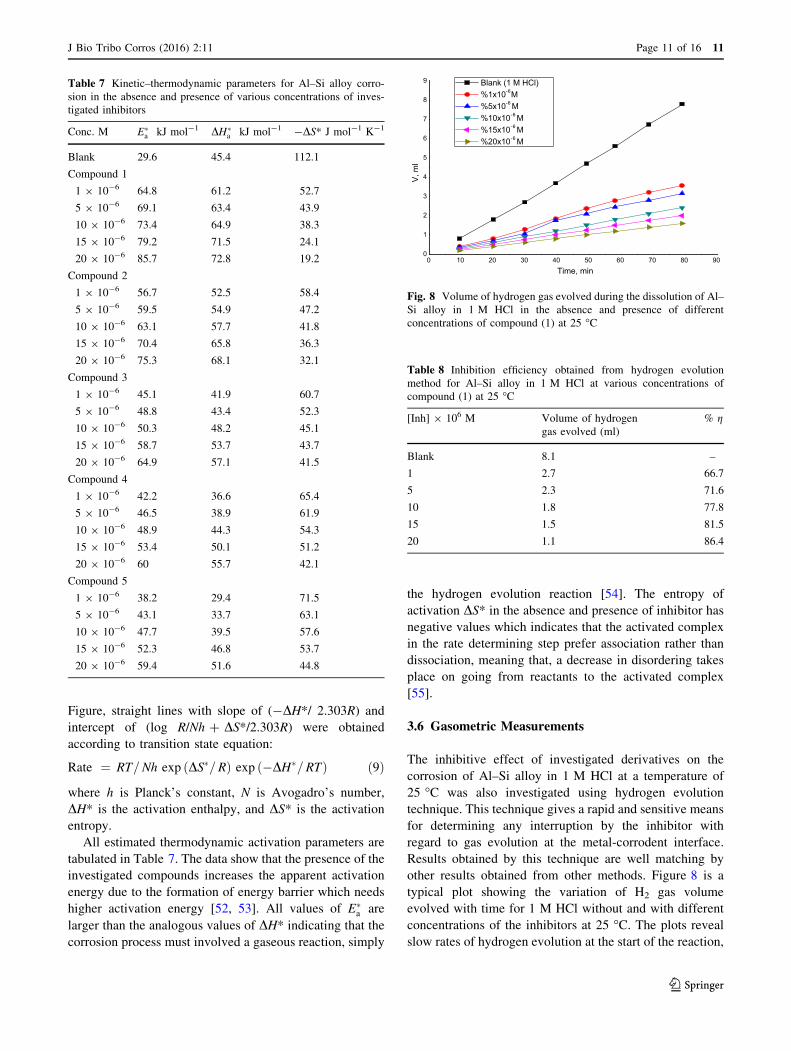
Figure, straight lines with slope of (-DH*/ 2.303R) and
intercept of (log R/Nh ? DS*/2.303R) were obtained
according to transition state equation:
Rate ¼ RT=Nh exp ðDS�=RÞ exp ð�DH�=RTÞ ð9Þ
where h is Planck’s constant, N is Avogadro’s number,
DH* is the activation enthalpy, and DS* is the activation
entropy.
All estimated thermodynamic activation parameters are
tabulated in Table 7. The data show that the presence of the
investigated compounds increases the apparent activation
energy due to the formation of energy barrier which needs
higher activation energy [52, 53]. All values of E�a are
larger than the analogous values of DH* indicating that the
corrosion process must involved a gaseous reaction, simply
the hydrogen evolution reaction [54]. The entropy of
activation DS* in the absence and presence of inhibitor has
negative values which indicates that the activated complex
in the rate determining step prefer association rather than
dissociation, meaning that, a decrease in disordering takes
place on going from reactants to the activated complex
[55].
3.6 Gasometric Measurements
The inhibitive effect of investigated derivatives on the
corrosion of Al–Si alloy in 1 M HCl at a temperature of
25 �C was also investigated using hydrogen evolution
technique. This technique gives a rapid and sensitive means
for determining any interruption by the inhibitor with
regard to gas evolution at the metal-corrodent interface.
Results obtained by this technique are well matching by
other results obtained from other methods. Figure 8 is a
typical plot showing the variation of H2 gas volume
evolved with time for 1 M HCl without and with different
concentrations of the inhibitors at 25 �C. The plots reveal
slow rates of hydrogen evolution at the start of the reaction,
0 10 20 30 40 50 60 70 80 900
1
2
3
4
5
6
7
8
9 Blank (1 M HCl) %1x10⁻⁶M %5x10⁻⁶ M %10x10-6 M %15x10-6 M %20x10-6 M
V, m
l
Time, min
Fig. 8 Volume of hydrogen gas evolved during the dissolution of Al–
Si alloy in 1 M HCl in the absence and presence of different
concentrations of compound (1) at 25 �C
Table 7 Kinetic–thermodynamic parameters for Al–Si alloy corro-
sion in the absence and presence of various concentrations of inves-
tigated inhibitors
Conc. M E�a kJ mol-1 DH�
a kJ mol-1 -DS* J mol-1 K-1
Blank 29.6 45.4 112.1
Compound 1
1 9 10-6 64.8 61.2 52.7
5 9 10-6 69.1 63.4 43.9
10 9 10-6 73.4 64.9 38.3
15 9 10-6 79.2 71.5 24.1
20 9 10-6 85.7 72.8 19.2
Compound 2
1 9 10-6 56.7 52.5 58.4
5 9 10-6 59.5 54.9 47.2
10 9 10-6 63.1 57.7 41.8
15 9 10-6 70.4 65.8 36.3
20 9 10-6 75.3 68.1 32.1
Compound 3
1 9 10-6 45.1 41.9 60.7
5 9 10-6 48.8 43.4 52.3
10 9 10-6 50.3 48.2 45.1
15 9 10-6 58.7 53.7 43.7
20 9 10-6 64.9 57.1 41.5
Compound 4
1 9 10-6 42.2 36.6 65.4
5 9 10-6 46.5 38.9 61.9
10 9 10-6 48.9 44.3 54.3
15 9 10-6 53.4 50.1 51.2
20 9 10-6 60 55.7 42.1
Compound 5
1 9 10-6 38.2 29.4 71.5
5 9 10-6 43.1 33.7 63.1
10 9 10-6 47.7 39.5 57.6
15 9 10-6 52.3 46.8 53.7
20 9 10-6 59.4 51.6 44.8
Table 8 Inhibition efficiency obtained from hydrogen evolution
method for Al–Si alloy in 1 M HCl at various concentrations of
compound (1) at 25 �C
[Inh] 9 106 M Volume of hydrogen
gas evolved (ml)
% g
Blank 8.1 –
1 2.7 66.7
5 2.3 71.6
10 1.8 77.8
15 1.5 81.5
20 1.1 86.4
J Bio Tribo Corros (2016) 2:11 Page 11 of 16 11
123
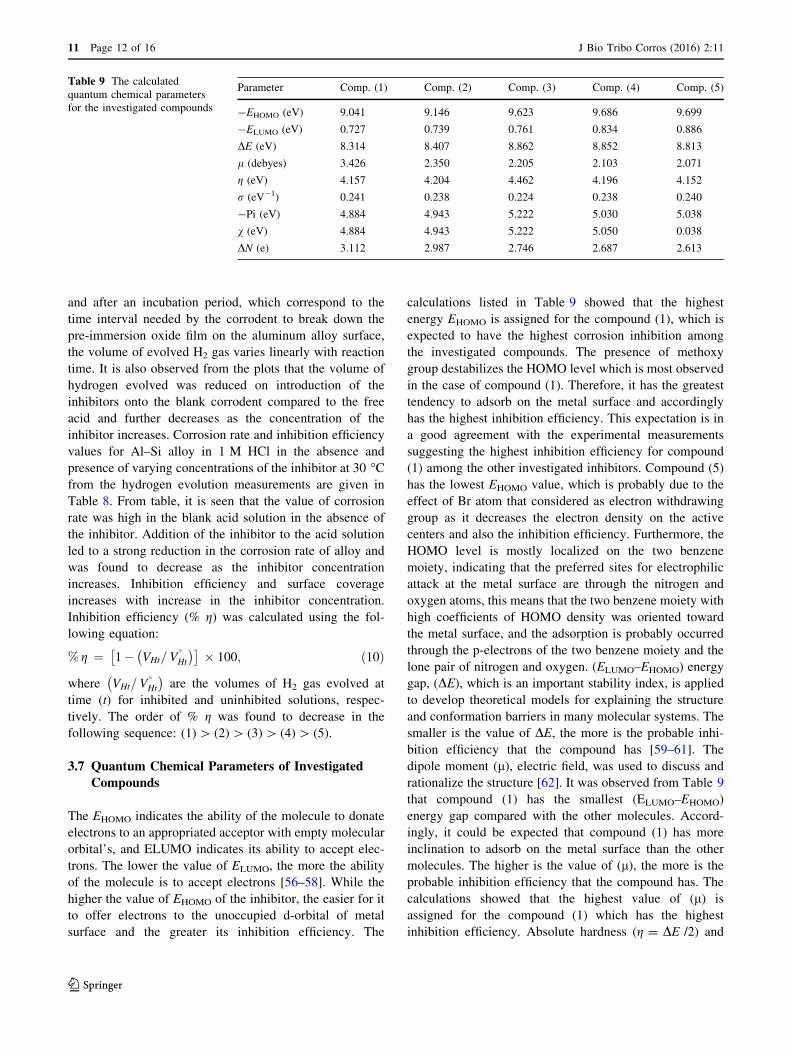
and after an incubation period, which correspond to the
time interval needed by the corrodent to break down the
pre-immersion oxide film on the aluminum alloy surface,
the volume of evolved H2 gas varies linearly with reaction
time. It is also observed from the plots that the volume of
hydrogen evolved was reduced on introduction of the
inhibitors onto the blank corrodent compared to the free
acid and further decreases as the concentration of the
inhibitor increases. Corrosion rate and inhibition efficiency
values for Al–Si alloy in 1 M HCl in the absence and
presence of varying concentrations of the inhibitor at 30 �Cfrom the hydrogen evolution measurements are given in
Table 8. From table, it is seen that the value of corrosion
rate was high in the blank acid solution in the absence of
the inhibitor. Addition of the inhibitor to the acid solution
led to a strong reduction in the corrosion rate of alloy and
was found to decrease as the inhibitor concentration
increases. Inhibition efficiency and surface coverage
increases with increase in the inhibitor concentration.
Inhibition efficiency (% g) was calculated using the fol-
lowing equation:
% g ¼ 1� VHt=V�
Ht
� �� �� 100; ð10Þ
where VHt=V�Ht
� �are the volumes of H2 gas evolved at
time (t) for inhibited and uninhibited solutions, respec-
tively. The order of % g was found to decrease in the
following sequence: (1)[ (2)[ (3)[ (4)[ (5).
3.7 Quantum Chemical Parameters of Investigated
Compounds
The EHOMO indicates the ability of the molecule to donate
electrons to an appropriated acceptor with empty molecular
orbital’s, and ELUMO indicates its ability to accept elec-
trons. The lower the value of ELUMO, the more the ability
of the molecule is to accept electrons [56–58]. While the
higher the value of EHOMO of the inhibitor, the easier for it
to offer electrons to the unoccupied d-orbital of metal
surface and the greater its inhibition efficiency. The
calculations listed in Table 9 showed that the highest
energy EHOMO is assigned for the compound (1), which is
expected to have the highest corrosion inhibition among
the investigated compounds. The presence of methoxy
group destabilizes the HOMO level which is most observed
in the case of compound (1). Therefore, it has the greatest
tendency to adsorb on the metal surface and accordingly
has the highest inhibition efficiency. This expectation is in
a good agreement with the experimental measurements
suggesting the highest inhibition efficiency for compound
(1) among the other investigated inhibitors. Compound (5)
has the lowest EHOMO value, which is probably due to the
effect of Br atom that considered as electron withdrawing
group as it decreases the electron density on the active
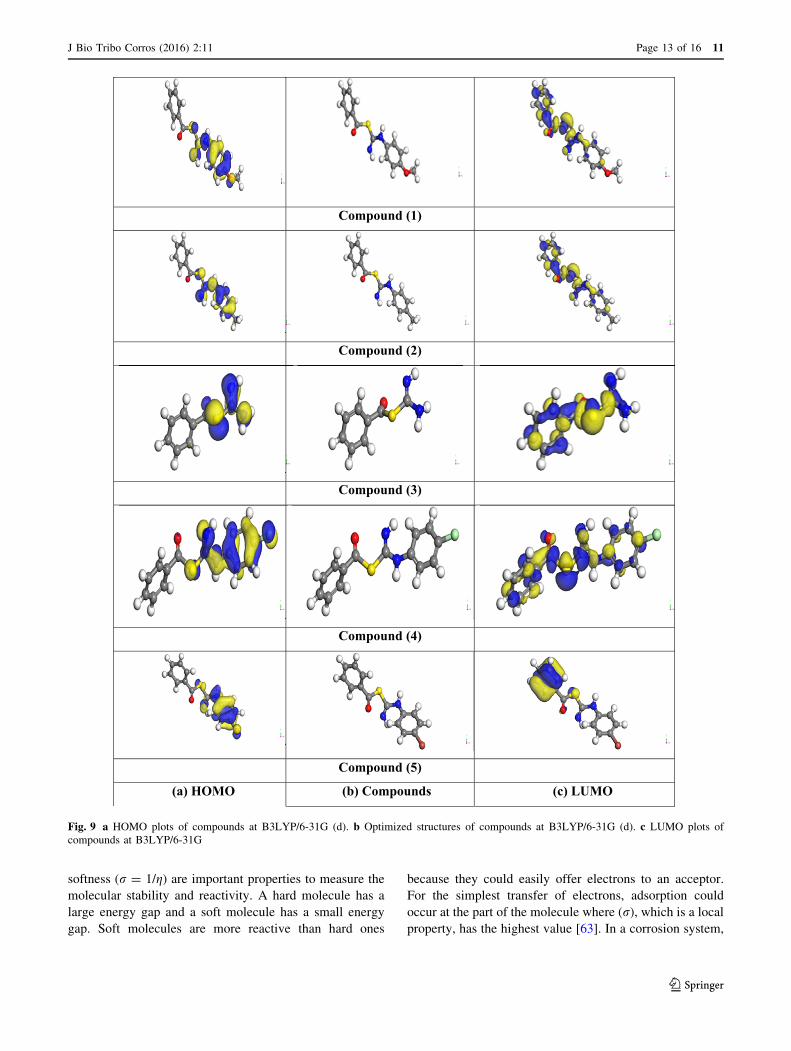
centers and also the inhibition efficiency. Furthermore, the
HOMO level is mostly localized on the two benzene
moiety, indicating that the preferred sites for electrophilic
attack at the metal surface are through the nitrogen and
oxygen atoms, this means that the two benzene moiety with
high coefficients of HOMO density was oriented toward
the metal surface, and the adsorption is probably occurred
through the p-electrons of the two benzene moiety and the
lone pair of nitrogen and oxygen. (ELUMO–EHOMO) energy
gap, (DE), which is an important stability index, is applied
to develop theoretical models for explaining the structure
and conformation barriers in many molecular systems. The
smaller is the value of DE, the more is the probable inhi-
bition efficiency that the compound has [59–61]. The
dipole moment (l), electric field, was used to discuss and
rationalize the structure [62]. It was observed from Table 9
that compound (1) has the smallest (ELUMO–EHOMO)
energy gap compared with the other molecules. Accord-
ingly, it could be expected that compound (1) has more
inclination to adsorb on the metal surface than the other
molecules. The higher is the value of (l), the more is the
probable inhibition efficiency that the compound has. The
calculations showed that the highest value of (l) is
assigned for the compound (1) which has the highest
inhibition efficiency. Absolute hardness (g = DE /2) and
Table 9 The calculated
quantum chemical parameters
for the investigated compounds
Parameter Comp. (1) Comp. (2) Comp. (3) Comp. (4) Comp. (5)
-EHOMO (eV) 9.041 9.146 9.623 9.686 9.699
-ELUMO (eV) 0.727 0.739 0.761 0.834 0.886
DE (eV) 8.314 8.407 8.862 8.852 8.813
l (debyes) 3.426 2.350 2.205 2.103 2.071
g (eV) 4.157 4.204 4.462 4.196 4.152
r (eV-1) 0.241 0.238 0.224 0.238 0.240
-Pi (eV) 4.884 4.943 5.222 5.030 5.038
v (eV) 4.884 4.943 5.222 5.050 0.038
DN (e) 3.112 2.987 2.746 2.687 2.613
11 Page 12 of 16 J Bio Tribo Corros (2016) 2:11
123
softness (r = 1/g) are important properties to measure the
molecular stability and reactivity. A hard molecule has a
large energy gap and a soft molecule has a small energy
gap. Soft molecules are more reactive than hard ones
because they could easily offer electrons to an acceptor.
For the simplest transfer of electrons, adsorption could
occur at the part of the molecule where (r), which is a local
property, has the highest value [63]. In a corrosion system,
Compound (1)
Compound (2)
Compound (3)
Compound (4)
Compound (5)
(a) HOMO (b) Compounds (c) LUMO
Fig. 9 a HOMO plots of compounds at B3LYP/6-31G (d). b Optimized structures of compounds at B3LYP/6-31G (d). c LUMO plots of
compounds at B3LYP/6-31G
J Bio Tribo Corros (2016) 2:11 Page 13 of 16 11
123
the inhibitor acts as a Lewis base while the metal acts as a
Lewis acid. Bulk metals are soft acids and thus soft base
inhibitors are most effective for acidic corrosion of those
metals. Accordingly, it is concluded that inhibitor with the
highest (r) value has the highest inhibition efficiency that
found in compound (1), which is in a good agreement with
the experimental data. This is also confirmed from the
calculated inhibition efficiencies of molecules as a function
of the inhibitor chemical potential (Pi = (EHOMO ?
ELUMO)/2). The relatively good agreement of (Pi) and
(DN) with the inhibition efficiency could be related to the
fact that any factor causing an increase in chemical
potential would enhance the electronic releasing power of
inhibitor molecule. Finally, from Table 9, we found that
the EHOMO and the ELUMO changed regularly, while the
DE decreased with increasing the inhibition efficiency. The
inhibition efficiency is related with the changes of the
EHOMO and ELUMO, which suggested that the inhibitors
were perhaps either the acceptor or the donor of the elec-
tron. That is, there was electron transferring in the inter-
action between the inhibitor molecules and the metal
surface. The DE decreased with increasing the inhibition
efficiency, this indicates that the more unstable of the
inhibitors, the stronger interaction between the inhibitors
and the metal surface. Thus, the interactions are probably
physical adsorption, and the interactions between the
inhibitors and the metal surface might be ascribed to the
hyper conjugation interactions –p stacking [64].From the
results obtained, we found that the order of % g decreases
in the following sequence: (1)[ (2)[ (3)[ (4)[ (5),
and this agree with the results obtained from the experi-
mental measurements (Fig. 9).
3.8 Mechanism of Corrosion Inhibition
In general, these inhibitors may be adsorbed on aluminum
alloy surface in their neutral or protonated forms (cationic
form). Since it is well known that the aluminum surface is
negatively charged in acid solution [65], it is easier for the
protonated molecules to approach the negatively charged
aluminum alloy surface due to the electrostatic attraction. In
case of adsorption, this involves the displacement of water
molecules from the aluminum surface and sharing electrons
between the hetero-atoms and aluminum. Also, the inhibitor
molecules can absorb on aluminum surface on the basis of
donor-acceptor interactions between p-electrons of aromatic
rings and vacant p-orbitals of surface aluminum atoms. Thus,
we can conclude that inhibition of Al–Si alloy corrosion in
HCl is mainly due to electrostatic interaction. The order of
decreasing inhibition efficiency of the compounds from all
techniques used is: (1)[ (2)[ (3)[ (4)[ (5). Inhibitor
(1) is the most efficient inhibitor because of (i) the presence
of highly electron donating p-OCH3 group (with Hammett
constant r = -0.27) [66] which enhances the delocalized p-
electrons on the molecule (ii) also may add an additional
active center to the molecule due to its oxygen atom. Inhi-
bitor (2) comes after inhibitor (1) in inhibition efficiency,
because the presence of p-CH3 with (r = -0.17) which
contribute less electron density to the molecule and also the
absence of oxygen atom so gives less active centers. Inhibitor
(3) comes after compounds 1 and 2 in inhibition efficiency,
this may be due to the absence of substituent group in para
position and presence of H atom (r = 0.0) that contributes
no charge density to the molecule. For inhibitors (4 and 5),
they are least effective inhibitors because they include p-Cl
(?0.22) and p-Br (?0.23) groups which act as electron
withdrawing groups; so they decrease the electron density on
the active centers, and hence, the inhibition efficiency will
decrease. According to the previous discussion, the nature of
substituted group, whether electron donating or withdrawing
reflects its effect on the inhibition efficiency.
4 Conclusions
The investigated compounds show excellent performance
as corrosion inhibitors in HCl solution. The inhibition
efficiency of investigated derivatives follows the order:
1[ 2[ 3[ 4[ 5. Polarization studies showed that
investigated derivatives behave as mixed-type inhibitors
for Al–Si alloy in HCl solution. Impedance studies indi-
cated that Rct values increased, while Cdl values decreased
in the presence of the inhibitors. The adsorption of the
investigated inhibitors was found to follow the Langmuir
adsorption isotherm. The % g obtained from polarization
curves, electrochemical impedance spectroscopy, electro-
chemical frequency modulation, and hydrogen evolution
method is in a good agreement.
References
1. Rosliza R, Nik WW, Senin HB (2008) The effect of inhibitor on
the corrosion of aluminum alloys in acidic solutions. Mater Chem
Phys 107:281–288
2. Obot IB, Obi-Egbedi NO (2008) Fluconazole as an inhibitor for
aluminum corrosion in 0.1 M HCl. Colloids Surf A 330:207–212
3. Aytac A (2010) Cu(II), Co(II) and Ni(II) complexes of –Br and –
OCH2CH3 substituted Schiff bases as corrosion inhibitors for
aluminum in acidic media. J Mater Sci 45:6812–6818
4. Foad El-Sherbini E, Abd-El-Wahab SM, Deyab MA (2003)
Studies on corrosion inhibition of aluminum in 1.0 M HCl and
1.0 M H2SO4 solutions by ethoxylated fatty acids. Mater Chem
Phys 82:631–637
5. Lukovits I, Kalman E, Zucchi F (2001) Corrosion inhibitors—
correlation between electronic structure and efficiency. Corrosion
57:3–9
6. Brett CMA, Gomes IAR, Martins JPS (1994) The electrochemi-
cal behaviour and corrosion of aluminum in chloride media. The
effect of inhibitor anions. Corros Sci 36:915–923
11 Page 14 of 16 J Bio Tribo Corros (2016) 2:11
123
7. El Abedin SZ (2001) Role of chromate, molybdate and tungstate
anions on the inhibition of aluminiumin chloride solutions. J Appl
Electrochem 31:711–718
8. Mousavifard SM, Nouri PMM, Attar MM, Ramezanzadeh B
(2013) The effects of zinc aluminum phosphate (ZPA) and zinc
aluminum polyphosphate (ZAPP) mixtures on corrosion inhibi-
tion performance of epoxy/polyamide coating. J Ind Eng Chem
19:1031–1039
9. Sherif EM, Park S-M (2005) Effects of 1,5-naphthalenediol on
aluminum corrosion as a corrosion inhibitor in 0.50 M NaCl.
J Electrochem Soc 152:205–211
10. Natishan PM, McCafferty E, Hubler GK (1988) Surface charge
considerations in the pitting of ion-implanted aluminum. J Elec-
trochem Soc 135:321–327
11. Sherif ESM (2011) Corrosion and corrosion inhibition of aluminum
in Arabian Gulf seawater and sodium chloride solutions by 3-amino-
5- mercapto-1,2,4-triazole. Int J Electrochem Sci 6:479–1492
12. El-Etre AY (2001) Inhibition of acid corrosion of aluminum
using vanillin. Corros Sci 43:1031–1039
13. Ogurtsov NA, Pud AA, Kamarchik P, Shapoval GS (2004)
Corrosion inhibition of aluminum alloy in chloride mediums by
undoped and doped forms of polyaniline. Synth Met 143:43–47
14. Saidman SB, Bessone JB (2002) Electrochemical preparation and
characterisation of polypyrrole on aluminium in aqueous solu-
tion. J Electroanal Chem 521:87–94
15. Sherif E-SM, Almajid AA (2010) Surface protection of copper in
aerated 3.5 % sodium chloride solutions by 3-amino-5-mercapto-
1,2,4-triazole as a copper corrosion inhibitor. J Appl Electrochem
40:1555–1562
16. Sherif E-SM (2012) Electrochemical and gravimetric study on the
corrosion and corrosion inhibition of pure copper in sodium
chloride solutions by two azole derivatives. Int J Electrochem Sci
7:1482–1859
17. Sherif E-SM (2012) Corrosion behavior of copper in 0.50 M
hydrochloric acid pickling solutions and its inhibition by
3-amino-1,2,4-triazole and 3-Amino-5-mercapto-1,2,4-triazole.
Int J Electrochem Sci 7:1884–1897
18. Sherif E-SM, Erasmus RM, Comins JD (2007) Corrosion of copper
in aerated acidic pickling solutions and its inhibition by 3-amino-
1,2,4- triazole-5-thiol. J Colloid Interface Sci 306:96–104
19. Sherif E-SM, Erasmus RM, Comins JD (2007) Corrosion of
copper in aerated synthetic sea water solutions and its inhibition
by 3-amino-1,2,4- triazole. J Colloid Interface Sci 309:470–477
20. Sherif E-SM, Erasmus RM, Comins JD (2007) Effects of
3-amino-1,2,4-triazole on the inhibition of copper corrosion in
acidic chloride solutions. J Colloid Interface Sci 311:144–151
21. Sherif ESM, Erasmus RM, Comins JD (2009) Inhibition of cor-
rosion processes on copper in aerated sodium chloride solutions
by 5-(3- aminophenyl)-tetrazole. J Appl Electrochem 39:83–91
22. Sherif ESM, Erasmus RM, Comins JD (2008) Inhibition of
copper corrosion in acidic chloride pickling solutions by 5-(3-
aminophenyl)-tetrazole as a corrosion inhibitor. Corros Sci
50:3439–3445
23. Sherif EM, Park S-M (2006) Effects of 2-amino-5-ethylthio-1,3,4-
thiadiazole on copper corrosion as a corrosion inhibitor in aerated
acidic pickling solutions. Electrochim Acta 51:6556–6562
24. Sherif EM, Park S-M (2006) 2-Amino-5-ethyl-1,3,4-thiadiazole
as a corrosion inhibitor for copper in 3.0 % NaClsolutions.
Corros Sci 48:4065–4079
25. Sherif E-SM (2006) Effects of 2-amino-5-(ethylthio)-1,3,4-thia-
diazole on copper corrosion as a corrosion inhibitor in 3 % NaCl
solutions. Appl Surf Sci 252:8615–8623
26. Sherif E-SM (2011) Corrosion and corrosion inhibition of pure
iron in neutral chloride solutions by 1,10-thiocarbonyldiimida-
zole. Int J Electrochem Sci 6:3077–3092
27. Sherif E-SM (2011) Effects of 5-(3-Aminophenyl)-tetrazole as a
corrosion inhibitor on the corrosion of Mg/Mn alloy in Arabian
Gulf water. Int J Electrochem Sci 6:5372–5387
28. Sherif E-SM, Ahmed AH (2010) Synthesizing new hydrazone
derivatives and studying their effects on the inhibition of copper
corrosion in sodium chloride solutions. Synth React Inorg Metal
Org Nano Metal Chem 40:365–372
29. Sherif ESM (2012) Effects of exposure time on the anodic dis-
solution of Monel-400 in aerated stagnant sodium chloride
solutions. J Solid State Electrochem 16:891–899
30. Sherif ESM (2011) Effects of 5-(3-aminophenyl)-tetrazole on the
inhibition of unalloyed iron corrosion in aerated 3.5 % sodium
chloride solutions as a corrosion inhibitor. Mater Chem Phys
129:961–967
31. Sherif ESM (2010) Corrosion mitigation of copper in acidic
chloride pickling solutions by 2-amino-5-ethyl-1,3,4-thiadiazole.
J Mater Eng Perform 19:873–879
32. Brett CMA, Gomes IAR, Martins JPS (1994) The electrochemi-
cal behavior and corrosion of aluminium in chloride media. The
effect of inhibitor anions. Corros Sci 36:915–923
33. Riggs OL Jr, Nathan CC (eds) (1973) Corrosion inhibitors, 2nd
edn. NACE, Houston
34. Pearson RG (1988) Absolute electronegativity and hardness:
application to inorganic chemistry. Inorg Chem 27:734–740
35. Onuchukwu AI (1998) The kinetic and mechanism of hydrogen
evolution on corroding aluminum alloy in alkaline medium.
Mater Chem Phys 25:227–235
36. Umoren SA, Obot IB, Ebenso EE, Okafor PC, Ogbobe O, Oguzie
EE (2006) Gum Arabic as potential corrosion inhibitor for alu-
minum in alkaline medium and its adsorption characteristics. Anti
Corros Methods Mater 53:277–282
37. Bockris JOM, Drazic D (1962) The kinetics of deposition and
dissolution of iron: effect of alloying impurities. Electrochim
Acta 7:293–313
38. Fouda AS, Al-Sarawy A, El-Katori E (2010) Thiazole derivatives
as corrosion inhibitors for C-steel in sulphuric acid solution. Eur J
Chem 1(4):312–318
39. Li X, Deng S, Fu H, Mu G (2009) Inhibition effect of 6-benzy-
laminopurine on the corrosion of cold rolled steel in H2SO4
solution. Corros Sci 51:620
40. Bessone J, Mayer C, Tuttner K, Lorenz WJ (1983) AC-impe-
dance measurements on aluminum barrier type oxide films.
Electrochim Acta 28:171–175
41. Fouda AS, El-TaibHeakal F, Radwan MS (2009) Role of some
thiazole derivatives as inhibitors for the corrosion of Carbon steel
in H2SO4. J Appl Electrochem 39:391–402
42. Fouda AS, Mostafa HA, El-TaibHeakal F, Elawady GY (2005)
Synergistic influence of iodide ions on the inhibition of corrosion
of Carbon steel in sulphuric acid by some aliphatic amines.
Corros Sci 47:1988–2004
43. Bentiss F, Bouanis M, Mernari B, Traisnel M, Vezin H, Lagrenee
M (2007) Understanding the adsorption of 4H-1,2,4-triazole
derivatives on mild steel surface in molar hydrochloric acid. Appl
Surf Sci 253:3696–3704
44. Kus E, Mansfeld F (2006) An evaluation of the electrochemical
frequency modulation (EFM) technique. Corros Sci 48:965–979
45. McCafferty E, Leidheiser H (eds) (1979) Corrosion control by
coating. Science Press, Princeton, p 279
46. Oguzie EE, Ebenso EE (2006) Studies on the corrosion inhibiting
effect of Congo red dye-halide mixtures. Pigment Resin Technol
1:30–35
47. Villamil RFV, Corio P, Rubin JC, Agostinho SML (1999) Effect
of sodium dodecylsulfate on copper corrosion in sulfuric acid
media in the absence and presence of benzotriazole. J Electroanal
Chem 472:112–119
J Bio Tribo Corros (2016) 2:11 Page 15 of 16 11
123
48. Kliskic M, Radosevic J, Gridic S (1997) Pyridine and its
derivatives as inhibitors of aluminium corrosion in chloride
solution. J Appl Electrochem 27:947–952
49. Aramaki K, Hackerman N (1969) Inhibition mechanism of med-
ium-sized olymethyleneimine. J Electrochem Soc 116:568–574
50. Tang L, Li X, Li L, Mu G, Liu G (2006) The effect of 1-(2-
pyridylazo)-2-naphthol on the corrosion of cold rolled steel in
acid media: part 2: inhibitive action in 0.5 M sulfuric acid. Mater
Chem Phys 97:301–307
51. Donahuce FM, Noor K (1965) Theory of organic corrosion
inhibitors: adsorption and linear free energy relationships elec-
tron. J Electrochem Soc 112:886–891
52. Okafor PC, Ikpi ME, Uwah IE, Ebenso EE, Ekpe UJ, Umoren SA
(2008) Inhibitory action of Phyllanthus amarus extracts on the
corrosion of mild steel in acidic media. Corros Sci 50:2310–2317
53. Oguzie EE (2007) Corrosion inhibition of aluminum in acidic and
alkaline media by Sansevieria trifasciata extract. Corros Sci
49:1527–1539
54. Fouda AS, Al Sarawy AA, El Katori EE (2006) Pyrazolone
derivatives as corrosion inhibitors for C-steel in hydrochloric acid
solution. Desalination 201:1–13
55. Martinez S, Matikos-Hukovic M (2003) A nonlinear kinetic
model introduced for the corrosion inhibitive properties of some
organic inhibitors. J Appl Electrochem 33:1137–1147
56. Gece G (2008) The use of quantum chemical methods in corro-
sion inhibitor studies. Corros Sci 50:2981
57. Zarrouka AE, Hammouti B, Dafali A, Bouachrine M, Zarrok H,
Boukhris S, Al-Deyab SS (2014) A theoretical study on the
inhibition efficiencies of some quinoxalines as corrosion inhibi-
tors of copper in nitric acid. J Saudi Chem. Soc 18:450–455
58. Zhang DQ, Gao LW, Zhou GD (2004) Inhibition of copper
corrosion in aerated hydrochloric acid solution by heterocyclic
compounds containing a mercapto group. Corros Sci
46:3031–3040
59. Gao G, Liang C (2007) Electrochemical and DFT studies of b-
amino-alcohols as corrosion inhibitors for brass. Electrochim
Acta 52(13):4554–4559
60. Feng Y, Chen S, Guo Q, Zhang Y, Liu G (2007) Inhibition of iron
corrosion by 5,10,15,20-tetraphenylporphyrin and 5,10,15,20-te-
tra-(4-chlorophenyl) porphyrinadlayers in 0.5 M H2SO4 solu-
tions. J Electroanal Chem 602:115
61. Khalil N (2003) Quantum chemical approach of corrosion inhi-
bition. Electrochim Acta 48:2635–2645
62. Martınez S (2002) Inhibitory mechanism of mimosa tannin using
molecular modeling and substitutional adsorption isotherms.
Mater Chem Phys 77:97
63. Dinnappa RK, Mayanna SM (1982) Benzoic acid and substituted
benzoic acids as interfacial corrosion inhibitors for copper in
HClO4. J Appl Electrochem 11:111–116
64. Hammett LP (1940) Physical organic chemistry. McGraw-Hill
Book Co., New York
65. Desai MN (1972) Corrosion inhibitors for aluminum alloys. A
review on corrosion inhibitors of the alloys Al-2S, Al-3S, Al-57S,
and A165S in HCl, H2S04, HOAc, H2C204 and NaOH. Werkst U
Korros 23(6):475–482
11 Page 16 of 16 J Bio Tribo Corros (2016) 2:11
123