corporate value chain -...
TRANSCRIPT

Corporate Value Chain (Scope 3) Accounting and Reporting Standard
Supplement to the GHG Protocol Corporate Accounting and Reporting Standard
CO 2
CH 4
SF 6
N 2O
HFCs
PFCs
purchase
d ele
ctric
ity, s
team
,
heating &
coolin
g for o
wn use
purchase
d
goods and
serv
ices
capita
l goods
fuel a
nd
energy r
elate
d
activi
ties
transp
ortatio
n
and d
istrib
ution
waste
generate
d in
operatio
nsbusin
ess
trav
el
transp
ortatio
n
and d
istrib
ution
proce
ssin
g of
sold
pro
ducts
use o
f sold
product
s
end-of-l
ife
treat
ment o
f
sold
pro
ducts
lease
d assets
franch
ises
emplo
yee
com
mutin
g
lease
d assets
inve
stm
ents
com
pany
facil
ities
com
pany
vehicl
es

[02] Corporate Value Chain (Scope 3) Accounting and Reporting Standard
GHG Protocol TeamPankaj Bhatia, World Resources Institute
Cynthia Cummis, World Resources Institute
Andrea Brown, World Business Council for Sustainable Development
David Rich, World Resources Institute
Laura Draucker, World Resources Institute
Holly Lahd, World Resources Institute
Steering CommitteeGerald Rebitzer, Amcor Ltd.
Nigel Topping, Frances Way, Carbon Disclosure Project (CDP)
Graham Sinden, The Carbon Trust
H. Scott Matthews, Carnegie Mellon University
Luc Larmuseau, DNV Climate Change Services
David A. Russell, Rob Rouse, The Dow Chemical Company
Jiang Kejun, Energy Research Institute, China’s National Development and Reform Commission
Andrew Hutson, Environmental Defense Fund
Simon Aumônier, Environmental Resources Management
Ugo Pretato, Kirana Chomkhamsri, European Commission Joint Research Centre
Steven Meyers, General Electric
Sergio Galeano, Georgia Pacific, ISO TC207 U.S. Technical Advisory Group
Gregory A. Norris, Harvard University, New Earth, University of Arkansas
Klaus Radunsky, ISO 14067 Working Group Convener
Atsushi Inaba, Kogakuin University
Alison Watson, New Zealand Ministry of Agriculture and Forestry
Susan Cosper, Nick Shufro, PricewaterhouseCoopers LLP
Rasmus Priess, THEMA1 GmbH, Product Carbon Footprint World Forum
Wanda Callahan, Shell
James A. Fava, UNEP SETAC Life Cycle Initiative, Five Winds International
Matthias Finkbeiner, UNEP SETAC Life Cycle Initiative, Technische Universität Berlin
Henry King, Unilever
Susan Wickwire, John Sottong, United States Environmental Protection Agency
Maureen Nowak, United Kingdom Department of Environment, Food, and Rural Affairs
James Stanway, Miranda Ballentine, Walmart Stores Inc.

[01]
CHAPTER 02 Defining Business Goals
guidance
guidance
guidancerequirements
guidancerequirements
guidancerequirements
guidance
guidance
guidancerequirements
guidance
guidancerequirements
Table of Contents
CHAPTERS
1. Introduction 02
2. Business Goals 10
3. Summary of Steps and Requirements 18
4. Accounting and Reporting Principles 22
5. Identifying Scope 3 Emissions 26
6. Setting the Scope 3 Boundary 58
7. Collecting Data 64
8. Allocating Emissions 86
9. Setting a GHG Reduction Target and Tracking Emissions Over Time 98
10. Assurance 112
11. Reporting 118
APPENDICES
A. Accounting for Emissions from Leased Assets 124
B. Uncertainty in Scope 3 Emissions 126
C. Data Management Plan 129
Abbreviations 134
Glossary 135
References 142
Recognitions 143
guidance

Defining Business Goals02 Introduction01

[03]
Introduction
E missions of the anthropogenic greenhouse gases (GHG) that drive climate change
and its impacts around the world are growing. According to climate scientists,
global carbon dioxide emissions must be cut by as much as 85 percent below
2000 levels by 2050 to limit global mean temperature increase to 2 degrees Celsius
above pre-industrial levels.1 Temperature rise above this level will produce increasingly
unpredictable and dangerous impacts for people and ecosystems. As a result, the need to
accelerate efforts to reduce anthropogenic GHG emissions is increasingly urgent. Existing
government policies will not sufficiently solve the problem. Leadership and innovation
from business is vital to making progress.
Corporate action in this arena also makes good business
sense. By addressing GHG emissions, companies can
identify opportunities to bolster their bottom line,
reduce risk, and discover competitive advantages. As
impacts from climate change become more frequent
and prominent, governments are expected to set new
policies and provide additional market-based incentives
to drive significant reductions in emissions. These new
policy and market drivers will direct economic growth
on a low-carbon trajectory. Businesses need to start
planning for this transition now as they make decisions
that will lock in their investments for years to come.
An effective corporate climate change strategy requires
a detailed understanding of a company’s GHG impact. A
corporate GHG inventory is the tool to provide such an
understanding. It allows companies to take into account
their emissions-related risks and opportunities and focus
company efforts on their greatest GHG impacts. Until
recently, companies have focused their attention on
emissions from their own operations. But increasingly
companies understand the need to also account for
GHG emissions along their value chains and product
portfolios to comprehensively manage GHG-related
risks and opportunities.
Through the development of the GHG Protocol Corporate
Value Chain (Scope 3) Accounting and Reporting Standard,
the GHG Protocol has responded to the demand for
an internationally accepted method to enable GHG
management of companies’ value chains. Following
the release of this standard, the GHG Protocol and its
partners will proactively work with industry groups and
governments to promote its widespread use – along with
the entire suite of GHG Protocol standards and tools – to
enable more effective GHG management worldwide.
gu
id
an
ce

[04] Corporate Value Chain (Scope 3) Accounting and Reporting Standard
1.1 The Greenhouse Gas ProtocolThe Greenhouse Gas Protocol (GHG Protocol) is a
multi-stakeholder partnership of businesses, non-
governmental organizations (NGOs), governments,
and others convened by the World Resources Institute
(WRI) and the World Business Council for Sustainable
Development (WBCSD). Launched in 1998, the mission of
the GHG Protocol is to develop internationally accepted
greenhouse gas (GHG) accounting and reporting
standards and tools, and to promote their adoption in
order to achieve a low emissions economy worldwide.
The GHG Protocol has produced the following separate
but complementary standards, protocols, and guidelines:
• GHG Protocol Corporate Accounting and Reporting Standard (2004): A standardized methodology for
companies to quantify and report their corporate GHG
emissions. Also referred to as the Corporate Standard.
• GHG Protocol Product Life Cycle Accounting and Reporting Standard (2011): A standardized
methodology to quantify and report GHG emissions
associated with individual products throughout their
life cycle. Also referred to as the Product Standard.
• GHG Protocol for Project Accounting (2005): A guide for quantifying reductions from GHG-mitigation
projects. Also referred to as the Project Protocol.
• GHG Protocol for the U.S. Public Sector (2010): A step-by-step approach to measuring and reporting
emissions from public sector organizations,
complementary to the Corporate Standard.
• GHG Protocol Guidelines for Quantifying GHG Reductions from Grid-Connected Electricity Projects (2007): A guide for quantifying reductions in emissions
that either generate or reduce the consumption of
electricity transmitted over power grids, to be used in
conjunction with the Project Protocol.
• GHG Protocol Land Use, Land-Use Change, and Forestry Guidance for GHG Project Accounting (2006): A guide to quantify and report reductions from
land use, land-use change, and forestry, to be used in
conjunction with the Project Protocol.
• Measuring to Manage: A Guide to Designing GHG Accounting and Reporting Programs (2007): A
guide for program developers on designing and
implementing effective GHG programs based on
accepted standards and methodologies.
1.2 Purpose of this standardThe GHG Protocol Corporate Value Chain (Scope 3)
Accounting and Reporting Standard (also referred to
as the Scope 3 Standard) provides requirements and
guidance for companies and other organizations to
prepare and publicly report a GHG emissions inventory
that includes indirect emissions resulting from value
chain activities (i.e., scope 3 emissions). The primary goal
of this standard is to provide a standardized step-by-step
approach to help companies understand their full value
chain emissions impact in order to focus company efforts
on the greatest GHG reduction opportunities, leading to
more sustainable decisions about companies’ activities
and the products they buy, sell, and produce.
The standard was developed with the following objectives
in mind:
• To help companies prepare a true and fair scope 3 GHG
inventory in a cost-effective manner, through the use
of standardized approaches and principles
• To help companies develop effective strategies for
managing and reducing their scope 3 emissions
through an understanding of value chain emissions
and associated risks and opportunities
• To support consistent and transparent public reporting
of corporate value chain emissions according to a
standardized set of reporting requirements
Ultimately, this is more than a technical accounting
standard. It is intended to be tailored to business realities
and to serve multiple business objectives. Companies may
find most value in implementing the standard using a
phased approach, with a focus on improving the quality of
the GHG inventory over time.
1.3 Relationship to the GHG Protocol Corporate Standard
The GHG Protocol Scope 3 Standard is a supplement to
the GHG Protocol Corporate Accounting and Reporting
Standard, Revised Edition (2004) and should be used
in conjunction with it. The Corporate Standard – first
launched in 2001 and revised in 2004 – has been widely
adopted by businesses, NGOs, and governments around
the world as the international standard for developing
and reporting a company-wide GHG inventory.

[05]
CHAPTER 01 Introduction
The Scope 3 Standard complements and builds upon the
Corporate Standard to promote additional completeness
and consistency in the way companies account for and
report on indirect emissions from value chain activities.
The Corporate Standard classifies a company’s direct and
indirect GHG emissions into three “scopes,” and requires
that companies account for and report all scope 1
emissions (i.e., direct emissions from owned or controlled
sources) and all scope 2 emissions (i.e., indirect emissions
from the generation of purchased energy consumed by
the reporting company). The Corporate Standard gives
companies flexibility in whether and how to account for
scope 3 emissions (i.e., all other indirect emissions that
occur in a company’s value chain). Figure 1.1 provides
an overview of the three GHG Protocol scopes and
categories of scope 3 emissions.
Since the Corporate Standard was revised in 2004, business
capabilities and needs in the field of GHG accounting and
reporting have grown significantly. Corporate leaders are
becoming more adept at calculating scope 1 and scope 2
emissions, as required by the Corporate Standard. As GHG
accounting expertise has grown, so has the realization
that significant emissions – and associated risks and
opportunities – result from value chain activities not
captured by scope 1 and scope 2 inventories.
Scope 3 emissions can represent the largest source of
emissions for companies and present the most significant
opportunities to influence GHG reductions and achieve a
variety of GHG-related business objectives (see chapter 2).
Developing a full corporate GHG emissions inventory –
incorporating scope 1, scope 2, and scope 3 emissions –
enables companies to understand their full emissions
Figure [1.1] Overview of GHG Protocol scopes and emissions across the value chain
CO2 CH4 SF6N2O HFCs PFCs
purchased electricity, steam, heating & cooling for own use
purchased goods and
services
capital goods
fuel and energy related
activities
transportation and distribution
waste generated in operations
business travel
transportation and distribution
processing of sold products
use of sold products
end-of-life treatment of sold products
leased assets franchisesemployee commuting
leased assets investments
company facilities
company vehicles
Scope 3 INDIRECT
CO2 CH4 SF6N2O HFCs PFCs
purchased electricity, steam, heating & cooling for own use
purchased goods and
services
capital goods
fuel and energy related
activities
transportation and distribution
waste generated in operations
business travel
transportation and distribution
processing of sold products
use of sold products
end-of-life treatment of sold products
leased assets franchisesemployee commuting
leased assets investments
company facilities
company vehicles
Reporting companyUpstream activities Downstream activities
CO2 CH4 SF6N2O HFCs PFCs
purchased electricity, steam, heating & cooling for own use
purchased goods and
services
capital goods
fuel and energy related
activities
transportation and distribution
waste generated in operations
business travel
transportation and distribution
processing of sold products
use of sold products
end-of-life treatment of sold products
leased assets franchisesemployee commuting
leased assets investments
company facilities
company vehicles
Scope 1 DIRECT
Scope 2 INDIRECT
Scope 3 INDIRECT
CO2 CH4 SF6N2O HFCs PFCs
purchased electricity, steam, heating & cooling for own use
purchased goods and
services
capital goods
fuel and energy related
activities
transportation and distribution
waste generated in operations
business travel
transportation and distribution
processing of sold products
use of sold products
end-of-life treatment of sold products
leased assets franchisesemployee commuting
leased assets investments
company facilities
company vehicles
CO2 CH4 SF6N2O HFCs PFCs
purchased electricity, steam, heating & cooling for own use
purchased goods and
services
capital goods
fuel and energy related
activities
transportation and distribution
waste generated in operations
business travel
transportation and distribution
processing of sold products
use of sold products
end-of-life treatment of sold products
leased assets franchisesemployee commuting
leased assets investments
company facilities
company vehicles
CO2 CH4 SF6N2O HFCs PFCs
purchased electricity, steam, heating & cooling for own use
purchased goods and
services
capital goods
fuel and energy related
activities
transportation and distribution
waste generated in operations
business travel
transportation and distribution
processing of sold products
use of sold products
end-of-life treatment of sold products
leased assets franchisesemployee commuting
leased assets investments
company facilities
company vehicles
CO2 CH4 SF6N2O HFCs PFCs
purchased electricity, steam, heating & cooling for own use
purchased goods and
services
capital goods
fuel and energy related
activities
transportation and distribution
waste generated in operations
business travel
transportation and distribution
processing of sold products
use of sold products
end-of-life treatment of sold products
leased assets franchisesemployee commuting
leased assets investments
company facilities
company vehicles
CO2 CH4 SF6N2O HFCs PFCs
purchased electricity, steam, heating & cooling for own use
purchased goods and
services
capital goods
fuel and energy related
activities
transportation and distribution
waste generated in operations
business travel
transportation and distribution
processing of sold products
use of sold products
end-of-life treatment of sold products
leased assets franchisesemployee commuting
leased assets investments
company facilities
company vehicles
CO2 CH4 SF6N2O HFCs PFCs
purchased electricity, steam, heating & cooling for own use
purchased goods and
services
capital goods
fuel and energy related
activities
transportation and distribution
waste generated in operations
business travel
transportation and distribution
processing of sold products
use of sold products
end-of-life treatment of sold products
leased assets franchisesemployee commuting
leased assets investments
company facilities
company vehicles
CO2 CH4 SF6N2O HFCs PFCs
purchased electricity, steam, heating & cooling for own use
purchased goods and
services
capital goods
fuel and energy related
activities
transportation and distribution
waste generated in operations
business travel
transportation and distribution
processing of sold products
use of sold products
end-of-life treatment of sold products
leased assets franchisesemployee commuting
leased assets investments
company facilities
company vehicles

[06] Corporate Value Chain (Scope 3) Accounting and Reporting Standard
impact across the value chain and focus efforts where
they can have the greatest impact.
Companies reporting their corporate GHG emissions have
two reporting options (see table 1.1).
Under the Corporate Standard, companies are required
to report all scope 1 and scope 2 emissions, while
reporting scope 3 emissions is optional. The Scope 3
Standard is designed to create further consistency in
scope 3 inventories through additional requirements and
guidance for scope 3 accounting and reporting.
Companies should make and apply decisions consistently
across both standards. For example, the selection of a
consolidation approach (equity share, operational control
or financial control) should be applied consistently across
scope 1, scope 2, and scope 3. For more information, see
section 5.2.
1.4 Who should use this standard?This standard is intended for companies of all sizes and in
all economic sectors. It can also be applied to other types
of organizations and institutions, both public and private,
such as government agencies, non-profit organizations,
assurers and verifiers, and universities. Policymakers and
designers of GHG reporting or reduction programs can
use relevant parts of this standard to develop accounting
and reporting requirements. Throughout this standard,
the term “company” is used as shorthand to refer to the
entity developing a scope 3 inventory.
1.5 Scope of the standardThis standard is designed to account for the emissions
generated from corporate value chain activities during
the reporting period (usually a period of one year),
and covers the six main greenhouse gases: carbon
dioxide (CO2), methane (CH4), nitrous oxide (N2O),
hydrofluorocarbons (HFCs), perfluorocarbons (PFCs),
and sulphur hexafluoride (SF6). This standard does not
address the quantification of avoided emissions or GHG
reductions from actions taken to compensate for or
offset emissions. These types of reductions are addressed
by the GHG Protocol for Project Accounting.
Use of this standard is intended to enable comparisons of
a company’s GHG emissions over time. It is not designed
to support comparisons between companies based on
their scope 3 emissions. Differences in reported emissions
may be a result of differences in inventory methodology
or differences in company size or structure. Additional
measures are necessary to enable valid comparisons
across companies. Such measures include consistency in
methodology and data used to calculate the inventory,
and reporting of additional information such as intensity
ratios or performance metrics. Additional consistency can
be provided through GHG reporting programs or sector-
specific guidance (see section 1.9).
Table [1.1] Corporate-level GHG Protocol reporting options
Reporting Option Scope 1 Scope 2 Scope 3
Report in conformance with the GHG Protocol Corporate Standard
Required Required Optional: Companies may report any scope 3 emissions the company chooses
Report in conformance with the GHG Protocol Corporate Standard and the GHG Protocol Scope 3 Standard
Required Required Required: Companies shall report scope 3 emissions following the requirements of the Scope 3 Standard

[07]
CHAPTER 01 Introduction
1.6 How was this standard developed?The GHG Protocol follows a broad and inclusive multi-
stakeholder process to develop greenhouse gas
accounting and reporting standards with participation
from businesses, government agencies, NGOs, and
academic institutions from around the world.
In 2008, WRI and WBCSD launched a three-year process to
develop the GHG Protocol Scope 3 Standard. A 25-member
Steering Committee of experts provided strategic
direction throughout the process. The first draft of the
Scope 3 Standard was developed in 2009 by Technical
Working Groups consisting of 96 members (representing
diverse industries, government agencies, academic
institutions, and non-profit organizations worldwide).
In 2010, 34 companies from a variety of industry sectors
road-tested the first draft and provided feedback on its
practicality and usability, which informed a second draft.
Members of a Stakeholder Advisory Group (consisting of
more than 1,600 participants) provided feedback on each
draft of the standard.
1.7 Relationship to the GHG Protocol Product Standard
The GHG Protocol Scope 3 Standard and GHG Protocol
Product Standard both take a value chain or life cycle
approach to GHG accounting and were developed
simultaneously. The Scope 3 Standard accounts for value
chain emissions at the corporate level, while the Product
Standard accounts for life cycle emissions at the individual
product level. Together with the Corporate Standard, the
three standards provide a comprehensive approach to
value chain GHG measurement and management.
The reporting company’s business goals should drive the
use of a particular GHG Protocol accounting standard.
The Scope 3 Standard enables a company to identify the
greatest GHG reduction opportunities across the entire
corporate value chain, while the Product Standard enables
a company to target individual products with the greatest
potential for reductions. The Scope 3 Standard helps a
company identify GHG reduction opportunities, track
performance, and engage suppliers at a corporate level,
[08] Corporate Value Chain (Scope 3) Accounting and Reporting Standard
while the Product Standard helps a company meet the
same objectives at a product level.
Common data is used to develop scope 3 inventories
and product inventories, including data collected from
suppliers and other companies in the value chain. Since
there can be overlap in data collection, companies may
find added business value and efficiencies in developing
scope 3 and product inventories in parallel.
While each standard can be implemented independently,
both standards are mutually supportive. Integrated use
might include:
• Applying the Scope 3 Standard, using the results to
identify products with the most significant emissions,
then using the Product Standard to identify mitigation
opportunities in the selected products’ life cycles
• Using product-level GHG data based on the Product
Standard as a source of data to calculate scope 3
emissions associated with selected product types
• Applying either the Scope 3 Standard or the Product
Standard and using the results to inform GHG-
reduction strategies that reduce both product and
corporate level (scope 3) emissions
The sum of the life cycle emissions of each of a company’s
products, combined with additional scope 3 categories
(e.g., employee commuting, business travel, and
investments), should approximate the company’s total
corporate GHG emissions (i.e., scope 1 + scope 2 + scope
3). In practice, companies are not expected or required
to calculate life cycle inventories for individual products
when calculating scope 3 emissions.
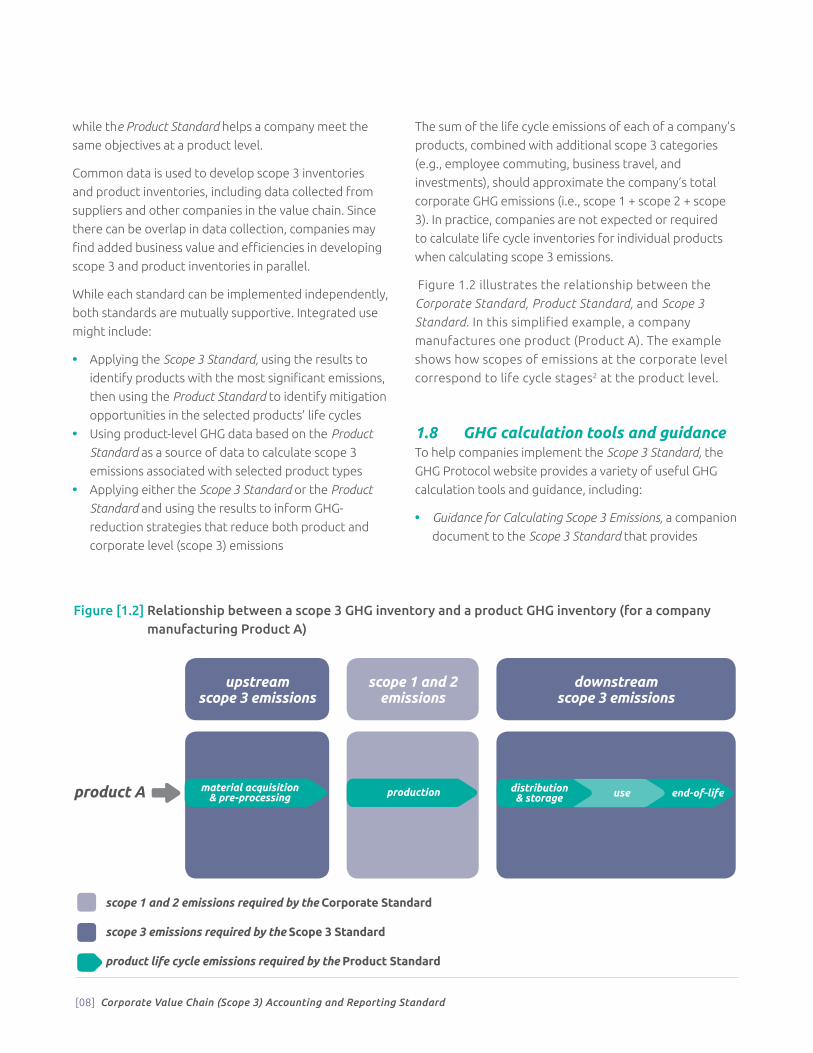
Figure 1.2 illustrates the relationship between the
Corporate Standard, Product Standard, and Scope 3
Standard. In this simplified example, a company
manufactures one product (Product A). The example
shows how scopes of emissions at the corporate level
correspond to life cycle stages2 at the product level.
1.8 GHG calculation tools and guidanceTo help companies implement the Scope 3 Standard, the
GHG Protocol website provides a variety of useful GHG
calculation tools and guidance, including:
• Guidance for Calculating Scope 3 Emissions, a companion
document to the Scope 3 Standard that provides
Figure [1.2] Relationship between a scope 3 GHG inventory and a product GHG inventory (for a company manufacturing Product A)
product A
upstreamscope 3 emissions
downstream scope 3 emissions
scope 1 and 2 emissions
scope 1 and 2 emissions required by the Corporate Standard
scope 3 emissions required by the Scope 3 Standard
product life cycle emissions required by the Product Standard
use end-of-life material acquisition
& pre-processing production distribution & storage

[09]
CHAPTER 01 Introduction
detailed guidance for calculating scope 3 emissions,
including calculation methods, data sources, and
examples of calculating scope 3 emissions
• A list of available data sources for calculating scope 3
emissions, including over 80 emission factor databases
covering a variety of sectors and geographic regions
• Several cross-sector and sector-specific calculation
tools, which provide step-by-step guidance, together
with electronic worksheets to help companies calculate
GHG emissions from specific sources or sectors
All GHG calculation tools and guidance are available at
www.ghgprotocol.org.
1.9 Sector guidanceThe development of sector-specific implementation
guidance and tools can drive more consistent corporate
GHG measurement, reporting, and performance tracking
practices for a particular sector. Helpful sector-level
information could include guidance on interpreting
the standard for a specific sector, guidance and tools
for calculating emissions from sector-specific activities,
recommended performance metrics, specific guidance
for identifying the largest sector emissions sources, and
suggested data sources and emissions factors.
Sectors should develop guidance through an inclusive
multi-stakeholder process to ensure broad acceptance
and facilitate increased consistency and credibility.
Endnotes1 IPCC, Summary for Policymakers (Table SPM.5: Characteristics
of post-TAR stabilization scenarios), in Climate Change 2007:
Mitigation. Contribution of Working Group III to the Fourth
Assessment Report of the Intergovernmental Panel on Climate
Change, ed. B. Metz, O.R. Davidson, P.R. Bosch, R. Dave, L.A.
Meyer (Cambridge, United Kingdom and New York, NY, USA:
Cambridge University Press, 2007).
2 A life cycle stage is one of the interconnected steps in a product’s
life cycle.

Business Goals02
[11]
D eveloping a scope 3 inventory strengthens companies’ understanding of their value
chain GHG emissions as a step towards effectively managing emissions-related
risks and opportunities and reducing value chain GHG emissions.
Business goals of a scope 3 inventoryBefore accounting for scope 3 emissions, companies
should consider which business goal or goals they
intend to achieve. See table 2.1 for a list of goals
frequently cited by businesses as reasons for developing
a scope 3 inventory.
Identify and understand risks and opportunities associated with value chain emissionsGHG emissions from corporate activities are increasingly
becoming a mainstream management issue for
businesses. Potential liabilities from GHG exposure arise
from unstable resource and energy costs, future resource
scarcity, environmental regulations, changing consumer
preferences, scrutiny from investors and shareholders,
as well as reputational risk from other stakeholders.
(See table 2.2 for examples of risks related to scope
3 GHG emissions.) By developing a scope 3 inventory,
companies can understand the overall emissions profile
of their upstream and downstream activities. This
information provides companies with an understanding
of where potential emissions and associated risks and
opportunities lie in the value chain, as well as the relative
risks and opportunities of scope 3 emissions compared to
companies’ direct emissions.
For some companies, developing a scope 3 inventory may
improve planning for potential future carbon regulations.
For example, energy or emissions taxes or regulations in
a company’s supply chain may significantly increase the
cost of goods or components purchased by a company.
Understanding scope 3 emissions helps companies
plan for potential regulations and can guide corporate
procurement decisions and product design.
Additionally, companies may find that there is a
reputational risk if they do not understand the impacts
of their broader corporate value chain activities. By
undertaking a scope 3 inventory and understanding
where their emissions are, companies can credibly
communicate to their stakeholders the potential
impacts of these emissions and the actions planned or
taken to reduce the associated risks.
Companies can also use the results of the scope 3
inventory to identify new market opportunities for
producing and selling goods and services with lower GHG
Business Goals
gu
id
an
ce

[12] Corporate Value Chain (Scope 3) Accounting and Reporting Standard
emissions. As more companies in the value chain measure
and manage GHG emissions, demand will grow for new
products that reduce emissions throughout the value
chain. See table 2.2 for examples of opportunities related
to scope 3 emissions.
Identify GHG reduction opportunities, set reduction targets, and track performanceThe scope 3 inventory provides a quantitative tool for
companies to identify and prioritize emissions-reduction
opportunities along their value chain. Scope 3 inventories
provide detailed information on the relative size and scale
of emission-generating activities within and across the
various scope 3 categories. This information may be used
to identify the largest emission sources (i.e., “hot spots”)
in the value chain and focus efforts on the most effective
emission-reduction opportunities, resulting in cost savings
for companies.
For example, a company whose largest source of value
chain emissions is contracted logistics may choose to
optimize these operations through changes to product
packaging to increase the volume per shipment, or by
increasing the number of low-carbon logistics providers.
Additionally, companies may utilize this information to
change their procurement practices or improve product
design or product efficiency, resulting in reduced
energy use.
Table [2.1] Business goals served by a scope 3 GHG inventory
Business goal Description
Identify and understand risks and opportunities associated with value chain emissions
• Identify GHG-related risks in the value chain • Identify new market opportunities • Inform investment and procurement decisions
Identify GHG reduction opportunities, set reduction targets, and track performance
• Identify GHG “hot spots” and prioritize reduction efforts across the value chain• Set scope 3 GHG reduction targets• Quantify and report GHG performance over time
Engage value chain partners in GHG management
• Partner with suppliers, customers, and other companies in the value chain to achieve GHG reductions
• Expand GHG accountability, transparency, and management in the supply chain • Enable greater transparency on companies’ efforts to engage suppliers • Reduce energy use, costs, and risks in the supply chain and avoid future costs
related to energy and emissions• Reduce costs through improved supply chain efficiency and reduction of
material, resource, and energy use
Enhance stakeholder information and corporate reputation through public reporting
• Improve corporate reputation and accountability through public disclosure• Meet needs of stakeholders (e.g., investors, customers, civil society,
governments), enhance stakeholder reputation, and improve stakeholder relationships through public disclosure of GHG emissions, progress toward GHG targets, and demonstration of environmental stewardship
• Participate in government- and NGO-led GHG reporting and management programs to disclose GHG-related information
[13]
CHAPTER 02 Business Goals
[13]
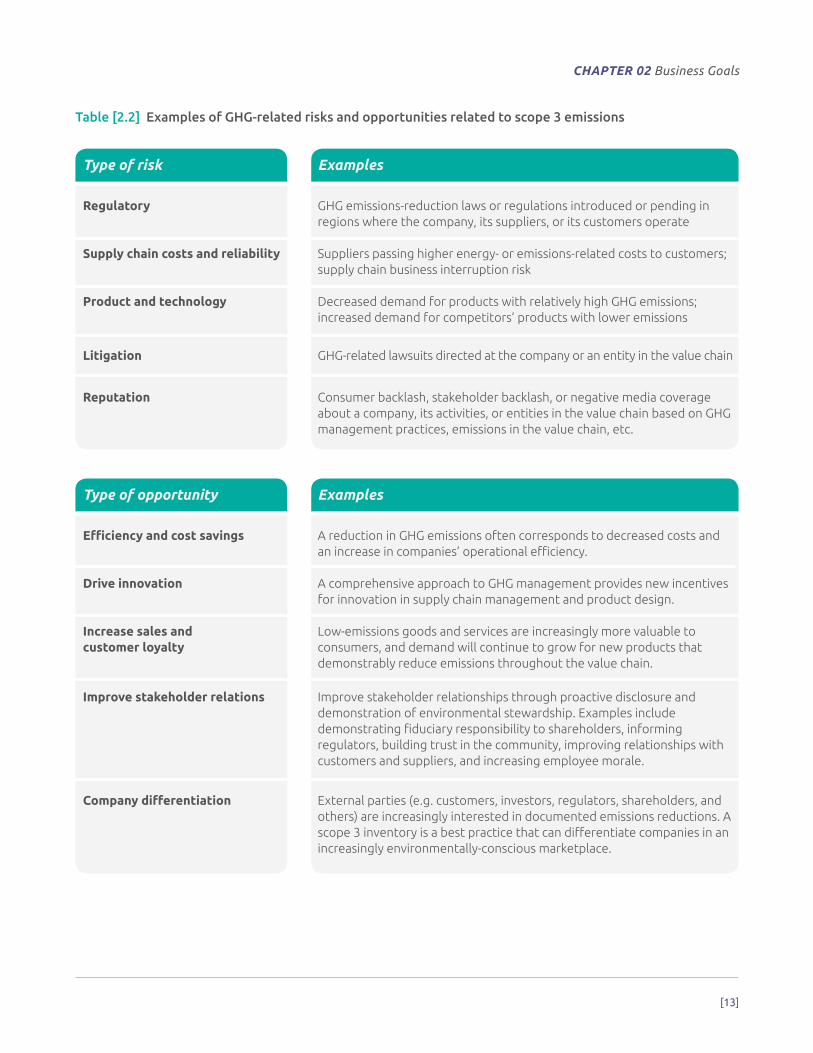
Table [2.2] Examples of GHG-related risks and opportunities related to scope 3 emissions
Type of risk Examples
Regulatory GHG emissions-reduction laws or regulations introduced or pending in regions where the company, its suppliers, or its customers operate
Supply chain costs and reliability Suppliers passing higher energy- or emissions-related costs to customers; supply chain business interruption risk
Product and technology Decreased demand for products with relatively high GHG emissions; increased demand for competitors’ products with lower emissions
Litigation GHG-related lawsuits directed at the company or an entity in the value chain
Reputation Consumer backlash, stakeholder backlash, or negative media coverage about a company, its activities, or entities in the value chain based on GHG management practices, emissions in the value chain, etc.
Type of opportunity Examples
Efficiency and cost savings A reduction in GHG emissions often corresponds to decreased costs and an increase in companies’ operational efficiency.
Drive innovation A comprehensive approach to GHG management provides new incentives for innovation in supply chain management and product design.
Increase sales and customer loyalty
Low-emissions goods and services are increasingly more valuable to consumers, and demand will continue to grow for new products that demonstrably reduce emissions throughout the value chain.
Improve stakeholder relations Improve stakeholder relationships through proactive disclosure and demonstration of environmental stewardship. Examples include demonstrating fiduciary responsibility to shareholders, informing regulators, building trust in the community, improving relationships with customers and suppliers, and increasing employee morale.
Company differentiation External parties (e.g. customers, investors, regulators, shareholders, and others) are increasingly interested in documented emissions reductions. A scope 3 inventory is a best practice that can differentiate companies in an increasingly environmentally-conscious marketplace.

[14] Corporate Value Chain (Scope 3) Accounting and Reporting Standard
Conducting a GHG inventory according to a consistent
framework is also a prerequisite for setting credible
public GHG reduction targets. External stakeholders,
including customers, investors, shareholders, and others,
are increasingly interested in companies’ documented
emissions reductions. Therefore, identifying reduction
opportunities, setting goals, and reporting on progress
to stakeholders may help differentiate a company in an
increasingly environmentally-conscious marketplace.
Engage value chain partners in GHG managementDeveloping a scope 3 inventory encourages the
quantification and reporting of emissions from various
partners across the value chain. For many companies,
a primary goal of developing a scope 3 inventory is to
encourage supplier GHG measurement and reduction,
and to report on supplier performance. For example, a
company may engage with their major suppliers to obtain
emissions information on the products it purchases
from them, as well as information on suppliers’ GHG
management plans. Successful engagement with suppliers
often requires a company to work closely with its supply
chain partners to build a common understanding of
emissions-related information and the opportunities and
benefits of achieving GHG reductions. Reporting on the
progress of a company’s engagement with its supply chain
can be useful information for stakeholders external and
internal to the reporting company.
Companies may also wish to engage with their customers
by providing information on product use and disposal. For
example, a company may want to work with stakeholders
such as retailers, marketers or advertisers to convey
information to customers on less energy intensive
products, how to use a product more efficiently, or
to encourage recycling. A scope 3 inventory enables
companies to identify their downstream hot spots so that
they can credibly engage with customers to reduce their
value chain emissions.
By developing a scope 3 inventory, companies can identify
where the largest energy, material and resource use is
within the supply chain. This knowledge can inform cost
savings through reducing material, energy and resource
National Grid is
an international
electricity and gas
company and one of
the largest investor-
owned energy
companies in the
world. At the heart
of National Grid’s corporate vision is “safeguarding our
environment for future generations.” One of National
Grid’s strategic objectives is to ensure that National
Grid is a sustainable low carbon business. National Grid
recognized that in order to deliver a fully effective
greenhouse gas reduction plan, all emissions need to be
taken into account. Therefore, National Grid developed
a strategy for quantifying and reducing its scope 3
emissions, with several specific objectives in mind:
• Understanding the risks and opportunities associated
with emissions across the entire value chain
• Considering the environmental impact in investment
and other business decisions through internalization
of carbon costs and assessment of benefits
• Becoming agents for change by working with
customers and supply chain partners to drive
GHG reductions and providing transparency and
accountability within the value chain
• Working with governments and regulators to encourage
allowable investments through carbon-trading
mechanisms and clear legislation
To help achieve these objectives, National Grid used the
GHG Protocol Scope 3 Standard to inventory its scope 3
emissions. After developing the full scope 3 inventory,
a clear picture appeared with emissions from the use of
sold products emerging as by far the biggest source of
scope 3 emissions. This valuable insight helped National
Grid understand the full impact of its business operations
and provided more focused direction for future
strategies and targets.
National Grid: Business objectives for scope 3 accounting
To deliver a fully effective greenhouse gas reduction plan, all emissions need to be taken into account

[15]
CHAPTER 02 Business Goals
use, improving overall efficiency of companies’ supply
chains, reducing regulatory risks, and strengthening
supplier and customer relationships.
Enhance stakeholder information and corporate reputation through public reporting As concerns over climate change grow, NGOs, investors,
governments and other stakeholders are increasingly
calling for greater disclosure of corporate activities
and GHG information. They are interested in the
actions companies are taking and in how companies
are positioned relative to their competitors. For many
companies, responding to this stakeholder interest
by disclosing information on corporate emissions and
reduction activities is a business objective of developing a
scope 3 inventory.
Companies can improve stakeholder relationships
through proactive disclosure and demonstration
of environmental stewardship. Examples include
demonstrating fiduciary responsibility to shareholders,
informing regulators, building trust in the community,
improving relationships with customers and suppliers,
and increasing employee morale.
Companies have a variety of avenues for communicating
with stakeholders. Companies can disclose information
through stand-alone corporate sustainability reports,
mandatory government registries, industry groups, or
through stakeholder-led reporting programs. Mandatory
and voluntary reporting programs often offer companies
assistance in setting GHG targets, provide industry-specific
benchmarking information, and provide information on
corporate activities to a specific stakeholder audience.
An example of a global voluntary reporting program is
the Carbon Disclosure Project, which requests corporate
GHG performance information on behalf of a community
of investors. Companies may also find that public
reporting through a voluntary GHG reporting program
can strengthen their standing with customers and
differentiate them from their competitors.

For Abengoa - a global technology and engineering
company operating in over 70 countries - engaging with
its suppliers to build its greenhouse gas inventory is a
key component of the company’s overall sustainability
goals. Abengoa believes that working closely with its
suppliers is the best way to encourage broader GHG
measurement and management and to calculate its
scope 3 GHG inventory.
Abengoa utilizes a number of methods that support
the completion of their scope 3 inventory. All suppliers
must agree to introduce a GHG reporting system for
the products and services purchased by Abengoa.
Abengoa then provides detailed guidelines for suppliers
to determine emissions, based on the GHG Protocol
standards, and includes calculation guidance, databases
and guidance on emissions factors. The guidance also
includes data collection
templates for suppliers
to send to their suppliers
further upstream,
which introduces GHG
emissions management
throughout the overall
Abengoa value chain.
Abengoa also requires
that supplier emissions
data are verified by a third party, or are accompanied
by the data used for calculating the GHG inventory.
Finally, the company requires that all suppliers adhere
to its Social Responsibility Code of Conduct, to ensure
suppliers’ senior management is committed to Abengoa’s
sustainability practices and objectives.
Abengoa: Business objectives of scope 3 supplier engagement
[16] Corporate Value Chain (Scope 3) Accounting and Reporting Standard
Abengoa believes that working closely with its suppliers is the best way to encourage broader GHG measurement and management

[17]
CHAPTER 02 Business Goals
Making life better for people and the planet is a core
mission at SC Johnson. The company completed a scope
3 inventory to better understand its scope 3 impacts and
to provide input for the development of sustainability
objectives in support of its core commitment to
environmental leadership. Specific objectives of this
effort were to:
• Gain a full understanding of the company’s global
carbon footprint to reveal potential hot spots
and opportunities
• Provide a common carbon “currency” throughout
the value chain to identify the highest-impact GHG
reduction strategies and programs (see figure 2.1)
• Develop a framework to engage government, NGOs,
supply chain partners, retailers, and consumers and
to drive the innovation necessary to foster GHG
improvements throughout the value chain
As a result of the scope 3 inventory effort, SC Johnson
has initiated a process to incorporate scope 3 results into
its sustainability program objective development, and
has initiated outreach programs with its suppliers to help
foster GHG improvements.
SC Johnson: Assessing scope 3 reduction opportunities
Figure [2.1] SC Johnson’s framework to assess reduction opportunities along the value chain
create strategies to reduce impacts of raw materials
reduce use-phase impacts
collect raw material data from suppliers
conduct product LCAs
work with transport providers to reduce carbon footprint
conduct scope 1 & scope 2 analysis on technology basis
collect downstream transportation data
collect energy data from all suppliers
map data to technologies
collect upstream transportation data
long-term implementation short-term implementation
low cap expense mid cap expense high cap expense
incremental change
(low GHG reduction)
game changing (high GHG reduction)
strategic carbon opportunity
work with suppliers to reduce carbon footprint

03 Summary of Steps and Requirements

[19]
Summary of Steps and Requirements
T his chapter provides a summary of the steps involved in scope 3 accounting and
reporting, as well as a list of the requirements that must be followed for a scope 3
inventory to be in conformance with this standard.
3.1 Scope 3 accounting and reporting stepsThis standard is organized according to the steps a
company should follow when developing a scope 3
inventory. Figure 3.1 provides an overview of the steps in
scope 3 accounting and reporting. Each step is described
in detail in the following chapters.
3.2 Terminology: shall, should, and mayThis standard uses precise language to indicate which
provisions of the standard are requirements, which
are recommendations, and which are permissible or
allowable options that companies may choose to follow.
The term “shall” is used throughout this standard to
indicate what is required in order for a GHG inventory
Figure [3.1] Overview of steps in scope 3 accounting and reporting
define business
goals
chapter 2
review accounting
& reporting principles
chapter 4
identify scope 3
activities
chapter 5
set the scope 3
boundary
chapter 6
collect data
chapter 7
allocate emissions
chapter 8
set a target
(optional)& track
emissions over time
chapter 9
assure emissions (optional)
chapter 10
report emissions
chapter 11
gu
id
an
ce
re
qu
ir
em
en
ts

[20] Corporate Value Chain (Scope 3) Accounting and Reporting Standard
to be in conformance with the GHG Protocol Scope
3 Standard. The term “should” is used to indicate a
recommendation, but not a requirement. The term
“may” is used to indicate an option that is permissible or
allowable. The term “required” is used in the guidance
to refer to requirements in the standard. “Needs,”
“can,” and “cannot” may be used to provide guidance
on implementing a requirement or to indicate when an
action is or is not possible.
3.3 Summary of requirementsThis standard presents accounting and reporting
requirements to help companies prepare a GHG
inventory that represents a true and fair account of
their scope 3 emissions. Standardized approaches and
principles are designed to increase the consistency
and transparency of scope 3 inventories. Table 3.1
provides a list of all the requirements included in this
standard. Each requirement is further explained in the
following chapters. Requirements are also presented
in a box at the beginning of each chapter that contains
requirements (chapters 4, 6, 9, and 11).

[21]
CHAPTER 03 Summary of Steps and Requirements
Table [3.1] List of requirements in this standard
Chapter Requirements
Accounting and Reporting Principles Chapter 4
• GHG accounting and reporting of a scope 3 inventory shall be based on the following principles: relevance, completeness, consistency, transparency, and accuracy.
Setting the Scope 3 Boundary Chapter 6
• Companies shall account for all scope 3 emissions and disclose and justify any exclusions.
• Companies shall account for emissions from each scope 3 category according to the minimum boundaries listed in table 5.4.
• Companies shall account for scope 3 emissions of CO2, CH4, N2O, HFCs, PFCs, and
SF6, if they are emitted in the value chain.• Biogenic CO2 emissions that occur in the value chain shall not be included in the
scopes, but shall be included and separately reported in the public report.
Setting a GHG Target and Tracking Emissions over Time Chapter 9
When companies choose to track performance or set a reduction target, companies shall:• Choose a scope 3 base year and specify their reasons for choosing that
particular year;• Develop a base year emissions recalculation policy that articulates the basis for
any recalculations; and• Recalculate base year emissions when significant changes in the company
structure or inventory methodology occur.
Reporting Chapter 11
Companies shall publicly report the following information: • A scope 1 and scope 2 emissions report in conformance with the GHG Protocol
Corporate Standard• Total scope 3 emissions reported separately by scope 3 category• For each scope 3 category, total GHG emissions reported in metric tons of CO2
equivalent, excluding biogenic CO2 emissions and independent of any GHG trades, such as purchases, sales, or transfers of offsets or allowances
• A list of scope 3 categories and activities included in the inventory• A list of scope 3 categories or activities excluded from the inventory with
justification of their exclusion• Once a base year has been established: the year chosen as the scope 3 base year;
the rationale for choosing the base year; the base year emissions recalculation policy; scope 3 emissions by category in the base year, consistent with the base year emissions recalculation policy; and appropriate context for any significant emissions changes that triggered base year emissions recalculations
• For each scope 3 category, any biogenic CO2 emissions reported separately• For each scope 3 category, a description of the types and sources of data,
including activity data, emission factors and global warming potential (GWP) values, used to calculate emissions, and a description of the data quality of reported emissions data
• For each scope 3 category, a description of the methodologies, allocation methods, and assumptions used to calculate scope 3 emissions
• For each scope 3 category, the percentage of emissions calculated using data obtained from suppliers or other value chain partners

04 Accounting and Reporting Principles
[23]
A s with financial accounting and reporting, generally accepted GHG accounting
principles are intended to underpin and guide GHG accounting and reporting to
ensure the reported inventory represents a faithful, true, and fair account of a
company’s GHG emissions. The five principles described below are adapted from the GHG
Protocol Corporate Standard and are intended to guide the accounting and reporting of a
company’s scope 3 inventory.
GHG accounting and reporting of a scope 3 inventory shall
be based on the following principles:
Relevance: Ensure the GHG inventory appropriately
reflects the GHG emissions of the company and serves
the decision-making needs of users – both internal and
external to the company.
Completeness: Account for and report on all GHG
emission sources and activities within the inventory
boundary. Disclose and justify any specific exclusions.
Consistency: Use consistent methodologies to allow
for meaningful performance tracking of emissions over
time. Transparently document any changes to the data,
inventory boundary, methods, or any other relevant
factors in the time series.
Transparency: Address all relevant issues in a factual and
coherent manner, based on a clear audit trail. Disclose any
relevant assumptions and make appropriate references to
the accounting and calculation methodologies and data
sources used.
Accuracy: Ensure that the quantification of GHG
emissions is systematically neither over nor under actual
emissions, as far as can be judged, and that uncertainties
are reduced as far as practicable. Achieve sufficient
accuracy to enable users to make decisions with
reasonable confidence as to the integrity of the
reported information.
Requirements in this chapter
GHG accounting and reporting of a scope 3 inventory shall be based on the following principles: relevance, completeness, consistency, transparency, and accuracy.
gu
id
an
ce
re
qu
ir
em
en
ts

[24] Corporate Value Chain (Scope 3) Accounting and Reporting Standard
Guidance for applying the accounting and reporting principlesThe primary function of these five principles is to
guide the implementation of the GHG Protocol Scope 3
Standard and the assurance of the scope 3 inventory,
particularly when application of the standard in specific
situations is ambiguous.
In practice, companies may encounter tradeoffs
between principles when completing a scope 3
inventory. For example, a company may find that
achieving the most complete scope 3 inventory requires
using less accurate data, compromising overall accuracy.
Conversely, achieving the most accurate scope 3
inventory may require excluding activities with low
accuracy, compromising overall completeness.
Companies should balance tradeoffs between principles
depending on their individual business goals (see
chapter 2 for more information). For example, tracking
performance toward a specific scope 3 reduction
target may require more accurate data. Over time, as
the accuracy and completeness of scope 3 GHG data
increases, the tradeoff between these accounting
principles will likely diminish.
Relevance A relevant GHG report contains the information that
users – both internal and external to the company – need
for their decision making. Companies should use the
principle of relevance when determining whether to
exclude any activities from the inventory boundary (see
description of “Completeness” below). Companies should
also use the principle of relevance as a guide when
selecting data sources. Companies should collect data of
sufficient quality to ensure that the inventory is relevant
(i.e., that it appropriately reflects the GHG emissions of
the company and serves the decision-making needs of
users). Selection of data sources depends on a company’s
individual business goals. More information on relevance
and data collection is provided in chapter 7.
Completeness Companies should ensure that the scope 3 inventory
appropriately reflects the GHG emissions of the company,
and serves the decision-making needs of users, both
internal and external to the company. In some situations,
companies may be unable to estimate emissions due to a
lack of data or other limiting factors. Companies should not
exclude any activities from the scope 3 inventory that would
compromise the relevance of the reported inventory. In
the case of any exclusions, it is important that all exclusions
be documented and justified. Assurance providers can
determine the potential impact and relevance of the
exclusion on the overall inventory report. More information
on completeness is provided in chapter 6.
ConsistencyUsers of GHG information typically track emissions
information over time in order to identify trends and
assess the performance of the reporting company.
The consistent application of accounting approaches,
inventory boundary, and calculation methodologies is
essential to producing comparable GHG emissions data
over time. If there are changes to the inventory boundary
(e.g., inclusion of previously excluded activities), methods,
data, or other factors affecting emission estimates, they
need to be transparently documented and justified, and
may warrant recalculation of base year emissions. More
information on consistency when tracking performance
over time is provided in chapter 9.
TransparencyTransparency relates to the degree to which
information on the processes, procedures, assumptions
and limitations of the GHG inventory are disclosed in
a clear, factual, neutral, and understandable manner
based on clear documentation (i.e., an audit trail).
Information should be recorded, compiled, and
analyzed in a way that enables internal reviewers and
external assurance providers to attest to its credibility.
Specific exclusions need to be clearly identified and

[25]
CHAPTER 04 Accounting and Reporting Principles
justified, assumptions
disclosed, and appropriate
references provided for
the methodologies applied
and the data sources used.
The information should be
sufficient to enable a party
external to the inventory
process to derive the
same results if provided with the same source data. A
transparent report will provide a clear understanding
of the relevant issues and a meaningful assessment
of emissions performance of the company’s scope 3
activities. More information on reporting is provided in
chapter 11.
Accuracy Data should be sufficiently accurate to enable intended
users to make decisions with reasonable confidence that
the reported information is credible. It is important that
any estimated data be as accurate as possible to guide
the decision-making needs of the company and ensure
that the GHG inventory is relevant. GHG measurements,
estimates, or calculations should be systemically neither
over nor under the actual emissions value, as far as can
be judged. Companies should reduce uncertainties in the
quantification process as far as practicable and ensure the
data are sufficiently accurate to serve decision-making
needs. Reporting on measures taken to ensure accuracy
and improve accuracy over time can help promote
credibility and enhance transparency. More information
on accuracy when collecting data is provided in chapter 7.
Companies should balance tradeoffs between principles depending on their individual business goals.

05 Identifying Scope 3 Emissions
[27]
T his chapter provides an overview of scope 3 emissions, including the list of scope 3
categories and descriptions of each category.
5.1 Overview of the scopesThe GHG Protocol Corporate Standard divides a company’s
emissions into direct and indirect emissions.
• Direct emissions are emissions from sources that are
owned or controlled by the reporting company.
• Indirect emissions are emissions that are a
consequence of the activities of the reporting
company, but occur at sources owned or controlled by
another company.
Emissions are further divided into three scopes (see table
5.1). Direct emissions are included in scope 1. Indirect
emissions are included in scope 2 and scope 3. While
a company has control over its direct emissions, it has
influence over its indirect emissions. A complete GHG
inventory therefore includes scope 1, scope 2, and scope 3.
Scope 1, scope 2, and scope 3 are mutually exclusive for the
reporting company, such that there is no double counting of
emissions between the scopes. In other words, a company’s
scope 3 inventory does not include any emissions already
accounted for as scope 1 or scope 2 by the same company.
Combined, a company’s scope 1, scope 2, and scope 3
emissions represent the total GHG emissions related to
company activities.
By definition, scope 3 emissions occur from sources
owned or controlled by other entities in the value chain
(e.g., materials suppliers, third-party logistics providers,
waste management suppliers, travel suppliers, lessees
and lessors, franchisees, retailers, employees, and
customers). The scopes are defined to ensure that two or
more companies do not account for the same emission
within scope 1 or scope 2. By properly accounting for
emissions as scope 1, scope 2, and scope 3, companies
avoid double counting within scope 1 and scope 2.
(For more information, see the GHG Protocol Corporate
Standard, chapter 4, “Setting Operational Boundaries.”)
In certain cases, two or more companies may account
for the same emission within scope 3. For example, the
scope 1 emissions of a power generator are the scope 2
emissions of an electrical appliance user, which are in turn
the scope 3 emissions of both the appliance manufacturer
and the appliance retailer. Each of these four companies
has different and often mutually exclusive opportunities
to reduce emissions. The power generator can generate
power using lower-carbon sources. The electrical
appliance user can use the appliance more efficiently. The
appliance manufacturer can increase the efficiency of the
gu
id
an
ce
[28] Corporate Value Chain (Scope 3) Accounting and Reporting Standard
Table [5.1] Overview of the scopes
appliance it produces, and the product retailer can offer
more energy-efficient product choices.
By allowing for GHG accounting of direct and indirect
emissions by multiple companies in a value chain,
scope 1, scope 2, and scope 3 accounting facilitates
the simultaneous action of multiple entities to reduce
emissions throughout society. Because of this type
of double counting, scope 3 emissions should not
be aggregated across companies to determine total
emissions in a given region. Note that while a single
emission may be accounted for by more than one
company as scope 3, in certain cases the emission is
accounted for by each company in a different scope
3 category (see section 5.4). For more information on
double counting within scope 3, see section 9.6.
5.2 Organizational boundaries and scope 3 emissions
Defining the organizational boundary is a key step in
corporate GHG accounting. This step determines which
operations are included in the company’s organizational
boundary and how emissions from each operation are
consolidated by the reporting company. As detailed in
the GHG Protocol Corporate Standard, a company has
three options for defining its organizational boundaries as
shown in table 5.2.
Companies should use a consistent consolidation approach
across the scope 1, scope 2, and scope 3 inventories.
The selection of a consolidation approach affects which
activities in the company’s value chain are categorized
as direct emissions (i.e., scope 1 emissions) and indirect
emissions (i.e., scope 2 and scope 3 emissions). Operations
or activities that are excluded from a company’s scope 1
and scope 2 inventories as a result of the organizational
boundary definition (e.g., leased assets, investments, and
Emissions type Scope Definition Examples
Direct emissions Scope 1 Emissions from operations that are owned or controlled by the reporting company
Emissions from combustion in owned or controlled boilers, furnaces, vehicles, etc.; emissions from chemical production in owned or controlled process equipment
Indirect emissions
Scope 2 Emissions from the generation of purchased or acquired electricity, steam, heating, or cooling consumed by the reporting company
Use of purchased electricity, steam, heating, or cooling
Scope 3 All indirect emissions (not included in scope 2) that occur in the value chain of the reporting company, including both upstream and downstream emissions
Production of purchased products, transportation of purchased products, or use of sold products

[29]
CHAPTER 05 Identifying Scope 3 Emissions
franchises) may become relevant when accounting for
scope 3 emissions (see box 5.1).
Scope 3 includes:
• Emissions from activities in the value chain of the
entities included in the company’s organizational
boundary
• Emissions from leased assets, investments, and
franchises that are excluded from the company’s
organizational boundary but that the company
partially or wholly owns or controls (see box 5.1)
For example, if a company selects the equity share
approach, emissions from any asset the company partially
or wholly owns are included in its direct emissions (i.e.,
scope 1), but emissions from any asset the company
controls but does not partially or wholly own (e.g., a
leased asset) are excluded from its direct emissions and
should be included in its scope 3 inventory.1
Similarly, if a company selects the operational control
approach, emissions from any asset the company
controls are included in its direct emissions (i.e., scope
1), but emissions from any asset the company wholly or
partially owns but does not control (e.g., investments) are
excluded from its direct emissions and should be included
in its scope 3 inventory.
See the GHG Protocol Corporate Standard, chapter 3,
“Setting Organizational Boundaries” for more information
on each of the consolidation approaches.
5.3 Upstream and downstream scope 3 emissions
This standard divides scope 3 emissions into upstream
and downstream emissions. The distinction is based on
the financial transactions of the reporting company.
• Upstream emissions are indirect GHG emissions
related to purchased or acquired goods and services.
• Downstream emissions are indirect GHG emissions
related to sold2 goods and services.
In the case of goods purchased or sold by the reporting
company, upstream emissions occur up to the point of
receipt by the reporting company, while downstream
emissions occur subsequent to their sale by the reporting
company and transfer of control from the reporting
company to another entity (e.g., a customer). Emissions
from activities under the ownership or control of the
reporting company (i.e., direct emissions) are neither
upstream nor downstream (see figure 5.2).
Table [5.2] Consolidation approaches
Consolidation approach Description
Equity share Under the equity share approach, a company accounts for GHG emissions from operations according to its share of equity in the operation. The equity share reflects economic interest, which is the extent of rights a company has to the risks and rewards flowing from an operation.
Financial control Under the financial control approach, a company accounts for 100 percent of the GHG emissions over which it has financial control. It does not account for GHG emissions from operations in which it owns an interest but does not have financial control.
Operational control Under the operational control approach, a company accounts for 100 percent of the GHG emissions over which it has operational control. It does not account for GHG emissions from operations in which it owns an interest but does not have operational control.

[30] Corporate Value Chain (Scope 3) Accounting and Reporting Standard
Figure [5.1] Example of how the consolidation approach affects the scope 3 inventory
entity a entity b entity c entity d
upstream scope 3 emissions
upstream scope 3 emissions
downstream scope 3 emissions
downstream scope 3 emissions
entity a entity b entity c entity d
using the operational control approach
keyscope 1scope 3
keyscope 1scope 3
using the equity share approach
Box [5.1] Example of how the consolidation approach affects the scope 3 inventory
A reporting company has an equity share in four entities
(Entities A, B, C and D) and has operational control
over three of those entities (Entities A, B, and C). The
company selects the operational control approach to
define its organizational boundary. Emissions from
sources controlled by Entities A, B, and C are included
in the company’s scope 1 inventory, while emissions
from sources controlled by Entity D are excluded from
the reporting company’s scope 1 inventory. Emissions
in the value chain of Entities A, B, and C are included
in the company’s scope 3 inventory. Emissions from
the operation of Entity D are included in the reporting
company’s scope 3 inventory as an investment (according
to the reporting company’s share of equity in Entity D). If
the company instead selects the equity share approach to
define its organizational boundary, the company would
instead include emissions from sources controlled by
Entities A, B, C, and D in its scope 1 inventory, according to
its share of equity in each entity. See figure 5.1.
[31]
CHAPTER 05 Identifying Scope 3 Emissions
5.4 Overview of scope 3 categoriesThis standard categorizes scope 3 emissions into 15
distinct categories, as listed in figure 5.2 and table 5.3.
The categories are intended to provide companies with a
systematic framework to organize, understand, and report
on the diversity of scope 3 activities within a corporate
value chain. The categories are designed to be mutually
exclusive, such that, for any one reporting company, there
is no double counting of emissions between categories.3
Each scope 3 category is comprised of multiple scope 3
activities that individually result in emissions.
Table 5.4 includes descriptions of each of the 15
categories that comprise scope 3 emissions. Each category
is described in detail in section 5.5. Companies are
required to report scope 3 emissions by scope 3 category.
Any scope 3 activities not captured by the list of scope 3
categories may be reported separately (see chapter 11).
Minimum boundaries of scope 3 categoriesTable 5.4 identifies the minimum boundaries of each
scope 3 category in order to standardize the boundaries
of each category and help companies understand
which activities should be accounted for. The minimum
boundaries are intended to ensure that major activities
are included in the scope 3 inventory, while clarifying that
companies need not account for the value chain emissions
of each entity in its value chain, ad infinitum. Companies
may include emissions from optional activities within
each category. Companies may exclude scope 3 activities
included in the minimum boundary of each category,
provided that any exclusion is disclosed and justified. (For
more information, see chapter 6.)
For some scope 3 categories (e.g., purchased goods
and services, capital goods, fuel- and energy-related
activities), the minimum boundary includes all upstream
(cradle-to-gate4) emissions of purchased products to
Figure [5.2] Overview of GHG Protocol scopes and emissions across the value chain
CO2 CH4 SF6N2O HFCs PFCs
purchased electricity, steam, heating & cooling for own use
purchased goods and
services
capital goods
fuel and energy related
activities
transportation and distribution
waste generated in operations
business travel
transportation and distribution
processing of sold products
use of sold products
end-of-life treatment of sold products
leased assets franchisesemployee commuting
leased assets investments
company facilities
company vehicles
Scope 3 INDIRECT
CO2 CH4 SF6N2O HFCs PFCs
purchased electricity, steam, heating & cooling for own use
purchased goods and
services
capital goods
fuel and energy related
activities
transportation and distribution
waste generated in operations
business travel
transportation and distribution
processing of sold products
use of sold products
end-of-life treatment of sold products
leased assets franchisesemployee commuting
leased assets investments
company facilities
company vehicles
CO2 CH4 SF6N2O HFCs PFCs
purchased electricity, steam, heating & cooling for own use
purchased goods and
services
capital goods
fuel and energy related
activities
transportation and distribution
waste generated in operations
business travel
transportation and distribution
processing of sold products
use of sold products
end-of-life treatment of sold products
leased assets franchisesemployee commuting
leased assets investments
company facilities
company vehicles
CO2 CH4 SF6N2O HFCs PFCs
purchased electricity, steam, heating & cooling for own use
purchased goods and
services
capital goods
fuel and energy related
activities
transportation and distribution
waste generated in operations
business travel
transportation and distribution
processing of sold products
use of sold products
end-of-life treatment of sold products
leased assets franchisesemployee commuting
leased assets investments
company facilities
company vehicles
CO2 CH4 SF6N2O HFCs PFCs
purchased electricity, steam, heating & cooling for own use
purchased goods and
services
capital goods
fuel and energy related
activities
transportation and distribution
waste generated in operations
business travel
transportation and distribution
processing of sold products
use of sold products
end-of-life treatment of sold products
leased assets franchisesemployee commuting
leased assets investments
company facilities
company vehicles
CO2 CH4 SF6N2O HFCs PFCs
purchased electricity, steam, heating & cooling for own use
purchased goods and
services
capital goods
fuel and energy related
activities
transportation and distribution
waste generated in operations
business travel
transportation and distribution
processing of sold products
use of sold products
end-of-life treatment of sold products
leased assets franchisesemployee commuting
leased assets investments
company facilities
company vehicles
CO2 CH4 SF6N2O HFCs PFCs
purchased electricity, steam, heating & cooling for own use
purchased goods and
services
capital goods
fuel and energy related
activities
transportation and distribution
waste generated in operations
business travel
transportation and distribution
processing of sold products
use of sold products
end-of-life treatment of sold products
leased assets franchisesemployee commuting
leased assets investments
company facilities
company vehicles
CO2 CH4 SF6N2O HFCs PFCs
purchased electricity, steam, heating & cooling for own use
purchased goods and
services
capital goods
fuel and energy related
activities
transportation and distribution
waste generated in operations
business travel
transportation and distribution
processing of sold products
use of sold products
end-of-life treatment of sold products
leased assets franchisesemployee commuting
leased assets investments
company facilities
company vehicles
Reporting companyUpstream activities Downstream activities
CO2 CH4 SF6N2O HFCs PFCs
purchased electricity, steam, heating & cooling for own use
purchased goods and
services
capital goods
fuel and energy related
activities
transportation and distribution
waste generated in operations
business travel
transportation and distribution
processing of sold products
use of sold products
end-of-life treatment of sold products
leased assets franchisesemployee commuting
leased assets investments
company facilities
company vehicles
CO2 CH4 SF6N2O HFCs PFCs
purchased electricity, steam, heating & cooling for own use
purchased goods and
services
capital goods
fuel and energy related
activities
transportation and distribution
waste generated in operations
business travel
transportation and distribution
processing of sold products
use of sold products
end-of-life treatment of sold products
leased assets franchisesemployee commuting
leased assets investments
company facilities
company vehicles
Scope 1 DIRECT
Scope 2 INDIRECT
Scope 3 INDIRECT
CO2 CH4 SF6N2O HFCs PFCs
purchased electricity, steam, heating & cooling for own use
purchased goods and
services
capital goods
fuel and energy related
activities
transportation and distribution
waste generated in operations
business travel
transportation and distribution
processing of sold products
use of sold products
end-of-life treatment of sold products
leased assets franchisesemployee commuting
leased assets investments
company facilities
company vehicles
CO2 CH4 SF6N2O HFCs PFCs
purchased electricity, steam, heating & cooling for own use
purchased goods and
services
capital goods
fuel and energy related
activities
transportation and distribution
waste generated in operations
business travel
transportation and distribution
processing of sold products
use of sold products
end-of-life treatment of sold products
leased assets franchisesemployee commuting
leased assets investments
company facilities
company vehicles
CO2 CH4 SF6N2O HFCs PFCs
purchased electricity, steam, heating & cooling for own use
purchased goods and
services
capital goods
fuel and energy related
activities
transportation and distribution
waste generated in operations
business travel
transportation and distribution
processing of sold products
use of sold products
end-of-life treatment of sold products
leased assets franchisesemployee commuting
leased assets investments
company facilities
company vehicles
CO2 CH4 SF6N2O HFCs PFCs
purchased electricity, steam, heating & cooling for own use
purchased goods and
services
capital goods
fuel and energy related
activities
transportation and distribution
waste generated in operations
business travel
transportation and distribution
processing of sold products
use of sold products
end-of-life treatment of sold products
leased assets franchisesemployee commuting
leased assets investments
company facilities
company vehicles
CO2 CH4 SF6N2O HFCs PFCs
purchased electricity, steam, heating & cooling for own use
purchased goods and
services
capital goods
fuel and energy related
activities
transportation and distribution
waste generated in operations
business travel
transportation and distribution
processing of sold products
use of sold products
end-of-life treatment of sold products
leased assets franchisesemployee commuting
leased assets investments
company facilities
company vehicles
CO2 CH4 SF6N2O HFCs PFCs
purchased electricity, steam, heating & cooling for own use
purchased goods and
services
capital goods
fuel and energy related
activities
transportation and distribution
waste generated in operations
business travel
transportation and distribution
processing of sold products
use of sold products
end-of-life treatment of sold products
leased assets franchisesemployee commuting
leased assets investments
company facilities
company vehicles
CO2 CH4 SF6N2O HFCs PFCs
purchased electricity, steam, heating & cooling for own use
purchased goods and
services
capital goods
fuel and energy related
activities
transportation and distribution
waste generated in operations
business travel
transportation and distribution
processing of sold products
use of sold products
end-of-life treatment of sold products
leased assets franchisesemployee commuting
leased assets investments
company facilities
company vehicles
CO2 CH4 SF6N2O HFCs PFCs
purchased electricity, steam, heating & cooling for own use
purchased goods and
services
capital goods
fuel and energy related
activities
transportation and distribution
waste generated in operations
business travel
transportation and distribution
processing of sold products
use of sold products
end-of-life treatment of sold products
leased assets franchisesemployee commuting
leased assets investments
company facilities
company vehicles
CO2 CH4 SF6N2O HFCs PFCs
purchased electricity, steam, heating & cooling for own use
purchased goods and
services
capital goods
fuel and energy related
activities
transportation and distribution
waste generated in operations
business travel
transportation and distribution
processing of sold products
use of sold products
end-of-life treatment of sold products
leased assets franchisesemployee commuting
leased assets investments
company facilities
company vehicles

[32] Corporate Value Chain (Scope 3) Accounting and Reporting Standard
ensure that the inventory captures the GHG emissions of
products wherever they occur in the life cycle, from raw
material extraction through purchase by the reporting
company. For other categories (e.g., transportation and
distribution, waste generated in operations, business
travel, employee commuting, leased assets, franchises,
use of sold products, etc.), the minimum boundary
includes the scope 1 and scope 2 emissions of the
relevant value chain partner (e.g., the transportation
provider, waste management company, transportation
carrier, employee, lessor, franchisor, consumer, etc.).
For these categories, the major emissions related to
the scope 3 category result from scope 1 and scope 2
activities of the entity (e.g., the fuel consumed in an
airplane for business travel), rather than the emissions
associated with manufacturing capital goods or
infrastructure (e.g., the construction of an airplane or
airport for business travel). Companies may account for
additional emissions beyond the minimum boundary
where relevant.
Time boundary of scope 3 categoriesThis standard is designed to account for all emissions
related to the reporting company’s activities in the
reporting year (e.g., emissions related to products
purchased or sold in the reporting year). For some scope
3 categories, emissions occur simultaneously with the
activity (e.g., from combustion of energy), so emissions
occur in the same year as the company’s activities (see
figure 5.3). For some categories, emissions may have
occurred in previous years. For other scope 3 categories,
emissions are expected to occur in future years because
the activities in the reporting year have long-term
emissions impacts. For these categories, reported
emissions have not yet happened, but are expected to
happen as a result of the waste generated, investments
made, and products sold in the reporting year. For these
categories, the reported data should not be interpreted
to mean that emissions have already occurred, but that
emissions are expected to occur as a result of activities
that occurred in the reporting year.
Table [5.3] List of scope 3 categories
Upstream or downstream Scope 3 category
Upstream scope 3 emissions 1. Purchased goods and services
2. Capital goods
3. Fuel- and energy-related activities (not included in scope 1 or scope 2)
4. Upstream transportation and distribution
5. Waste generated in operations
6. Business travel
7. Employee commuting
8. Upstream leased assets
Downstream scope 3 emissions 9. Downstream transportation and distribution
10. Processing of sold products
11. Use of sold products
12. End-of-life treatment of sold products
13. Downstream leased assets
14. Franchises
15. Investments

[33]
CHAPTER 05 Identifying Scope 3 Emissions
Figure [5.3] Time boundary of scope 3 categories
15. Investments
9. Downstream transportation & distribution
1. Purchased goods & services
2. Capital goods
3. Fuel- and energy-related activities
4. Upstream transportation & distribution
5. Waste generated in operations
6. Business travel
7. Employee commuting
8. Upstream leased assets
10. Processing of sold products
11. Use of sold products
12. End of life treatment of sold products
13. Downstream leased assets
14. Franchises
Scope 3 category Past years
Reporting year
Future years

[34] Corporate Value Chain (Scope 3) Accounting and Reporting Standard
Upstream scope 3 emissions
Table [5.4] Description and boundaries of scope 3 categories
Category Category description Minimum boundary
1. Purchased goods and services
• Extraction, production, and transportation of goods and services purchased or acquired by the reporting company in the reporting year, not otherwise included in Categories 2 - 8
• All upstream (cradle-to-gate) emissions of purchased goods and services
2. Capital goods • Extraction, production, and transport-ation of capital goods purchased or acquired by the reporting company in the reporting year
• All upstream (cradle-to-gate) emissions of purchased capital goods
3. Fuel- and energy-related activities (not included in scope 1 or scope 2)
• Extraction, production, and transportation of fuels and energy purchased or acquired by the reporting company in the reporting year, not already accounted for in scope 1 or scope 2, including:
a. Upstream emissions of purchased fuels (extraction, production, and transportation of fuels consumed by the reporting company)
b. Upstream emissions of purchased electricity (extraction, production, and transportation of fuels consumed in the generation of electricity, steam, heating, and cooling consumed by the reporting company)
c. Transmission and distribution (T&D) losses (generation of electricity, steam, heating and cooling that is consumed (i.e., lost) in a T&D system) – reported by end user
d. Generation of purchased electricity that is sold to end users (generation of electricity, steam, heating, and cooling that is purchased by the reporting company and sold to end users) – reported by utility company or energy retailer only
a. For upstream emissions of purchased fuels: All upstream (cradle-to-gate) emissions of purchased fuels (from raw material extraction up to the point of, but excluding combustion)
b. For upstream emissions of purchased electricity: All upstream (cradle-to-gate) emissions of purchased fuels (from raw material extraction up to the point of, but excluding, combustion by a power generator)
c. For T&D losses: All upstream (cradle-to-gate) emissions of energy consumed in a T&D system, including emissions from combustion
d. For generation of purchased electricity that is sold to end users: Emissions from the generation of purchased energy

[35]
CHAPTER 05 Identifying Scope 3 Emissions
Upstream scope 3 emissions
Table [5.4] Description and boundaries of scope 3 categories (continued)
Category Category description Minimum boundary
4. Upstream transportation and distribution
• Transportation and distribution of products purchased by the reporting company in the reporting year between a company’s tier 1 suppliers and its own operations (in vehicles and facilities not owned or controlled by the reporting company)
• Transportation and distribution services purchased by the reporting company in the reporting year, including inbound logistics, outbound logistics (e.g., of sold products), and transportation and distribution between a company’s own facilities (in vehicles and facilities not owned or controlled by the reporting company)
• The scope 1 and scope 2 emissions of transportation and distribution providers that occur during use of vehicles and facilities (e.g., from energy use)
• Optional: The life cycle emissions associated with manufacturing vehicles, facilities, or infrastructure
5. Waste generated in operations
• Disposal and treatment of waste generated in the reporting company’s operations in the reporting year (in facilities not owned or controlled by the reporting company)
• The scope 1 and scope 2 emissions of waste management suppliers that occur during disposal or treatment
• Optional: Emissions from transportation of waste
6. Business travel • Transportation of employees for business-related activities during the reporting year (in vehicles not owned or operated by the reporting company)
• The scope 1 and scope 2 emissions of transportation carriers that occur during use of vehicles (e.g., from energy use)
• Optional: The life cycle emissions associated with manufacturing vehicles or infrastructure
7. Employee commuting
• Transportation of employees between their homes and their worksites during the reporting year (in vehicles not owned or operated by the reporting company)
• The scope 1 and scope 2 emissions of employees and transportation providers that occur during use of vehicles (e.g., from energy use)
• Optional: Emissions from employee teleworking
8. Upstream leased assets
• Operation of assets leased by the reporting company (lessee) in the reporting year and not included in scope 1 and scope 2 – reported by lessee
• The scope 1 and scope 2 emissions of lessors that occur during the reporting company’s operation of leased assets (e.g., from energy use)
• Optional: The life cycle emissions associated with manufacturing or constructing leased assets

[36] Corporate Value Chain (Scope 3) Accounting and Reporting Standard
Downtream scope 3 emissions
Table [5.4] Description and boundaries of scope 3 categories (continued)
Category Category description Minimum boundary
9. Downstream transportation and distribution
• Transportation and distribution of products sold by the reporting company in the reporting year between the reporting company’s operations and the end consumer (if not paid for by the reporting company), including retail and storage (in vehicles and facilities not owned or controlled by the reporting company)
• The scope 1 and scope 2 emissions of transportation providers, distributors, and retailers that occur during use of vehicles and facilities (e.g., from energy use)
• Optional: The life cycle emissions associated with manufacturing vehicles, facilities, or infrastructure
10. Processing of sold products
• Processing of intermediate products sold in the reporting year by downstream companies (e.g., manufacturers)
• The scope 1 and scope 2 emissions of downstream companies that occur during processing (e.g., from energy use)
11. Use of sold products
• End use of goods and services sold by the reporting company in the reporting year
• The direct use-phase emissions of sold products over their expected lifetime (i.e., the scope 1 and scope 2 emissions of end users that occur from the use of: products that directly consume energy (fuels or electricity) during use; fuels and feedstocks; and GHGs and products that contain or form GHGs that are emitted during use)
• Optional: The indirect use-phase emissions of sold products over their expected lifetime (i.e., emissions from the use of products that indirectly consume energy (fuels or electricity) during use)
12. End-of-life treatment of sold products
• Waste disposal and treatment of products sold by the reporting company (in the reporting year) at the end of their life
• The scope 1 and scope 2 emissions of waste management companies that occur during disposal or treatment of sold products
13. Downstream leased assets
• Operation of assets owned by the reporting company (lessor) and leased to other entities in the reporting year, not included in scope 1 and scope 2 – reported by lessor
• The scope 1 and scope 2 emissions of lessees that occur during operation of leased assets (e.g., from energy use).
• Optional: The life cycle emissions associated with manufacturing or constructing leased assets
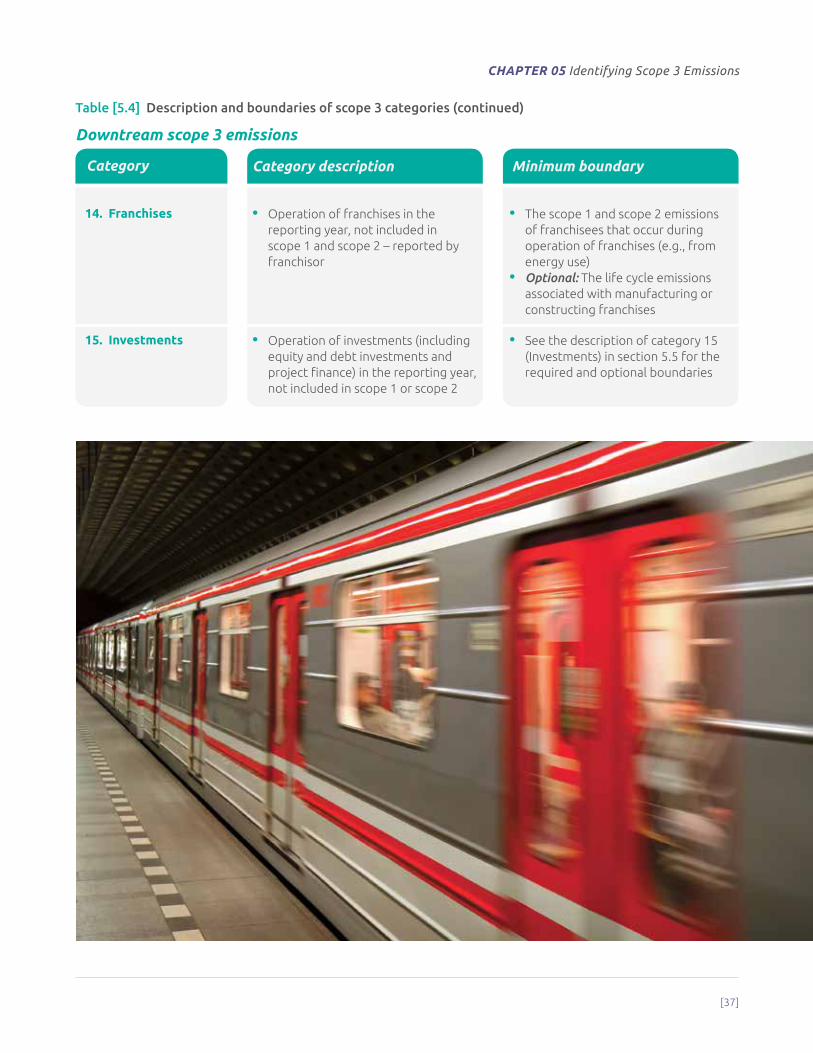
[37]
CHAPTER 05 Identifying Scope 3 Emissions
Downtream scope 3 emissions
Table [5.4] Description and boundaries of scope 3 categories (continued)
Category Category description Minimum boundary
14. Franchises • Operation of franchises in the reporting year, not included in scope 1 and scope 2 – reported by franchisor
• The scope 1 and scope 2 emissions of franchisees that occur during operation of franchises (e.g., from energy use)
• Optional: The life cycle emissions associated with manufacturing or constructing franchises
15. Investments • Operation of investments (including equity and debt investments and project finance) in the reporting year, not included in scope 1 or scope 2
• See the description of category 15 (Investments) in section 5.5 for the required and optional boundaries

[38] Corporate Value Chain (Scope 3) Accounting and Reporting Standard
5.5 Descriptions of scope 3 categoriesThis section provides detailed descriptions of each scope
3 category.
Category 1: Purchased goods and servicesThis category includes all upstream (i.e., cradle-to-gate)
emissions from the production of products purchased
or acquired by the reporting company in the reporting
year. Products include both goods (tangible products) and
services (intangible products).
This category includes emissions from all purchased
goods and services not otherwise included in the other
categories of upstream scope 3 emissions (i.e., category
2 through category 8). Specific categories of upstream
emissions are separately reported in category 2 through
category 8 to enhance the transparency and consistency
of scope 3 reports.
Cradle-to-gate emissions include all emissions that occur
in the life cycle of purchased products, up to the point of
receipt by the reporting company (excluding emissions
from sources that are owned or controlled by the
reporting company). Cradle-to-gate emissions may include:
• Extraction of raw materials
• Agricultural activities
• Manufacturing, production, and processing
• Generation of electricity consumed by
upstream activities
• Disposal/treatment of waste generated by
upstream activities
• Land use and land-use change5
• Transportation of materials and products
between suppliers
• Any other activities prior to acquisition by the
reporting company
Emissions from the use of products purchased by the
reporting company are accounted for in either scope 1
(e.g., for fuel use) or scope 2 (e.g., for electricity use),
rather than scope 3.
Companies may find it useful to differentiate between
purchases of production-related and non-production-
related products. Doing so may be aligned with existing
procurement practices and therefore may be a useful way
to more efficiently organize and collect data (see box 5.2).
Companies may also find it useful to differentiate
between purchases of intermediate products, final
products, and capital goods (see box 5.3).
Box [5.2] Production-related and non-production-related procurement
A company’s purchases can be divided into two types:
• Production-related procurement
• Non-production-related procurement
Production-related procurement (often called direct
procurement) consists of purchased goods that are
directly related to the production of a company’s
products. Production-related procurement includes:
• Intermediate goods (e.g., materials, components,
and parts) that the company purchases to process,
transform, or include in another product
• Final goods purchased for resale (for retail and
distribution companies only)
• Capital goods (e.g., plant, property, and equipment) that
the company uses to manufacture a product, provide a
service, or sell, store, and deliver merchandise
Non-production-related procurement (often called indirect
procurement) consists of purchased goods and services
that are not integral to the company’s products, but are
instead used to enable operations. Non-production-related
procurement may include capital goods, such as furniture,
office equipment, and computers. Non-production-related
procurement includes:
• Operations resource management: Products used in
office settings such as office supplies, office furniture,
computers, telephones, travel services, IT support,
outsourced administrative functions, consulting
services, and janitorial and landscaping services
• Maintenance, repairs, and operations: Products used
in manufacturing settings, such as spare parts and
replacement parts

[39]
CHAPTER 05 Identifying Scope 3 Emissions
Category 2: Capital goodsThis category includes all upstream (i.e., cradle-to-gate)
emissions from the production of capital goods purchased
or acquired by the reporting company in the reporting year.
Emissions from the use of capital goods by the reporting
company are accounted for in either scope 1 (e.g., for fuel
use) or scope 2 (e.g., for electricity use), rather than scope 3.
Capital goods are final products that have an extended
life and are used by the company to manufacture a
product, provide a service, or sell, store, and deliver
merchandise. In financial accounting, capital goods
are treated as fixed assets or as plant, property, and
equipment (PP&E). Examples of capital goods include
equipment, machinery, buildings, facilities, and vehicles.
In certain cases, there may be ambiguity over whether
a particular purchased product is a capital good (to be
reported in category 2) or a purchased good (to be
reported in category 1). Companies should follow their
own financial accounting procedures to determine
whether to account for a purchased product as a capital
good in this category or as a purchased good or service
in category 1. Companies should not double count
emissions between category 1 and category 2.
Intermediate products are inputs to the production of
other goods or services that require further processing,
transformation, or inclusion in another product before
use by the end consumer. Intermediate products are not
consumed by the end user in their current form.
Final products are goods and services that are consumed
by the end user in their current form, without further
processing, transformation, or inclusion in another
product. Final products include:
• Products consumed by end consumers
• Products sold to retailers for resale to end consumers
(e.g., consumer products)
• Products consumed by businesses in their current form
(e.g., office supplies)
Capital goods are final goods that are not immediately
consumed or further processed by the company, but are
instead used in their current form by the company to
manufacture a product, provide a service, or sell, store,
and deliver merchandise. Scope 3 emissions from capital
goods are reported in category 2 (Capital goods), rather
than category 1 (Purchased goods and services).
Intermediate goods and capital goods are both inputs
to a company’s operations. The distinction between
intermediate goods and capital goods depends on the
circumstances. For example, if a company includes an
electrical motor in another product (e.g., a motor vehicle),
the electrical motor is an intermediate good. If a company
uses the electrical motor to produce other goods, it is a
capital good consumed by the reporting company.
Box [5.3] Intermediate products, final products, and capital goods
In financial accounting, capital goods (sometimes
called “capital assets”) are typically depreciated or
amortized over the life of the asset. For purposes of
accounting for scope 3 emissions companies should
not depreciate, discount, or amortize the emissions
from the production of capital goods over time.
Instead companies should account for the total
cradle-to-gate emissions of purchased capital goods
in the year of acquisition, the same way the company
accounts for emissions from other purchased products
in category 1. If major capital purchases occur only
once every few years, scope 3 emissions from capital
goods may fluctuate significantly from year to year.
Companies should provide appropriate context in the
public report (e.g., by highlighting exceptional or non-
recurring capital investments).
Box [5.4] Accounting for emissions from capital goods

[40] Corporate Value Chain (Scope 3) Accounting and Reporting Standard
BASF, a global chemical company, is committed to
acting responsibly throughout its entire value chain
in order to build stable and sustainable relationships
with business partners. When making decisions, BASF
chooses carriers, service providers, and suppliers
not just on the basis of price, but also on the basis
of their performance in environmental and social
responsibility. When calculating scope 3 emissions
from category 1 (Purchased goods and services),
BASF accounted for emissions from raw materials,
components, packaging materials, and other goods
and services not included in the other upstream
scope 3 categories. BASF found that, in 2009, scope
3 emissions from category 1 (Purchased goods and
services) accounted for 24 percent of its total scope
3 emissions and 20 percent of its combined scope 1,
scope 2, and scope 3 emissions.
Calculating emissions from raw materialsBASF accounted for scope 3 emissions from 100
percent of its procured raw materials and component
manufacturing at its suppliers’ facilities (by weight).
BASF calculated the cradle-to-gate emissions of raw
materials, including all direct GHG emissions from raw
material extraction, precursor manufacturing, and
transport, as well as indirect emissions from energy
use. To do so, BASF determined the quantity of each
product purchased, then applied cradle-to-gate
emission factors for about 90 percent of the purchased
products (by weight), obtained from commercially and
publically available data sources as well as from its own
life cycle assessment database, which is based mainly
on primary data. BASF multiplied the CO2e emissions
per kilogram of each product by the respective
quantity of the product purchased to determine
cradle-to-gate emissions. Finally, BASF extrapolated
the resulting scope 3 emissions to 100 percent of total
purchases in order to account for all procured raw
materials and components.
Calculating emissions from packagingBASF first determined the types and quantities of
packaging materials purchased in the reporting year
(such as plastic, paper board, and steel) based on the
number of containers purchased and the fractions of
materials used in each container. BASF then calculated
GHG emissions by multiplying the total amount of
various materials by their respective cradle-to gate
emission factors.
ResultsBASF found that 93 percent of its category 1 GHG
emissions result from the raw materials purchased, while
packaging, services and, equipment account for only
7 percent. This finding suggests the need to prioritize
future scope 3 accounting and reduction efforts on
raw materials. Working with suppliers to improve GHG
performance will help
BASF reduce its scope
3 emissions from raw
materials over time.
The company’s results
could also inform
the development
of sector-specific
guidance for the
chemical industry,
by focusing on
raw materials and
components for the
chemical sector.
BASF: Scope 3 emissions from purchased goods and services
Scope 3 emissions from category 1 (Purchased goods and services) accounted for 24 percent of BASF’s total scope 3 emissions and 20 percent of its combined scope 1, scope 2, and scope 3 emissions.

[41]
CHAPTER 05 Identifying Scope 3 Emissions
Category 3: Fuel- and energy-related emissions not included in scope 1 or scope 2
This category includes emissions related to the production
of fuels and energy purchased and consumed by the
reporting company in the reporting year that are not
included in scope 1 or scope 2.
Category 3 excludes emissions from the combustion of
fuels or electricity consumed by the reporting company,
since they are already included in scope 1 or scope 2.
Scope 1 includes emissions from the combustion of
fuels by sources owned or controlled by the reporting
company. Scope 2 includes the emissions from the
combustion of fuels to generate electricity, steam,
heating, and cooling purchased and consumed by the
reporting company.
This category includes emissions from four distinct
activities (see table 5.5).
Table [5.5] Activities included in category 3 (Fuel- and energy-related emissions not included in scope 1 or scope 2)
Activity Description Applicability
a. Upstream emissions of purchased fuels
Extraction, production, and transportation of fuels consumed by the reporting company• Examples include mining of coal, refining of gasoline,
transmission and distribution of natural gas, production of biofuels, etc.
Applicable to end users of fuels
b. Upstream emissions of purchased electricity
Extraction, production, and transportation of fuels consumed in the generation of electricity, steam, heating, and cooling that is consumed by the reporting company• Examples include mining of coal, refining of fuels,
extraction of natural gas, etc.
Applicable to end users of electricity, steam, heating and cooling
Applicable to end users of electricity, steam, heating and cooling
c. T&D losses Generation of electricity, steam, heating, and cooling that is consumed (i.e., lost) in a T&D system – reported by end user
d. Generation of purchased electricity that is sold to end users
Generation of electricity, steam, heating, and cooling that is purchased by the reporting company and sold to end users – reported by utility company or energy retailer• Note: This activity is particularly relevant for utility
companies that purchase wholesale electricity supplied by independent power producers for resale to their customers.
Applicable to utility companies and energy retailers

[42] Corporate Value Chain (Scope 3) Accounting and Reporting Standard
Figure [5.4] Emissions across an electricity value chain
Figure 5.4 illustrates an electricity value chain. A coal
mining and processing company (A) directly emits
5 metric tons of CO2e per year from its operations and
sells coal to a power generator (B), which generates
100 MWh of electricity and directly emits 100 metric
tons of CO2e per year. A utility (C) that owns and
operates a T&D system purchases all of the generator’s
electricity. The utility consumes 10 MWh due to T&D
losses (corresponding to 10 metric tons CO2e of
scope 2 emissions per year) and delivers the remaining
90 MWh to an end user (D), which consumes 90 MWh
(corresponding to 90 metric tons CO2e of scope 2
emissions per year).
Table 5.6 explains how each company accounts for
GHG emissions. In this example, the emission factor of
the electricity sold by Company B is 1 t CO2e/MWh. All
numbers are illustrative only.
Box [5.5] Accounting for emissions from the production, transmission, and use of electricity
5t
CO
2e
coal mining, processing & transport
Aconsumer
Dutility
C
10t
CO
2e
90t
CO
2e
100t
CO
2e
scope 2
scope 1
coal
powergenerator
B
1 2 3
4 5 6
7 8 9
10 11 12
13 14 15
16 17
1. wheat2. tree3. mountains4. glass bottle5. plastic bottle6. aluminium can7. factory8. lorry9. cloud10. recycling bin11. recycling bin (colours reversed)12. wind turbines13. chicken14. cow 115. cow 216. shop17. factory showing carbon emissions (carbon emissions are shown in orange)
100 MWh 90 MWh

[43]
CHAPTER 05 Identifying Scope 3 Emissions
Reporting company
Scope 1 Scope 2 Scope 3
Coal mining, processing, and transport (Company A)
5 t CO2e 0 (unless electricity is used during coal mining and processing)
100 t CO2e from the combustion of sold products (i.e., coal)
Reported in category 11 (Use of sold products)
Power generator(Company B)
100 t CO2e 0 5 t CO2e from the extraction, production, and transportation of fuel (i.e., coal) consumed by the reporting company
Reported in Category 3 (Fuel- and energy-related activities)
Note: The generator does not account for scope 3 emissions associated with sold electricity because the emissions are already accounted for in scope 1.
Utility(Company C)
0 (unless SF6 is released from the T&D system)
10 t CO2e from the generation of electricity purchased and consumed by Company C
0.5 t CO2e from the extraction, production, and transportation of fuels (i.e., coal) consumed in the generation of electricity consumed by Company C (5 tons from coal mining x 10 percent of electricity generated by B that is consumed by C)
94.5 t CO2e from the generation of electricity purchased by Company C and sold to Company D
Both are reported in category 3 (Fuel- and energy-related activities)
End consumer of electricity (Company D)
0 90 t CO2e from the generation of electricity purchased and consumed by Company D
4.5 t CO2e from the extraction, production, and transportation of coal consumed in the generation of electricity consumed by Company D
10.5 t CO2e from the generation of electricity that is consumed (i.e., lost) in transmission and distribution
Both are reported in category 3 (Fuel- and energy-related activities)
Table [5.6] Accounting for emissions across an electricity value chain
Box [5.5] Accounting for emissions from the production, transmission, and use of electricity (continued)

[44] Corporate Value Chain (Scope 3) Accounting and Reporting Standard
Category 4: Upstream transportation and distribution
This category includes emissions from the transportation
and distribution of products (excluding fuel and energy
products) purchased or acquired by the reporting
company in the reporting year in vehicles and facilities not
owned or operated by the reporting company, as well as
other transportation and distribution services purchased
by the reporting company in the reporting year (including
both inbound and outbound logistics).
Specifically, this category includes:
• Transportation and distribution of products purchased
by the reporting company in the reporting year, between
a company’s tier 1 suppliers6 and its own operations
(including multi-modal shipping where multiple carriers
are involved in the delivery of a product)
• Third-party transportation and distribution services
purchased by the reporting company in the reporting
year (either directly or through an intermediary),
including inbound logistics, outbound logistics (e.g.,
of sold products), and third-party transportation and
distribution between a company’s own facilities
Emissions may arise from the following transportation
and distribution activities throughout the value chain:
• Air transport
• Rail transport
• Road transport
• Marine transport
• Storage of purchased products in warehouses,
distribution centers, and retail facilities
Outbound logistics services purchased by the reporting
company are categorized as upstream because they
are a purchased service. Emissions from transportation
and distribution of purchased products upstream of the
reporting company’s tier 1 suppliers (e.g., transportation
between a company’s tier 2 and tier 1 suppliers) are
accounted for in scope 3, category 1 (Purchased goods
and services). Table 5.7 explains the scope and scope 3
category where each type of transportation and
distribution activity should be accounted for.
A reporting company’s scope 3 emissions from upstream
transportation and distribution include the scope 1 and
scope 2 emissions of third-party transportation companies.
Category 5: Waste generated in operationsThis category includes emissions from third-party
disposal and treatment of waste that is generated in the
reporting company’s owned or controlled operations
in the reporting year. This category includes emissions
from disposal of both solid waste and wastewater. Only
waste treatment in facilities owned or operated by
third parties is included in scope 3. Waste treatment at
facilities owned or controlled by the reporting company
is accounted for in scope 1 and scope 2. Treatment
of waste generated in operations is categorized as an
upstream scope 3 category because waste management
services are purchased by the reporting company.
This category includes all future emissions that result
from waste generated in the reporting year. (See
section 5.4 for more information on the time boundary
of scope 3 categories.)
Waste treatment activities may include:
• Disposal in a landfill
• Disposal in a landfill with landfill-gas-to-energy (LFGTE) –
i.e., combustion of landfill gas to generate electricity
• Recovery for recycling
• Incineration
• Composting
• Waste-to-energy (WTE) or energy-from-waste (EfW) –
i.e., combustion of municipal solid waste (MSW)
to generate electricity
• Wastewater treatment
Companies may optionally include emissions from
transportation of waste.
See box 5.6 for guidance on accounting for emissions
from recycling.
A reporting company’s scope 3 emissions from waste
generated in operations include the scope 1 and
scope 2 emissions of solid waste and wastewater
management companies.

[45]
CHAPTER 05 Identifying Scope 3 Emissions
Table [5.7] Accounting for emissions from transportation and distribution activities in the value chain
Transportation and distribution activity in the value chain Scope and scope 3 category
Transportation and distribution in vehicles and facilities owned or controlled by the reporting company
Scope 1 (for fuel use) or scope 2 (for electricity use)
Transportation and distribution in vehicles and facilities leased by and operated by the reporting company (and not already included in scope 1 or scope 2)
Scope 3, category 8 (Upstream leased assets)
Transportation and distribution of purchased products, upstream of the reporting company’s tier 1 suppliers (e.g., transportation between a company’s tier 2 and tier 1 suppliers)
Scope 3, category 1 (Purchased goods and services), since emissions from transportation are already included in the cradle-to-gate emissions of purchased products. These emissions are not required to be reported separately from category 1.
Production of vehicles (e.g., ships, trucks, planes) purchased or acquired by the reporting company
Account for the upstream (i.e., cradle-to-gate) emissions associated with manufacturing vehicles in Scope 3, category 2 (Capital goods)
Transportation of fuels and energy consumed by the reporting company Scope 3, category 3 (Fuel- and energy-related emissions not included in scope 1 or scope 2)
Transportation and distribution of products purchased by the reporting company, between a company’s tier 1 suppliers and its own operations (in vehicles and facilities not owned or controlled by the reporting company)
Transportation and distribution services purchased by the reporting company in the reporting year (either directly or through an intermediary), including inbound logistics, outbound logistics (e.g., of sold products), and transportation and distribution between a company’s own facilities (in vehicles and facilities not owned or controlled by the reporting company)
Scope 3, category 4 (Upstream transportation and distribution)
Transportation and distribution of products sold by the reporting company between the reporting company’s operations and the end consumer (if not paid for by the reporting company), including retail and storage (in vehicles and facilities not owned or controlled by the reporting company)
Scope 3, category 9 (Downstream transportation and distribution)

[46] Corporate Value Chain (Scope 3) Accounting and Reporting Standard
Category 6: Business travel This category includes emissions from the transportation
of employees for business-related activities in vehicles
owned or operated by third parties, such as aircraft,
trains, buses, and passenger cars.
Emissions from transportation in vehicles owned or
controlled by the reporting company are accounted for
in either scope 1 (for fuel use) or scope 2 (for electricity
use). Emissions from leased vehicles operated by the
reporting company not included in scope 1 or scope 2 are
accounted for in scope 3, category 8 (Upstream leased
assets). Emissions from transportation of employees to
and from work are accounted for in scope 3, category 7
(Employee commuting).
Emissions from business travel may arise from:
• Air travel
• Rail travel
• Bus travel
• Automobile travel (e.g., business travel in rental cars
or employee-owned vehicles other than employee
commuting to and from work)
• Other modes of travel
Companies may optionally include emissions from
business travelers staying in hotels.
A reporting company’s scope 3 emissions from business
travel include the scope 1 and scope 2 emissions of
transportation companies (e.g., airlines).
Category 7: Employee commutingThis category includes emissions from the transportation
of employees7 between their homes and their worksites.
Emissions from employee commuting may arise from:
• Automobile travel
• Bus travel
• Rail travel
• Air travel
• Other modes of transportation
Companies may include emissions from teleworking (i.e.,
employees working remotely) in this category.
A reporting company’s scope 3 emissions from employee
commuting include the scope 1 and scope 2 emissions of
employees and third-party transportation providers.
Even though employee commuting is not always
purchased or reimbursed by the reporting company, it is
categorized as an upstream scope 3 category because it
is a service that enables company operations, similar to
purchased or acquired goods and services.
Companies (e.g., plastic bottle manufacturers) may
both purchase materials with recycled content (e.g.,
plastic) and sell products that are recyclable (e.g.,
plastic bottles). In this case, accounting for emissions
from the recycling processes both upstream and
downstream would double count emissions from
recycling. To avoid double counting of emissions from
recycling processes by the same company, companies
should account for upstream emissions from recycling
processes in category 1 and category 2 when the
company purchases goods or materials with recycled
content. In category 5 and category 12, companies
should account for emissions from recovering materials
at the end of their life for recycling, but should not
account for emissions from recycling processes
themselves (these are instead included in category 1
and category 2 by purchasers of recycled materials).
Companies should not report negative or avoided
emissions associated with recycling in category 5
or category 12. Any claims of avoided emissions
associated with recycling should not be included in,
or deducted from, the scope 3 inventory, but may
instead be reported separately from scope 1, scope 2,
and scope 3 emissions. Companies that report avoided
emissions should also provide data to support the
claim that emissions are avoided (e.g., that recycled
materials are collected, recycled, and used) and report
the methodology, data sources, system boundary,
time period, and other assumptions used to calculate
avoided emissions. For more information on avoided
emissions, see section 9.5.
Box [5.6] Accounting for emissions from recycling

[47]
CHAPTER 05 Identifying Scope 3 Emissions
Category 8: Upstream leased assets This category includes emissions from the operation
of assets that are leased by the reporting company
in the reporting year and not already included in the
reporting company’s scope 1 or scope 2 inventories. This
category is only applicable to companies that operate
leased assets (i.e., lessees). For companies that own
and lease assets to others (i.e., lessors), see category 13
(Downstream leased assets).
Leased assets may be included in a company’s scope 1 or
scope 2 inventory depending on the type of lease and the
consolidation approach the company uses to define its
organizational boundaries (see section 5.2).
If the reporting company leases an asset for only part of
the reporting year, it should account for emissions for the
portion of the year that the asset was leased. A reporting
company’s scope 3 emissions from upstream leased assets
include the scope 1 and scope 2 emissions of lessors
(depending on the lessor’s consolidation approach).
See Appendix A for more information on accounting for
emissions from leased assets.
Category 9: Downstream transportation and distribution
This category includes emissions from transportation and
distribution of products sold by the reporting company
in the reporting year between the reporting company’s
operations and the end consumer (if not paid for by
the reporting company), in vehicles and facilities not
owned or controlled by the reporting company. This
category includes emissions from retail and storage.
Outbound transportation and distribution services that
are purchased by the reporting company are excluded
from category 9 and included in category 4 (Upstream
transportation and distribution) because the reporting
company purchases the service. Category 9 only includes
transportation- and distribution-related emissions that
occur after the reporting company pays to produce
and distribute its products. See table 5.7 for guidance
on accounting for emissions from transportation and
distribution in the value chain.
Emissions from downstream transportation and
distribution can arise from:
• Storage of sold products in warehouses and
distribution centers
• Storage of sold products in retail facilities
• Air transport
• Rail transport
• Road transport
• Marine transport
Companies may include emissions from customers
traveling to retail stores in this category, which can be
significant for companies that own or operate retail
facilities. See section 5.6 for guidance on the applicability
of category 9 to final products and intermediate products
sold by the reporting company. A reporting company’s
scope 3 emissions from downstream transportation and
distribution include the scope 1 and scope 2 emissions
of transportation companies, distribution companies,
retailers, and (optionally) customers.
Category 10: Processing of sold productsThis category includes emissions from processing
of sold intermediate products by third parties (e.g.,
manufacturers) subsequent to sale by the reporting
company. Intermediate products are products that
require further processing, transformation, or inclusion in
another product before use (see box 5.3), and therefore
result in emissions from processing subsequent to sale
by the reporting company and before use by the end
consumer. Emissions from processing should be allocated
to the intermediate product.
In certain cases, the eventual end use of sold intermediate
products may be unknown. For example, a company may
produce an intermediate product with many potential
downstream applications, each of which has a different
GHG emissions profile, and be unable to reasonably
estimate the downstream emissions associated with the
various end uses of the intermediate product. See section
6.4 for guidance in cases where downstream emissions
associated with sold intermediate products are unknown.
Companies may calculate emissions from category 10
without collecting data from customers or other value
chain partners. For more information, see Guidance for

[48] Corporate Value Chain (Scope 3) Accounting and Reporting Standard
Calculating Scope 3 Emissions, available online at
www.ghgprotocol.org. See also section 5.6 for guidance
on the applicability of category 10 to final products and
intermediate products sold by the reporting company.
A reporting company’s scope 3 emissions from
processing of sold intermediate products include the
scope 1 and scope 2 emissions of downstream value
chain partners (e.g., manufacturers).
Category 11: Use of sold productsThis category includes emissions from the use of goods
and services sold by the reporting company in the
reporting year. A reporting company’s scope 3 emissions
from use of sold products include the scope 1 and scope 2
emissions of end users. End users include both consumers
and business customers that use final products.
This standard divides emissions from the use of sold
products into two types:
• Direct use-phase emissions
• Indirect use-phase emissions
The minimum boundary of category 11 includes direct
use-phase emissions of sold products. Companies may
also account for indirect use-phase emissions of sold
products, and should do so when indirect use-phase
emissions are expected to be significant. See table 5.8
for descriptions and examples of direct and indirect use-
phase emissions.
This category includes the total expected lifetime
emissions from all relevant products sold in the
reporting year across the company’s product portfolio.
By doing so, the scope 3 inventory accounts for a
company’s total GHG emissions associated with its
activities in the reporting year. (Refer to section 5.4
for more information on the time boundary of scope
3 categories.) See box 5.7 for an example of reporting
product lifetime emissions and box 5.8 for guidance
related to product lifetime and durability. Refer to
the GHG Protocol Product Standard for information on
accounting for GHG emissions from individual products
over their life cycle.
Companies may optionally include emissions associated
with maintenance of sold products during use.
See section 5.6 for guidance on the applicability of
category 11 to final products and intermediate products
sold by the reporting company.
Companies may calculate emissions from category 11
without collecting data from customers or consumers.
Table [5.8] Emissions from use of sold products
Type of emissions Product type Examples
Direct use-phase emissions (Required)
Products that directly consume energy (fuels or electricity) during use
Automobiles, aircraft, engines, motors, power plants, buildings, appliances, electronics, lighting, data centers, web-based software
Fuels and feedstocks Petroleum products, natural gas, coal, biofuels, and crude oil
Greenhouse gases and products that contain or form greenhouse gases that are emitted during use
CO2, CH4, N2O, HFCs, PFCs, SF6, refrigeration and air-conditioning equipment, industrial gases, fire extinguishers, fertilizers
Indirect use-phase emissions(Optional)
Products that indirectly consume energy (fuels or electricity) during use
Apparel (requires washing and drying), food (requires cooking and refrigeration), pots and pans (require heating), and soaps and detergents (require heated water)

[49]
CHAPTER 05 Identifying Scope 3 Emissions
Calculating emissions from category 11 typically
requires product design specifications and assumptions
about how consumers use products (e.g., use profiles,
assumed product lifetimes, etc.). For more information,
see Guidance for Calculating Scope 3 Emissions, available
online at www.ghgprotocol.org. Companies are
required to report a description of the methodologies
and assumptions used to calculate emissions (see
chapter 11).
Where relevant, companies should report additional
information on product performance when reporting
scope 3 emissions in order to provide additional
Box [5.7] Example of reporting product lifetime emissions
An automaker sells one million cars in 2010. Each car
has an expected lifetime of ten years. The company
reports the anticipated use-phase emissions of
the one million cars it sold in 2010 over their ten
year expected lifetime. The company also reports
corporate average fuel economy (km per liter) and
corporate average emissions (kg CO2e/km) as relevant
emissions-intensity metrics.
Because the scope 3 inventory accounts for total
lifetime emissions of sold products, companies that
produce more durable products with longer lifetimes
could appear to be penalized because, as product
lifetimes increase, scope 3 emissions increase,
assuming all else is constant. To reduce the potential
for emissions data to be misinterpreted, companies
should also report relevant information such as
product lifetimes and emissions intensity metrics
to demonstrate product performance over time.
Relevant emissions intensity metrics may include
annual emissions per product, energy efficiency per
product, emissions per hour of use, emissions per
kilometer driven, emissions per functional unit, etc.
Box [5.8] Product lifetime and durability
transparency on steps companies are taking to reduce
GHG emissions from sold products. Such information
may include GHG intensity metrics, energy intensity
metrics, and annual emissions from the use of sold
products (see section 11.3). See section 9.3 for
guidance on recalculating base year emissions when
methodologies or assumptions related to category 11
change over time.
Any claims of avoided emissions related to a company’s
sold products must be reported separately from the
company’s scope 1, scope 2, and scope 3 inventories.
(For more information, see section 9.5.)
Category 12: End-of-life treatment of sold productsThis category includes emissions from the waste
disposal and treatment of products sold by the
reporting company (in the reporting year) at the end
of their life.
This category includes the total expected end-of-life
emissions from all products sold in the reporting year.
(See section 5.4 for more information on the time
boundary of scope 3 categories.) End-of-life treatment
methods (e.g. landfilling, incineration) are described in
category 5 (Waste generated in operations). A reporting
company’s scope 3 emissions from end-of-life treatment
of sold products include the scope 1 and scope 2
emissions of waste management companies.
See section 5.6 for guidance on the applicability
of category 12 to final products and intermediate
products sold by the reporting company and box
5.6 for guidance on accounting for emissions from
recycling, which applies to both category 5 and
category 12. Calculating emissions from category 12
requires assumptions about the end-of-life treatment
methods used by consumers. For more information,
see Guidance for Calculating Scope 3 Emissions, available
online at www.ghgprotocol.org. Companies are
required to report a description of the methodologies
and assumptions used to calculate emissions (see
chapter 11).
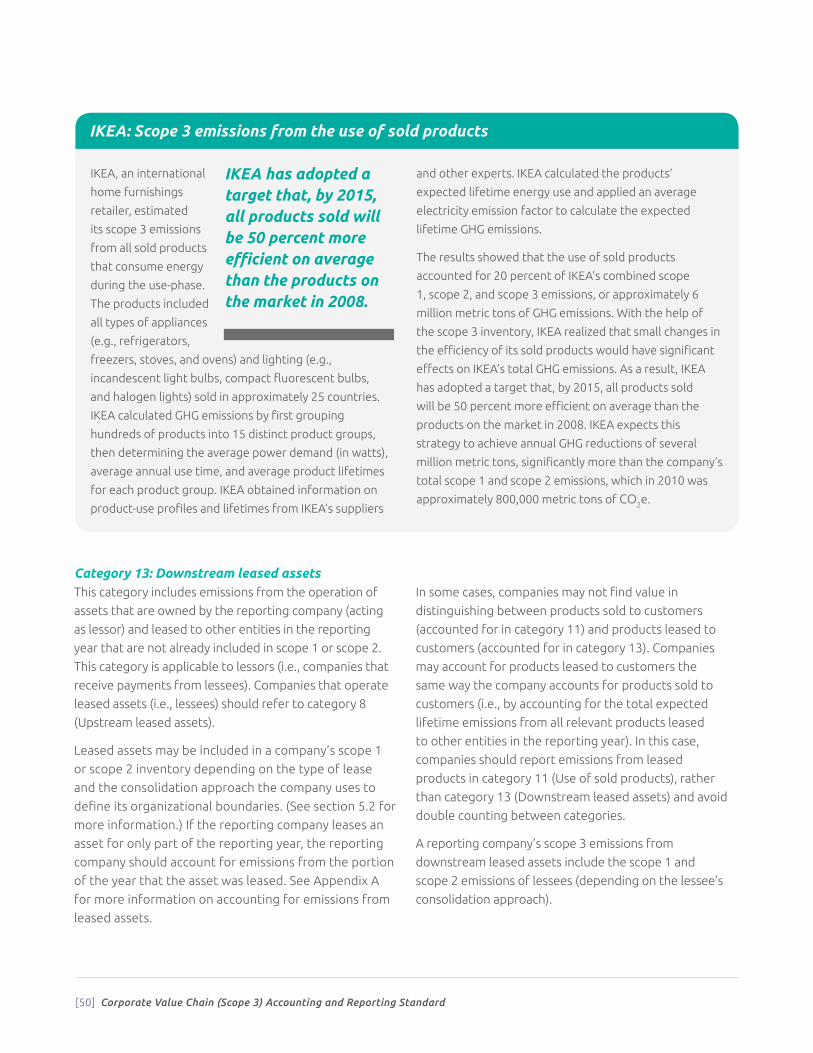
[50] Corporate Value Chain (Scope 3) Accounting and Reporting Standard
Category 13: Downstream leased assets This category includes emissions from the operation of
assets that are owned by the reporting company (acting
as lessor) and leased to other entities in the reporting
year that are not already included in scope 1 or scope 2.
This category is applicable to lessors (i.e., companies that
receive payments from lessees). Companies that operate
leased assets (i.e., lessees) should refer to category 8
(Upstream leased assets).
Leased assets may be included in a company’s scope 1
or scope 2 inventory depending on the type of lease
and the consolidation approach the company uses to
define its organizational boundaries. (See section 5.2 for
more information.) If the reporting company leases an
asset for only part of the reporting year, the reporting
company should account for emissions from the portion
of the year that the asset was leased. See Appendix A
for more information on accounting for emissions from
leased assets.
In some cases, companies may not find value in
distinguishing between products sold to customers
(accounted for in category 11) and products leased to
customers (accounted for in category 13). Companies
may account for products leased to customers the
same way the company accounts for products sold to
customers (i.e., by accounting for the total expected
lifetime emissions from all relevant products leased
to other entities in the reporting year). In this case,
companies should report emissions from leased
products in category 11 (Use of sold products), rather
than category 13 (Downstream leased assets) and avoid
double counting between categories.
A reporting company’s scope 3 emissions from
downstream leased assets include the scope 1 and
scope 2 emissions of lessees (depending on the lessee’s
consolidation approach).
IKEA, an international
home furnishings
retailer, estimated
its scope 3 emissions
from all sold products
that consume energy
during the use-phase.
The products included
all types of appliances
(e.g., refrigerators,
freezers, stoves, and ovens) and lighting (e.g.,
incandescent light bulbs, compact fluorescent bulbs,
and halogen lights) sold in approximately 25 countries.
IKEA calculated GHG emissions by first grouping
hundreds of products into 15 distinct product groups,
then determining the average power demand (in watts),
average annual use time, and average product lifetimes
for each product group. IKEA obtained information on
product-use profiles and lifetimes from IKEA’s suppliers
and other experts. IKEA calculated the products’
expected lifetime energy use and applied an average
electricity emission factor to calculate the expected
lifetime GHG emissions.
The results showed that the use of sold products
accounted for 20 percent of IKEA’s combined scope
1, scope 2, and scope 3 emissions, or approximately 6
million metric tons of GHG emissions. With the help of
the scope 3 inventory, IKEA realized that small changes in
the efficiency of its sold products would have significant
effects on IKEA’s total GHG emissions. As a result, IKEA
has adopted a target that, by 2015, all products sold
will be 50 percent more efficient on average than the
products on the market in 2008. IKEA expects this
strategy to achieve annual GHG reductions of several
million metric tons, significantly more than the company’s
total scope 1 and scope 2 emissions, which in 2010 was
approximately 800,000 metric tons of CO2e.
IKEA: Scope 3 emissions from the use of sold products
IKEA has adopted a target that, by 2015, all products sold will be 50 percent more efficient on average than the products on the market in 2008.

CHAPTER 05 Identifying Scope 3 Emissions
Category 14: Franchises This category includes emissions from the operation of
franchises not included in scope 1 or scope 2. A franchise
is a business operating under a license to sell or distribute
another company’s goods or services within a certain
location. This category is applicable to franchisors (i.e.,
companies that grant licenses to other entities to sell or
distribute its goods or services in return for payments,
such as royalties for the use of trademarks and other
services). Franchisors should account for emissions that
occur from the operation of franchises (i.e., the scope 1
and 2 emissions of franchisees) in this category.
Franchisees (i.e., companies that operate franchises and
pay fees to a franchisor) should include emissions from
operations under their control in this category if they
have not included those emissions in scope 1 and scope 2
due to their choice of consolidation approach. Franchisees
may optionally report upstream scope 3 emissions
associated with the franchisor’s operations (i.e., the scope
1 and scope 2 emissions of the franchisor) in category 1
(Purchased goods and services).
Category 15: Investments This category includes scope 3 emissions associated with
the reporting company’s investments in the reporting
year, not already included in scope 1 or scope 2. This
category is applicable to investors (i.e., companies that
make an investment with the objective of making a
profit) and companies that provide financial services.
Investments are categorized as a downstream scope 3
category because the provision of capital or financing is
a service provided by the reporting company.8
Category 15 is designed primarily for private financial
institutions (e.g., commercial banks), but is also relevant
to public financial institutions (e.g., multilateral
development banks, export credit agencies, etc.) and
other entities with investments not included in scope 1
and scope 2.
Investments may be included in a company’s scope 1
or scope 2 inventory depending on how the company
defines its organizational boundaries. For example,
companies that use the equity share approach include
emissions from equity investments in scope 1 and scope
2. Companies that use a control approach account
only for those equity investments that are under the
company’s control in scope 1 and scope 2. Investments
not included in the company’s scope 1 or scope 2
emissions are included in scope 3, in this category. A
reporting company’s scope 3 emissions from investments
are the scope 1 and scope 2 emissions of investees.
For purposes of GHG accounting, this standard divides
financial investments into four types:
• Equity investments
• Debt investments
• Project finance
• Managed investments and client services
Table 5.9 and table 5.10 provide GHG accounting
guidance for each type of financial investment. Table
5.9 provides the types of investments included in the
minimum boundary of this category. Table 5.10 identifies
types of investments that companies may optionally
report, in addition to those provided in table 5.9.
Emissions from investments should be allocated to the
reporting company based on the reporting company’s
proportional share of investment in the investee.
Because investment portfolios are dynamic and can
change frequently throughout the reporting year,
companies should identify investments by choosing
a fixed point in time, such as December 31 of the
reporting year, or using a representative average over
the course of the reporting year.
Song
qua
n D
eng
/ Shu
tter
stoc
k.co
m
[51]

[52] Corporate Value Chain (Scope 3) Accounting and Reporting Standard
Table [5.9] Accounting for emissions from investments (required) (Additional guidance on italicized terms is provided on the next page)
Financial investment/ service
Description GHG accounting approach (Required)
Equity investments
Equity investments made by the reporting company using the company’s own capital and balance sheet, including:• Equity investments in subsidiaries (or
group companies), where the reporting company has financial control (typically more than 50 percent ownership)
• Equity investments in associate companies (or affiliated companies), where the reporting company has significant influence but not financial control (typically 20-50 percent ownership)
• Equity investments in joint ventures (Non-incorporated joint ventures/partnerships/ operations), where partners have joint financial control
In general, companies in the financial services sector should account for emissions from equity investments in scope 1 and scope 2 by using the equity share consolidation approach to obtain representative scope 1 and scope 2 inventories.
If emissions from equity investments are not included in scope 1 or scope 2 (because the reporting company uses either the operational control or financial control consolidation approach and does not have control over the investee), account for proportional scope 1 and scope 2 emissions of equity investments that occur in the reporting year in scope 3, category 15 (Investments).
• Equity investments made by the reporting company using the company’s own capital and balance sheet, where the reporting company has neither financial control nor significant influence over the emitting entity (and typically has less than 20 percent ownership)
If not included in the reporting company’s scope 1 and scope 2 inventories: Account for proportional scope 1 and scope 2 emissions of equity investments that occur in the reporting year in scope 3, category 15 (Investments). Companies may establish a threshold (e.g., equity share of 1 percent) below which the company excludes equity investments from the inventory, if disclosed and justified.
Debt investments (with known use of proceeds)
Corporate debt holdings held in the reporting company’s portfolio, including corporate debt instruments (such as bonds or convertible bonds prior to conversion) or commercial loans, with known use of proceeds (i.e., where the use of proceeds is identified as going to a particular project, such as to build a specific power plant)
For each year during the term of the investment, companies should account for proportional scope 1 and scope 2 emissions of relevant projects that occur in the reporting year in scope 3, category 15 (Investments). In addition, if the reporting company is an initial sponsor or lender of a project: Also account for the total projected lifetime scope 1 and scope 2 emissions of relevant projects financed during the reporting year and report those emissions separately from scope 3.
Project finance Long-term financing of projects (e.g., infrastructure and industrial projects) by the reporting company as either an equity investor (sponsor) or debt investor (financier)

[53]
CHAPTER 05 Identifying Scope 3 Emissions
Additional guidance on key concepts italicized in table 5.9
is provided below.
• Proportional emissions from equity investments
should be allocated to the investor based on the
investor’s proportional share of equity in the investee.
Proportional emissions from project finance and
debt investments with known use of proceeds should
be allocated to the investor based on the investor’s
proportional share of total project costs (total
equity plus debt). Companies may separately report
additional metrics, such as total emissions of the
investee, the investor’s proportional share of capital
investment in the investee, etc.
• Scope 1 and scope 2 emissions include the direct
(scope 1) emissions of the investee or project, as
well as the indirect scope 2 emissions from the
generation of electricity consumed by the investee
or project. Where relevant, companies should also
account for the scope 3 emissions of the investee
or project. For example, if a financial institution
provides equity or debt financing to a light bulb
manufacturer, the financial institution is required to
account for the scope 1 and scope 2 emissions of the
light bulb manufacturer (i.e., direct emissions during
manufacturing and indirect emissions from electricity
consumed during manufacturing). The financial
institution should account for the scope 3 emissions of
the light bulb producer (e.g., scope 3 emissions from
consumer use of light bulbs sold by the manufacturer)
when scope 3 emissions are significant compared to
other source of emissions or otherwise relevant.
• Relevant projects include those in GHG-intensive
sectors (e.g., power generation), projects exceeding
a specified emissions threshold (developed by the
company or industry sector), or projects that meet
other criteria developed by the company or industry
sector. Companies should account for emissions from
the GHG-emitting project financed by the reporting
company, regardless of any financial intermediaries
involved in the transaction.
• Total projected lifetime emissions are reported in the
initial year the project is financed, not in subsequent
years. Where there is uncertainty around a project’s
anticipated lifetime, companies may report a range
of likely values (e.g., for a coal-fired power plant, a
company may report a range over a 30- to 60-year time
period). Companies should report the assumptions
used to estimate total anticipated lifetime emissions.
If project financing occurs only once every few
years, emissions from project finance may fluctuate
significantly from year to year. Companies should
provide appropriate context in the public report (e.g.,
by highlighting exceptional or non-recurring project
financing). See section 5.4 for more information on the
time boundary of scope 3 categories.
Citi, a global financial services company, annually reports
GHG emissions from power plants it finances through its
project finance business worldwide. Citi reports these
emissions to provide transparency in GHG emissions from
its project finance portfolio. Citi’s reporting includes
emissions from closed (i.e., completed) project financings
of new capacity only, including expansions of existing
plants, but not re-financings of existing plants. Emissions
data are derived from the power plant’s capacity and
heat rate, the carbon content of the fuel, and projected
capacity utilization. Citi accounts for the total estimated
lifetime emissions of projects financed in the reporting
year, and calculates project-specific emissions for both a
30- and 60-year assumed plant lifetime. To allocate power
plant emissions to Citi, total emissions are multiplied by
the ratio of Citi’s project finance loan to total project
costs (total debt plus equity).
In 2009, Citi financed one thermal power project via
project finance with an estimated lifetime emissions of
8.7 to 17.4 million metric tons of CO2e. (The lower end of
the range represents a 30-year plant life and the higher
number represents a 60-year plant life.) In 2008, Citi
reported zero emissions from power plants, since Citi did
not finance any fossil-fuel fired power plants in 2008.
Citi: Scope 3 emissions from project finance

[54] Corporate Value Chain (Scope 3) Accounting and Reporting Standard
Table [5.10] Accounting for emissions from investments (optional)
Financial investment/ service
Description GHG accounting approach (Optional)
Debt investments(without known use of proceeds)
General corporate purposes debt holdings (such as bonds or loans) held in the reporting company’s portfolio where the use of proceeds is not specified
Companies may account for scope 1 and scope 2 emissions of the investee that occur in the reporting year in scope 3, category 15 (Investments)
Managed investments and client services
Investments managed by the reporting company on behalf of clients (using clients’ capital) or services provided by the reporting company to clients, including:• Investment and asset management
(equity or fixed income funds managed on behalf of clients, using clients’ capital)
• Corporate underwriting and issuance for clients seeking equity or debt capital
• Financial advisory services for clients seeking assistance with mergers and acquisitions or requesting other advisory services
Companies may account for emissions from managed investments and client services in scope 3, category 15 (Investments)
Other investments or financial services
Other investments, financial contracts, or financial services not included above (e.g., pension funds, retirement accounts, securitized products, insurance contracts, credit guarantees, financial guarantees, export credit insurance, credit default swaps, etc.)
Companies may account for emissions from other investments in scope 3, category 15 (Investments)

[55]
CHAPTER 05 Identifying Scope 3 Emissions
5.6 Applicability of downstream scope 3 categories to final and intermediate products
Upstream emissions are applicable for all types of
purchased products. The applicability of downstream
scope 3 categories depends on whether products sold by
the reporting company are final products or intermediate
products. (See box 5.3 for descriptions of final and
intermediate products.) If a company produces an
intermediate product (e.g., a motor), which becomes part
of a final product (e.g., an automobile), the company
accounts for downstream emissions associated with the
intermediate product (the motor), not the final product
(the automobile). Table 5.11 explains the applicability of
downstream scope 3 categories to final and intermediate
products sold by the reporting company. See section 6.4
for guidance on disclosing and justifying exclusions of
downstream emissions from sold intermediate goods
when their eventual end use is unknown.

[56] Corporate Value Chain (Scope 3) Accounting and Reporting Standard
Table [5.11] Applicability of downstream scope 3 categories to final and intermediate products sold by the reporting company
Scope 3 category
Applicability to final products
Applicability to intermediate products
9. Downstream transportation and distribution
Transportation and distribution of final products, between the point of sale by the reporting company to the end consumer, including retail and storage
Transportation and distribution of intermediate products between the point of sale by the reporting company and either 1) the end consumer (if the eventual end use of the intermediate product is known) or 2) business customers (if the eventual end use of the intermediate product is unknown)
10. Processing of sold products
Not applicable to final products Processing of sold intermediate products by customers (e.g., manufacturers)
11. Use of sold products
The direct use-phase emissions of sold final products by the end user (i.e., emissions resulting from the use of sold final products that directly consume fuel or electricity during use, fuels and feedstocks, and GHGs or products that contain GHGs that are released during use). Companies may optionally include the indirect use-phase emissions of sold final products (see table 5.8)
The direct use-phase emissions of sold intermediate products9 by the end user (i.e., emissions resulting from the use of sold intermediate products that directly consume fuel or electricity during use, fuels and feedstocks, and GHGs or products that contain GHGs that are released during use). Companies may optionally include the indirect use-phase emissions of sold intermediate products (see table 5.8)
12. End-of-life treatment of sold products
Emissions from disposing of sold final products at the end of their life
Emissions from disposing of sold intermediate products at the end of their life
13. Downstream leased assets
Unrelated to product type: Applicable to all companies with downstream leased assets
14. Franchises Unrelated to product type: Applicable to all companies with franchises
15. Investments Unrelated to product type: Applicable to all companies with investments

[57]
CHAPTER 05 Identifying Scope 3 Emissions
Endnotes1 In certain cases, assets controlled by the reporting company
that are excluded from its organizational boundary may not
be captured by the list of scope 3 categories. In such a case,
emissions from these assets should be reported separately as an
“other” scope 3 activity.
2 Downstream emissions also include emissions from products that
are distributed but not sold (i.e., without receiving payment).
3 If a company identifies any potential double counting of
emissions between scope 3 categories or within a scope 3
category, the company should avoid double counting by only
reporting scope 3 emissions from the activity once, clearly
explaining where the emissions are reported, and providing cross-
references, if needed.
4 Cradle-to-gate emissions include all emissions that occur in the
life cycle of purchased products, up to the point of receipt by the
reporting company (excluding emissions from sources that are
owned or controlled by the reporting company).
5 For more information on land use and land-use change, refer to
Appendix B of the GHG Protocol Product Standard.
6 Tier 1 suppliers are companies with which the reporting company
has a purchase order for goods or services (e.g., materials, parts,
components, etc.). Tier 2 suppliers are companies with which Tier
1 suppliers have a purchase order for goods and services (see
figure 7.3).
7 “Employees” refers to employees of entities and facilities owned,
operated, or leased by the reporting company. Companies may
include employees of other relevant entities (e.g., franchises or
outsourced operations) in this category, as well as consultants,
contractors, and other individuals who are not employees of the
company, but commute to facilities owned and operated by the
company.
8 Equity investments do not easily fit into the upstream and
downstream definitions, but are included along with other
types of investments in Category 15 so that all investments are
included in a single category.
9 In the case of a motor (an intermediate product) that becomes
part of an automobile (a final product), the direct use phase
emissions of the intermediate product by the end consumer are
the emissions resulting from use of the motor, not the emissions
resulting from use of the automobile. This estimation involves
allocating emissions (see chapter 8).

Setting the Scope 3 Boundary06

[59]
Setting the Scope 3 Boundary
D etermining which scope 3 emissions to include in the inventory (i.e., setting the
boundary) is a critical decision in the inventory process. The GHG Protocol Corporate
Standard allows companies flexibility in choosing which, if any, scope 3 activities to
include in the GHG inventory when the company defines its operational boundaries. The GHG
Protocol Scope 3 Standard is designed to create additional completeness and consistency in
scope 3 accounting and reporting by defining scope 3 boundary requirements.
Requirements in this chapter
• Companies shall account for all scope 3 emissions and disclose and justify any exclusions.
• Companies shall account for emissions from each scope 3 category according to the minimum boundaries provided in table 5.4.
• Companies shall account for scope 3 emissions of CO2 , CH4 , N2O, HFCs, PFCs, and SF6 , if they are emitted in the value chain.
• Biogenic CO2 emissions that occur in the reporting company’s value chain shall not be included in the scopes, but shall be included and separately reported in the public report.
6.1 Mapping the value chainCompanies should map the value chain as a first step
toward identifying the scope 3 activities that are included
in the inventory. This step is a useful internal exercise to
help companies identify scope 3 activities. To the extent
possible, companies should create a complete value chain
map and/or a complete list of activities in the company’s
value chain that includes:
• Each of the scope 3 categories and activities included
in table 5.4
• A list of purchased goods and services and a list of sold
goods and services
• A list of suppliers and other relevant value chain
partners (either by name, type, or spend category)
Because supply chains are dynamic and a company’s supply
chain partners can change frequently throughout the
reporting year, companies may find it useful to choose a
fixed point in time (such as December 31 of the reporting
year) or use a representative average of products and
suppliers over the course of the reporting year.
gu
id
an
ce
re
qu
ir
em
en
ts

[60] Corporate Value Chain (Scope 3) Accounting and Reporting Standard
Companies should strive for completeness in mapping
the value chain, but it is acknowledged that achieving
100 percent completeness may not be feasible.
Companies may establish their own policy for mapping the
value chain, which may include creating representative,
rather than exhaustive, lists of purchased products, sold
products, suppliers, and other value chain partners.
6.2 Boundary requirementsCompanies shall account for all scope 3 emissions as
defined in this standard and disclose and justify any
exclusions. Companies shall account for emissions
from each scope 3 category according to the minimum
boundaries provided in table 5.4. Companies may
include emissions from optional activities within
each category. Companies shall account for scope
3 emissions of carbon dioxide (CO2), methane (CH4),
nitrous oxide (N2O), hydrofluorocarbons (HFCs),
perfluorocarbons (PFCs), and sulphur hexafluoride (SF6),
if they are emitted in the value chain. Companies may
exclude scope 3 activities from the inventory, provided
that any exclusion is disclosed and justified.
Biogenic CO2 emissions (e.g., CO2 from the combustion
of biomass) that occur in the reporting company’s value
chain shall not be included in the scopes, but shall be
included and separately reported in the public report.
Any GHG removals (e.g., biological GHG sequestration)
shall not be included in scope 3, but may be reported
separately. (For more information, see section 6.5
and chapter 11.)
6.3 Disclosing and justifying exclusionsCompanies should strive for completeness, but it
is acknowledged that accounting for all scope 3
emissions may not be feasible. Some categories may
not be applicable to all companies. For example, some
companies may not have leased assets or franchises. In
such cases, companies should report zero emissions or
“not applicable” for any categories that are not applicable.
In some situations, companies may have scope 3
activities, but be unable to estimate emissions due to
a lack of data or other limiting factors. For example,
companies may find that based on initial estimates,
some scope 3 activities are expected to be insignificant
in size (compared to the company’s other sources of
emissions) and that for these activities, the ability to
collect data and influence GHG reductions is limited. In
such cases, companies may exclude scope 3 activities
from the report, provided that any exclusion is disclosed
and justified.
Companies should follow the principles of relevance,
completeness, accuracy, consistency, and transparency
when deciding whether to exclude any activities from
the scope 3 inventory. Companies should not exclude
any activity that would compromise the relevance of the
reported inventory. (See table 6.1 for a list of criteria for
determining relevance.) Companies should ensure that
the scope 3 inventory appropriately reflects the GHG
emissions of the company, and serves the decision-making
needs of users, both internal and external to the company.
In particular, companies should not exclude any activity
that is expected to contribute significantly to the
company’s total scope 3 emissions. (See section 7.1 for
guidance on prioritizing emissions.)
Companies are required to disclose and justify any
exclusions in the public report (see chapter 11).
See box 6.1 for an example of disclosing and
justifying exclusions.
6.4 Accounting for downstream emissionsThe applicability of downstream scope 3 categories
depends on whether products sold by the reporting
company are final products or intermediate products (see
section 5.6). In certain cases, the eventual end use of sold
intermediate products may be unknown. For example,
a company may produce an intermediate product with
many potential downstream applications, each of which
has a different GHG emissions profile, and be unable
to reasonably estimate the downstream emissions
associated with the various end uses of the intermediate
product. In such a case, companies may disclose and
justify the exclusion of downstream emissions from
categories 9, 10, 11, and 12 in the report (but should not
selectively exclude a subset of those categories).

[61]
CHAPTER 06 Setting the Scope 3 Boundary
By definition, scope 3 emissions occur from sources
that are not owned or controlled by the reporting
company, but occur from sources owned and
controlled by other entities in the value chain (e.g.,
contract manufacturers, materials suppliers, third-
party logistics providers, waste management suppliers,
travel suppliers, lessees and lessors, franchisees,
retailers, employees, and customers). Nevertheless,
scope 3 emissions can be influenced by the activities
of the reporting company, such that companies often
have the ability to influence GHG reductions upstream
and downstream of their operations. Companies
should prioritize activities in the value chain where the
reporting company has the potential to influence GHG
reductions. See table 9.7 for illustrative examples of
actions to influence scope 3 reductions.
Box [6.2] Influence
After mapping its value chain, a company uses initial
GHG estimation methods to estimate the emissions
from the various spend categories within category 1
(Purchased goods and services). The company finds
that emissions from production-related procurement
are significant compared to its other sources of scope
3 emissions. The company determines that emissions
from non-production-related procurement are difficult
to calculate and are not expected to contribute
significantly to total scope 3 emissions. The company
uses more accurate methods to calculate emissions
from production-related procurement, but decides
to exclude emissions from non-production-related
procurement. The company discloses and justifies the
exclusion of non-production-related procurement
based on limited data availability and its expected
insignificant contribution to total scope 3 emissions.
Box [6.1] Example of disclosing & justifying exclusions
Table [6.1] Criteria for identifying relevant scope 3 activities
Criteria Description
Size They contribute significantly to the company’s total anticipated scope 3 emissions (see section 7.1 for guidance on using initial estimation methods)
Influence There are potential emissions reductions that could be undertaken or influenced by the company (see box 6.2)
Risk They contribute to the company’s risk exposure (e.g., climate change related risks such as financial, regulatory, supply chain, product and customer, litigation, and reputational risks) (see table 2.2)
Stakeholders They are deemed critical by key stakeholders (e.g., customers, suppliers, investors, or civil society)
Outsourcing They are outsourced activities previously performed in-house or activities outsourced by the reporting company that are typically performed in-house by other companies in the reporting company’s sector
Sector guidance They have been identified as significant by sector-specific guidance
Other They meet any additional criteria for determining relevance developed by the company or industry sector

[62] Corporate Value Chain (Scope 3) Accounting and Reporting Standard
Public Service Enterprise Group (PSEG), a diversified
energy company and one of the ten largest electric
companies in the U.S., developed a scope 3 inventory to
understand its climate-related risks and opportunities
along the value chain and to communicate this
information transparently to stakeholders.
To set the inventory boundary, PSEG first identified all
company assets and operations and developed detailed
process maps to define all upstream and downstream
activities that could emit GHGs. PSEG included all activities
in each of the fifteen scope 3 categories, with the exception
of certain types of financial investments and health-care
expenses, which were determined to be immaterial. PSEG
disclosed and justified exclusions consistent with the
completeness and transparency principles.
To develop the inventory, PSEG used higher quality
primary data for all activities that were significant in
size, where data could easily be attained, or where
having higher quality data was otherwise important. For
activities that were small or immaterial, or where data
was hard to obtain, PSEG relied upon secondary or proxy
data to estimate scope 3 emissions.
The scope 3 inventory gave PSEG greater clarity on its
emissions risks and opportunities throughout the entire
value chain. PSEG found significant downstream scope
3 emissions from category 11 (Use of sold products),
which helped PSEG better understand the GHG emissions
embedded in the electricity and natural gas that it delivers
to its customers and the need to help customers reduce
these emissions by investing in renewable energy and
energy-efficiency programs. PSEG also found significant
upstream scope 3 emissions in its fossil fuel supply
chain. These insights
provide business
value by informing
PSEG’s strategy to
provide safe, reliable,
economic, and green
energy well into the
21st century.
PSEG: Setting the scope 3 boundary
The scope 3 inventory gave PSEG greater clarity on its emissions risks and opportunities throughout the entire value chain.
6.5 Accounting for emissions and removals from biogenic sources
The GHG Protocol Corporate Standard requires that direct
CO2 emissions from the combustion of biomass be
included in the public report, but reported separately
from the scopes, rather than included in scope 1. The
separate reporting requirement also applies to scope 3.
Biogenic CO2 emissions (e.g., CO2 from the combustion
of biomass) that occur in the reporting company’s value
chain are required to be included in the public report, but
reported separately from scope 3 (see chapter 11).
The requirement to report biogenic CO2 emissions
separately refers to CO2 emissions from combustion or
biodegradation of biomass only, not to emissions of any
other GHGs (e.g., CH4 and N2O), or to any GHG emissions
that occur in the life cycle of biomass other than from
combustion or biodegradation (e.g., GHG emissions from
processing or transporting biomass).
Scope 1, scope 2, and scope 3 inventories include only
emissions, not removals. Any removals (e.g., biological GHG
sequestration) may be reported separately from the scopes.
See examples 6.1 and 6.2.
A manufacturing company contracts with a third-
party transportation provider that uses both diesel
and biodiesel in its vehicle fleet. The manufacturer
accounts for upstream GHG emissions from the
combustion of diesel fuel in scope 3, category 4
(Upstream transportation and distribution), since
emissions from diesel fuel are of fossil origin. The
manufacturer reports biogenic CO2 emissions
from the combustion of biodiesel separately. The
manufacturer does not report any removals associated
with the production of biodiesel in scope 3.
Example [6.1] Accounting for biogenic emissions

[63]
CHAPTER 06 Setting the Scope 3 Boundary
Ocean Spray, a leading producer of bottled juice drinks and
dried fruit in North America, developed its first scope 3
inventory with the goal of informing an effective GHG-
reduction strategy. At the outset, Ocean Spray identified
a tension between the completeness of the inventory
and the specificity of data used to calculate emissions.
Ocean Spray decided that to best inform the company’s
GHG-reduction strategy, it should develop a scope 3
inventory by focusing on completeness over precision,
and to disclose the sources and uncertainty of data used.
A complete inventory
showed Ocean Spray
the full picture of
its value chain GHG
emissions, revealed
the greatest reduction
opportunities, and
enabled effective
decision making, which
would have been
hindered by excluding
scope 3 activities from
the inventory.
To develop a complete inventory, Ocean Spray first
identified all scope 3 activities, such as growing and
processing fruit, transforming fruit into food and
beverage products, distributing products to customers,
and use and disposal by consumers. Ocean Spray
then collected primary data for activities such as the
economic value of upstream ingredients, materials, and
services. The company used economic input-output
assessment to calculate emissions using the cost data
on upstream suppliers. Where primary data was not
available, the company calculated estimates based on
assumptions, especially for downstream activities such
as consumer disposal.
Through the scope 3 inventory process, Ocean Spray
learned that scope 3 emissions account for most of
its total scope 1, scope 2, and scope 3 emissions. The
company’s largest source of GHG emissions came
from category 1 (Purchased goods and services) which
accounted for more than half of combined scope 1,
scope 2, and scope 3 emissions, driven primarily by raw
material inputs.
Ocean Spray: Setting the scope 3 boundary
A complete inventory showed Ocean Spray the full picture of its value chain GHG emissions, revealed the greatest reduction opportunities, and enabled effective decision making
A paper manufacturer purchases wood pulp
from suppliers and sells finished paper products
to consumers. The company accounts for GHG
emissions from the production of wood pulp in
scope 3, category 1 (Purchased goods and services).
The company does not account for upstream CO2
removals from biological carbon sequestration that
occurs in trees in scope 3, but instead may report
CO2 removals separately. The company also does
not account for downstream biogenic CO2 emissions
from the incineration of sold paper products at the
end of their life in scope 3, but instead reports those
emissions separately.
Example [6.2] Accounting for biogenic emissions and removals

07 Collecting Data

[65]
A fter a company has identified the activities to include in its scope 3 boundary,
the next step is to collect the necessary data to calculate the company’s
scope 3 emissions.
Collecting scope 3 emissions data is likely to require
wider engagement within the reporting company,
as well as with suppliers and partners outside of the
company, than is needed to collect scope 1 and scope 2
emissions data. Companies may need to engage several
internal departments, such as procurement, energy,
manufacturing, marketing, research and development,
product design, logistics, and accounting.
This chapter provides a four-step approach to collecting
and evaluating data (see figure 7.1).
Guidance for calculating scope 3 emissions from each
scope 3 category is provided in a separate document,
Guidance for Calculating Scope 3 Emissions, which is
available at www.ghgprotocol.org.
7.1 Guidance for prioritizing data collection efforts
Companies should prioritize data collection efforts on
the scope 3 activities that are expected to have the most
significant GHG emissions, offer the most significant GHG
reduction opportunities, and are most relevant to the
company’s business goals. Collecting higher quality data
for priority activities allows companies to focus resources
on the most significant GHG emissions in the value chain,
more effectively set reduction targets, and track and
demonstrate GHG reductions over time (see chapter 9).
Companies may use a combination of approaches
and criteria to identify priority activities. For example,
companies may seek higher quality data for all activities
Figure [7.1] Iterative process for collecting and evaluating data
prioritize data collection efforts (section 7.1)
select data(section 7.3)
collect data and fill data gaps (section 7.4 & 7.5)
improve data quality over time
(section 7.6)
1 2 3 4
gu
id
an
ce

[66] Corporate Value Chain (Scope 3) Accounting and Reporting Standard[66] Corporate Value Chain (Scope 3) Accounting and Reporting Standard
that are significant in size, activities that present the most
significant risks and opportunities in the value chain,
and activities where more accurate data can be easily
obtained. Companies may choose to rely on relatively
less accurate data for activities that are expected to have
insignificant emissions or where accurate data is difficult
to obtain. (See Appendix C for guidance on developing a
data management plan, including strategies for obtaining
more accurate data over time).
Prioritizing activities based on the magnitude of GHG emissionsThe most rigorous approach to identifying priority
activities is to use initial GHG estimation (or screening)
methods to determine which scope 3 activities are
expected to be most significant in size. A quantitative
approach gives the most accurate understanding of
the relative magnitudes of various scope 3 activities.
To prioritize activities based on their expected GHG
emissions, companies should:
• use initial GHG estimation (or screening) methods to
estimate the emissions from each scope 3 activity
(e.g., by using industry-average data, environmentally-
extended input output data (see box 7.1), proxy data,
or rough estimates); and
• rank all scope 3 activities from largest to smallest
according to their estimated GHG emissions to
determine which scope 3 activities have the most
significant impact.
Calculation methods for each scope 3 category that
can be used for screening are provided in a separate
document, Guidance for Calculating Scope 3 Emissions,
which is available at www.ghgprotocol.org.
Prioritizing activities based on financial spend or revenueAs an alternative to ranking scope 3 activities based on
their estimated GHG emissions, companies may choose
to prioritize scope 3 activities based on their relative
financial significance. Companies may use a financial
spend analysis to rank upstream types of purchased
products by their contribution to the company’s total
spend or expenditure (for an example, see the AkzoNobel
case study). For downstream emissions, companies may
likewise rank types of sold products by their contribution
to the company’s total revenue.
Companies should use caution in prioritizing activities based
on financial contribution, because spend and revenue
may not correlate well with emissions. For example, some
activities have a high market value, but have relatively low
emissions. Conversely, some activities have a low market
value, but have relatively high emissions. As a result,
companies should also prioritize activities that do not
contribute significantly to financial spend or revenue, but
are expected to have a significant GHG impact.
Prioritizing activities based on other criteriaIn addition to prioritizing data collection efforts on
activities expected to contribute significantly to total
scope 3 emissions or to spend, companies may prioritize
any other activities expected to be most relevant for the
company or its stakeholders, including activities that:
• the company has influence over;
• contribute to the company’s risk exposure;
• stakeholders deem critical;
• have been identified as significant by sector-specific
guidance; or
• meet any additional criteria developed by the company
or industry sector (see table 6.1 for more information).
Environmentally-extended input output (EEIO) models
estimate energy use and/or GHG emissions resulting
from the production and upstream supply chain
activities of different sectors and products within an
economy. The resulting EEIO emissions factors can be
used to estimate GHG emissions for a given industry
or product category. EEIO data are particularly useful
in screening emission sources when prioritizing data
collection efforts.
EEIO models are derived by allocating national GHG
emissions to groups of finished products based on
economic flows between industry sectors. EEIO
models vary in the number of sectors and products
included and how often they are updated. EEIO data
are often comprehensive, but the level of granularity
is relatively low compared to other sources of data.
Box [7.1] Environmentally-extended input output (EEIO) models

[67]
CHAPTER 07 Collecting Data
AkzoNobel, the largest global paints and coatings
company and a major producer of specialty chemicals,
applied a financial spend analysis to prioritize its
purchased goods and services before collecting data
for category 1. In three representative businesses used,
AkzoNobel set out to identify the purchased goods and
services that collectively accounted for at least 80% of
the total spend, as well as any category in the remaining
20% that was individually more than 1% of total spend.
The graph below illustrates the results of a financial
spend analysis for
one of AkzoNobel’s
businesses. Based on
the analysis, AkzoNobel
focused data collection
efforts on the raw
materials that
represented over 95%
of total spend, marked
in the graph.
AkzoNobel: Prioritizing scope 3 emissions from purchased goods and services
AkzoNobel focused data collection efforts on the raw materials that represented over 95 percent of total spend.
35%12%
11%11%
9%6%
5%4%4%2%
1%0.6%
0.5%0.4%0.1%0.1%0.1%0.0%
0.0%0.0% 0.0%0.0%0.0%
category 1: purchased goods & services
% of spend
raw material 1raw material 2
machining & processing servicesraw material 3
other raw materialsraw material 4raw material 5raw material 6
packagingraw material 7raw material 8raw material 9
raw material 10production equipment
ICTelectrical & instrumentation
industrial cleaningpersonnel related
office suppliessafety, health/PPE
laboratory goods professional services
energy & utilities
0% 10% 20% 30% 40%
selected activities
raw
mat
eria
ls /
ser
vice
s

[68] Corporate Value Chain (Scope 3) Accounting and Reporting Standard[68] Corporate Value Chain (Scope 3) Accounting and Reporting Standard
To prioritize scope 3 activities, companies may also
assess whether any GHG- or energy-intensive materials
or activities appear in the value chain of purchased and
sold products.
7.2 Overview of quantification methods and data types
There are two main methods to quantify emissions:
direct measurement and calculation (see table 7.1). Each
requires different types of data.
In practice, calculation will be used most often to quantify
scope 3 emissions, which requires the use of two types of
data: activity data and emission factors.
Activity dataActivity data is a quantitative measure of a level
of activity that results in GHG emissions. Examples
of activity data are provided in table 7.2.
Emission factorsAn emission factor is a factor that converts activity data
into GHG emissions data. Examples of emission factors
are provided in table 7.2.
Companies are required to report a description of the
types and sources of activity data and emission factors
used to calculate the inventory (see chapter 11).
Table [7.2] Examples of activity data and emission factors
Examples of activity data Examples of emission factors
• Liters of fuel consumed• Kilowatt-hours of electricity consumed • Kilograms of material consumed• Kilometers of distance traveled • Hours of time operated• Square meters of area occupied• Kilograms of waste generated• Kilograms of product sold • Quantity of money spent
• kg CO2 emitted per liter of fuel consumed • kg CO2 emitted per kWh of electricity consumed • kg PFC emitted per kg of material consumed • t CO2 emitted per kilometer traveled • kg SF6 emitted per hour of time operated • g N2O emitted per square meter of area • g CH4 emitted per kg of waste generated • kg HFC emitted per kg of product sold • kg CO2 emitted per unit of currency spent
Quantification method
Description Relevant data types
Direct measurement Quantification of GHG emissions using direct monitoring, mass balance or stoichiometry
GHG = Emissions Data x GWP
Direct emissions data
Calculation Quantification of GHG emissions by multiplying activity data by an emission factor
GHG = Activity Data x Emission Factor x GWP
Activity data
Emission factors
Table [7.1] Quantification methods

[69]
CHAPTER 07 Collecting Data
Energy emission factors Two types of emission factors are used to convert energy
activity data into emissions data:
• Combustion emission factors, which include only the
emissions that occur from combusting the fuel
• Life cycle emission factors, which include not only the
emissions that occur from combusting the fuel, but all
other emissions that occur in the life cycle of the fuel
such as emissions from extraction, processing, and
transportation of fuels
Combustion emission factors are used in the GHG Protocol
Corporate Standard to calculate scope 1 emissions (in
the case of fuels) and scope 2 emissions (in the case of
electricity). Life cycle emission factors are used in the GHG
Protocol Product Standard to calculate emissions from
fuels and electricity. These two types of emission factors
and their use are described in more detail below.
Energy emission factors in scope 1 and scope 2 accountingScope 1 and scope 2 emissions are calculated using
combustion emission factors following the GHG Protocol
Corporate Standard. Scope 1 and scope 2 are defined to
avoid double counting by two or more companies of the
same emission within the same scope (see table 5.1).
Scope 2 includes emissions from the generation of purchased
electricity, steam, heating, and cooling that is consumed
by the reporting company. In some regions, electricity
emission factors may include life cycle activities related to
electricity, such as transmission and distribution of electricity,
or extraction, processing and transportation of fuels used
to generate electricity. Non-generation activities related to
electricity are accounted for in scope 3, category 3 (Fuel- and
energy-related activities not included in scope 1 or scope
2), rather than scope 2. As a result, companies should seek
(and emission factor developers should provide) transparent,
disaggregated electricity emission factors that allow separate
accounting of emissions from electricity generation in
scope 2 and non-generation activities related to electricity
in scope 3. Proper accounting creates consistency in scope
2 accounting and reporting between companies and avoids
double counting of the same emission within scope 2 by
more than one company. See figure 7.2 for more information
on different types of electricity emission factors.
Figure [7.2] Activities included in each type of electricity emission factor
EF = emission factor
combustion EF(for scope 1 and 2)
life cycle EF(for scope 3, except
category 3)
activity included in...
fuel extraction, production & transport
t&d losses
power generation
1 2 3
4 5 6
7 8 9
10 11 12
13 14 15
16 17
1. wheat2. tree3. mountains4. glass bottle5. plastic bottle6. aluminium can7. factory8. lorry9. cloud10. recycling bin11. recycling bin (colours reversed)12. wind turbines13. chicken14. cow 115. cow 216. shop17. factory showing carbon emissions (carbon emissions are shown in orange)

[70] Corporate Value Chain (Scope 3) Accounting and Reporting Standard[70] Corporate Value Chain (Scope 3) Accounting and Reporting Standard
Table [7.3] Types of data
Data type Description
Primary Data Data from specific activities within a company’s value chain
Secondary Data Data that is not from specific activities within a company’s value chain
Energy emission factors in scope 3 accountingCompanies should use life cycle emission factors to
calculate scope 3 emissions related to fuels and energy
consumed in the reporting company’s value chain, except
for category 3 (fuel- and energy-related activities not
included in scope 1 or scope 2) (see below). Compared to
combustion emission factors, life cycle emission factors
represent all emissions in the upstream supply chain of
fuels and energy. Where possible, companies should use
life cycle emission factors that are as specific as possible
to the type and source of fuel consumed (e.g., specific to
the technology used to produce a fuel).
Emission factors for scope 3, category 3 (Fuel- and energy-related activities not included in scope 1 or scope 2)Two activities within category 3 require special
consideration when selecting emission factors:
• Upstream emissions of purchased fuels (i.e.,
extraction, production, and transportation of fuels
consumed by the reporting company)
• Upstream emissions of purchased electricity (i.e.,
extraction, production, and transportation of fuels
consumed in the generation of electricity, steam,
heating, and cooling that is consumed by the
reporting company)
To calculate emissions from these activities, companies
should use life cycle emission factors that exclude
emissions from combustion, since emissions from
combustion are accounted for in scope 1 (in the case
of fuels), in scope 2 (in the case of electricity), and in a
separate memo item (in the case of direct CO2 emissions
from combustion of biomass or biofuels).
Global warming potential (GWP) valuesGlobal warming potential (GWP) values describe the
radiative forcing impact (or degree of harm to the
atmosphere) of one unit of a given GHG relative to
one unit of carbon dioxide. GWP values convert GHG
emissions data for non-CO2 gases into units of carbon
dioxide equivalent (CO2e).
Companies should use GWP values provided by the
Intergovernmental Panel on Climate Change (IPCC)
based on a 100-year time horizon. Companies may
either use the IPCC GWP values agreed to by United
Nations Framework Convention on Climate Change
(UNFCCC) or the most recent GWP values published by
the IPCC. Companies should use consistent GWP values
across their scope 1, scope 2, and scope 3 inventory
and should maintain consistency in the source of
GWP values used over time (by consistently following
guidance provided by either the UNFCCC or IPCC, once
selected). Companies that have already developed
scope 1 and scope 2 GHG inventories should use the
same GWP values for scope 3 to maintain consistency
across the scopes. Companies that have not previously
developed a corporate GHG inventory should use the
most recent GWP values.
Companies are required to disclose the source of GWP
values used to calculate the inventory (see chapter 11).
Overview of primary data and secondary dataCompanies may use two types of data to calculate scope
3 emissions:
• Primary data
• Secondary data
Table 7.3 provides definitions of these two types of data.

[71]
CHAPTER 07 Collecting Data
Primary data includes data provided by suppliers or
other value chain partners related to specific activities
in the reporting company’s value chain. Such data may
take the form of primary activity data, or emissions
data calculated by suppliers that are specific to
suppliers’ activities.
Secondary data includes industry-average data (e.g.,
from published databases, government statistics,
literature studies, and industry associations), financial
data, proxy data, and other generic data. In certain
cases, companies may use specific data from one
activity in the value chain to estimate emissions for
another activity in the value chain. This type of data
(i.e., proxy data) is considered secondary data, since
it is not specific to the activity whose emissions are
being calculated.
Table 7.4 provides examples of primary and secondary
data by scope 3 category.
For its first scope
3 inventory, Kraft
Foods, a U.S.-based
global food products
company, focused on
achieving a complete
inventory of all scope
3 emissions, with the
goal of supporting
high-level strategic
evaluations and
internal understanding of its value chain GHG emissions.
To accomplish this goal, the company obtained industry-
average life cycle inventory data from various public
and commercial sources. Kraft Foods matched the
emission factors with its own internal data on activities
and purchases. For the company’s supply chain, the
secondary data approach allowed the company to
understand its total scope 3 emissions with reasonable
accuracy, cost, and speed, and with the ability to update
as more precise secondary data became available.
Using secondary data also fit Kraft Foods’ needs given
that a large portion of its purchased commodities
are produced in a global market where tracking the
agricultural source of origin is challenging.
Kraft Foods found that scope 3 emissions comprise
more than 90 percent of the company’s combined
scope 1, scope 2, and scope 3 emissions. Within scope
3, the company found that emissions from category 1
(Purchased goods and services), including raw materials,
comprised 70 percent of its total scope 3 emissions,
while transportation and distribution, energy-related
activities, and the use of sold products accounted for
the majority of the remaining 30 percent. Kraft Foods
included an estimated uncertainty range for each scope 3
category in order to provide additional transparency.
Kraft Foods plans to continuously improve the quality of
its GHG inventory to better understand the company’s
influence on climate change. Using the inventory results,
the company will continue to expand and enhance its
efforts to develop effective GHG-reduction strategies.
Kraft Foods: Collecting scope 3 data
Kraft Foods found that scope 3 emissions comprise more than 90 percent of the company’s combined scope 1, scope 2, and scope 3 emissions.

[72] Corporate Value Chain (Scope 3) Accounting and Reporting Standard[72] Corporate Value Chain (Scope 3) Accounting and Reporting Standard
Upstream scope 3 emissions
Category Examples of primary data Examples of secondary data
1. Purchased goods and services
• Product-level cradle-to-gate GHG data from suppliers calculated using site-specific data
• Site-specific energy use or emissions data from suppliers
• Industry average emission factors per material consumed from life cycle inventory databases
2. Capital goods • Product-level cradle-to-gate GHG data from suppliers calculated using site-specific data
• Site-specific energy use or emissions data from capital goods suppliers
• Industry average emission factors per material consumed from life cycle inventory databases
3. Fuel- and energy-related activities (not included in scope 1 or scope 2)
• Company-specific data on upstream emissions (e.g. extraction of fuels)
• Grid-specific T&D loss rate• Company-specific power purchase
data and generator-specific emission rate for purchased power
• National average data on upstream emissions (e.g. from life cycle inventory database)
• National average T&D loss rate• National average power
purchase data
4. Upstream transportation and distribution
• Activity-specific energy use or emissions data from third-party transportation and distribution suppliers
• Actual distance traveled • Carrier-specific emission factors
• Estimated distance traveled by mode based on industry-average data
5. Waste generated in operations
• Site-specific emissions data from waste management companies
• Company-specific metric tons of waste generated
• Company-specific emission factors
• Estimated metric tons of waste generated based on industry-average data
• Industry average emission factors
6. Business travel • Activity-specific data from transportation suppliers (e.g., airlines)
• Carrier-specific emission factors
• Estimated distance traveled based on industry-average data
7. Employee commuting
• Specific distance traveled and mode of transport collected from employees
• Estimated distance traveled based on industry-average data
8. Upstream leased assets
• Site-specific energy use data collected by utility bills or meters
• Estimated emissions based on industry-average data (e.g. energy use per floor space by building type)
Table [7.4] Examples of primary and secondary data by scope 3 category

[73]
CHAPTER 07 Collecting Data
Downstream scope 3 emissions
Category Examples of primary data Examples of secondary data
9. Transportation and distribution of sold products
• Activity-specific energy use or
emissions data from third-party
transportation and distribution
partners
• Activity-specific distance traveled
• Company-specific emission factors
(e.g., per metric ton-km)
• Estimated distance traveled based on
industry-average data
• National average emission factors
10. Processing of sold products
• Site-specific energy use or emissions
from downstream value chain
partners
• Estimated energy use based on
industry-average data
11. Use of sold products
• Specific data collected from
consumers
• Estimated energy used based
on national average statistics on
product use
12. End-of-life treatment of sold products
• Specific data collected from
consumers on disposal rates
• Specific data collected from waste
management providers on emissions
rates or energy use
• Estimated disposal rates based on
national average statistics
• Estimated emissions or energy use
based on national average statistics
13. Downstream leased assets
• Site-specific energy use data
collected by utility bills or meters
• Estimated emissions based on
industry-average data (e.g., energy
use per floor space by building type)
14. Franchises • Site-specific energy use data
collected by utility bills or meters
• Estimated emissions based on
industry-average data (e.g., energy
use per floor space by building type)
15. Investments • Site-specific energy use or
emissions data
• Estimated emissions based on
industry-average data
Table [7.4] Examples of primary and secondary data by scope 3 category (continued)
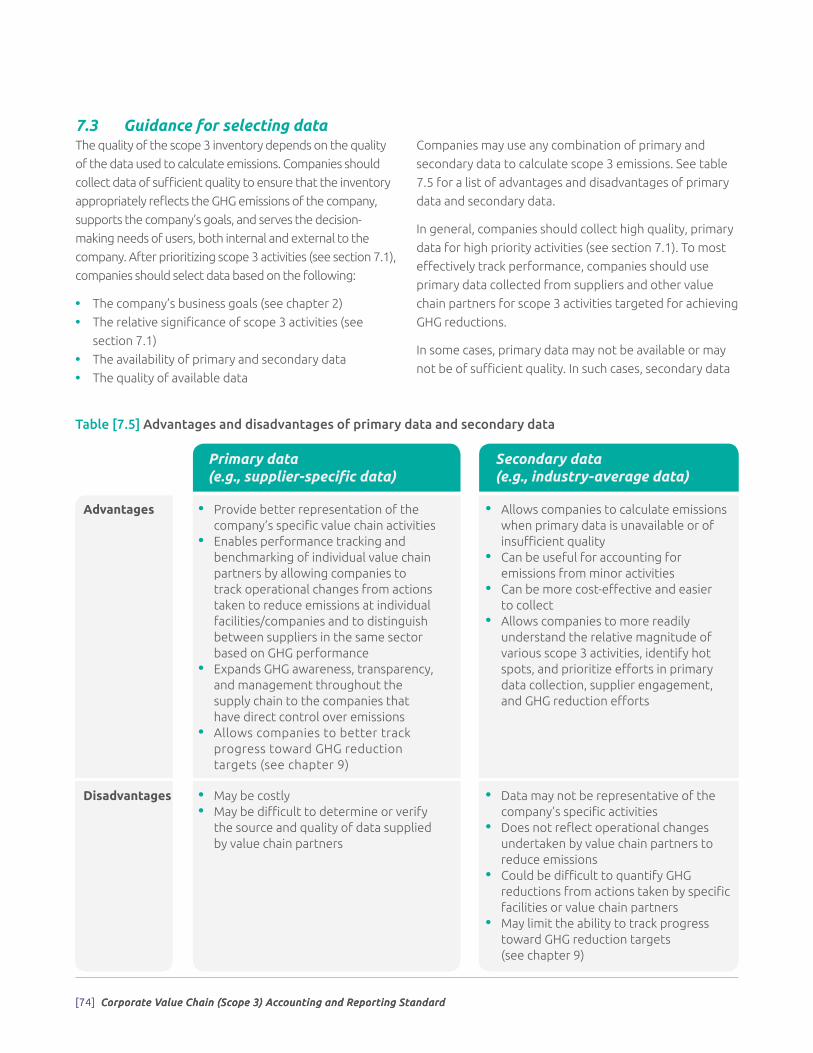
[74] Corporate Value Chain (Scope 3) Accounting and Reporting Standard[74] Corporate Value Chain (Scope 3) Accounting and Reporting Standard
Table [7.5] Advantages and disadvantages of primary data and secondary data
7.3 Guidance for selecting dataThe quality of the scope 3 inventory depends on the quality
of the data used to calculate emissions. Companies should
collect data of sufficient quality to ensure that the inventory
appropriately reflects the GHG emissions of the company,
supports the company’s goals, and serves the decision-
making needs of users, both internal and external to the
company. After prioritizing scope 3 activities (see section 7.1),
companies should select data based on the following:
• The company’s business goals (see chapter 2)
• The relative significance of scope 3 activities (see
section 7.1)
• The availability of primary and secondary data
• The quality of available data
Companies may use any combination of primary and
secondary data to calculate scope 3 emissions. See table
7.5 for a list of advantages and disadvantages of primary
data and secondary data.
In general, companies should collect high quality, primary
data for high priority activities (see section 7.1). To most
effectively track performance, companies should use
primary data collected from suppliers and other value
chain partners for scope 3 activities targeted for achieving
GHG reductions.
In some cases, primary data may not be available or may
not be of sufficient quality. In such cases, secondary data
Primary data (e.g., supplier-specific data)
Secondary data (e.g., industry-average data)
Advantages • Provide better representation of the company’s specific value chain activities
• Enables performance tracking and benchmarking of individual value chain partners by allowing companies to track operational changes from actions taken to reduce emissions at individual facilities/companies and to distinguish between suppliers in the same sector based on GHG performance
• Expands GHG awareness, transparency, and management throughout the supply chain to the companies that have direct control over emissions
• Allows companies to better track progress toward GHG reduction targets (see chapter 9)
• Allows companies to calculate emissions when primary data is unavailable or of insufficient quality
• Can be useful for accounting for emissions from minor activities
• Can be more cost-effective and easier to collect
• Allows companies to more readily understand the relative magnitude of various scope 3 activities, identify hot spots, and prioritize efforts in primary data collection, supplier engagement, and GHG reduction efforts
Disadvantages • May be costly• May be difficult to determine or verify
the source and quality of data supplied by value chain partners
• Data may not be representative of the company’s specific activities
• Does not reflect operational changes undertaken by value chain partners to reduce emissions
• Could be difficult to quantify GHG reductions from actions taken by specific facilities or value chain partners
• May limit the ability to track progress toward GHG reduction targets (see chapter 9)

[75]
CHAPTER 07 Collecting Data
may be of higher quality than the available primary data
for a given activity. Data selection depends on business
goals. If the company’s main goal is to set GHG reduction
targets, track performance from specific operations
within the value chain, or engage suppliers, the company
should select primary data. If the company’s main goal is
to understand the relative magnitude of various scope
3 activities, identify hot spots, and prioritize efforts
in primary data collection, the company should select
secondary data. In general, companies should collect
secondary data for:
• Activities not prioritized based on initial estimation
methods or other criteria (see section 7.1)
• Activities for which primary data is not available (e.g.,
where a value chain partner is unable to provide data)
• Activities for which the quality of secondary data is
higher than primary data (e.g., when a value chain
partner is unable to provide data of sufficient quality)1
Companies are required to report a description of
the types and sources of data (including activity data,
emission factors, and GWP values) used to calculate
emissions, and the percentage of emissions calculated
using data obtained from suppliers or other value chain
partners (see chapter 11).
Data qualitySources of primary data and secondary data can vary in
quality. When selecting data sources, companies should
use the data quality indicators in table 7.6 as a guide to
obtaining the highest quality data available for a given
emissions activity. The data quality indicators describe the
representativeness of data (in terms of technology, time,
and geography) and the quality of data measurements
(i.e., completeness and reliability of data).
Companies should select data that are the most
representative in terms of technology, time, and
geography; most complete; and most reliable. Companies
should determine the most useful method for applying
the data quality indicators when selecting data and
evaluating data quality. One example of applying the data
quality indicators is presented in box 7.2.
To ensure transparency and avoid misinterpretation of
data, companies are required to report a description of the
data quality of reported emissions data (see chapter 11).
Because scope 3 emissions are emissions from
activities not under the reporting company’s ownership
or control, companies are likely to face additional
challenges related to collecting data and ensuring
data quality for scope 3 than for activities under the
reporting company’s ownership or control. Scope 3 data
collection challenges include:
• Reliance on value chain partners to provide data
• Lesser degree of influence over data collection and
management practices
• Lesser degree of knowledge about data types, data
sources, and data quality
• Broader need for secondary data
• Broader need for assumptions and modeling
These data collection challenges contribute to uncertainty
in scope 3 accounting. Higher uncertainty for scope 3
calculations is acceptable as long as the data quality of
the inventory is sufficient to support the company’s goals
and ensures that the scope 3 inventory is relevant (i.e.,
the inventory appropriately reflects the GHG emissions
of the company, and serves the decision-making needs
of users, both internal and external to the company).
For example, companies may seek to ensure that data
quality is sufficient to understand the relative magnitude
of scope 3 activities across the value chain and to enable
consistent tracking of scope 3 emissions over time. See
Appendix B for more information on uncertainty.
To facilitate quality assurance and quality control when
collecting data, companies should develop a data
management plan that documents the GHG inventory
process and the internal quality assurance and quality
control (QA/QC) procedures in place to enable the
preparation of the inventory from its inception through
final reporting. For more information, see Appendix C.
Companies should select data that are the most
representative in terms of technology, time, and
geography; most complete; and most reliable.

[76] Corporate Value Chain (Scope 3) Accounting and Reporting Standard[76] Corporate Value Chain (Scope 3) Accounting and Reporting Standard
Adapted from B.P. Weidema and M.S. Wesnaes, “Data quality management for life cycle inventories – an example of using data quality indicators,”
Journal of Cleaner Production 4 no. 3-4 (1996): 167-174.
Table [7.6] Data quality indicators
Indicator Description
Technological representativeness The degree to which the data set reflects the actual technology(ies) used
Temporal representativeness The degree to which the data set reflects the actual time (e.g., year) or age of the activity
Geographical representativeness The degree to which the data set reflects the actual geographic location of the activity (e.g., country or site)
Completeness The degree to which the data is statistically representative of the relevant activity. Completeness includes the percentage of locations for which data is available and used out of the total number that relate to a specific activity. Completeness also addresses seasonal and other normal fluctuations in data.
Reliability The degree to which the sources, data collection methods and verification procedures2 used to obtain the data are dependable.

[77]
CHAPTER 07 Collecting Data
Adapted from B.P. Weidema and M.S. Wesnaes, “Data quality management for life cycle inventories – an example of using data quality indicators,”
Journal of Cleaner Production 4 no. 3-4 (1996): 167-174.
Box [7.2] Example of criteria to evaluate the data quality indicators
A qualitative approach to data quality assessment uses
rating descriptions for each of the data quality indicators
on direct emissions data, activity data, and emission
factors as applicable. This rating system has elements of
subjectivity. For example, some fuel emission factors have
not changed significantly in many years. Therefore, a fuel
emission factor that is over 10 years old, which would be
assigned a temporal score of poor with the data quality
in the table below, may not be different than a factor less
than 6 years old (a temporal rating of good). Companies
should consider the individual circumstances of the data
when using the data quality results as a basis for collecting
new data or evaluating data quality.
Score Representativeness to the activity in terms of:
Technology Time Geography Completeness Reliability
Very good
Data generated using the same technology
Data with less than 3 years of difference
Data from the same area
Data from all relevant sites over an adequate time period to even out normal fluctuations
Verified3 data based on measurements4
Good Data generated using a similar but different technology
Data with less than 6 years of difference
Data from a similar area
Data from more than 50 percent of sites for an adequate time period to even out normal fluctuations
Verified data partly based on assumptions or non-verified data based on measurements
Fair Data generated using a different technology
Data with less than 10 years of difference
Data from a different area
Data from less than 50 percent of sites for an adequate time period to even out normal fluctuations or more than 50 percent of sites but for a shorter time period
Non-verified data partly based on assumptions, or a qualified estimate (e.g. by a sector expert)
Poor Data where technology is unknown
Data with more than 10 years of difference or the age of the data are unknown
Data from an area that is unknown
Data from less than 50 percent of sites for shorter time period or representativeness is unknown
Non-qualified estimate

[78] Corporate Value Chain (Scope 3) Accounting and Reporting Standard[78] Corporate Value Chain (Scope 3) Accounting and Reporting Standard
7.4 Guidance for collecting primary data Primary activity data may be obtained through meter
readings, purchase records, utility bills, engineering
models, direct monitoring, mass balance, stoichiometry,
or other methods for obtaining data from specific
activities in the company’s value chain.
Where possible, companies should collect energy or
emissions data from suppliers and other value chain
partners in order to obtain site-specific data for priority
scope 3 categories and activities. To do so, companies
should identify relevant suppliers from which to seek
GHG data. Suppliers may include contract manufacturers,
materials and parts suppliers, capital equipment suppliers,
fuel suppliers, third party logistics providers, waste
management companies, and other companies that
provide goods and services to the reporting company.
Companies should first engage relevant tier 1 suppliers
(see figure 7.3). Tier 1 suppliers are companies with
which the reporting company has a purchase order for
goods or services (e.g., materials, parts, components,
etc.). Tier 1 suppliers have contractual obligations with
the reporting company, providing the leverage needed
to request GHG inventory data.
To be comprehensive, companies may seek to obtain
GHG emissions data from all tier 1 suppliers. However, a
company may have many small tier 1 suppliers that together
comprise only a small share of a company’s total activities
and spending. Companies may develop their own policy
for selecting relevant suppliers to target for primary data
collection. For example, a company may select suppliers
based on their contribution to its total spend (see box 7.3).
A company may also seek data from tier 2 suppliers, where
relevant (see box 7.5). Tier 2 suppliers are companies with
which tier 1 suppliers have a purchase order for goods and
services (see figure 7.3). Companies should use secondary
data to calculate emissions from activities where supplier-
specific data is not collected or is incomplete.
Companies are required to report the percentage of
emissions calculated using data obtained from suppliers
or other value chain partners (see chapter 11).
It is unlikely that all of a company’s relevant suppliers will
be able to provide GHG inventory data to the company.
(See table 7.8 for a list of challenges and guidance for
collecting primary data from suppliers.) In such cases,
companies should encourage suppliers to develop GHG
inventories in the future and may communicate their
efforts to encourage more suppliers to provide GHG
emissions data in the public report.
After selecting relevant suppliers, companies should determine the type and level of data to request from suppliers.
Type of dataThe type of data that should be collected varies by
scope 3 category. For example, companies may send
questionnaires to each relevant supplier or other value
chain partner requesting the following items:
• Product life cycle GHG emissions data following the
GHG Protocol Product Standard
• Scope 1 and scope 2 emissions data5 for the reporting
year6 following the GHG Protocol Corporate Standard
and according to the hierarchy provided in table 7.7
• The supplier’s upstream scope 3 emissions and/or the
types of activities that occur upstream of the supplier
(if applicable)
Figure [7.3] Tier 1 suppliers in a supply chain
reporting company
tier 1 supplier
tier 1 supplier
tier 1 supplier
tier 2 supplier
tier 2 supplier
tier 2 supplier
tier 2 supplier
tier 2 supplier

[79]
CHAPTER 07 Collecting Data
• A description of the methodologies used to quantify
emissions and a description of the data sources used
(including emission factors and GWP values)7
• The method(s) the supplier used to allocate emissions,
or information the reporting company would need to
allocate emissions (see chapter 8)
• Whether the data has been assured/verified, and if so,
the type of assurance achieved
• Any other relevant information
For more information on types of data to collect by scope
3 category, see the GHG Protocol Guidance for Calculating
Scope 3 Emissions, available at www.ghgprotocol.org.
Level of dataActivity data and emissions data may be collected at varying
levels of detail and granularity. When collecting primary
data from value chain partners, companies should obtain
the most product-specific data available (see table 7.7).
Product-level data is more precise because it relates to
the specific good or service purchased by the reporting
company and avoids the need for allocation (see chapter 8).
In general, companies should seek activity data or
emissions data from suppliers that is as specific as
possible to the product purchased from the supplier,
following the hierarchy in table 7.7. If product-level data
is not available, suppliers should try to provide data at the
activity-, process-, or production line-level. If activity-level
data is not available, suppliers should try to provide data
at the facility level, and so on. Collecting more granular
data is especially important from diversified suppliers that
produce a wide variety of products (see box 7.4). Data
collected at the activity, production line, facility, business
unit, or corporate level may require allocation. (For
guidance, see chapter 8.)
For more guidance on collecting primary data from
suppliers, see Guidance for Collecting Data from Suppliers,
available at www.ghgprotocol.org.
Quality of supplier dataThe quality of supplier data may vary widely and be
difficult to determine. Suppliers should use the data-
quality indicators in section 7.3 to select data that
are most representative of their activities in terms of
technology, time, and geography, and that are the most
complete and reliable. Reporting companies should
use the data-quality indicators to assess the quality of
suppliers’ data. To do so, companies should request that
suppliers provide supporting documentation to explain
their methodology and the sources and quality of data
used. Companies may request that suppliers perform first
party or third party assurance of their data to ensure its
accuracy and completeness (see chapter 10).
See table 7.8 for a list of challenges and guidance for
collecting primary data from suppliers.

[80] Corporate Value Chain (Scope 3) Accounting and Reporting Standard[80] Corporate Value Chain (Scope 3) Accounting and Reporting Standard
Figure [7.4] Ranking a company’s tier 1 suppliers according to spend
Table [7.7] Levels of data (ranked in order of specificity)
Data type Description
Product-level data Cradle-to-gate9 GHG emissions for the product of interest
Activity-, process- or production line-level data
GHG emissions and/or activity data for the activities, processes, or production lines that produce the product of interest
Facility-level data GHG emissions and/or activity data for the facilities or operations that produce the product of interest
Business unit-level data GHG emissions and/or activity data for the business units that produce the product of interest
Corporate-level data GHG emissions and/or activity data for the entire corporation
Box [7.3] Example of prioritizing suppliers based on contribution to the company’s total spend
As an example, a company may prioritize suppliers by
following these steps:
1. Obtain a complete list of the reporting company’s
total spend or expenditure, by supplier
2. Rank tier 1 suppliers according to their contribution
to the reporting company’s total spend
3. Select the largest tier 1 suppliers that collectively
account for at least 80 percent 8 of spend (see figure 7.4)
4. Within the remaining 20 percent of spend, select any
additional suppliers that are individually more than
1 percent of spend or that are relevant to
the company for other reasons (e.g., contract
manufacturers, suppliers that are expected to have
significant GHG emissions, suppliers that produce or
emit HFCs, PFCs, or SF6, suppliers of high emitting
materials, suppliers in priority spend categories as
defined by the company, etc.)
In this example, A-Z represent individual suppliers. The
company selects suppliers A through I because they
collectively account for 80 percent of the company’s
spend. The company also selects supplier J because it
individually represents more than 1 percent of supplier
spend. The company uses secondary data to calculate
emissions from activities where supplier-specific data is
not collected or is incomplete.
A B C D E F G H I J K L M N O P Q R S T U V W X Y Z
80% 20%
$
tier 1 suppliers

[81]
CHAPTER 07 Collecting Data
The need to collect granular data from a supplier depends
in part on the variety and diversity of products the supplier
produces. Collecting data at the product, production
line, or facility level is more important for diversified
companies than for relatively homogeneous companies,
for which business unit- or corporate-level data may yield
representative GHG estimates. Below are two examples:
A) a homogeneous supplier with relatively uniform
emissions throughout its operations and B) a diversified
supplier where GHG intensity varies widely between
business units and facilities.
Box [7.4] Level of data and supplier type
The reporting company purchases the same type of
professional services from both suppliers. The reporting
company needs to decide whether collecting corporate-
level emissions from the suppliers will accurately
reflect emissions related to the purchased product. The
company makes a qualitative determination based on the
nature of each supplier’s business activities.
For Supplier A, the reporting company decides to use
corporate level data to estimate emissions from the
purchased service because the supplier only produces
professional services, each of which has a similar
GHG intensity. For Supplier B, however, the reporting
company decides not to use corporate-level emissions
data because the company is diversified and has business
units in both professional services and manufacturing,
which have widely different GHG intensities. As a result,
using corporate-level data would not accurately reflect
emissions from the purchased service. More granular
data (e.g., facility- or business unit-level data) should be
used instead.
facility A:office bldg
facility B:office bldg
facility C:office bldg
facility A:office bldg
facility B:office bldg
facility C:manufacturing
business unit A: professional services
business unit B:professional services
corporation
business unit A: professional services
business unit B:manufacturing
corporation
low emissions intermediate emissions high emissions
A. homogeneous supplier B. diversified supplier
key

[82] Corporate Value Chain (Scope 3) Accounting and Reporting Standard[82] Corporate Value Chain (Scope 3) Accounting and Reporting Standard
Table [7.8] Challenges and guidance for collecting primary data from value chain partners
Challenges Guidance
Large number of suppliers
• Target most relevant suppliers based on spend and/or anticipated emissions impact • Target suppliers where the reporting company has a higher degree of influence
(e.g., contract manufacturers or suppliers where the reporting company accounts for a significant share of the supplier’s total sales)
Lack of supplier knowledge and experience with GHG inventories and accounting
• Target suppliers with prior experience developing GHG inventories • Identify the correct subject-matter expert at the company • Explain the business value of investing in GHG accounting and management• Request data suppliers already have collected, such as energy-use data, rather than
emissions data • Provide clear instructions and guidance with the data request• Provide training, support, and follow-up
Lack of supplier capacity and resources for tracking data
• Make the data request as simple as possible• Use a simple, user-friendly, standardized data template or questionnaire• Provide a clear list of data required and where to find data (e.g., utility bills)• Use an automated online data collection system to streamline data entry• Consider use of a third party database to collect data• Engage and leverage resources from suppliers’ trade associations • Coordinate GHG data request with other requests• Follow up with suppliers
Lack of transparency in the quality of supplier data
• Request documentation on methodology and data sources used, inclusions, exclusions, assumptions, etc.
• Minimize errors by requesting activity data (e.g., kWh electricity used, kg of fuels used) and calculating GHG emissions separately
• Consider third party assurance
Confidentiality concerns of suppliers
• Protect suppliers’ confidential and proprietary information (e.g., through nondisclosure agreements, firewalls, etc.)
• Ask suppliers to obtain third party assurance rather than submitting detailed activity data to avoid providing confidential information
Language barriers • Translate the questionnaire and communications into local languages

[83]
CHAPTER 07 Collecting Data
While companies should first engage tier 1 suppliers,
significant value chain GHG impacts often lie upstream
of a company’s tier 1 suppliers. Tier 1 suppliers may
outsource manufacturing or be several layers removed
from the most GHG-intensive operations in a supply chain
(e.g., raw material extraction or manufacturing).
As a result, companies may want to promote further
proliferation of GHG management throughout the supply
chain. As tier 1 data is gathered, companies may consider
whether and how to approach deeper levels of the supply
chain. Possible approaches include:
• Encouraging or requiring tier 1 suppliers to encourage
their own tier 1 suppliers (i.e., the reporting company’s
tier 2 suppliers) to report their GHG inventories.
Eventually ask tier 2 suppliers to require their tier 1
suppliers to do the same.
• Target specific tier 2 suppliers for GHG data requests in
cases where tier 2 suppliers are responsible for the majority
of GHG emissions associated with a product provided by
a tier 1 supplier. In practice, this approach is likely to be
difficult without close cooperation between a company
and its complete supply chain. As an example, a firm that
sells food products may work closely with both growers
and processors in its supply chain.
Cascading GHG accounting and reporting throughout
supply chains expands the number of companies directly
involved in managing GHG emissions. Companies
undertaking supply chain engagement efforts may
optionally provide information about such efforts in the
public report (see chapter 11).
Box [7.5] Expanding supplier GHG management beyond tier 1 suppliers
7.5 Guidance for collecting secondary data and filling data gaps
Collecting secondary dataWhen using secondary databases, companies
should prioritize databases and publications that
are internationally recognized, provided by national
governments, or peer-reviewed. Companies should
use the data-quality indicators in section 7.3 when
selecting secondary data sources. The data-quality
indicators should be used to select secondary data
that are the most representative to the company’s
activities in terms of technology, time, and geography,
and that are the most complete and reliable. A list
of available secondary data sources is available at
www.ghgprotocol.org.
Using proxy data to fill data gapsCompanies should use the guidance in section 7.3 to
assess the quality of available data. If data of sufficient
quality are not available, companies may use proxy data
to fill data gaps. Proxy data is data from a similar activity
that is used as a stand-in for the given activity. Proxy data
can be extrapolated, scaled up, or customized to be more
representative of the given activity (e.g., partial data for
an activity that is extrapolated or scaled up to represent
100 percent of the activity).
Examples of proxy data include:
• An emission factor exists for electricity in Ukraine,
but not for Moldova. A company uses the electricity
emission factor from Ukraine as a proxy for electricity
in Moldova.
• A company collects data for 80 percent of its
production for a given product category, but 20
percent is unknown. The company assumes the
unknown 20 percent has similar characteristics to the
known 80 percent so applies a linear extrapolation to
estimate 100 percent of the production data.

[84] Corporate Value Chain (Scope 3) Accounting and Reporting Standard[84] Corporate Value Chain (Scope 3) Accounting and Reporting Standard
7.6 Improving data quality over timeCollecting data, assessing data quality, and improving
data quality is an iterative process. Companies should
first apply data quality indicators and assess data quality
when selecting data sources (see section 7.3), then review
the quality of data used in the inventory after data has
been collected, using the same data quality assessment
approach. In the initial years of scope 3 data collection,
companies may need to use data of relatively low quality
due to limited data availability. Over time, companies
should seek to improve the data quality of the inventory
by replacing lower quality data with higher quality data
as it becomes available. In particular, companies should
prioritize data quality improvement for activities that have
the following:
• Relatively low data quality (based on the data quality
guidance in section 7.3)
• Relatively high emissions
Companies are required to provide a description of
the data quality of reported scope 3 emissions data to
ensure transparency and avoid misinterpretation of
data (see chapter 11). Refer to section 7.3 for guidance
on describing data quality; Appendix B for guidance
on uncertainty; and section 9.3 for guidance on
recalculating base year emissions when making significant
improvements in data quality over time.

[85]
CHAPTER 07 Collecting Data
Endnotes1 For example, activity-specific secondary data may be of higher
quality than corporate-level primary data received from a supplier.
2 Verification may take place in several ways, for example by on-site
checking, reviewing calculations, mass balance calculations, or
cross-checks with other sources.
3 Verification may take place in several ways, for example by on-site
checking, reviewing calculations, mass balance calculations, or
cross-checks with other sources.
4 Includes calculated data (e.g., emissions calculated using
activity data) when the basis for calculation is measurements
(e.g., measured inputs). If the calculation is based partly on
assumptions, the score should be ‘Good’ or ‘Fair.’
5 Suppliers’ scope 1 and scope 2 emissions data should include
emissions of CO2, CH4, N2O, HFCs, PFCs, and SF6, and may be
aggregated to units of carbon dioxide equivalent rather than
separately reported by individual greenhouse gas.
6 Some suppliers may collect data on a fiscal year basis, while
others collect data on a calendar year basis. To the greatest
extent possible, reporting companies should collect or adjust
data to reflect a consistent 12-month period.
7 To the greatest extent possible, companies should encourage
consistent use of sources of emission factors and GWP values
across suppliers.
8 Eighty percent is an example threshold. Companies may define
their own threshold. The percentage can be increased over time
as the reporting company and its suppliers gain experience in
managing GHG emissions.
9 Cradle-to-gate GHG emissions include all emissions that occur in
the life cycle of purchased products, up to the point of receipt by
the reporting company (excluding emissions from sources that
are owned or controlled by the reporting company).

Allocating Emissions08

[87]
T his chapter provides guidance on allocating emissions to calculate scope 3 emissions,
including:
• Overview of allocation (section 8.1)
• How to avoid or minimize allocation, if possible (section 8.2)
• Allocation methods (section 8.3)
• Examples of allocating emissions (section 8.4)
8.1 Overview of allocationWhen companies use primary data from suppliers or
other value chain partners to calculate scope 3 emissions
(see section 7.4), companies may need to allocate
emissions. Likewise, companies may need to allocate
emissions when providing primary data to customers that
are accounting for their scope 3 emissions.
Allocation is the process of partitioning GHG emissions
from a single facility or other system1 (e.g., activity,
vehicle, production line, business unit, etc.) among its
various outputs (see figure 8.1).
When allocation is neededAllocation is necessary when:
• a single facility or other system produces multiple
outputs; and
• emissions are only quantified for the entire facility or
system as a whole.
In such a case, emissions from the shared facility
or other system need to be allocated to (or divided
between) the various outputs (see figure 8.1).
For example, a single production facility may produce
many different products and co-products, while activity
data (used to calculate GHG emissions) is collected for the
plant as a whole. In this case, the facility’s energy use and
emissions need to be allocated to its various outputs.
Similarly, a company may purchase components from a
supplier that manufactures a wide variety of products
for many different customers. In this case, the supplier’s
activity data or emissions data need to be allocated
among the various products so its customers know the
emissions attributable to the specific products they buy,
based on the fraction of total supplier production that is
related to the customer’s purchases.
gu
id
an
ce

[88] Corporate Value Chain (Scope 3) Accounting and Reporting Standard
When allocation is not neededWhen using primary data, allocation is not necessary if:
• a facility or other system produces only one output; or
• emissions from producing each output are separately
quantified.
Allocation is not typically necessary when using secondary
data to calculate scope 3 emissions, since the activity
data and emission factors are typically in reference to a
single product (e.g., calculating emissions from third-party
transportation by multiplying weight-distance traveled by
an emission factor).
8.2 Avoid or minimize allocation if possible
When using primary data to calculate scope 3 emissions,
companies should avoid or minimize allocation if possible.
Allocation adds uncertainty to the emissions estimates
and may be especially inaccurate when an activity or
facility produces a wide variety of products that differ
significantly in their GHG contribution.
For example, a supplier may manufacture twenty
different types of products and only supply one type of
product to the reporting company. Allocating the scope 1
and scope 2 emissions of the supplier would be inaccurate
if the type of good supplied to the reporting company
has a lower or higher emissions intensity than the average
emissions intensity of the twenty products manufactured
by the supplier. Therefore, allocation should be used only
when more accurate data is not available.
Companies should avoid or minimize allocation by
collecting more detailed data through one of the
following approaches:
• Obtaining product-level GHG data from value chain
partners following the GHG Protocol Product Standard 2
• Separately sub-metering energy use and other activity
data (e.g., at the production line level)3
• Using engineering models to separately estimate
emissions related to each product produced4
8.3 Allocation methodsIf avoiding allocation is not possible, companies should
first determine total facility or system emissions, then
determine the most appropriate method and factor for
allocating emissions. (See table 8.1 for a list of allocation
methods and factors.)
As a general rule, companies should follow the decision
tree in figure 8.2 when deciding if allocation is needed
and selecting an allocation method. However, the
most appropriate allocation method for a given activity
depends on individual circumstances (see section 8.4
for examples). Companies should select the allocation
approach that:
• best reflects the causal relationship between the
production of the outputs and the resulting emissions;
• results in the most accurate and credible emissions
estimates;
• best supports effective decision-making and GHG
reduction activities; and
• otherwise adheres to the principles of relevance,
accuracy, completeness, consistency and transparency.
Different allocation methods may yield significantly
different results. Companies that have a choice between
multiple methods for a given activity should evaluate
each method to determine the range of possible results
Figure [8.1] The need for allocation
material input A product A
facility or
system
emissions
material input B
energy inputs
product B
waste
inputs outputs

[89]
CHAPTER 08 Allocating Emissions
Figure [8.2] Decision tree for selecting an allocation approach
before selecting a single method (e.g., conduct a
sensitivity analysis).
Companies may use a combination of different allocation
methods and factors to estimate emissions from the
various activities in the scope 3 inventory. However, for
each individual facility or system, a single, consistent
allocation factor should be used to allocate emissions
throughout the facility or system. The sum of the
allocated emissions for each output of a system should
equal 100 percent of emissions from the system. The
use of multiple allocation methods for a single system
can result in over-counting or under-counting of total
emissions from the system.
To allocate emissions from a facility, multiply total facility
emissions by the reporting company’s purchases as a
fraction of total production (see box 8.1). Either the
reporting company or its suppliers can allocate supplier
emissions to the reporting company (see box 8.2).
See table 8.2 for allocation guidance by scope 3 category.
Companies are required to report a description of the
allocation methods used to calculate scope 3 emissions
(see chapter 11). Where applicable, companies
should disclose the range of results obtained through
sensitivity analysis.
can GHG data be provided for the specific product purchased?
step 1:avoid allocation if possible
can engineering models be used to separately estimate the energy use or other activity data
used to produce each output?
allocate using physical factors
allocate using economic factors or other relationships
do physical factors best reflect the causal relationship between production of the outputs and the resulting emissions? Are data available on the
physical quantities of outputs produced?
no need to allocatecan the energy use or other activity data used to produce each output be separately sub-metered?
step 2:consider physicalallocation
step 3: if data is not available use another method
yes
yes
no
no

[90] Corporate Value Chain (Scope 3) Accounting and Reporting Standard
Allocated Facility Emissions = Total Facility Emissions x
No allocation for waste generated in production (e.g., within category 1, category 2, and category 10)Waste is an output of a system that has no market value.
While companies generate revenue through the sale
of co-products, companies receive no revenue from
waste and may instead pay to dispose of it. Waste may
be generated from production processes included in
category 1 (Purchased goods and services), category
2 (Capital goods), or category 10 (Processing of sold
products). If a facility produces waste during production,
no emissions from the facility should be allocated to the
waste. All emissions from the facility should instead be
allocated among the facility’s other outputs. If waste
becomes useful and marketable for use in another
system, it is no longer considered waste and should be
treated like other types of outputs.
The preceding guidance does not apply to category 5
(Waste generated in operations) or category 12
(End-of-life treatment of sold products). Companies
should account for all emissions related to waste within
category 5 and category 12.
Box [8.1] Equation for allocating emissions from a facility
Companies may use two basic approaches for collecting
and allocating GHG emissions from suppliers:
• Supplier allocation: Individual suppliers report pre-
allocated emissions data to the reporting company and
disclose the allocation metric used
• Reporting company allocation: The reporting
company allocates supplier emissions by obtaining two
types of data from individual suppliers: 1) total supplier
GHG emissions data (e.g., at the facility or business
unit level), and 2) the reporting company’s share of the
supplier’s total production, based on either physical
factors (e.g., units of production, mass, volume, or other
metrics) or economic factors (e.g., revenue, spend)
Reporting company allocation is likely to ensure more
consistency in methodologies for the reporting company,
while the supplier allocation approach may be more
practical by avoiding the need for suppliers to report
confidential business information.
Box [8.2] Two approaches to allocating GHG emissions from suppliers
Where both “Reporting Company’s Purchases from the Facility” and “Total Facility Production” are measured in the same units (e.g., mass, volume, market value, number of products)
Reporting Company’ s Purchases from the Facility
Total Facility Production

[91]
CHAPTER 08 Allocating Emissions
Physical allocation: Allocating the emissions of an activity based on an underlying physical relationship between the multiple inputs/outputs and the quantity of emissions generated
Allocation factors Examples of allocation factors and formulas
Mass Mass of co-products
VolumeVolume of cargo transported
Energy Energy content of heat and electricity co-products
Chemical Chemical composition of chemical co-products
Number of units Number of units shipped
Other factors Protein content of food co-products, floor space occupied by products Other formulas
Allocation factors Examples of allocation factors and formulas
Other factors Other formulas
Mass of Products Purchased
Total Mass of Products ProducedAllocated Facility Emissions = x Total Emissions
Volume of Products Purchased
Total Volume of Products ProducedAllocated Facility Emissions = x Total Emissions
Energy Content of Products Purchased
Total Energy Content of Products ProducedAllocated Facility Emissions = x Total Emissions
Chemical Content of Products Purchased
Total Chemical Content of Products ProducedAllocated Facility Emissions = x Total Emissions
Number of Units Purchased
Total Number of Units ProducedAllocated Facility Emissions = x Total Emissions
Table [8.1] Allocation methods and factors
Other methods: Allocating the emissions of an activity based on industry-specific or company-specific allocation methods
Allocation factors Examples of allocation factors and formulas
Market value5 Market value of co-products
Economic allocation: Allocating the emissions of an activity based on the market value of each output/product
Market Value of Products Purchased
Total Market Value of Products ProducedAllocated Facility Emissions = x Total Emissions

[92] Corporate Value Chain (Scope 3) Accounting and Reporting Standard
8.4 Examples of allocating emissions This section provides examples and guidance for
determining the most appropriate allocation method to
use for various situations. The most appropriate method
for a given activity is the one that best reflects the causal
relationship between the production of the product
and the resulting emissions, and depends on individual
circumstances. Companies should establish a consistent
policy for allocating emissions for various activities in
the value chain. Table 8.2 provides guidance on choosing
allocation methods for each scope 3 category.
Using physical allocationPhysical allocation is expected to yield more
representative emissions estimates in several situations,
outlined below.
ManufacturingIn certain cases, manufacturing facilities may produce
multiple products, each of which requires similar
energy and material inputs to produce, but which differ
significantly in market value (e.g., due to higher brand
value of one product than another). While the market
value of the products differs, the physical quantity of
Table [8.2] Allocation guidance by scope 3 category
Upstream scope 3 emissions
Category Examples of primary data requiring allocation
Allocation guidance
1. Purchased goods and services
• Site-specific energy use or emissions data from suppliers
• Physical or economic allocation
2. Capital goods • Site-specific energy use or emissions data from capital goods suppliers
• Physical or economic allocation
3. Fuel- and energy-related activities (not included in scope 1 or scope 2)
• Company-specific data on upstream emissions (e.g. extraction of fuels)
• Actual power purchase data for purchased power
• Physical allocation (energy)
4. Upstream transportation and distribution
• Activity-specific energy use or emissions data from third-party transportation and distribution suppliers
• Physical allocation (mass or volume) for shared vehicles
• Physical allocation (volume or area) for shared facilities
5. Waste generated in operations
• Site-specific emissions data from waste management companies
• Physical or economic allocation
6. Business travel • Activity-specific emissions data from transportation suppliers (e.g., airlines)
• Physical allocation for shared vehicles (e.g., area occupied)
7. Employee commuting
• Specific distance traveled and mode of transport collected from employees
• Physical allocation for shared vehicles (e.g., area occupied)
8. Upstream leased assets
• Site-specific energy use data collected by utility bills or meters
• Physical allocation for shared facilities (e.g., area or volume)

[93]
CHAPTER 08 Allocating Emissions
Table [8.2] Allocation guidance by scope 3 category (continued)
Downstream scope 3 emissions
Category Examples of primary data requiring allocation
Allocation guidance
9. Downstream transportation and distribution
• Activity-specific energy use or emissions data from third party transportation and distribution partners
• Physical allocation for shared vehicles (mass or volume)
• Physical allocation for shared facilities (volume or area)
10. Processing of sold products
• Site-specific energy use or emissions from downstream value chain partners
• Physical or economic allocation
11. Use of sold products
• Specific data collected from consumers
• Physical allocation, where applicable
12. End-of-life treatment of sold products
• Specific data collected from waste management providers on emissions rates or energy use
• Physical allocation, where applicable
13. Downstream leased assets
• Site-specific energy use data collected by utility bills or meters
• Physical allocation for shared facilities (volume or area)
14. Franchises • Site-specific energy use data collected by utility bills or meters
• Physical allocation for shared facilities (volume or area)
15. Investments • Site-specific energy use or emissions data
• Economic allocation based on the company’s proportional share of equity or debt in the investee
emissions resulting from the production of each product
is similar.
In such a case, physical factors are more closely correlated
with emissions and better approximate actual emissions
associated with producing each product. Companies
should select the physical factor that most closely
correlates to emissions, which may include units of
production, mass, volume, energy, or other metrics.
Companies should consider multiple physical factors
when selecting the factor that is most appropriate.
TransportationAllocating emissions from the transportation of cargo (or
freight) occurs when:
• a single vehicle (e.g., ship, aircraft, train, or truck)
transports multiple products;
• activity data (e.g., fuel use) is collected at the vehicle
level; and
• a company chooses to estimate emissions by
allocating total vehicle emissions to one or more of
the products shipped.
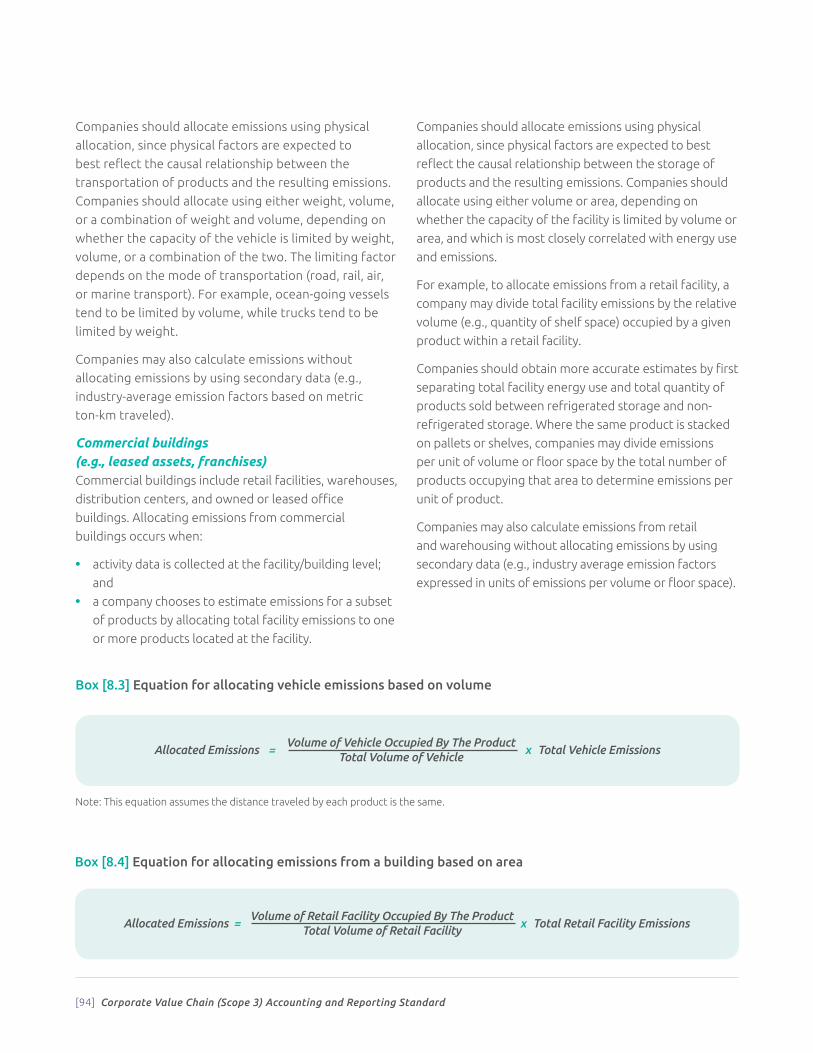
[94] Corporate Value Chain (Scope 3) Accounting and Reporting Standard
Note: This equation assumes the distance traveled by each product is the same.
Allocated Emissions = x Total Vehicle Emissions
Box [8.3] Equation for allocating vehicle emissions based on volume
Volume of Vehicle Occupied By The ProductTotal Volume of Vehicle
Allocated Emissions = x Total Retail Facility Emissions
Box [8.4] Equation for allocating emissions from a building based on area
Volume of Retail Facility Occupied By The ProductTotal Volume of Retail Facility
Companies should allocate emissions using physical
allocation, since physical factors are expected to
best reflect the causal relationship between the
transportation of products and the resulting emissions.
Companies should allocate using either weight, volume,
or a combination of weight and volume, depending on
whether the capacity of the vehicle is limited by weight,
volume, or a combination of the two. The limiting factor
depends on the mode of transportation (road, rail, air,
or marine transport). For example, ocean-going vessels
tend to be limited by volume, while trucks tend to be
limited by weight.
Companies may also calculate emissions without
allocating emissions by using secondary data (e.g.,
industry-average emission factors based on metric
ton-km traveled).
Commercial buildings (e.g., leased assets, franchises)Commercial buildings include retail facilities, warehouses,
distribution centers, and owned or leased office
buildings. Allocating emissions from commercial
buildings occurs when:
• activity data is collected at the facility/building level;
and
• a company chooses to estimate emissions for a subset
of products by allocating total facility emissions to one
or more products located at the facility.
Companies should allocate emissions using physical
allocation, since physical factors are expected to best
reflect the causal relationship between the storage of
products and the resulting emissions. Companies should
allocate using either volume or area, depending on
whether the capacity of the facility is limited by volume or
area, and which is most closely correlated with energy use
and emissions.
For example, to allocate emissions from a retail facility, a
company may divide total facility emissions by the relative
volume (e.g., quantity of shelf space) occupied by a given
product within a retail facility.
Companies should obtain more accurate estimates by first
separating total facility energy use and total quantity of
products sold between refrigerated storage and non-
refrigerated storage. Where the same product is stacked
on pallets or shelves, companies may divide emissions
per unit of volume or floor space by the total number of
products occupying that area to determine emissions per
unit of product.
Companies may also calculate emissions from retail
and warehousing without allocating emissions by using
secondary data (e.g., industry average emission factors
expressed in units of emissions per volume or floor space).

[95]
CHAPTER 08 Allocating Emissions
Using economic allocationEconomic allocation is expected to yield more
representative emissions estimates in certain situations,
such as:
• when a physical relationship cannot be established;
• when a co-product would not be produced by the
common facility or system without the market demand
for the primary product and/or other valuable co-
products (e.g., by-catch from lobster harvesting);
• when a co-product was previously a waste output that
acquires value in the marketplace as a replacement for
another product (e.g., fly ash in cement production);
• investments, where emissions should be allocated
to the reporting company based on the reporting
company’s proportional share of equity or debt in the
investee (see section 5.5, category 15); and
• other situations where economic allocation best
reflects the causal relationship between the
production of the outputs and the resulting emissions.
In situations other than those outlined above, companies
should use economic allocation with caution, since
economic allocation may yield misleading GHG estimates,
especially when:
• prices change significantly or frequently over time;
• companies pay different prices for the same product
(due to different negotiated prices); or
• prices are not well-correlated with underlying physical
properties and GHG emissions (e.g., for luxury goods,
products with high brand value, and products whose
price reflects high research and development,
marketing, or other costs, apart from production).
Levi Strauss & Co. (LS&Co.) used multiple allocation
methods within its scope 3 inventory depending on the
types and granularity of data available.
Category 1:
Purchased goods and services (upstream)
LS&Co. collected primary data from a sample of suppliers
throughout its supply chain, including fabric mills
(facilities that create denim fabric from cotton fiber)
and garment manufactures (facilities that assemble and
finish final denim products). Allocation was necessary
because both types of suppliers provided aggregated
data at the facility level on total material use, energy use,
production throughput, and waste streams for their full
annual production. GHG emissions per product could be
reasonably allocated by dividing total facility emissions
by facility throughput, since both types of suppliers
produce relatively uniform outputs (i.e., denim products).
LS&Co. allocated emissions from the fabric mills by mass,
since mass is one of the main quantifiable determinants
of material and energy inputs during the milling process
and best reflects the causal relationship between
production and emissions. LS&Co. allocated emissions
from the garment manufacturers by the number of
products produced at a facility, since assembly and
finishing are similar across a variety of denim products
and emissions per unit are expected to be similar.
Emissions per product were multiplied by the total
number of units purchased by LS&Co. per facility to
obtain total scope 3 emissions attributable to LS&Co.
Category 9:
Downstream transportation and distribution
Distribution Centers: After production, jeans are sent to a
distribution center that packages and ships various products.
LS&Co. estimated emissions per product by collecting
primary data for total energy and materials used, allocated
by total units of product shipped during a year. This method
assumes that all units shipped result in the same emissions,
which LS&Co. considered reasonable since all products go
through the same processes at the distribution center.
Retail: Jeans are shipped from distribution centers to
retail stores. Each retail store sells a variety of products,
which requires allocating total store emissions to each
product type. LS&Co. allocated emissions according
to the retail floor space occupied by each product
compared to the entire store. LS&Co. determined the
average floor space and emissions of a retail store and
the floor area (physical space) occupied by each product
to determine emissions per individual unit from retail.
Levi Strauss & Company: Allocating scope 3 emissions

[96] Corporate Value Chain (Scope 3) Accounting and Reporting Standard
In this example, Company A produces a co-product during
the production of a primary product. Company B transports
the co-product to Company C, who consumes the co-
product in its production process. The table below explains
how each company should account for emissions from each
activity.
Box [8.5] Example of allocating emissions across a value chain
Activity How Company A accounts for emissions
How Company C accounts for emissions
Production of co-products (by Company A)
Scope: Scope 1 because the facility that produces the co-product is owned and operated by Company A
Allocation approach: No need to allocate emissions; all emissions are accounted as scope 1 because the facility is owned and operated by Company A
Scope: Scope 3, “Purchased goods and services,” because the co-product is a purchased material produced by a third party
Allocation approach: Scope 3 emissions from co-product production by Company A should be allocated using physical allocation if physical factors best reflect the causal relationship between production of the outputs and the resulting emissions and data are available on the physical quantities of outputs produced
Transportation of co-products (by Company B)
Scope: Scope 3, “Downstream transportation and distribution” because the vehicles are owned and operated by a third party and not paid for by Company A
Allocation approach: If vehicles transport multiple types of products and emissions are calculated using primary data provided by the transportation company: scope 3 emissions should be allocated to the co-product using physical allocation (mass or volume) (see section 8.4). Secondary data (based on metric ton-km traveled) may be used instead, which does not require allocation.
Scope: Scope 3, “Upstream transportation and distribution” because the vehicles are owned and operated by a third party and transporting products purchased by Company C
Allocation approach: If vehicles transport multiple types of products and emissions are calculated using primary data provided by the transportation company: scope 3 emissions should be allocated to the co-product using physical allocation (mass or volume) (see section 8.4). Secondary data (based on metric ton-km traveled) may be used instead, which does not require allocation.
company that produces co-products
Acompany that
transports co-products
Bcompany that
consumes co-products
C
co-product co-product
prim
ary
pr
oduc
t

CHAPTER 08 Allocating Emissions
[97]
Endnotes1 In this chapter, the term “system” is used to refer to any source of
emissions (e.g., an activity, vehicle, production line, business unit,
facility, etc.).
2 Product-level data refers to the cradle-to-gate GHG emissions of
an individual product, i.e., all emissions that occur in the life cycle
of purchased products, up to the point of receipt by the reporting
company (excluding emissions from sources that are owned or
controlled by the reporting company).
3 Separately sub-metering a production line allows a company
to read an energy meter first before the line starts and again
when the run of a product finishes. Sub-metering yields the
quantity of the energy used to a specific product without the
need for allocation.
4 Avoiding allocation by subdividing a process is called “process
subdivision” in the GHG Protocol Product Standard.
5 When determining the “market value,” companies should use the
selling price (i.e., the price the reporting company pays to acquire
products from the supplier), rather than the supplier’s production
cost (i.e., the costs incurred by the suppler to manufacture its
products).
Box [8.5] Example of allocating emissions across a value chain (continued)
Activity How Company A accounts for emissions
How Company C accounts for emissions
Consumption of co-products (by Company C)
Scope: Scope 3, “Processing of sold products,” because the co-product is an intermediate product sold by Company A
Scope: Scope 1 because the facility is owned and operated by Company C
Allocation approach: No need to allocate emissions; all emissions are accounted as scope 1 because the facility is owned and operated by Company C

Setting a GHG Reduction Target and Tracking Emissions Over Time09

[99]
G reenhouse gas accounting and reporting allows companies to track and report their
emissions performance over time. Companies may track scope 3 emissions in response
to a variety of business goals (see chapter 2), including demonstrating performance
toward achieving GHG reduction targets, managing risks and opportunities, and addressing
the needs of stakeholders.
This chapter is organized according to the steps a
company should follow to track scope 3 performance
over time:
• Choosing a base year and determining base year
emissions
• Setting scope 3 reduction goals
• Recalculating base year emissions (if necessary)
• Accounting for scope 3 emissions and reductions
over time
The guidance in this chapter is adapted from the GHG
Protocol Corporate Standard (chapters 5, 8, and 11).
When companies choose to track performance or set a reduction target, companies shall:
• choose a scope 3 base year and specify their reasons for choosing that particular year;
• develop a base year emissions recalculation policy that articulates the basis for any recalculations; and
• recalculate base year emissions when significant changes in the company structure or inventory methodology occur.
Requirements in this chapter
gu
id
an
ce
re
qu
ir
em
en
ts

[100] Corporate Value Chain (Scope 3) Accounting and Reporting Standard
9.1 Choosing a base year and determining base year emissions
A meaningful and consistent comparison of emissions
over time requires that companies establish a base year
against which to track performance. When companies
choose to track scope 3 performance or set a scope
3 reduction target, companies shall choose a scope 3
base year and specify their reasons for choosing that
particular year.
Companies should establish a single base year for scope 1,
scope 2, and scope 3 emissions to enable comprehensive
and consistent tracking of total corporate GHG emissions
across all three scopes. However, companies that have
already established a base year for scope 1 and scope 2
emissions may choose a more recent year for the scope
3 base year (e.g., the first year for which companies have
complete and reliable scope 3 emissions data).
The scope 3 base year does not need to be the first year
for which scope 3 emissions are reported. For example, a
company may wait until the second or third year of scope
3 reporting to set a scope 3 base year, when the scope 3
inventory is sufficiently complete and reliable. In this case,
the company is required to report the scope 3 base year
only after it has established a scope 3 base year. Until a
scope 3 base year is set, companies should report that
they have not yet established a scope 3 base year.
When a base year is chosen, companies should determine
base year emissions by following the requirements and
guidance contained in this standard.
When setting a base year, companies shall develop a base
year emissions recalculation policy (see section 9.3).
9.2 Setting scope 3 reduction targetsAny robust business strategy requires setting targets for
revenues, sales, and other core business indicators, as well
as tracking performance against those targets. Likewise, a
key component of effective GHG management is setting
a GHG target. Companies are not required to set a scope
3 reduction target, but should consider setting a target in
the context of their business goals (see chapter 2).
Companies should consider several questions when
setting a scope 3 GHG reduction target (see table 9.1).
Target boundaryCompanies may set a variety of scope 3 reduction goals,
including:
• A single target for total scope 1 + scope 2 + scope 3
emissions
• A single target for total scope 3 emissions
• Separate targets for individual scope 3 categories
• A combination of targets, for example a target for
total scope 1 + 2 + 3 emissions as well as targets for
individual scope 3 categories
Each type of target boundary has advantages and
disadvantages (see table 9.2).
Regardless of the type(s) of reduction targets set,
companies should establish a single base year for all
scope 3 categories. A single base year for all scope
3 categories simplifies scope 3 emissions tracking,
avoids “cherry picking” of base years (or the perception
thereof), and allows clearer communication of GHG
emissions to stakeholders.
Table [9.1] Considerations when setting a GHG reduction target
Issue Description
Target type Whether to set an absolute or intensity target
Target completion date The duration of the target (e.g., short term or long term target)
Target level The numerical value of the reduction target
Use of offsets or credits Whether to use offsets or credits to meet GHG reduction targets

[101]
CHAPTER 09 Setting a GHG Reduction Target and Tracking Emissions Over Time
Target typeCompanies can set either absolute targets, intensity
targets, or a combination of absolute and intensity
targets. An absolute target is expressed as a reduction
in GHG emissions to the atmosphere over time in units
of metric tons of CO2e. An intensity target is expressed
as a reduction in the ratio of GHG emissions relative to
a business metric, such as output, production, sales or
revenue. Advantages and disadvantages of each type of
target are provided in table 9.3.
To ensure transparency, companies using an intensity
target should also report the absolute emissions from
sources covered by the target. Companies may find it
most useful and credible to implement both absolute
and intensity targets. For example, companies may
establish an absolute target at the corporate level and
a combination of intensity targets at lower levels of
the company, or an absolute target for total scope 3
emissions and a combination of intensity targets for
individual scope 3 categories.
Table [9.2] Advantages and disadvantages of different target boundaries
Target boundary Advantages Disadvantages
A single target for total scope 1 + scope 2 + scope 3 emissions
• Ensures more comprehensive management of emissions across the entire value chain (i.e., all three scopes)
• Offers greater flexibility on where and how to achieve the most cost-effective GHG reductions
• Simple to communicate to stakeholders
• Does not require base year recalculation for shifting activities between scopes (e.g., outsourcing)
• May provide less transparency for each scope 3 category (if detail is not provided at the scope 3 category level)
• Requires the same base year for scope 1, scope 2, and scope 3 emissions, which may be difficult if scope 1 and scope 2 base years have already been established
A single target for total scope 3 emissions
• Ensures more comprehensive GHG management and greater flexibility on how to achieve GHG reductions across all scope 3 categories (compared to separate targets for selected scope 3 categories)
• Relatively simple to communicate to stakeholders
• May provide less transparency for each scope 3 category (if detail is not provided at the scope 3 category level)
• May require base year recalculation for shifting activities between scopes (e.g., outsourcing)
Separate targets for individual scope 3 categories
• Allows customization of targets for different scope 3 categories based on different circumstances
• Provides more transparency for each scope 3 category
• Provides additional metrics to track progress
• Does not require base year recalculations for adding additional scope 3 categories to the inventory
• Easier to track performance of specific activities
• May result in less comprehensive GHG management across the value chain (if multiple scope 3 targets are not set)
• May result in “cherry picking” (or the perception thereof) by setting targets only for categories that are easier to achieve
• More complicated to communicate to stakeholders
• May require base year recalculation for outsourcing or insourcing

[102] Corporate Value Chain (Scope 3) Accounting and Reporting Standard
Table [9.3] Comparing absolute targets and intensity targets
For more information on setting targets, see chapter 11
of the GHG Protocol Corporate Standard.
Target completion dateThe target completion date determines whether the
target is relatively short- or long-term. In general,
companies should set long-term targets (e.g., a target
period of ten years), since they facilitate long-term
planning and large capital investments with significant
GHG benefits. Companies may also set shorter-term
targets to measure progress more frequently.
Target levelThe target level represents the level of ambition of
the reduction target. To inform the numerical value of
the target, companies should examine potential GHG
reduction opportunities (see table 9.7) and estimate
their effects on total GHG emissions. In general,
companies should set an ambitious target that reduces
emissions significantly below the company’s business-
as-usual scope 3 emissions trajectory. A “stretch goal”
is expected to drive greater innovation within the
company and the value chain and be seen as most
credible by stakeholders.
Use of offsets or creditsA GHG target can be met entirely from internal reductions
at sources included in the target boundary, or can be met
through additionally using offsets that are generated
from GHG reduction projects that reduce emissions (or
enhance sinks) at sources external to the target boundary.
Companies should strive to achieve reduction targets
entirely from internal reductions from within the target
boundary. Companies that are unable to meet GHG
targets through internal reductions may use offsets
generated from sources external to the target boundary.
Companies should specify whether offsets are used
and, if so, how much of the target reduction was
achieved using offsets. Companies should report
Target type
Examples Advantages Disadvantages
Absolute target
• Reduce total scope 3 emissions by 10 percent from 2010 levels by 2015
• Reduce scope 3 emissions from the use of sold products by 20 percent from 2010 levels by 2015
• Designed to achieve a reduction in a specified quantify of GHGs emitted to the atmosphere
• Environmentally robust and more credible to stakeholders as it entails a commitment to reduce total GHGs by a specified amount
• Does not allow comparisons of GHG intensity/efficiency
• Reported reductions can result from declines in production/output rather than improvements in performance
Intensity target
• Reduce scope 3 emissions per unit of revenue by 25 percent from 2010 levels by 2015
• Improve the energy efficiency of sold products by 30 percent from 2010 levels by 2015
• Reflects GHG performance improvements independent of business growth or decline
• May increase the comparability of GHG emissions among companies
• Less environmentally robust and less credible to stakeholders because absolute emissions may rise even if intensity decreases (e.g., because output increases more than GHG intensity decreases). If a monetary metric is used, such as dollar of revenue or sales, recalculation may be necessary for changes in product prices and inflation.

[103]
CHAPTER 09 Setting a GHG Reduction Target and Tracking Emissions Over Time
internal emissions in separate accounts from offsets
used to meet the target, rather than providing a net
figure. Any purchases or sales of offsets are required
to be reported separately (see chapter 11).
Any offsets used should be based on credible
accounting standards (for more information, see
the GHG Protocol for Project Accounting). Companies
should avoid double counting of offsets by multiple
entities or in multiple GHG targets, for example
through contracts between buyers and sellers that
transfer ownership of offsets. For additional guidance
on avoiding double counting of offsets, see chapter
11 of the GHG Protocol Corporate Standard.
Companies that set a reduction target for category 11
should carefully choose the most appropriate metric
to track performance and measure progress. Category
11 includes the total expected lifetime emissions from
products sold in the reporting year. By doing so, the
scope 3 inventory accounts for a company’s total GHG
impact associated with its activities that occur in the
reporting year.
Tracking scope 3 emissions from category 11 can show
GHG reductions from efficiency improvements, but not
from durability improvements. Because the scope 3
inventory accounts for total lifetime emissions of sold
products, increasing product durability has the effect
of increasing reported scope 3 emissions from category
11. For example, a manufacturer of light bulbs may shift
from selling incandescent bulbs to selling LED bulbs. LED
bulbs are both more efficient and more durable than
incandescent bulbs. Because the increase in durability is
greater than the increase in efficiency, shifting to LED
bulbs may have the effect of increasing reported
scope 3 emissions.
In cases where product durability may change
significantly over time, companies should consider using
additional metrics to track and report emissions and
performance, such as:
• Intensity metrics (e.g., average GHG intensity of sold
products, average energy efficiency of sold products,
average emissions per hour of use, average emissions
per kilometer driven, etc.)
• Annual emissions from the use of sold products (i.e.,
emissions that occur in a single year from products sold
in the reporting year)
• GHG emissions per functional unit (see GHG Protocol
Product Standard)
• Average lifetime/durability of sold products
• Other metrics developed by the company or industry
sector
Companies that use an additional metric to track
performance are also required to report the total
expected lifetime emissions from products sold in the
reporting year in category 11. Companies should report
the methodologies and assumptions used to calculate
any additional metrics. To reduce the potential for
emissions data to be misinterpreted, companies should
also report additional information to provide context,
such as the average lifetime/durability of sold products
and a statement explaining why emissions from category
11 have increased or decreased over time.
Box [9.1] Setting a reduction target for category 11 (Use of sold products)

[104] Corporate Value Chain (Scope 3) Accounting and Reporting Standard
9.3 Recalculating base year emissionsTo consistently track scope 3 emissions over time,
companies shall recalculate base year emissions when
significant changes in company structure or inventory
methodology occur. In such cases, recalculating base year
emissions is necessary to maintain consistency and enable
meaningful comparisons of the inventory over time.
Companies are required to recalculate base year
emissions when the following changes occur and have
a significant impact on the inventory:
• Structural changes in the reporting organization, such
as mergers, acquisitions, divestments, outsourcing,
and insourcing
• Changes in calculation methodologies, improvements
in data accuracy, or discovery of significant errors
• Changes in the categories or activities included in the
scope 3 inventory
In such cases, recalculating base year emissions is
necessary to ensure the consistency and relevance of
the reported GHG emissions data. Companies shall
recalculate base year emissions for both GHG emissions
increases and decreases. Significant changes result not
only from single large changes, but also from several
small changes that are cumulatively significant. As an
alternative to recalculating base year emissions in the
event of a major structural change, companies may
reestablish the base year as a more recent year. Each type
of change is elaborated further in the sections below.
Establishing a base year recalculation policyWhen setting a base year, companies shall develop a base
year emissions recalculation policy and clearly articulate
the basis and context for any recalculations. Whether
base year emissions are recalculated depends on the
significance of the changes. A significance threshold is a
qualitative and/or quantitative criterion used to define
any significant change to the data, inventory boundaries,
methods, or any other relevant factors. For example, a
significant change could be defined as one that alters
base year emissions by at least ten percent. As part of
the base year emissions recalculation policy, companies
shall establish and disclose the significance threshold that
triggers base year emissions recalculations. Companies
shall apply the recalculation policy in a consistent manner.
Recalculations for structural changes in ownership or control Companies are required to retroactively recalculate
base year emissions when significant structural changes
occur in the reporting organization, such as mergers,
acquisitions, or divestments. Structural changes trigger
recalculation because they merely transfer emissions
from one company to another without any change in
emissions released to the atmosphere (e.g., an acquisition
or divestment only transfers existing GHG emissions from
one company’s inventory to another).
For example, if a company divests a subsidiary in the third
year of reporting, the company should recalculate its base
year emissions by removing the scope 3 emissions of the
subsidiary from the company’s base year inventory. Doing
so allows the company and its stakeholders to understand
that the apparent decrease in emissions in the third year
of reporting is a result of a structural change rather than a
change in GHG management practices.
Recalculations for outsourcing or insourcing Scope 3 emissions include outsourced activities. If a
company is reporting comprehensively on scope 1,
scope 2, and scope 3, a change in ownership or control
can have the effect of shifting emitting activities
between the scopes.
If a company outsources an in-house activity to a third
party, the activity shifts from scope 1 or scope 2 to scope
3. Conversely, a company may shift emissions from scope
3 to scope 1 or scope 2 by performing operations in-
house that were previously performed by a third party.
Whether the outsourcing or insourcing of an activity
triggers a base year emissions recalculation depends
on whether:
• the company previously reported emissions from the
activity;
• the company has a single base year or GHG target for
all scopes or separate base years and GHG targets for
each scope; and
• the outsourced or insourced activity contributes
significantly to the company’s emissions.
See table 9.4 for guidance on whether a recalculation of
base year emissions is necessary.
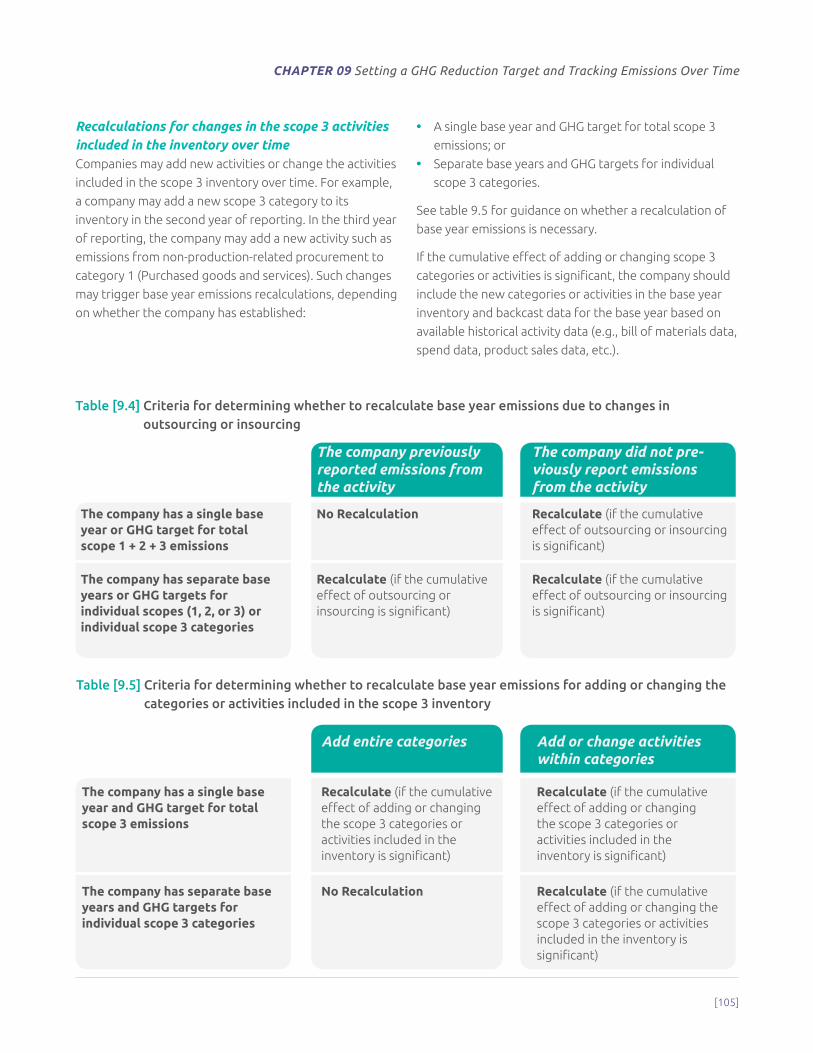
[105]
CHAPTER 09 Setting a GHG Reduction Target and Tracking Emissions Over Time
Recalculations for changes in the scope 3 activities included in the inventory over time Companies may add new activities or change the activities
included in the scope 3 inventory over time. For example,
a company may add a new scope 3 category to its
inventory in the second year of reporting. In the third year
of reporting, the company may add a new activity such as
emissions from non-production-related procurement to
category 1 (Purchased goods and services). Such changes
may trigger base year emissions recalculations, depending
on whether the company has established:
• A single base year and GHG target for total scope 3
emissions; or
• Separate base years and GHG targets for individual
scope 3 categories.
See table 9.5 for guidance on whether a recalculation of
base year emissions is necessary.
If the cumulative effect of adding or changing scope 3
categories or activities is significant, the company should
include the new categories or activities in the base year
inventory and backcast data for the base year based on
available historical activity data (e.g., bill of materials data,
spend data, product sales data, etc.).
The company previously reported emissions from the activity
The company did not pre-viously report emissions from the activity
The company has a single base year or GHG target for total scope 1 + 2 + 3 emissions
No Recalculation Recalculate (if the cumulative effect of outsourcing or insourcing is significant)
The company has separate base years or GHG targets for individual scopes (1, 2, or 3) or individual scope 3 categories
Recalculate (if the cumulative effect of outsourcing or insourcing is significant)
Recalculate (if the cumulative effect of outsourcing or insourcing is significant)
Table [9.4] Criteria for determining whether to recalculate base year emissions due to changes in outsourcing or insourcing
Table [9.5] Criteria for determining whether to recalculate base year emissions for adding or changing the categories or activities included in the scope 3 inventory
Add entire categories Add or change activities within categories
The company has a single base year and GHG target for total scope 3 emissions
Recalculate (if the cumulative effect of adding or changing the scope 3 categories or activities included in the inventory is significant)
Recalculate (if the cumulative effect of adding or changing the scope 3 categories or activities included in the inventory is significant)
The company has separate base years and GHG targets for individual scope 3 categories
No Recalculation Recalculate (if the cumulative effect of adding or changing the scope 3 categories or activities included in the inventory is significant)

[106] Corporate Value Chain (Scope 3) Accounting and Reporting Standard
Recalculations for changes in calculation methodology or improvements in data accuracy over timeA company might report the same sources of GHG
emissions as in previous years, but measure or calculate
them differently over time. For example, in its third
year of reporting scope 3 emissions, a company may
significantly improve its data quality by collecting
more data from suppliers or increasing the accuracy
and precision of emissions estimates. The company
should ensure that changes in the inventory over time
are a result of actual emissions increases or decreases,
not changes in methodology, so that the company
tracks “like with like” over time. Therefore, if changes
in methodology or data sources result in significant
differences in emissions estimates, companies are
required to recalculate base year emissions applying the
new data sources and/or methodology.
Sometimes the more accurate data input may not
reasonably be applied to all past years or new data points
may not be available for past years. The company may then
have to backcast these data points, or the change in data
source may simply be acknowledged without recalculation.
This acknowledgment should be made in the report
each year in order to enhance transparency and avoid
misinterpretation of data by users of the report.
Any changes in emission factors or activity data that
reflect real changes in emissions (i.e., changes in fuel type
or technology) do not trigger a recalculation.
No recalculation for organic growth or declineBase year emissions and any historic data are not
recalculated for organic growth and decline. Organic
growth/decline refers to increases or decreases in
production output, changes in product mix, and closures
and openings of operating units that are owned or
controlled by the company. The rationale for this is that
organic growth or decline results in a change of emissions
to the atmosphere and therefore needs to be accounted
for as an increase or decrease in the company’s emissions
profile over time.
9.4 Accounting for scope 3 emissions and reductions over time
There are two basic approaches to account for GHG
reductions (see table 9.6). This standard uses the
inventory method to account for changes in scope 3
emissions over time (see box 9.3). Reductions in corporate
emissions are calculated by comparing changes in the
company’s actual emissions inventory over time relative
to a base year. The inventory method allows companies
to track the aggregate effect of their activities on total
corporate GHG emissions over time.
Accounting for actual reductions in indirect emissions (i.e.,
scope 2 or scope 3 emissions) to the atmosphere is more
complex than accounting for actual reductions in direct
emissions (i.e., scope 1) to the atmosphere. Changes in a
company’s scope 2 or scope 3 inventory over time may not
always correspond to actual changes in GHG emissions to
the atmosphere, since there is not always a direct cause-
and-effect relationship between the reporting company’s
activities and the resulting GHG emissions. For example,
a reduction in business travel would reduce a company’s
scope 3 emissions from business travel (since the reduction
is usually quantified based on an average emission factor
of fuel use per passenger). However, how a reduction in
business travel actually translates into a change in GHG
Box [9.2] Recalculations for category 11 (Use of sold products)
Category 11 (Use of sold products) includes total
expected lifetime emissions from the use of sold
products, including emissions from future years
expected to happen but that have not yet occurred. In
certain cases, the assumptions underlying estimates
of emissions from category 11 may change after
products have been sold and emissions have been
reported (e.g., due to changes in policy, technology,
or consumer behavior that were unforeseen in the
reporting year), making previously reported emissions
estimates inaccurate. To address the inaccuracy and
enable consistent tracking of emissions over time,
companies should recalculate base year emissions for
category 11 with updated product use assumptions
when any significant changes in assumptions occur.

[107]
CHAPTER 09 Setting a GHG Reduction Target and Tracking Emissions Over Time
emissions to the atmosphere depends on several factors,
including whether another person takes the “empty seat”
or whether the unused seat contributes to reduced air
traffic over the longer term. Generally, as long as the
accounting of scope 3 emissions over time recognizes
activities that in aggregate change global emissions, any
such concerns should not inhibit companies from reporting
and tracking their scope 3 emissions over time.
Companies may use the project method to undertake
more detailed assessments of actual reductions from
discrete scope 3 GHG mitigation projects (such as those
listed in table 9.7), in addition to reporting comprehensive
scope 3 GHG emissions using the inventory method. Any
project-based reductions must be reported separately
from the company’s scope 1, scope 2, and scope 3
emissions. For more information on quantifying project-
based GHG reductions, refer to the GHG Protocol for
Project Accounting (available at www.ghgprotocol.org).
9.5 Accounting for avoided emissionsThis standard is intended to assist companies in
quantifying and reporting scope 3 reductions, where GHG
reductions are determined by comparing changes in the
company’s scope 3 emissions from the fifteen scope 3
categories over time relative to a base year. In some cases,
GHG reduction opportunities lie beyond a company’s
scope 1, scope 2, and scope 3 inventories. For example,
some companies may track not only the emissions that
arise from the use of their products (category 11), but also
the avoided emissions in society that result from the use
of their products and solutions compared to alternative
products and solutions. Avoided emissions may also arise
when accounting for emissions from recycling (category 5
or 13), or from activities in other scope 3 categories.
Accounting for avoided emissions that occur outside of
a company’s scope 1, scope 2, and scope 3 inventories
requires a project accounting methodology. Any estimates
of avoided emissions must be reported separately from a
company’s scope 1, scope 2, and scope 3 emissions, rather
than included or deducted from the scope 3 inventory.
Box 9.4 elaborates on accounting for avoided emissions
from the use of sold products.
Table [9.6] Methods for accounting for GHG reductions
Box [9.3] Quantifying changes in scope 3 emissions over time
Change in emissions from a scope 3 category =
Current year emissions from the scope 3 category - Base year emissions from the scope 3 category
Method Description Relevant GHG Protocol Publication
Inventory method Accounts for GHG reductions by comparing changes in the company’s actual emissions inventory over time relative to a base year
GHG Protocol Corporate StandardGHG Protocol Scope 3 Standard
Project method Accounts for GHG reductions by quantifying impacts from individual GHG mitigation projects relative to a baseline (i.e., a hypothetical scenario of what emissions would have been in the absence of the project)
GHG Protocol for Project Accounting

[108] Corporate Value Chain (Scope 3) Accounting and Reporting Standard
9.6 Addressing double counting of scope 3 reductions among multiple entities in a value chain
Scope 3 emissions are by definition the direct emissions
of another entity. Multiple entities in a value chain
influence both emissions and reductions, including raw
material suppliers, manufacturers, distributors, retailers,
consumers, and others. As a result, changes in emissions
are not easily attributable to any single entity.
Double counting or double claiming occurs when two
or more companies claim ownership for a single GHG
reduction within the same scope. The GHG Protocol
Corporate Standard defines scope 1 and scope 2 to ensure
that two or more companies do not account for the same
emissions within the same scope. (For more information,
see chapter 4 of the GHG Protocol Corporate Standard.)
By properly accounting for emissions as scope 1, scope
2, and scope 3, companies avoid double counting within
scope 1 and scope 2.
Double counting within scope 3 occurs when two
entities in the same value chain account for the scope 3
emissions from a single emissions source – for example, if
a manufacturer and a retailer both account for the scope 3
emissions resulting from the third-party transportation of
goods between them (see figure 9.1). This type of double
counting is an inherent part of scope 3 accounting. Each
entity in the value chain has some degree of influence over
emissions and reductions. Scope 3 accounting facilitates the
simultaneous action of multiple entities to reduce emissions
throughout society. Because of this type of double
counting, scope 3 emissions should not be aggregated
across companies to determine total emissions in a
given region. Note that while a single emission may be
accounted for by more than one company as scope 3,
in certain cases the emission is accounted for by each
company in a different scope 3 category.
Companies may find double counting within scope 3 to be
acceptable for purposes of reporting scope 3 emissions to
stakeholders, driving reductions in value chain emissions,
and tracking progress toward a scope 3 reduction target.
To ensure transparency and avoid misinterpretation of
data, companies should acknowledge any potential double
counting of reductions or credits when making claims about
scope 3 reductions. For example, a company may claim
that it is working jointly with partners to reduce emissions,
rather than taking exclusive credit for scope 3 reductions.
If GHG reductions take on a monetary value or receive
credit in a GHG reduction program, companies should
avoid double counting of credits from such reductions. To
avoid double crediting, companies should specify exclusive
ownership of reductions through contractual agreements.
9.7 Examples of actions to reduce scope 3 emissions
Companies may implement a variety of actions to reduce
scope 3 emissions. Table 9.7 provides an illustrative list of
actions that companies can take to reduce emissions in
the value chain.
for company A:
for company B:
company A: manufacturer
scope 1
1 2 3
4 5 6
7 8 9
10 11 12
13 14 15
16 17
1. wheat2. tree3. mountains4. glass bottle5. plastic bottle6. aluminium can7. factory8. lorry9. cloud10. recycling bin11. recycling bin (colours reversed)12. wind turbines13. chicken14. cow 115. cow 216. shop17. factory showing carbon emissions (carbon emissions are shown in orange)
transportation
scope 3
scope 3
company B: retailer
scope 1
Figure [9.1] Type of double counting within scope 3

[109]
CHAPTER 09 Setting a GHG Reduction Target and Tracking Emissions Over Time
To reduce scope 3 emissions from the use of sold
products (category 11), companies may implement various
GHG reduction strategies, such as redesigning products
to be more efficient in the use-phase or replacing existing
product lines with new zero-emitting product lines.
These reduction activities can be tracked by comparing a
company’s scope 3 emissions inventory over time.
A company’s products can also have broader impacts
on GHG emissions in society when they provide the
same or similar function as existing products in the
marketplace but with significantly less GHG emissions.
For example, a manufacturer of renewable energy
technologies may be interested not only in tracking
the emissions and reductions that occur during the use
of its products, but also in assessing the reduction in
society’s GHG emissions as a result of using renewable
energy technologies compared to generating electricity
by combusting fossil fuels.
Examples of such products and solutions may include:
• Wind turbines or solar panels, compared to fossil fuel
power plants
• LED bulbs, compared to incandescent bulbs
• Triple-pane windows, compared to double- or single-
pane windows
• Insulation in a building, compared to no insulation
• Online meeting software, compared to business travel
Developing new products and solutions that achieve
GHG reductions in society compared to other products
and solutions is an important component of corporate
sustainability strategies and offers significant
opportunities for achieving large scale GHG reductions.
These reductions are accounted for in scope 3 emissions
to the extent that they decrease a company’s emissions
from the use of sold products over time, for example by
redesigning products or replacing existing product lines
with new product lines.
Avoided emissions from the use of sold products
compared to a baseline are not included in a company’s
scope 3 emissions. Accounting for such reductions
requires a project-based accounting methodology (see
section 9.4) and poses several accounting challenges to
ensuring that reduction claims are accurate and credible.
Challenges include how to:
• Determine an appropriate baseline scenario (e.g., which
technologies to compare)
• Determine the system boundaries (e.g., which emissions
to include)
• Determine the time period (e.g., how many years to
include)
• Accurately quantify avoided emissions
• Avoid “cherry picking” (e.g., account for both emissions
increases and decreases across the company’s entire
product portfolio)
• Allocate reductions among multiple entities in a value
chain (e.g., avoid double counting of reductions between
producers of intermediate goods, producers of final goods,
retailers, etc.)
If a company chooses to account for avoided emissions
from the use of sold products, avoided emissions are
not included in or deducted from the scope 3 inventory,
but instead reported separately from scope 1, scope 2,
and scope 3 emissions. Companies that report avoided
emissions should also report the methodology and data
sources used to calculate avoided emissions, the system
boundaries, the time period considered, the baseline (and
baseline assumptions) used to make the comparison, as
well as a statement on completeness (avoiding “cherry
picking”) and ownership (avoiding double counting of
reductions). For more information on quantifying project-
based GHG reductions, refer to the GHG Protocol for
Project Accounting, available at www.ghgprotocol.org.
Box [9.4] Accounting for avoided emissions from the use of sold products

[110] Corporate Value Chain (Scope 3) Accounting and Reporting Standard
Table [9.7] Illustrative examples of actions to reduce scope 3 emissions
Upstream scope 3 emissions
Category Examples of actions to reduce scope 3 emissions
1. Purchased goods and services
• Replace high-GHG-emitting raw materials with low-GHG-emitting raw materials• Implement low-GHG-procurement/purchasing policies• Encourage tier 1 suppliers to engage their tier 1 suppliers (i.e., the reporting
company’s tier 2 suppliers) and disclose these scope 3 emissions to the customer in order to propagate GHG reporting throughout the supply chain
2. Capital goods • Replace high-GHG-emitting capital goods with low-GHG-emitting capital goods
3. Fuel- and energy-related activities (not included in scope 1 or scope 2)
• Reduce energy consumption• Change energy source (e.g., shift toward lower-emitting fuel/energy sources)• Generate energy on site using renewable sources
4. Upstream transportation and distribution
• Reduce distance between supplier and customer• Source materials locally if it leads to net GHG reductions• Optimize efficiency of transportation and distribution• Replace higher-emitting transportation modes (e.g. air transport) with lower-
emitting transportation modes (e.g. marine transport)• Shift toward lower-emitting fuel sources
5. Waste generated in operations
• Reduce quantity of waste generated in operations• Implement recycling measures that lead to net GHG reductions• Implement lower-emitting waste treatment methods
6. Business travel • Reduce the amount of business travel (e.g., encourage video conferencing and web-based meetings as an alternative to in-person meetings)
• Encourage more efficient travel• Encourage lower-emitting modes of travel (e.g., rail instead of plane)
7. Employee commuting
• Reduce commuting distance (e.g., locate offices/facilities near urban centers and public transit facilities)
• Create disincentives for commuting by car (e.g., parking policies)• Provide incentives for use of public transit, bicycling, carpooling, etc. • Implement teleworking/telecommuting programs• Reduce number of days worked per week (e.g., 4 days x 10 hour schedule instead
of 5 days x 8 hour schedule)
8. Upstream leased assets
• Increase energy efficiency of operations• Shift toward lower-emitting fuel sources

[111]
CHAPTER 09 Setting a GHG Reduction Target and Tracking Emissions Over Time
Table [9.7] Illustrative examples of actions to reduce scope 3 emissions
Downstream scope 3 emissions
Category Examples of actions to reduce scope 3 emissions
9. Transportation and distribution of sold products
• Reduce distance between supplier and customer• Optimize efficiency of transportation and distribution• Replace higher emitting transportation modes (e.g. air transport) with lower
emitting transportation modes (e.g. marine transport)• Shift toward lower-emitting fuel sources
10. Processing of sold products
• Improve efficiency of processing• Redesign products to reduce processing required• Use lower-GHG energy sources
11. Use of sold products
• Develop new low- or zero-emitting products• Increase the energy efficiency of energy-consuming goods or eliminate the need
for energy use• Shift away from products that contain or emit GHGs• Reduce the quantity of GHGs contained/released by products• Decrease the use-phase GHG intensity of the reporting company’s entire product
portfolio• Change the user instructions to promote efficient use of products
12. End-of-life treatment of sold products
• Make products recyclable if it leads to net GHG reductions• Implement product packaging measures that lead to net GHG reductions (e.g.,
decrease amount of packaging in sold products, develop new GHG-saving packaging materials, etc.)
• Implement recycling measures that lead to net GHG reductions
13. Downstream leased assets
• Increase energy efficiency of operations• Shift toward lower-emitting fuel sources
14. Franchises • Increase energy efficiency of operations (e.g., set efficiency standards)• Shift toward lower-emitting fuel sources
15. Investments • Invest in lower-emitting investments, technologies, and projects

Assurance10

[113]
A ssurance is the level of confidence that the inventory is complete, accurate,
consistent, transparent, relevant, and without material misstatements.1 While
assurance is not a requirement of this standard, obtaining assurance over the
scope 3 inventory is valuable for reporting companies and other stakeholders when making
decisions using the inventory results.
10.1 Benefits of assuranceAssuring scope 3 inventory results can provide a variety of
benefits, including:
• Increased senior management confidence in the
reported information on which to base reduction
targets and related decisions
• Enhanced internal accounting and reporting
practices (e.g. data collection, calculation, and internal
reporting systems), and facilitation of learning and
knowledge transfer
• Improved efficiency in subsequent inventory
update processes
• Greater stakeholder confidence in the
reported information
Carefully and comprehensively documenting the
inventory process in a data management plan is a vital
step in preparing for assurance (see Appendix C).
10.2 Relationships of parties in the assurance process
Three key parties are involved in the assurance process:
1) The reporting company seeking assurance
2) Stakeholders using the inventory report
3) The assurer(s)
When the reporting company also performs the
assurance, this is known as first party assurance. When
a party other than the reporting company performs the
assurance, this is known as third party assurance. These
types are further described in table 10.1.
Companies should choose assurers that are independent
of, and have no conflicts of interest with, the scope 3
inventory development and reporting process.
gu
id
an
ce

[114] Corporate Value Chain (Scope 3) Accounting and Reporting Standard
Both first and third party assurers should follow similar
procedures and processes. For external stakeholders,
third party assurance is likely to increase the credibility
of the GHG inventory. However, first party assurance can
also provide confidence in the reliability of the inventory
report, and it can be a worthwhile learning experience for
a company prior to commissioning third party assurance.
Inherently, assurance provided by a third party offers a
higher degree of objectivity and independence. Typical
threats to independence may include financial and other
conflicts of interest between the reporting company
and the assurer. These threats should be assessed
throughout the assurance process. Companies receiving
first party assurance should report how potential conflicts
of interest were avoided during the assurance process.
10.3 Competencies of assurersSelecting a competent assurer is important for the
assurance findings to have the credibility needed to
support the reporting company’s business goals and
stakeholder needs. A competent scope 3 GHG inventory
assurer has the following characteristics:
• Assurance expertise and experience using
assurance frameworks
• Knowledge and experience in corporate GHG
accounting and/or life cycle assessment,
including familiarity with key steps in the scope 3
inventory process
• Knowledge of the company’s activities and
industry sector
• Ability to assess emission sources and the magnitude
of potential errors, omissions, and misrepresentations
• Credibility, independence, and professional skepticism
to challenge data and information
10.4 Assurance processAssurance engagements,2 whether performed by a first
or third party, have common elements, including:
1. Planning and scoping (e.g., determining risks and
material misstatements)
2. Identifying emission sources included in the
scope 3 inventory
3. Performing the assurance process (e.g. gathering
evidence, performing analytics, etc.)
4. Evaluating results
5. Determining and reporting conclusions
The nature and extent of assurance procedures can
vary depending on whether the assurance engagement
is designed to obtain reasonable or limited assurance.
Levels of assurance: Limited and reasonable assuranceThe level of assurance refers to the degree of confidence
that stakeholders can have over the information in the
inventory report. There are two levels of assurance:
limited and reasonable. The level of assurance requested
by the reporting company will determine the rigor of the
assurance process and the amount of evidence required.
Table [10.1] Types of assurance
Type of assurance Description Independence mechanism
First party assurance Person(s) from within the reporting company but independent of the GHG inventory process conducts internal assurance
Different lines of reporting
Third party assurance Person(s) from an organization independent of the scope 3 inventory process conduct third party assurance
Different business entity from the reporting company

[115]
CHAPTER 10 Assurance
The highest level of assurance that can be provided is a
reasonable level of assurance. Absolute assurance is never
provided since 100 percent of the inputs to the GHG
inventory cannot be tested due to practical limitations.
The thoroughness with which the assurance evidence is
obtained is less rigorous in limited assurance than with
reasonable assurance. Table 10.2 provides examples
of limited and reasonable assurance opinions for an
assertion of scope 3 inventory emissions.
Timing of the assurance processThe assurance process is conducted before the public
release of the inventory report by the reporting
company. This allows for material misstatements to be
corrected prior to the release of the opinion (or revised
opinion) and assertion. The work should be initiated
far enough in advance of the inventory report release
so that the assurance work is useful in improving the
inventory when applicable. The period for assurance is
dependent on the nature and complexity of the subject
matter and the level of assurance.
10.5 Key concepts in assuranceIn the assurance field many different terms are used to
describe various assurance processes (e.g. verification,
validation, quality assurance, quality control, audit, etc.).
Though not comprehensive, table 10.3 includes many key
terms and concepts used in the assurance process that
reporting companies may encounter.
MaterialityA material misstatement occurs when individual or
aggregate errors, omissions, and misrepresentations
have a significant impact on the GHG inventory results
and could influence a user’s decisions. Materiality
has both quantitative and qualitative aspects. The
assurer and reporting company should determine an
appropriate threshold or benchmark of materiality
during the assurance process.
Quantitative materiality is typically calculated as a
percentage of the inventory (in total or on an individual
line item basis). In determining the quantitative
materiality benchmark, assurers should contemplate
the risk of a potential misstatement and the history of
previous misstatements. A materiality threshold (e.g. a
point at which a discrepancy becomes material) can be
pre-defined by the assurer. Qualitative misstatements
tend to be those that have immaterial quantitative
effects but could materially affect the reporting
company’s emissions in the future as well as those that
mislead the intended user.
Table [10.2] Limited and reasonable assurance opinions
Assurance opinion Nature of opinion Example wording of opinion
Limited assurance Negative opinion “Based on our review, we are not aware of any material modifications that should be made to the company’s assertion that their scope 3 inventory is in conformance with the requirements of the GHG Protocol Scope 3 Standard.”
Reasonable assurance Positive opinion “In our opinion the reporting company’s assertion of their scope 3 emissions by category, as reported in the inventory report, is fairly stated, in all material respects, and is in conformance with the GHG Protocol Scope 3 Standard.”

[116] Corporate Value Chain (Scope 3) Accounting and Reporting Standard
Uncertainty is a separate concept from materiality because
it is not a known error, but rather an indicator of how well
the data represents the processes in the inventory.
10.6 Preparing for assurancePreparing for assurance is a matter of ensuring that the
evidence that the assurer requires is available or easily
accessed. The type of evidence and documentation
requested by the assurer will depend on the subject
matter, the industry, and the type of assurance being
sought. Maintaining documentation of the inventory
process through the use of a data management plan
(see Appendix C) is helpful for ensuring the assurance
evidence is available.
Prior to starting the assurance process, the reporting
company should ensure that the following are prepared
and available to the assurer:
• The company’s written assertion (e.g., inventory
results)
• The complete data management plan (see Appendix C)
• Access to sufficient and appropriate evidence (e.g.
invoices, bills of sale, etc.)
Table [10.3] Key assurance concepts
Assurance concept Description
Assertion A statement by the reporting company on the company’s scope 3 emissions by category. The assertion is presented to the assurer.
Example: The reported scope 3 emissions by category are calculated in conformance with the GHG Protocol Corporate Value Chain (Scope 3) Accounting and Reporting Standard as supplemented by our company-specific policies and methodologies described in the inventory report.
Subject matter Scope 3 emissions by category and supporting information included in the inventory report. The type of assurance performed will determine which subject matter(s) should be assessed.
Criteria The benchmarks used to evaluate or measure the subject matter. Criteria include the standard’s requirements, methodological choices, data quality and uncertainty, and others determined to be suitable by the reporting company and assurer for public reporting.
Evidence Data sources and documentation used to calculate emissions and support the subject matter of the reporting company’s assertion. Evidence should be sufficient in quantity and appropriate in quality.
Assurance standards Standards, used by assurers, which set requirements on how the assurance process is performed. (For example, ISO 14064-3: Specification with Guidance for the Validation and Verification of Greenhouse Gas Assertions).
Assurance opinion The results of the assurer’s assessment of the reporting company’s assertion. In the event that the assurer determines that a conclusion cannot be expressed, the statement should cite the reason.

[117]
CHAPTER 10 Assurance
10.7 Assurance challengesThere are several challenges in assuring scope 3
inventories. Emissions calculations rely on a mixture of
data sources and assumptions. Inventory uncertainty,
including scenario uncertainty related to the use and end-
of-life treatment of sold products, may affect the quality
of the inventory. It is important to consider the state of
data collection systems and the integrity of the data and
methodological choices when performing assurance.
One of the primary challenges is that the emission
sources are removed from the reporting company’s
control, reducing the assurer’s ability to obtain
sufficient appropriate evidence.
Two approaches to addressing this diminishing control
are to:
1. Change the level of assurance, or
2. Rely on the assurance statement of another assurer
for emission and removal sources outside of the
company’s control (i.e., assurance over a supplier’s
emission sources by a different assurance firm)
10.8 Assurance statementThe assurance statement conveys the assurer’s
conclusion about the inventory results. It may take
different forms depending on whether the assurance
was performed by a first or third party. The assurance
statement should include the following:
Introduction
• A description of the reporting company
• A reference to the reporting company’s assertion
included in the inventory report
Description of Assurance Process
• The relevant competencies of the assurers
• A summary of the assurance process and work
performed
• Description of the reporting company’s and assurer’s
responsibilities
• List of the assurance criteria
• Whether the assurance was performed by a first or
third party
• The assurance standard used to perform assurance
• How any potential conflicts of interest were avoided
for first party assurance
Conclusion Paragraph
• Level of assurance achieved (limited or reasonable)
• The materiality threshold or benchmark, if set
• Any additional details regarding the assurer’s conclusion,
including details regarding any exceptions noted or
issues encountered in performing the assurance
When there are material departures in the assertion
from the assurance criteria, the reporting company
should report the effect of the departures. Companies
may report any recommendations from the assurer on
improvements in future updates of the inventory.
Endnotes1 Adapted from ISO 14064-3, “Specification with guidance for the
validation and verification of greenhouse gas assertions” (2005).
2 The process is referred to as verification in the GHG Protocol
Product Standard to distinguish it from the critical review process
that also provides assurance over product GHG inventories.
The term verification is also used in chapter 10 of the GHG
Protocol Corporate Standard.

Reporting11

[119]
A credible GHG emissions report presents information based on the principles of
relevance, accuracy, completeness, consistency, and transparency. It should be
based on the best data available and be transparent about its limitations.
11.1 Required informationCompanies shall publicly report the following
information:
• A scope 1 and scope 2 emissions report
in conformance with the GHG Protocol
Corporate Standard
• Total scope 3 emissions reported separately by
scope 3 category
• For each scope 3 category, total emissions of GHGs
(CO2, CH4, N2O, HFCs, PFCs, and SF6) reported in
metric tons of CO2 equivalent, excluding biogenic CO2
emissions and independent of any GHG trades, such as
purchases, sales, or transfers of offsets or allowances
• A list of scope 3 categories and activities included in
the inventory
• A list of scope 3 categories or activities excluded
from the inventory with justification of their exclusion
Requirements in this chapter
Companies shall publicly report the information listed in section 11.1.
• Once a base year has been established: the year
chosen as the scope 3 base year; the rationale for
choosing the base year; the base year emissions
recalculation policy; scope 3 emissions by category
in the base year, consistent with the base year
emissions recalculation policy; and appropriate
context for any significant emissions changes that
triggered base year emissions recalculations
• For each scope 3 category, any biogenic CO2 emissions
reported separately
• For each scope 3 category, a description of the types
and sources of data, including activity data, emission
factors and GWP values, used to calculate emissions,
and a description of the data quality of reported
emissions data
• For each scope 3 category, a description of the
methodologies, allocation methods, and assumptions
used to calculate scope 3 emissions
• For each scope 3 category, the percentage of
emissions calculated using data obtained from
suppliers or other value chain partners
gu
id
an
ce
re
qu
ir
em
en
ts

[120] Corporate Value Chain (Scope 3) Accounting and Reporting Standard
11.2 Optional informationA public GHG emissions report should include, when
applicable, the following additional information:
• Emissions data further subdivided where this adds
relevance and transparency (e.g., by business unit,
facility, country, source type, activity type, etc.)
• Emissions data further disaggregated within scope 3
categories where this adds relevance and transparency
(e.g., reporting by different types of purchased
materials within category 1, or different types of sold
products within category 11)
• Emissions from scope 3 activities not included in
the list of scope 3 categories (e.g., transportation of
attendees to conferences/events), reported separately
(e.g., in an “other” scope 3 category)
• Emissions of GHGs reported in metric tons of each
individual gas
• Emissions of any GHGs other than CO2, CH4, N2O, HFCs,
PFCs, and SF6 whose 100-year GWP values have been
identified by the IPCC to the extent they are emitted in the
company’s value chain (e.g., CFCs, HCFCs, NF3, NOX, etc.)
and a list of any additional GHGs included in the inventory
• Historic scope 3 emissions that have previously
occurred, reported separately from future scope
3 emissions expected to occur as a result of the
reporting company’s activities in the reporting year
(e.g., from Waste generated in operations, Use of sold
products, End-of-life treatment of sold products)
• Qualitative information about emission sources
not quantified
• Information on any GHG sequestration or removals,
reported separately from scope 1, scope 2 and
scope 3 emissions
• Information on project-based GHG reductions calculated
using the project method (e.g., using the GHG Protocol
for Project Accounting), reported separately from scope
1, scope 2, and scope 3 emissions
• Information on avoided emissions (e.g., from the use
of sold products), reported separately from scope 1,
scope 2, and scope 3 emissions
• Quantitative assessments of data quality
• Information on inventory uncertainty (e.g., information
on the causes and magnitude of uncertainties in
emission estimates) and an outline of policies in place
to improve inventory quality
• The type of assurance performed (first or third
party), the relevant competencies of the assurance
provider(s), and the opinion issued by the
assurance provider
• Relevant performance indicators and intensity ratios
• Information on the company’s GHG management
and reduction activities, including scope 3 reduction
targets, supplier engagement strategies, product GHG
reduction initiatives, etc.
• Information on supplier/partner engagement
and performance
• Information on product performance
• A description of performance measured against
internal and external benchmarks
• Information on purchases of GHG reduction
instruments, such as emissions allowances and offsets,
from outside the inventory boundary
• Information on reductions at sources inside the
inventory boundary that have been sold/transferred as
offsets to a third party
• Information on any contractual provisions addressing
GHG-related risks or obligations
• Information on the causes of emissions changes
that did not trigger a scope 3 base year emissions
recalculation
• GHG emissions data for all years between the scope 3
base year and the reporting year (including details of
and reasons for recalculations, if appropriate)
• Additional explanations to provide context to the data
11.3 Reporting guidance By following the GHG Protocol Scope 3 Standard
reporting requirements, companies adopt a
comprehensive standard with the necessary detail
and transparency for credible public reporting. The
appropriate level of reporting of optional information
categories can be determined by the objectives and
intended audience for the report. For national or
voluntary GHG programs, or for internal management
purposes, reporting requirements may vary.
For public reporting, it is important to differentiate
between a summary of a public report that is, for
example, published on the internet or in sustainability/

[121]
CHAPTER 11 Reporting
corporate social responsibility reporting and a full public
report that contains all the necessary data as specified
by this standard. Not every circulated report must
contain all information as specified by this standard,
but a link or reference needs to be made to a publicly
available full report where all information is available to
be in conformance with the Scope 3 Standard.
Companies should strive to create a report that is
as relevant, transparent, accurate, consistent and
complete as possible. Including a discussion of the
reporting company’s strategy and goals for GHG
accounting, any particular challenges or tradeoffs
encountered, the context of decisions on boundaries
and other accounting parameters, and an analysis of
emissions trends will provide a more complete picture
of the company’s inventory efforts.
Guidance is provided below for implementing selected
reporting requirements and optional information listed
in sections 11.1 and 11.2. See the relevant chapters of
this standard for guidance on implementing reporting
requirements not listed below. A sample GHG reporting
form is provided at www.ghgprotocol.org.
Required reporting: For each scope 3 category, total GHG emissions reported in metric tons of CO2 equivalent, excluding biogenic CO2 emissionsCompanies are required to include emissions of each of
the 6 required greenhouse gases (i.e., CO2, CH4, N2O, HFCs,
PFCs, and SF6) in the reported scope 3 emissions data, but
are not required to separately report scope 3 emissions
by individual gas. Companies may report aggregated
emissions in units of CO2e only.
Required reporting: For each scope 3 category, a description of the methodologies, allocation methods, and assumptions used to calculate scope 3 emissions Companies should report assumptions underlying
reported emissions for each of the 15 scope 3 categories.
For example, for category 11 (Use of sold products),
companies should report information on average use
profiles, assumed product lifetimes and other underlying
assumptions. For category 12 (End-of-life treatment
of sold products), companies should report underlying
assumptions related to product lifetimes and waste
treatment methods. Companies should also specify the
time boundary of each scope 3 category.
Optional reporting: Information on supplier/partner engagement and performanceScope 3 accounting is focused on tracking the emissions
associated with specific activities in the value chain, such
as the production of purchased products, transportation
of purchased products, and use of sold products. Because
scope 3 emissions include the scope 1 and scope 2
emissions of a company’s partners in the value chain
(including suppliers, customers, service providers, etc.),
reporting on a company’s efforts to engage their partners
in the value chain provides additional transparency on a
company’s scope 3 management and reduction activities.
A public GHG emissions report should include, when
applicable, the following additional information:
• Supplier/partner engagement metrics, such as the
number and percentage of suppliers and other
partners that have:
• Received a request from the reporting company to
provide primary GHG emissions data
• Provided primary GHG emissions data to the
reporting company
• Publicly reported entity-wide GHG emissions
• Established a publicly-available entity-wide GHG
reduction target
• Supplier/partner performance metrics, including the
GHG emissions performance of suppliers and other
partners over time
• For example, the sum of the reporting company’s
tier 1 suppliers’ scope 1 and scope 2 emissions,
allocated to the reporting company; the
methodology used to quantify and allocate supplier
emissions data; and the percentage of tier 1
suppliers accounted for (as a percentage of the
reporting company’s total spend)
• Other relevant information

[122] Corporate Value Chain (Scope 3) Accounting and Reporting Standard
Optional reporting: Information on product performanceTo provide appropriate context related to category 11
(Use of sold products), a public GHG emissions report
should include, when applicable, the following
additional information:
• Product performance indicators and intensity
metrics (e.g., average GHG intensity of sold products,
average energy efficiency of sold products, average
emissions per hour of use, average fuel efficiency
of sold vehicles, average emissions per kilometer
driven, GHG intensity of sold fuels, average emissions
per functional unit, etc.)
• Annual emissions from the use of sold products
(i.e., emissions that occur in a single year from
products sold in the reporting year)
• Average lifetime/durability of sold products
• The methodologies and assumptions used to calculate
product performance indicators and intensity metrics
• The percentage of sold products that are compliant
with standards, regulations, and certifications,
where applicable
• A statement explaining why emissions from
category 11 (Use of sold products) have increased or
decreased over time
• Any sold products not included in the inventory, with
justification for their exclusion
• Other relevant information
Optional reporting: Historic scope 3 emissions that have previously occurred, reported separately from future scope 3 emissions expected to occur as a result of the reporting company’s activities in the reporting year Emissions reported for category 5 (Waste generated
in operations), category 11 (Use of sold products), and
category 12 (End-of-life treatment of sold products)
should not be interpreted to mean that emissions have
already occurred, but rather that the reported emissions
are expected to occur as a result of activities that
occurred in the reporting year. Companies may separately
report historic emissions (that have already occurred)
from future emissions (that have not yet occurred) in
order to avoid misinterpretation by stakeholders.
Optional reporting: Information on uncertainty Companies should describe the level of uncertainty of
reported data, qualitatively or quantitatively, to ensure
transparency and avoid misinterpretation of data. In cases
where data uncertainty is high, companies should also
describe efforts to address uncertainty. See Appendix B
for more information on uncertainty.

[123]
Appendices

[124] Corporate Value Chain (Scope 3) Accounting and Reporting Standard
Appendix A. Accounting for Emissions from Leased Assets
T his appendix provides additional guidance on accounting for emissions from
leased assets.
Introduction1
Many companies either lease assets (e.g., buildings, vehicles)
to other entities or lease assets from other entities. This
appendix explains whether to account for emissions from
leased assets as scope 1 emissions, scope 2 emissions, scope
3 emissions in category 8 (Upstream leased assets), or scope
3 emissions in category 13 (Downstream leased assets).
How emissions from leased assets are accounted for in
a company’s GHG inventory depends on the company’s
selected organizational boundary approach (i.e., equity
share, financial control, or operational control), and the
type of lease.
Differentiating types of leased assets The first step in determining how to categorize emissions
from leased assets is to understand the two different
types of leases: finance or capital leases, and operating
leases. One way to determine the type of lease is to check
the company’s audited financial statements.
• Finance or capital lease: This type of lease enables
the lessee to operate an asset and also gives the lessee
all the risks and rewards of owning the asset. Assets
leased under a capital or finance lease are considered
wholly owned assets in financial accounting and are
recorded as such on the balance sheet.
• Operating lease: This type of lease enables the lessee
to operate an asset, like a building or vehicle, but
does not give the lessee any of the risks or rewards
of owning the asset. Any lease that is not a finance or
capital lease is an operating lease.2
The next step is to determine whether the emissions
associated with the leased assets are categorized as
scope 1, scope 2, or scope 3 by the reporting company.
Proper categorization of emissions from leased assets
by lessors and lessees ensures that emissions in scopes
1 and 2 are not double-counted. For example, if a
lessee categorizes emissions from the use of purchased
electricity as scope 2, the lessor categorizes the same
emissions as scope 3, and vice versa.
Table [A.1] Leasing agreements and boundaries (lessee’s perspective)
Type of leasing arrangement
Finance/capital lease Operating lease
Equity share or financial control approach used
Lessee has ownership and financial control, therefore emissions associated with fuel combustion are scope 1 and use of purchased electricity are scope 2.
Lessee does not have ownership or financial control, therefore emissions associated with fuel combustion and use of purchased electricity are scope 3 (Upstream leased assets).
Operational control approach used
Lessee has operational control, therefore emissions associated with fuel combustion are scope 1 and use of purchased electricity are scope 2.
Lessee does have operational control, therefore emissions associated with fuel combustion at sources in the leased space are scope 1 and use of purchased electricity are scope 2.3
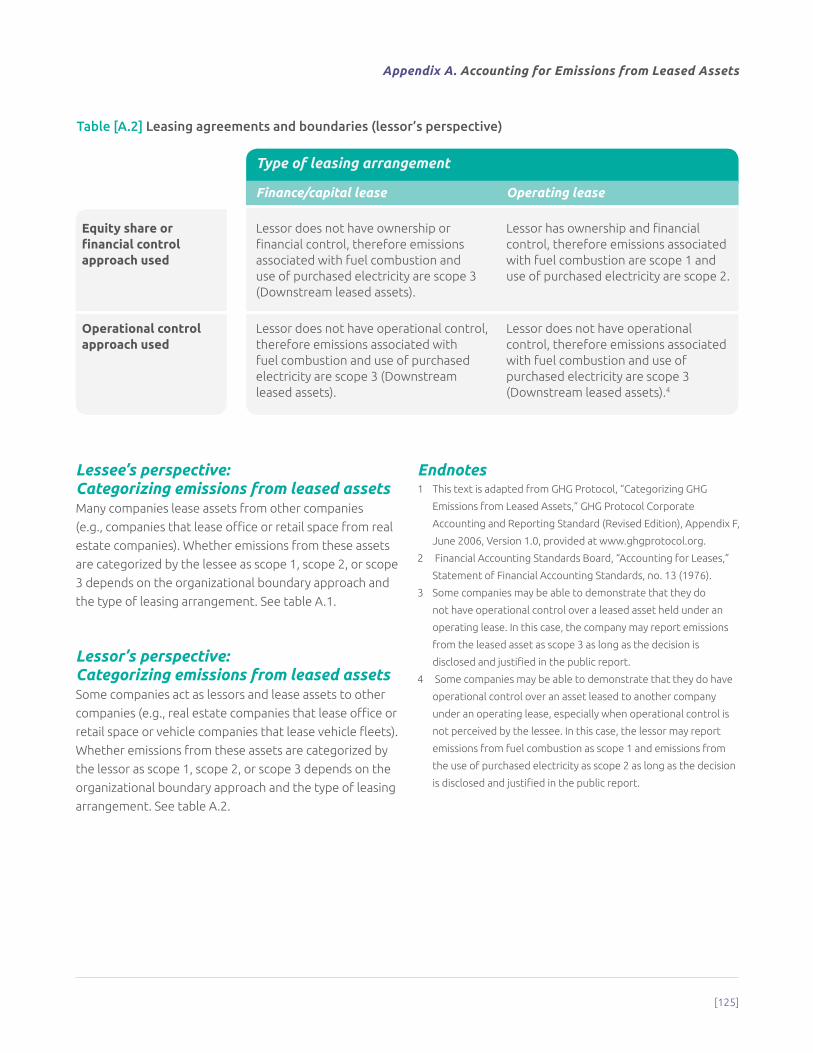
[125]
Appendix A. Accounting for Emissions from Leased Assets
Lessee’s perspective: Categorizing emissions from leased assetsMany companies lease assets from other companies
(e.g., companies that lease office or retail space from real
estate companies). Whether emissions from these assets
are categorized by the lessee as scope 1, scope 2, or scope
3 depends on the organizational boundary approach and
the type of leasing arrangement. See table A.1.
Lessor’s perspective: Categorizing emissions from leased assetsSome companies act as lessors and lease assets to other
companies (e.g., real estate companies that lease office or
retail space or vehicle companies that lease vehicle fleets).
Whether emissions from these assets are categorized by
the lessor as scope 1, scope 2, or scope 3 depends on the
organizational boundary approach and the type of leasing
arrangement. See table A.2.
Endnotes1 This text is adapted from GHG Protocol, “Categorizing GHG
Emissions from Leased Assets,” GHG Protocol Corporate
Accounting and Reporting Standard (Revised Edition), Appendix F,
June 2006, Version 1.0, provided at www.ghgprotocol.org.
2 Financial Accounting Standards Board, “Accounting for Leases,”
Statement of Financial Accounting Standards, no. 13 (1976).
3 Some companies may be able to demonstrate that they do
not have operational control over a leased asset held under an
operating lease. In this case, the company may report emissions
from the leased asset as scope 3 as long as the decision is
disclosed and justified in the public report.
4 Some companies may be able to demonstrate that they do have
operational control over an asset leased to another company
under an operating lease, especially when operational control is
not perceived by the lessee. In this case, the lessor may report
emissions from fuel combustion as scope 1 and emissions from
the use of purchased electricity as scope 2 as long as the decision
is disclosed and justified in the public report.
Table [A.2] Leasing agreements and boundaries (lessor’s perspective)
Type of leasing arrangement
Finance/capital lease Operating lease
Equity share or financial control approach used
Lessor does not have ownership or financial control, therefore emissions associated with fuel combustion and use of purchased electricity are scope 3 (Downstream leased assets).
Lessor has ownership and financial control, therefore emissions associated with fuel combustion are scope 1 and use of purchased electricity are scope 2.
Operational control approach used
Lessor does not have operational control, therefore emissions associated with fuel combustion and use of purchased electricity are scope 3 (Downstream leased assets).
Lessor does not have operational control, therefore emissions associated with fuel combustion and use of purchased electricity are scope 3 (Downstream leased assets).4

[126] Corporate Value Chain (Scope 3) Accounting and Reporting Standard
T his appendix provides an overview of concepts and procedures for evaluating sources
of uncertainty in a scope 3 inventory.
IntroductionUnderstanding uncertainty can be crucial for properly
interpreting scope 3 inventory results. The term
uncertainty assessment refers to a systematic procedure
to quantify and/or qualify the sources of uncertainty in a
scope 3 inventory. Identifying and documenting sources
of uncertainty can assist companies in understanding
the steps required to help improve the inventory quality
and increase the level of confidence users have in the
inventory results. Because the audience of a scope 3
inventory report is diverse, companies should make a
thorough yet practical effort to communicate key sources
of uncertainty in the inventory results.
Guide to the uncertainty assessment processUncertainty assessment can be used within the GHG
inventory process as a tool for guiding data quality
improvements, as well as a tool for reporting uncertainty
results. Companies should identify and track key
uncertainty sources throughout the inventory process
and iteratively check whether the confidence level of the
results is adequate for the company’s business goals.
Identifying, assessing, and managing uncertainty is most
effective when done during the inventory process.
Companies may choose a qualitative and/or quantitative
approach to uncertainty assessment. Quantitative
uncertainty assessment can provide more robust
results than a qualitative assessment and better assist
companies in prioritizing data improvement efforts
on the sources that contribute most to uncertainty.
Including quantitative uncertainty results in the inventory
report also adds clarity and transparency to users of
the inventory report. Companies should present both
qualitative and quantitative (if completed) uncertainty
information in the inventory report. Companies should
also describe their efforts to reduce uncertainty in future
revisions of the inventory.
Overview of uncertainty types Uncertainty is divided into three categories: parameter
uncertainty, scenario uncertainty and model
uncertainty. The categories are not mutually exclusive,
but they can be evaluated and reported in different
ways. Table B.1 illustrates these types of uncertainties
and corresponding sources.
Parameter uncertainty Parameter uncertainty is uncertainty regarding whether
a value used in the inventory accurately represents the
activity in the company’s value chain. If parameter
Appendix B. Uncertainty in Scope 3 Emissions
Table [B.1] Types of uncertainties and corresponding sources
Parameter Uncertainty • Direct emissions data
• Activity data
• Emission factor data
• Global warming potential (GWP) values
Scenario Uncertainty • Methodological choices
Model Uncertainty • Model limitations
Types of Uncertainty Sources

[127]
Appendix B. Uncertainty in Scope 3 Emissions
uncertainty can be determined, it can typically be
represented as a probability distribution of possible
values that include the chosen value used in the inventory
results. In assessing the uncertainty of a result, parameter
uncertainties can be propagated to provide a quantitative
measure (also as a probability distribution) of uncertainty
in the final inventory result.
Single parameter uncertaintySingle parameter uncertainty refers to incomplete
knowledge about the true value of a parameter.1
Parameter uncertainty addresses how well data used to
represent a parameter fits the activity in the company’s
value chain. Single parameter uncertainty can arise in
three data types: direct emissions data, activity data,
and emission factors. Measurement errors, inaccurate
approximation, and how the data was modeled to
fit the conditions of the activity influence parameter
uncertainty. For example, two data points of similar
measurement precision may result in very different
levels of uncertainty depending on how the points
represent the activity’s specific context (i.e. in temporal,
technological, and geographical representativeness,
and completeness terms).
E X A M P L E
An emission factor for the production of plastic used in
a toner cartridge is 4.5 kg of CO2 per kg of plastic resin
produced. The emission factor data might be based on a
limited sampling of producers of resin and may be from an
older timeframe or different geography than that in which
the current resin is produced. Therefore, there is parameter
uncertainty in the emission factor value being used.
Parameter uncertainty can be quantified based on one or
more of the following:
• Measurement uncertainty (represented by standard
deviations);
• Data quality indicators (see chapter 7);2
• Default uncertainty parameters defined for specific
activities or industry data and reported in literature
sources or elsewhere;3
• Probability distributions in databases or other data
sources for data they contain; and
• Other approaches reported by literature.
Propagated parameter uncertaintyPropagated parameter uncertainty is the combined effect
of each parameter’s uncertainty on the total inventory
result. Methods are available to propagate parameter
uncertainty from single data points. Two prominent
methods are by random sampling (such as in the Monte
Carlo method) and by analytical formulas (such as in
the Taylor Series expansion method). These methods
are described in the quantitative uncertainty guidance
available at www.ghgprotocol.org.
E X A M P L E
A company estimates total scope 3 emissions from business
travel to be 155,000 metric tons CO2e. The activity data,
emission factor data and GWP values applied in this
calculation each have a level of parameter uncertainty.
This uncertainty is determined based on the impact of all
of the single parameter uncertainties. The propagated
parameter uncertainty assessment shows that there is a
95 percent confidence that the true value of business travel
emissions is between 140,000 and 170,000 metric tons
CO2e. This can also be presented in the inventory total as
155,000 metric tons CO2e (+/-15,000 metric tons CO2e).
Box [B.1] Uncertainty of global warming potential (GWP) values
The uncertainty of the GWP values for the six main
greenhouse gases is estimated to be ± 35% for
the 90% confidence interval (5% to 95% of the
distribution). This is based on information provided
in the IPCC’s Fourth Assessment Report. The range
reflects the uncertainty in converting individual GHG
emissions into units of CO2e. Companies that choose
to quantify inventory uncertainty may include the
uncertainty of GWP values in their calculations.

[128] Corporate Value Chain (Scope 3) Accounting and Reporting Standard
Scenario uncertainty While parameter uncertainty is a measure of how close
the data used to calculate emissions are to the true
(though unknown) actual data and emissions, scenario
uncertainty refers to variation in calculated emissions
due to methodological choices. When there are multiple
methodological choices available in the standard (e.g.,
the selection of appropriate allocation methods), scenario
uncertainty is created. The use of standards results in a
reduction in scenario uncertainty by constraining choices
the user may make in their methodology. For example,
the boundary setting requirements standardize the
inventory approach for all companies.
Methodological choices may include:
• Allocation methods;
• Product use assumptions; and
• End-of-life assumptions.
To identify the influence of these selections on results,
parameters (or combinations of parameters) are varied in
an exercise known as scenario analysis. Scenario analysis is
also commonly called sensitivity analysis. Scenario analysis
can reveal differences in the inventory results due to
methodological choices.4
E X A M P L E
A company may choose to allocate facility electricity
consumption between toner production and other production
lines using physical allocation (e.g., the number of units
produced). Using this factor, 30 percent of electricity
consumption is allocated to the toner production process.
However, using economic allocation, 40 percent of electricity
consumption is allocated to the toner production process.
Model uncertainty Model uncertainty arises from limitations in the ability of
the modeling approaches used to reflect the real world.
Simplifying the real world into a numeric model always
introduces some inaccuracies. In many cases, model
uncertainties can be represented, at least in part, through
the parameter or scenario approaches described above.
However, some aspects of model uncertainty might not
be captured by those classifications and are otherwise
very difficult to quantify.
E X A M P L E
In representing the transport of materials to the site of
toner cartridge manufacture, a model is used that predicts
transport distances and modes based on known transport
networks, likely routes, and speeds of travel. The model
cannot perfectly predict the true transport logistics and
so there is uncertainty regarding the true modes and
distances that are used.
A model of soy production is involved in predicting
emissions from the production of the cartridge’s soy-
based ink. Emissions of N2O due to application of nitrogen
fertilizers are based on a linear modeling of interactions
of the fertilizer with the soil and plant systems. As these
interactions are more complicated than the model
assumes, there is uncertainty regarding the emissions
resulting from this model.
Reporting uncertaintyUncertainty can be reported in many ways, including
qualitative descriptions of uncertainty sources, and
quantitative representations, such as error bars,
histograms, probability density functions, etc. It is useful
to provide as complete a disclosure of uncertainty
information as is possible. Users of the information may
then weigh the total set of information provided in
judging their confidence in the information.
Endnotes1 Parameter refers to the value(s) assigned to activities within a
company’s value chain.
2 B.P. Weidema and M.S. Wesnaes, “Data quality management for
life cycle inventories – an example of using data quality indicators,”
Journal of Cleaner Production 4 no. 3-4 (1996): 167-174.
3 See, for example, S.M. Lloyd and R. Ries, “Characterizing,
Propagating, and Analyzing Uncertainty in Life-Cycle Assessment:
A Survey of Quantitative Approaches,” Journal of Industrial
Ecology 11 (2007): 161–179.
4 Mark A. J. Huijbregts, “Application of uncertainty and variability
in LCA. Part I: A general framework for the analysis of uncertainty
and variability in life cycle assessment,” International Journal of
Life Cycle Assessment 3 no. 5 (1998): 273 - 280.

[129]
Appendix C. Data Management Plan
A data management plan documents the GHG inventory process and the internal
quality assurance and quality control (QA/QC) procedures in place to enable the
preparation of the inventory from its inception through to final reporting. The
data management plan is a valuable tool to manage data and track progress of the inventory
over time. Companies may already have similar procedures in place for other data collection
efforts to guide their inventory process to meet the accounting requirements of the GHG
Protocol, or for ISO standards. Where possible, these processes should be aligned to reduce
data management burdens.
The data management plan can also be useful as an
assurance readiness measure as it contains much of
the data that an assurance provider needs to perform
assurance. The plan should be made available to assurance
providers (internal or external to the reporting company),
as a helpful tool to guide the assurance process.
The data management plan should be divided into two
portions, quality control (QC) and quality assurance (QA),
explained below.
Quality controlThe quality control portion of the data management
plan outlines a system of routine technical activities
to determine and control the quality of the inventory
data and the data management processes. The purpose
is to ensure that the inventory does not contain
misstatements, including identifying and reducing errors
and omissions; providing routine checks to maximize
consistency in the accounting process; and facilitating
internal and external inventory review and assurance.
Quality assuranceThe quality assurance portion of the data management
plan involves peer review and audits to assess the quality
of the inventory. Peer review involves reviewing the
documentation of the GHG accounting methodology
and results but does not rigorously review the data
used or the references. This review aims to reduce or
eliminate any inherent error or bias in the process used to
develop the inventory and assess the effectiveness of the
internal quality control procedures. The audit evaluates
whether the inventory complies with the quality control
specifications outlined in the data management plan. Peer
review and audits should be conducted by someone not
involved in the development of the product inventory.
At a minimum the data management plan should contain:
• Description of the scope 3 categories and activities
included in the inventory
• Information on the entity(ies) or person(s) responsible
for measurement and data collection procedures
• Data collection procedures
• Data sources, including activity data, emission factors
and other data, and the results of any data quality
assessment performed
• Calculation methodologies including unit conversions
and data aggregation
• Length of time the data should be archived
• Data transmission, storage and backup procedures
• All QA/QC procedures for data collection, input
and handling activities, data documentation and
emissions calculations.

[130] Corporate Value Chain (Scope 3) Accounting and Reporting Standard
The process of setting up a data management system
should involve establishing standard procedures to
address all of the data management activities, including
the quality control and quality assurance aspects of
developing an inventory.
Creating a data management planTo develop a data management plan, the following steps
should be undertaken and documented.
1. Establish a GHG accounting quality person/team. This person/team should be responsible for
implementing and maintaining the data management
plan, continually improving the quality of the
inventory, and coordinating internal data exchanges
and external interactions (such as with suppliers,
reporting programs and assurance providers).
2. Develop data management plan. The data
management plan should cover the components
outlined in the section above and in table C.1.
Documenting this information should assist with
updating the inventory, and assessing and improving
the quality of the inventory over time. Development
of the data management plan should begin before
any data is collected to ensure all relevant information
about the inventory is documented as it proceeds. The
plan should evolve over time as data collection and
processes are refined.
3. Perform generic data quality checks based on data management plan. Checks should be applied to all
aspects of the inventory process, focusing on data
quality, data handling, documentation, and calculation
procedures (see table C.2 for data control activities).
4. Perform specific data quality checks. More in-depth
checks should be made for those sources, processes
and/or activities that are significant to the inventory
and/or have high levels of uncertainty (see Appendix B
for information on assessing uncertainty).
5. Review final inventory and report. Review
procedures should be established that match the
purpose of the inventory and the type of assurance
that will be performed. Internal reviews should be
undertaken in preparation for the assurance process
by the appropriate department within a company, such
as an internal audit or accounting department.
6. Establish formal feedback loops to improve data collection, handling and documentation processes. Feedback loops can improve the quality of the
inventory over time and to correct any errors or
inconsistencies identified in the review process.
7. Establish reporting, documentation and archiving procedures. Establish record-keeping processes for
what information should be documented to support
data collection and calculation methodologies, and
how the data should be stored over time. The process
may also involve aligning or developing relevant
database systems for record keeping. Systems may
take time to develop and it is important to ensure
that all relevant information is collected prior to the
establishment of the system and then transferred to
the system once it is operational.
The data management plan is likely to be an evolving
document that is updated as data sources change,
data handling procedures are refined, calculation
methodologies improve, inventory responsibilities change
within a company, or the business objectives of the
inventory are updated.
The data management plan checklist in table C.1
outlines what components should be included in a data
management plan and can be used as a guide for creating
a plan or for pulling together existing documents to
constitute the plan.

[131]
Appendix C. Data Management Plan
Table [C.1] Data management plan checklist
Component Information Rationale
Responsibilities Name and contact details of persons responsible for:• Management of GHG inventory• Data collection for each process• Internal audit procedures• External audit procedures
• This ensures institutional knowledge is maintained and allows relevant person(s) to be identified for: • Confirming and checking information
during any internal or external audit procedures
• Producing consistent future GHG inventories
Boundary and inventory description
• Description of the boundary decision based on the GHG Protocol Corporate Standard
• Description of what scope 3 categories and activities are included in the inventory
• Description of what categories are excluded and why (as the company may begin including these, as data becomes available, for example)
• To provide internal auditors, assurance providers, and those doing future GHG inventories sufficient information on the activities and categories included in the corporate inventory.
Data summary • Data collection procedures, including data sources for each process
• Records all data sources and allows others to locate data sources (for audit and updates to inventory). Also provides information on which suppliers have been approached for data.
• Quality of data collected for each process and if and how a data quality assessment was undertaken
• Enables data quality to be tracked over time and improved
• Gap analysis identifying where better quality data is preferable and plan for how to improve that data
• Identifies where data sources should be improved over time, including those suppliers who were asked to provide data and those that were not
• Information on how data assumptions were determined, including use profiles of sold products, product lifetimes, waste treatment profiles, and other relevant assumptions
• Allows internal auditors, assurance providers, and those doing future inventories sufficient information on how assumptions were determined, and identifies how this information may be improved

[132] Corporate Value Chain (Scope 3) Accounting and Reporting Standard
Component Information Rationale
Data summary(continued)
• Information on criteria used to determine when an inventory is to be re-evaluated, including the relevant information needed to be tracked, and how this should be tracked over time.
• This allows data and information sources to be tracked and compared overtime. It may also involve identifying a system (e.g., document tracking and identification system) to ensure data and information is easily located and under what conditions this information/data was used or collected
Emissions calculations
• Calculation methodologies used (and references), as well as areas where calculation methodologies are needed for the inventory but not available
• Provides internal auditors, assurance providers, and those doing future inventories details on how emissions were calculated
• Changes in calculation methodologies over time
• Noting methodological changes should allow discrepancies between inventories to be checked and ensures that the most updated methodologies are used
Data storage procedures
• How and where data is stored • Allows information to be easily located
• Length of time data is archived • Keeps a record of how long information is stored to prevent looking for information that is no longer kept
• Backup procedures • Ensures backup procedures are implemented
QA/QC procedures
• QA/QC procedures used (see table C.2 for detailed guidance)
• Ensures that adequate processes are in place to check data collection, input and handling, data documentation, and emissions calculations
Table [C.1] Data management plan checklist (continued)
Table [C.2] Quality assurance/quality control procedures
Activity Procedure
Data collection, input and handling activities
• Transcription errors in primary and secondary data
• Check a sample of input data in each process (both direct measures and calculated estimations) for transcription errors
• Uncertainty estimates • Check that any calculated uncertainties are complete and calculated correctly

[133]
Appendix C. Data Management Plan
Table [C.2] Quality assurance/quality control procedures (continued)
Activity Procedure
Data documentation
• Transcription errors in references and storage of all references used
• Confirm bibliographical data references are properly cited• Ensure all relevant references are archived
• Storing information on data and data quality
• Check that emissions categories, boundaries, GHGs included, allocation methodologies uses, data sources and any relevant assumptions are documented and archived
• Check that all data quality indicators are described, documented and archived for each process
• Recording parameter and unit information
• Check that all units are appropriately labeled in calculation sheets• Check all units are correctly transferred through all calculations and
aggregation of emissions in all processes• Check conversion factors are correct
• Recording calculation methodologies
• Check that all calculation methodologies are documented• Check that any changes to calculation methodologies are documented
• Database/calculation sheet integrity
• Ensure all fields and their units are labeled in database/calculation sheet• Ensure database/calculation sheet is documented and the structure and
operating details of the database/calculations sheets are archived
• Review of internal documentation and archiving
• Check there is sufficient internal documentation to support the estimates and enable the reproduction of the emissions and data quality assessment, and uncertainty estimations
• Check all data, supporting data and records are archived and stored to facilitate a detailed review
• Check that the archive is securely stored
Calculating emissions and checking calculations
• Aggregation of emissions • Ensure that the aggregation of emissions from all emissions activities is correct
• Emissions trends • Where possible compare emissions from each activity to previous estimates. If significant departures, check data inputs, assumptions and calculation methodologies
• Calculation methodology(ies) • Reproduce a sample set of emissions and removals calculations to cross-check application of calculation methodologies
• Where possible, cross-check calculation methodologies used against more or less complex methodologies to ensure similar results are achieved

[134] Corporate Value Chain (Scope 3) Accounting and Reporting Standard
Abbreviations
CH4 Methane
CO2 Carbon Dioxide
CO2e Carbon Dioxide Equivalent
EEIO Environmentally-Extended Input Output
EfW Energy-from-Waste
g Grams
GHG Greenhouse Gas
GWP Global Warming Potential
HFCs Hydrofluorocarbons
IAS International Accounting Standard
IPCC Intergovernmental Panel on Climate Change
ISO International Organization for Standardization
kg Kilogram
km Kilometer
kWh Kilowatt-hour
LCA Life Cycle Assessment
LFGTE Landfill-gas-to-energy
MSW Municipal Solid Waste
MWh Megawatt-hour
NGO Non-Governmental Organization
N2O Nitrous Oxide
PFCs Perfluorocarbons
PP&E Plant, Property, and Equipment
PSEG Public Service Enterprise Group
QA Quality Assurance
QC Quality Control
SF6 Sulphur Hexafluoride
t Metric tons
T&D Transmission and Distribution
UNFCCC United Nations Framework Convention on
Climate Change
WBCSD World Business Council for Sustainable
Development
WRI World Resources Institute
WTE Waste-to-Energy

[135]
Glossary
Activity See “Scope 3 Activity”
Activity data A quantitative measure of a level of activity that results in GHG emissions. Activity data
is multiplied by an emissions factor to derive the GHG emissions associated with a
process or an operation. Examples of activity data include kilowatt-hours of electricity
used, quantity of fuel used, output of a process, hours equipment is operated, distance
traveled, and floor area of a building.
Allocation The process of partitioning GHG emissions from a single facility or other system (e.g.,
vehicle, business unit, corporation) among its various outputs.
Associate An entity in which the parent company has significant influence but neither financial
control nor joint financial control. (section 5.5, category 15 (Investments))
Assurance The level of confidence that the inventory and report are complete, accurate, consistent,
transparent, relevant, and without material misstatements.
Assurer A competent individual or body who is conducting the assurance process, whether
internally within the company or externally.
Audit trail Well organized and transparent historical records documenting how the GHG inventory
was compiled.
Baseline A hypothetical scenario for what GHG emissions would have been in the absence of a GHG
project or reduction activity. (chapter 9)
Base year A historical datum (e.g., year) against which a company’s emissions are tracked over time.
(chapter 9)
Base year emissions GHG emissions in the base year. (chapter 9)
Base year emissions Recalculation of emissions in the base year to reflect a change in the structure of the
recalculation company or a change in the accounting methodology used, to ensure data consistency
over time. (chapter 9)
Biomass Any material or fuel produced by biological processes of living organisms, including
organic non-fossil material of biological origin (e.g., plant material), biofuels (e.g., liquid
fuels produced from biomass feedstocks), biogenic gas (e.g., landfill gas), and biogenic
waste (e.g., municipal solid waste from biogenic sources).
Biogenic CO2 emissions CO2 emissions from the combustion or biodegradation of biomass.
Business travel Transportation of employees for business-related activities.
Glossary
[136] Corporate Value Chain (Scope 3) Accounting and Reporting Standard
Capital goods Final goods that have an extended life and are used by the company to manufacture a
product, provide a service, or sell, store, and deliver merchandise. In financial accounting,
capital goods are treated as fixed assets or plant, property and equipment (PP&E).
Examples of capital goods include equipment, machinery, buildings, facilities, and
vehicles.
Category See “Scope 3 category”
CO2 equivalent (CO2e) The universal unit of measurement to indicate the global warming potential (GWP) of
each greenhouse gas, expressed in terms of the GWP of one unit of carbon dioxide. It is
used to evaluate releasing (or avoiding releasing) different greenhouse gases against a
common basis.
Company The term company is used in this standard as shorthand to refer to the entity developing
a scope 3 GHG inventory, which may include any organization or institution, either
public or private, such as businesses, corporations, government agencies, non-profit
organizations, assurers and verifiers, universities, etc.
Component An intermediate product.
Consumer The end consumer or final user of a product.
Control The ability of a company to direct the policies of another operation. More specifically, it
is defined as either operational control (the organization or one of its subsidiaries has
the full authority to introduce and implement its operating policies at the operation) or
financial control (the organization has the ability to direct the financial and operating
policies of the operation with a view to gaining economic benefits from its activities).
Co-product One of multiple products produced by a facility or other system that has a market value.
(chapter 8)
Cradle-to-gate All emissions that occur in the life cycle of purchased products, up to the point of
receipt by the reporting company (excluding emissions from sources that are owned or
controlled by the reporting company).
Customer An entity that purchases or acquires the products of another entity (i.e., a supplier). A
customer may be a business customer or an end consumer.
Debt investment Investment in an entity (e.g., through loans or bonds) for a fixed period of time that
entitles the holder to repayment of the original investment (i.e., principal sum) plus
interest, but does not entitle the investor to ownership in the entity. (section 5.5,
category 15 (Investments))
Direct emissions Emissions from sources that are owned or controlled by the reporting company.

[137]
Glossary
Downstream emissions Indirect GHG emissions from sold goods and services. Downstream emissions also include
emissions from products that are distributed but not sold (i.e., without receiving payment).
Economic allocation Allocating the emissions of an activity based on the market value of each output/product.
Emission factor A factor that converts activity data into GHG emissions data (e.g., kg CO2e emitted per
liter of fuel consumed, kg CO2e emitted per kilometer traveled, etc.).
Emissions The release of greenhouse gases into the atmosphere.
Employee commuting Transportation of employees between their homes and their worksites.
Equity investment A share of equity interest in an entity. The most common form is common stock. Equity
entitles the holder to a pro rata ownership in the company. (section 5.5, category 15
(Investments))
Equity share approach A consolidation approach whereby a company accounts for GHG emissions from
operations according to its share of equity in the operation. The equity share reflects
economic interest, which is the extent of rights a company has to the risks and rewards
flowing from an operation.
Extrapolated data Data from a similar process or activity that is used as a stand-in for the given process or
activity, and has been customized to be more representative of the given process or
activity.
Final product Goods and services that are consumed by the end user in their current form, without
further processing, transformation, or inclusion in another product. Final products
include not only products consumed by end consumers, but also products consumed
by businesses in the current form (e.g., capital goods) and products sold to retailers for
resale to end consumers (e.g., consumer products).
Financial control The ability to direct the financial and operating policies of an entity with a view to gaining
economic benefits from its activities. (chapter 5)
Financial control approach A consolidation approach whereby a company accounts for 100 percent of the GHG
emissions over which it has financial control. It does not account for GHG emissions from
operations in which it owns an interest but does not have financial control. (chapter 5)
First party assurance Person(s) from within the reporting company but independent of the GHG inventory
process conducts internal assurance. (Also called “self-” or “internal-assurance.”)
Franchise A business operating under a license (granted by a franchisor) to sell or distribute the
franchisor’s goods or services within a certain location.
Franchisee An entity that operates a franchise and pays fees to a company (i.e., the franchisor) for
the license to sell or distribute the franchisor’s goods or services.

[138] Corporate Value Chain (Scope 3) Accounting and Reporting Standard
Franchisor A company that grants licenses to other entities (i.e., franchisees) to sell or distribute
its goods or services, and in return receives payments, such as royalties for the use of
trademarks and other services.
Good A tangible product.
Global warming potential A factor describing the radiative forcing impact (degree of harm to the atmosphere) of
(GWP) one unit of a given GHG relative to one unit of CO2.
Greenhouse gas inventory A quantified list of an organization’s GHG emissions and sources.
Greenhouse gases (GHG) For the purposes of this standard, GHGs are the six gases covered by the UNFCCC:
carbon dioxide (CO2); methane (CH4); nitrous oxide (N2O); hydrofluorocarbons (HFCs);
perfluorocarbons (PFCs); and sulphur hexafluoride (SF6).
Indirect emissions Emissions that are a consequence of the activities of the reporting company, but occur at
sources owned or controlled by another company.

[139]
Glossary
Intermediate product Goods that are inputs to the production of other goods or services that require further
processing, transformation, or inclusion in another product before use by the end
consumer. Intermediate products are not consumed by the end user in their current form.
Leased asset Any asset that is leased (e.g., facilities, vehicles, etc.).
Lessee An entity that has the right to use an asset through a contract with the owner of the asset
(i.e., the lessor).
Lessor An entity that owns an asset and leases it to a third party (i.e., the lessee).
Level of assurance Refers to the degree of confidence stakeholders can have over the information in the
inventory report.
Life cycle Consecutive and interlinked stages of a product system, from raw material acquisition or
generation of natural resources to end of life.
Life cycle assessment Compilation and evaluation of the inputs, outputs and the potential environmental
impacts of a product system throughout its life cycle.
Materiality Concept that individual or the aggregation of errors, omissions and misrepresentations
could affect the GHG inventory and could influence the intended users’ decisions.
Material misstatement Individual or aggregate errors, omissions and misrepresentations that significantly impact
the GHG inventory results and could influence a user’s decisions.
Non-production-related Purchased goods and services that are not integral to the company’s products, but are
procurement instead used to enable operations (also called indirect procurement).
Operational boundaries The boundaries that determine the direct and indirect emissions associated with
operations owned or controlled by the reporting company.
Operational control A consolidation approach whereby a company accounts for 100 percent of the GHG
emissions over which it has operational control. It does not account for GHG emissions
from operations in which it owns an interest but does not have operational control.
Organizational boundaries The boundaries that determine the operations owned or controlled by the reporting
company, depending on the consolidation approach taken (equity or control approach).
Outsourcing The contracting out of activities to other businesses.
Parent company An entity that has one or more subsidiaries. (section 5.5, category 15 (Investments))
Physical allocation Allocating the emissions of an activity based on an underlying physical relationship
between the multiple inputs/outputs and the quantity of emissions generated.

[140] Corporate Value Chain (Scope 3) Accounting and Reporting Standard
Primary data Data from specific activities within a company’s value chain.
Process A set of interrelated or interacting activities that transforms or transports a product.
Product Any good or service.
Production-related Purchased goods that are directly related to the production of a company’s products (also
procurement called direct procurement).
Project finance Long term financing of projects (e.g., infrastructure and industrial projects) by equity
investors (sponsors) and debt investors (financiers), based on the projected cash flows
of the project rather than the balance sheet of the sponsors/lenders. (section 5.5,
category 15 (Investments))
Proxy data Data from a similar process or activity that is used as a stand-in for the given process
or activity without being customized to be more representative of the given process
or activity.
Reporting Presenting data to internal management and external users such as regulators,
shareholders, the general public or specific stakeholder groups.
Reporting year The year for which emissions are reported.
Scope 1 emissions Emissions from operations that are owned or controlled by the reporting company.
Scope 2 emissions Emissions from the generation of purchased or acquired electricity, steam, heating or
cooling consumed by the reporting company.
Scope 3 emissions All indirect emissions (not included in scope 2) that occur in the value chain of the
reporting company, including both upstream and downstream emissions.
Scope 3 activity An individual source of emissions included in a scope 3 category.
Scope 3 category One of the 15 types of scope 3 emissions.
Secondary data Data that is not from specific activities within a company’s value chain.
Service An intangible product.
Significant influence Power to participate in the financial and operating policy decisions but not control them.
A holding of 20 percent or more of the voting power (directly or through subsidiaries)
will indicate significant influence unless it can be clearly demonstrated otherwise.
See International Accounting Standard (IAS) 28 for additional criteria for determining
significant influence. (section 5.5, category 15 (Investments))

[141]
Subsidiary An entity over which the parent company has control, including incorporated and
non-incorporated joint ventures and partnerships over which the parent company has
control. (section 5.5, category 15 (Investments))
Supplier An entity that provides or sells products to another entity (i.e., a customer).
Supply chain A network of organizations (e.g., manufacturers, wholesalers, distributors and retailers)
involved in the production, delivery, and sale of a product to the consumer.
Third party assurance Person(s) from an organization independent of the GHG inventory process conducts third
party assurance. (Also called “External assurance.”)
Tier 1 supplier A supplier that provides or sells products directly to the reporting company. A tier 1
supplier is a company with which the reporting company has a purchase order for goods
or services.
Tier 2 supplier A supplier that provides or sells products directly to the reporting company’s tier 1
supplier. A tier 2 supplier is a company with which the reporting company’s tier 1 supplier
has a purchase order for goods and services.
Uncertainty 1. Quantitative definition: Measurement that characterizes the dispersion of values that
could reasonably be attributed to a parameter. 2. Qualitative definition: A general and
imprecise term that refers to the lack of certainty in data and methodology choices, such
as the application of non-representative factors or methods, incomplete data on sources
and sinks, lack of transparency etc.
Upstream emissions Indirect GHG emissions from purchased or acquired goods and services.
Value chain In this standard, “value chain” refers to all of the upstream and downstream activities
associated with the operations of the reporting company, including the use of
sold products by consumers and the end-of-life treatment of sold products after
consumer use.
Value chain emissions Emissions from the upstream and downstream activities associated with the operations
of the reporting company.
Waste An output of a process that has no market value.

[142] Corporate Value Chain (Scope 3) Accounting and Reporting Standard
Financial Accounting Standards Board. “Accounting for
Leases.” Statement of Financial Accounting Standards,
no. 13 (1976).
Huijbregts, Mark A. J. “Application of uncertainty
and variability in LCA. Part I: A general framework for
the analysis of uncertainty and variability in life cycle
assessment.” International Journal of Life Cycle Assessment
3 no. 5 (1998): 273-280.
International Organization for Standardization (ISO). “ISO
14064-3: Specification with guidance for the validation
and verification of greenhouse gas assertions.” (2005).
IPCC. Summary for Policymakers. In Climate Change 2007:
Mitigation. Contribution of Working Group III to the Fourth
Assessment Report of the Intergovernmental Panel on
Climate Change, ed. B. Metz, O.R. Davidson, P.R. Bosch, R.
Dave, L.A. Meyer. Cambridge, United Kingdom and New
York, NY, USA: Cambridge University Press, 2007.
Lloyd, S. M. and R. Ries. “Characterizing, Propagating, and Analyzing Uncertainty in Life-Cycle Assessment: A Survey of Quantitative Approaches.” Journal of Industrial Ecology 11 (2007): 161-179.
Weidema, B.P. and M.S. Wesnaes. “Data quality
management for life cycle inventories – an example
of using data quality indicators.” Journal of Cleaner
Production 4 no. 3-4 (1996): 167-174.
WRI/WBCSD GHG Protocol. “Categorizing GHG Emissions
from Leased Assets.” GHG Protocol Corporate Accounting
and Reporting Standard (Revised Edition), Appendix F, June
2006, Version 1.0, provided at www.ghgprotocol.org.
References

[143]
Recognitions
Advisors
Fabio Peyer, Amcor Ltd.
Jannie Bell, Dell Inc.
Björn Hannappel, Deutsche Post DHL
Carina Alles, DuPont
Lisa Grice, ENVIRON International Corporation
Matthew Bateson, World Business Council for Sustainable
Development
Jennifer Morgan, World Resources Institute
Janet Ranganathan, World Resources Institute
Ranping Song, World Resources Institute
Road Testing Companies
Abengoa
Acer
Airbus
AkzoNobel
Amcor Ltd.
Autodesk, Inc.
Baosteel Group Corporation
BASF
Coca-Cola Erfrischungsgetränke AG
Danisco
Deutsche Post DHL
Deutsche Telekom AG
Ford Motor Company
IBM Corporation
IKEA
Italcementi Group
Kraft Foods
Levi Strauss & Co.
National Grid
New Belgium Brewing
Ocean Spray Cranberries, Inc.
PE INTERNATIONAL
Pfizer Inc.
Pinchin Environmental Ltd.
PricewaterhouseCoopers Hong Kong
Public Service Enterprise Group, Inc.
SAP
S.C. Johnson & Son, Inc.
Shanghai Zidan Food Packaging and Printing Co., Ltd.
Siemens AG
Suzano Pulp and Paper
United States General Services Administration
Veolia Water
Webcor Builders
Technical Working Group Members
Fiona van den Brink, AkzoNobel
Peter J. Nieuwenhuizen, AkzoNobel
Erik van Agtmaal, Altimedes Consulting
Marijn Vervoorn, Arthur D. Little
Sam Kramer, Baker & McKenzie LLP
Nicola Paczkowski, BASF SE
Marianna Pierobon, BASF
Peter Saling, BASF
George Gosieski, Business Ecosystems
Ryan Schuchard, BSR
Kathryn Thomsen, The Cadmus Group, Inc.
Andrea C. H. Smith, Carbon Disclosure Project (CDP)
Frances Way, Carbon Disclosure Project (CDP)
Christopher Weber, Carnegie Mellon University
Rosa Maria Jimenez, CESPEDES
Gemma Heddle, Chevron
Brian Glazebrook, Cisco Systems (Chair)Darrel Stickler, Cisco Systems
Renaud des Rosiers, Cleargreen Advisors
Jens Rupp, Coca-Cola Hellenic Bottling Company

[144] Corporate Value Chain (Scope 3) Accounting and Reporting Standard
S Majumdar, Confederation of Indian Industry
Rob Sinclair, Conscious Brands
Brian Bahor, Covanta Energy
Michael Van Brunt, Covanta Energy
Arthur Lee, Chevron Services Company
Jordi Avellaneda, Damco
Yasushi Iwao, Deloitte-TECO
Kenneth Stanvick, Design Chain Associates LLC
Peter Klein, EducatedChange Ltd
Laura Lundbeck, Ernst & Young
Alice Ryan, Google
Jay Celorie, HP
Jay Dietrich, IBM Corporation
Peter Clarke, ICF International
Olle Blidholm, IKEA
Xander van der Spree, IKEA
Jacob Kottackal Ninan, Independent Consultant
Enrique Ortega, Industrias Peñoles
Andrea Zomosa, Industrias Peñoles
Ted Reichelt, Intel
Chris Bayliss, International Aluminium Institute
Christine Copley, International Council on Mining and
Metals (ICMM)
Manfred Lenzen, The University of Sydney
Yoshikazu Kato, The Japan Gas Association
Jochen Harnisch, KFW Development Bank
Rohitesh Dhawan, KPMG
Marianna Herold, KPMG
Ann Smith, Landcare Research, NZ Ltd.
Fabien Bronès, Natura Cosméticos
Nathan Sandwick, Natural Resources Defense Council
Reid Miner, NCASI
Harri Artinaho, Nokia
Timo Kolemainen, Nokia
Paivi Pirhonen, Nokia
Ari Virta, Nokia
Jostein Soreide, Norsk Hydro
Stefan Seum, Öko Institut
Peter Haenke, Origin Energy
Hiroko Kamei, Osaka Gas Co., Ltd.
Tomohito Okamura, Osaka Gas Co., Ltd.
Yuichiro Yamaguchi, Osaka Gas Co., Ltd.
Hannes Partl, PE INTERNATIONAL
Johannes Partl, PE INTERNATIONAL
Michael Spielmann, PE INTERNATIONAL
Vicente Schmall, Petroleo Brasileiro S.A. – Petrobras
Mark Goedkoop, PRé Consultants
Susan Cosper, PricewaterhouseCoopers, LLP
Marne L. Doman, PricewaterhouseCoopers, LLP
Nancy Newman-Limata, PricewaterhouseCooopers, LLP
Nick Shufro, PricewaterhouseCoopers, LLP (Chair)Jon Dettling, Quantis International
Damien Friot, Quantis International
Rainer Ochsenkuehn, ROC One, LLC.
Stefan Johansson, Royal Institute of Technology,
Stockholm
Charlotta Barthelson, Saab
Mats Jacobsson, Saab
Lori Duvall, SAP
Axel Brenner, Siemens AG
Ralf Pfitzner, Siemens AG
Joe Harriman, Stantec Consulting Ltd.
Kathryn Scales, Suncor Energy
Sam Balch, UK Department of Environment Food and
Rural Affairs
Steve Leffin, United Parcel Service
Sara Hartwell, United States Environmental Protection
Agency Office of Solid Waste
Barbara J. Moser, United Technologies Corporation
Dennis Pamlin, World Wildlife Fund
Alina Racoviceanu, World Wildlife Fund Canada
Christopher Dey, The University of Sydney
Joy Murray, The University of Sydney
Karen R.H. Utt, Tennessee Valley Authority
Mark Newton, The Timberland Company
Patrick Racz, Trucost
James Salo, Trucost
Gu A’Lun, Tsinghua University
Laura Doze, Xcel Energy
Jim Turner, Xcel Energy
Technical Working Group Members (continued)

[145]
Recognitions
Contributors
Jannick Schmidt, Aalborg University
Andrés Zancada Ruiz, Abengoa
Sam Lin, Acer
Hiroo Takahashi, AGC Group
Bruno Costes, Airbus
Ashley Crepiat, Airbus
Fiona van den Brink, AkzoNobel
Peter Remco Vellinga, AkzoNobel
Julian Maruschke, Apple
Arturo Cepeda, Artequim.com Ltd.
Shuichiro Sugimoto, Asahi Glass Co., Ltd.
Ben Thompson, Autodesk, Inc.
Yinghao Liu, Baosteel Group Corporation
Tao Liu, Baosteel Group Corporation
Hongzhi Shi, Baosteel Group Corporation
Christopher Bray, Barclays Capital
Rachelle Marburg, Barclays Capital
Nicola Paczkowski, BASF
Peter Saling, BASF
Gregory LeMay, Beverage Industry Environmental
Roundtable,
Gabrielle Giner, BT plc
Annalisa Schilla, California Air Resources Board
Ian Lipton, The Carbon Accounting Company
Lois Guthrie, Carbon Disclosure Project (CDP)
James Leaton, Carbon Tracker
Patricia Ludewig, Caterpillar
Claude Loréa, CEMBUREAU
Jen McGraw, Center for Neighborhood Technology
Tommy Wiedmann, Centre for Sustainability Accounting
Meg Crawford, Ceres
Andrea Moffat, Ceres
Eliza Eubank, Citi
Corinne Reich-Weiser, Climate Earth
Peggy Foran, The Climate Registry
Christopher Gleadle, The CMG Consultancy
Harald Steinke, Coca-Cola Erfrischungsgetränke AG
Rudi Sueys, Coca-Cola Erfrischungsgetränke AG
Andrew Aulisi, Credit Suisse
Jette Hansen, Danisco
Steven Moore, Deloitte Touche Tohmatsu Limited
Björn Hannappel, Deutsche Post DHL
Klaus Hufschlag, Deutsche Post DHL
Mathis Lappenkpüper, Deutsche Post DHL
Patric Pütz, Deutsche Post DHL
Stephan Schablinski, Deutsche Post DHL
Hans-Jürgen Gerhardy, Deutsche Telekom AG
Reiner Lemke, Deutsche Telekom AG
Michael Zalan, Deutsche Telekom AG
Ivar Barlindhaug, Devoateam DaVinnci
Toshihide Maruyama, Diacel Chemical Industries, Ltd.
Dawn Rittenhouse, DuPont
Susan Veith, DuPont
Bo Weidema, Ecoinvent
Matt Molinaro, Ecolab Inc
Ali Rivers, Ecometrica
Nigel Carter, En-Venture
Mary Stewart, Energetics
Ines Sousa, ENXSUITE
Switzerland, Niels Jungbluth, ESU-services Ltd.
James Mahoney, Export-Import Bank of the U.S.
Jonathan Newton, Ford Motor Company
Monique Oxender, Ford Motor Company
Daniel Hall, Forest Ethics
Franky Mo, Gap Inc.
Angela Fisher, GE Global Research
William Flanagan, GE Global Research
Juergen Ritzek, GreenBusinessConsulting (GBC)
Terrie Boguski, Harmony Environmental, LLC
Thaddeus Owen, Herman Miller, Inc
Yoshiaki Ichikawa, Hitachi, Ltd.
Silvana Paniagua Tufinio, i4b
Hemant Bundele, ibLaunch Energy, Inc.
Thomas Schaefer, IKEA
Don Bain, Independent Consultant
Rose Nangah Mankaa, Italcementi Group
Manuela Ojan, Italcementi Group
Jeffrey Tseng, Integrated Service Technology
Tim Higgs, Intel
Milena Breisinger, Inter-American Development Bank
Shilpa Patel, International Finance Corporation
Naoki Aoki, Japan Cement Association
Yasutoshi Hattori, The Japanese Gas Association
Yoshikazu Kato, The Japan Gas Association
Kato Yoshikazu, The Japan Gas Association
Dan Pettit, Kraft Foods

[146] Corporate Value Chain (Scope 3) Accounting and Reporting Standard
John Andrews, Landcare Research, NZ Ltd
Suzie Greenhalgh, Landcare Research, NZ Ltd
Janet Kidner, Lend Lease Europe
Barruch Ben-Zekry, Levi Strauss & Co.
Steve Priddy, London School of Business & Finance
Mads Stensen, Maersk Line
Kara E Reeve, Massachusetts Institute of Technology
Kenji Shima, Mitsubishi Chemical Holdings Corporation
Nana-Ama Appiah, National Grid
Leah Fry , National Grid
Juliana Grando, National Grid
David Goldstein, Natural Resources Defense Council
Rosemary Bissett, National Australia Bank
Jenn Orgolini, New Belgium Brewing
Brad Beck, Nike
Hitoshi Morooka, Nippon Steel-Blast-Furnace
Slag Cement Co. Ltd.
Claus Frier, Novozymes A/S
Pauline Jeong, Ocean Spray Cranberries, Inc.
Narito Shibaike, Panasonic Corporation
Jonathan Sykes, Parsons Brinckerhoff
Julie Fox Gorte, PaxWorld Management LLC
Barbara Nebel, PE INTERNATIONAL
Robert ter Kuile, PepsiCo
Brian Sullivan, Pfizer Inc.
Christopher Ho, PricewaterhouseCoopers, LLP
Brigham McNaughton, PricewaterhouseCoopers, LLP
Kristine Chung, PricewaterhouseCoopers Hong Kong
Inez Ng, PricewaterhouseCoopers Hong Kong
Diederik Schowanek, Proctor & Gamble
Mark Scorsolini, Public Service Enterprise Group, Inc.
Josephine Przewodnik, Recarbon Deutschland GmbH
Hicham Elhalaby, Rogers Communications
Sandra Pocsay, SAP
Jim Sullivan, SAP
Alyssa Farrell, SAS
Daniel Lawson, S. C. Johnson & Son, Inc.
Franklyn Ericson, S. C. Johnson & Son, Inc.
Fubo Mu, Shanghai Zidan Food Packaging
and Printing Co., Ltd.
Xavier Riera-Palou, Shell
Ronald Neuhaus, Siemens AG
Zoltán Hajdu, Soltub Ltd. Hungary
Hilary Zheng, Sovereign
Seigo Ishiguro, Sumitomo Metal Industries, Ltd.
Kazuki Inatsu, Sumitomo Osaka Cement Co., Ltd.
Marina Carlini, Suzano Pulp and Paper
Samuel Kwong, Swire Beverages
Makiki Ito, Tokyo Gas Co., Ltd
Sachio Hosohara, Toray Industries, Inc.
Gordon MacLeod, Transport Scotland
James Salo, Trucost
Verena Radulovic, United States Environmental
Protection Agency
Nancy Gillis, United States General Services
Administration
Guillaume Arama, Veolia Water
Laurence Hamon, Veolia Water
David Houdusse, Veolia Water
Sandeep Mehndiratta, Verdaes
Lisbeth Dahllöf, Volvo Technology
Barbara Harrison, VT plc
Janet Godfrey, Webcor Builders
Ted Huang, Webcor Builders
Phil Williams, Webcor Builders
Edie Sonne Hall, Weyerhaeuser Company
Antonia Gawel, World Business Council for Sustainable
Development
Bernhard Gruenauer, World Business Council for
Sustainable Development
John Finisdore, World Resources Institute
Stacy Kotorac, World Resources Institute
Laura Pocknell, World Resources Institute
Samantha Putt del Pino, World Resources Institute
Mary Sotos, World Resources Institute
Jon Strahl, World Resources Institute
Shally Venugopal, World Resources Institute
Chris Daniels, Xstrata
Contributors (continued)

[147]
Recognitions
In-Kind Road Testing Support
The Carbon Trust
China National Institute of Standardization
DNV
KPMG
PE Consulting
PRé Consultants
PricewaterhouseCoopers, LLP
SGS-CSTC Standards Technical Services Co., Ltd.
SGS Hong Kong Limited
Consultants
China National Institute of Standardization
PricewaterhouseCoopers, LLP
Quantis
RESET Carbon

[148] Corporate Value Chain (Scope 3) Accounting and Reporting Standard
Copyright © World Resources Institute and World
Business Council for Sustainable Development,
September 2011
ISBN 978-1-56973-772-9
Printed in USA
Printed on Chorus Art Silk, an FSC-certified paper with
55% recycled and 30% pcw content and with inks that
are of soy content.
WRI and WBCSD would like to thank the following organizations for their generous financial support: Alcoa
Foundation, BP Foundation, Dell Inc., EMC Corporation, Intel Corporation, Kimberly Clark Corporation, PepsiCo,
PricewaterhouseCoopers, LLP, Robertson Foundation, SC Johnson & Son, Inc., Siemens, United States Agency
for International Development (USAID), United States Environmental Protection Agency (US EPA), United
Technologies Corporation, UPS Foundation, and Walmart Foundation. WBCSD, funded by its member companies,
also provided direct financial support.
Design: Alston Taggart, Studio Red Design
Cover: Futerra Sustainability Communications
FPO

[03]
Appendix
World Resources Institute (WRI)The World Resources Institute is a global environmental
think tank that goes beyond research to put ideas into
action. We work with governments, companies, and
civil society to build solutions to urgent environmental
challenges. WRI’s transformative ideas protect the earth
and promote development because sustainability is
essential to meeting human needs and fulfilling human
aspirations in the future.
WRI spurs progress by providing practical strategies
for change and effective tools to implement them.
We measure our success in the form of new policies,
products, and practices that shift the ways governments
work, companies operate, and people act.
We operate globally because today’s problems know
no boundaries. We are avid communicators because
people everywhere are inspired by ideas, empowered by
knowledge, and moved to change by greater understanding.
We provide innovative paths to a sustainable planet through
work that is accurate, fair, and independent.
WRI organizes its work around four key goals:
• People & Ecosystems: Reverse rapid degradation
of ecosystems and assure their capacity to provide
humans with needed goods and services.
• Governance: Empower people and strengthen
institutions to foster environmentally sound and
socially equitable decision-making.
• Climate Protection: Protect the global climate system
from further harm due to emissions of greenhouse
gases and help humanity and the natural world adapt
to unavoidable climate change.
• Markets & Enterprise: Harness markets and
enterprise to expand economic opportunity and
protect the environment.
In all its policy research and work with institutions,
WRI tries to build bridges between ideas and action,
meshing the insights of scientific research, economic and
institutional analyses, and practical experience with the
need for open and participatory decision-making.
World Business Council for Sustainable Development (WBCSD)The WBCSD is a CEO-led, global coalition of some
200 companies advocating for progress on sustainable
development. Its mission is to be a catalyst for
innovation and sustainable growth in a world where
resources are increasingly limited. The Council provides
a platform for companies to share experiences
and best practices on sustainable development
issues and advocate for their implementation,
working with governments, non-governmental and
intergovernmental organizations. The membership
has annual revenues of USD 7 trillion, spans more
than 35 countries and represents 20 major industrial
sectors. The Council also benefits from a network
of 60 national and regional business councils and
partner organizations, a majority of which are based in
developing countries.
DisclaimerThe GHG Protocol Corporate Value Chain (Scope 3)
Accounting and Reporting Standard, a supplement to
the GHG Protocol Corporate Accounting and Reporting
Standard, is designed to promote best practice GHG
accounting and reporting. It has been developed through
an inclusive multi-stakeholder process involving experts
from businesses, non-governmental organizations
(NGOs), governments, and others convened by the World
Resources Institute (WRI) and the World Business Council
for Sustainable Development (WBCSD). While WBCSD
and WRI encourage use of the Scope 3 Standard by all
corporations and organizations, the preparation and
publication of reports or program specifications based
fully or partially on this standard is the full responsibility
of those producing them. Neither WBCSD, WRI, nor other
individuals who contributed to this standard assume
responsibility for any consequences or damages resulting
directly or indirectly from its use in the preparation of
reports or program specifications or the use of reported
data based on the Scope 3 Standard.
Design: Alston Taggart, Studio Red Design
Cover: Futerra Sustainability Communications

The Greenhouse Gas Protocol provides the foundation for sustainable climate strategies and more efficient, resilient and profitable organizations. GHG Protocol standards are the mostwidely used accounting tools to measure, manage and report greenhouse gas emissions.
WR
I W
BC
SDwww.wri.org www.wbcsd.org www.ghgprotocol.org
Corporate Value C
hain (Scope 3) Accounting and R
eporting StandardG
HG
PR
OTO
CO
L