corporate financial structures in india · corporate financial structures in india ... \documents...
TRANSCRIPT

Loughborough UniversityInstitutional Repository
Corporate financialstructures in India
This item was submitted to Loughborough University's Institutional Repositoryby the/an author.
Additional Information:
• Economics Research Paper, no. 02-04
Metadata Record: https://dspace.lboro.ac.uk/2134/361
Please cite the published version.

Department of Economics
Economic Research Paper No. 02/4
Corporate Financial Structures in India
Christopher J. Green, Victor Murinde and Joy Suppakitjarak April 2002
Centre for International, Financial and Economics Research Department of Economics Loughborough University Loughborough Leics., LE11 3TU UK Tel: + 44 (0)1509 222734 Fax: + 44 (0) 1509 223910 Email: [email protected] Director : Dr Eric J Pentecost Deputy Director : Professor C J Green Associate Directors: Professor Kenneth J Button,George Mason University, USA Professor Peter Dawkins, University of Melbourne, Australia Professor Robert A Driskill, Vanderbilt University, USA Professor James Gaisford, University of Calgary, Canada Professor Andre van Poeck, University of Antwerp, Belgium Professor Amine Tarazi, University of Limoges, France

CORPORATE FINANCIAL STRUCTURES IN INDIA*
by
Christopher J. Green, Victor Murinde and Joy Suppakitjarak
Green: Department of Economics, Loughborough University, Murinde: Birmingham Business School, The University of Birmingham; and Institute for
Development Policy and Management, The University of Manchester. Suppakitjarak: University of Westminster
Preliminary Draft: Not for Quotation
JEL Classification: G30, G32, O16 Keywords: India, corporate finance, financial structure
ABSTRACT
In this paper, we document the financial structure of a large sample of Indian companies using a unique new company accounts dataset. The data form a panel consisting of the published accounts of more than 1000 Indian companies that reported every year during the period 1989-1999. They consist of non-financial companies; and, in a new departure within the literature, they include quoted and unquoted companies. We use this dataset to document and characterise developments in company financing in India over the last decade. We compare the sources-uses approach to analysing company financial structures with the asset and liability approach. We use both approaches to compare the financial structures of companies: over time; as between quoted and unquoted companies; and as between companies which belong to a business group and those which do not. Finally, we compare our results to those obtained previously for India and for the major industrial countries in recent studies. Overall, the paper provides a wealth of new information about corporate financial structures in the Indian economy. correspondence to: Christopher J. Green: Department of Economics, Loughborough University, Loughborough, Leicestershire, LE11 3TU, United Kingdom Tel: +44 (0)1509 222711; Fax: +44 (0)1509 223910; E-mail: [email protected] * Earlier drafts of this paper were presented at The International Conference on Finance and
Development, Evidence and Policy Issues, held in Nairobi on July 10-11, 2001, and funded by The Kenya Institute for Public Policy Research (KIPPRA) and The Department for International Development (DFID), and at The International Conference on Finance for Growth and Poverty Reduction: Experience and Policy held at Manchester University on April 10-12, 2002, and funded by DFID. We thank participants in these conferences for their useful comments. The research underlying this paper forms part of a general research programme on finance and development funded by DFID. We thank DFID for their financial support. The interpretations and conclusions expressed in this paper are entirely our own and should not be attributed in any manner to DFID.

C:\Documents and Settings\ECJB\Desktop\Website\Reasearchpapers\2002\4-02\erp02-4.doc 1
1. Introduction
In the last two decades, there has been an upsurge in research on company finance, particularly
aimed at understanding how companies finance their activities and why they finance their
activities in these specific ways. Company financing decisions involve a wide range of policy
issues. At the macro level, they have implications for capital market development, interest rate
and security price determination, and regulation. At the micro level, they have implications for
capital structure, corporate governance, and company development. Much of the research
literature has been concerned with the major OECD countries. A recent example is Corbett and
Jenkinson (1997) who studied the financing of investment in four major industrial countries.
However, there is a small but growing literature concerned with companies elsewhere: in newly
industrializing countries (NICs), developing countries (DCs), and the transition economies of
central and eastern Europe. The seminal study of company financing in NICs and DCs is that of
Singh and Hamid (1992); The work of Cornelli, Portes and Schaffer (1996) exemplifies ongoing
research concerned with the transition economies. In the last decade, most countries have
shifted their development strategies towards a greater reliance on private companies and on the
use of organized capital markets to finance these companies. This underlines the importance of
research on the functioning and financing of private companies in a wide range of institutional
environments, particularly in NICs and DCs.
In this paper, we study the financing activities of Indian quoted and unquoted companies. India
is the second most populous country in the world, more than three-quarters the size of China and
three-and-a-half times the size of the United States. The Bombay stock exchange has the
second-largest number of domestic quoted companies of any stock exchange in the world after
New York, and far more quoted companies than either London or Tokyo, for example. India
has maintained a thriving private sector from the earliest phases of industrialization but, until
recently, it has pursued development and financial policies that have emphasized the role of the
state and state planning. The Capital Issues Control Act of 1947 authorized the government to
control both the stream of new share issues and their issue price. This authority was excercised

C:\Documents and Settings\ECJB\Desktop\Website\Reasearchpapers\2002\4-02\erp02-4.doc 2
for all primary and secondary issues, both of which were invariably priced at par. Debenture
issues were regulated by (rarely-altered) ceilings on coupon rates and on term to maturity,
although these rules were evaded to some extent by deep discounting of primary issues.
Overall, the regulations provided a powerful disincentive for companies to finance their
activities through the private capital market1.
Beginning in the mid-1980s Indian markets were gradually liberalized. An important step was
the abolition in 1991 of the Industries (Development and Regulation) Act under which all new
firms and products had required a government license, a regulation which was used mainly by
existing firms to pre-empt capacity and deter entry. See Goswami (1996). During the 1990s the
pace of liberalization in the private capital markets quickened, with the repeal of the Capital
Issues Control Act and the coming into force in January 1992 of the Securities and Exchange
Board of India (SEBI) Act, which established SEBI as the principal authority governing the
stock market and a range of other corporate financial activities. See Agarwal (1996) for a
description of this act and its implications. In the same period, the Reserve Bank of India (RBI)
liberalized its credit control regime, particularly during 1992-95. Ceilings on debenture coupon
rates and other interest rates were also abolished.
The sheer size and diversity of the Indian capital market are, on their own, more than sufficient
reasons for investigating Indian company financing in depth. In addition, the liberalization of
the market offers a unique laboratory for evaluating the development of companies as
liberalization proceeds.
Singh and Hamid (1992), Singh (1995), Cobham and Subramaniam (1998), and Guha-
Khasnobis and Bhaduri (2000) have studied various aspects of Indian company finances over
the period 1980-1998, largely with a view to documenting some stylised facts about their sample
companies. Table 1 summarises the data and the sources and methods used in these studies. In
this paper we enlarge on these excercises in several ways. First, we compare more
systematically the popular sources-uses approach to analysing company financial structures with
the asset and liability approach. We argue that the sources-uses approach is less satisfactory
C:\Documents and Settings\ECJB\Desktop\Website\Reasearchpapers\2002\4-02\erp02-4.doc 3
than is generally believed. Second we utilize a substantially larger company accounts dataset.
The data form a panel consisting of the published accounts of 1022 non-financial companies that
reported every year during the eleven-year period 1989-99. Third, in a new departure within the
literature, we consider and explicitly compare quoted and unquoted companies. Quoted
companies consist of those quoted on the Mumbai stock exchange. Unquoted companies consist
of a sample that have been regularly monitored and their accounts tabulated by the Indian
Centre for Monitoring the Indian Economy (CMIE, 1997). Fourth, we compare the financial
structures of companies over time and across sectors, and examine a broader range of
characteristics than those documented by previous authors. Fifth, we compare our results to
those obtained previously for India by Singh and Hamid (1992) and by Cobham and
Subramaniam (1998); we also compare our results to those obtained for the major OECD
countries. Finally, we pay attention to important institutional features of the Indian capital
markets, particularly to the role of business groups in company financing decisions.
__________________________________________________________________________
Table 1 about here
__________________________________________________________________________
Understanding how companies finance their activities is predominantly a matter of
measurement: to document the ways in which different companies at different times and in
different institutional environments have financed their operations; and to identify possible
implications of these financing patterns. In section 2 we discuss and compare different
methodologies for summarizing and presenting the financial structure and financing decisions of
companies. In this section we argue that insufficient attention has been paid either to the
underlying purpose of descriptive comparisons or to the underpinnings of such comparisons
which come from capital structure theory. In section 3 we discuss the data sources for our
study; and consider the issues involved in comparisons which utilize Indian company accounts.
Section 4 presents summary statistics describing various aspects of Indian company balance
sheets and flows. In these descriptions we explain how the financial structure of Indian
companies has changed over time, distinguishing carefully between quoted and unquoted

C:\Documents and Settings\ECJB\Desktop\Website\Reasearchpapers\2002\4-02\erp02-4.doc 4
companies and between those that belong to a business group and those that do not. A final
section 5 contains some concluding remarks.
2. Methodology: Measuring financial structure
The measurement of company financial structure has been subject to considerable debate, in
which there are two interlinked strands. The first question concerns the source of data: whether
to use the aggregate company sector statistics that form the basis of the national accounts, or
individual company accounts data from company reports. The second question is conceptual:
whether to use balance sheets (stocks of assets and liabilities) or flows of funds (sources and
uses, or cash flows) to measure financing. Within this second question, there are further issues:
particularly whether to use market values or book values in calculating balance sheet data; and
whether and how to use gross or net sources and uses if flows of funds are the chosen basis of
measurement. In deciding these questions, the central issue is to determine the purposes for
which the data are to be used. This point has not always been addressed in the literature on this
debate, and this has resulted in some confusion in deciding which methods are the most
appropriate. In the following discussion, we address these issues in general terms and more
specifically in the context of India.
The question of which data source to use is not entirely separable from the conceptual issue of
whether to use stocks or flows. Aggregate balance sheet data are typically available at lower
frequencies (if at all) than are aggregate flow of funds data, and are mostly thought to be less
reliable. For India, there are no overall national balance sheet data, although the RBI does
periodically publish annual balance sheet data for some 800 large companies, based mainly on
an aggregation of the accounts of the individual companies. See Reserve Bank of India (1999).
National accounts sector sources and uses statements are generally available for the major
industrial countries but, as Green, Murinde, Suppakitjarak and Moore (2000) observe, India is
the only non-industrialized country that has well-established data of this kind, and these are
available only with a substantial lag2. At the company level, balance sheets are typically
required by law and are available in almost all countries for as long as limited companies have

C:\Documents and Settings\ECJB\Desktop\Website\Reasearchpapers\2002\4-02\erp02-4.doc 5
been in existence. Sources and uses statements are derived by differencing successive balance
sheets and making adjustments for changes in stock valuations. However, such valuation
adjustments are rarely altogether reliable, and are often not made at all. Cash flow statements
are of more recent origin and arguably of yet more variable quality. India introduced a
requirement for quoted companies to produce a cash flow statement with effect from the
1995/96 acounting year, but the requirement and corresponding standard are not mandatory for
unquoted companies. See Price Waterhouse (1996) and Institute of Chartered Accountants of
India (2000, hereafter: ICAI). Other developing countries do not have such a requirement.
It is generally believed that company accounts data are less useful than aggregate data for
making international comparisons, because of the variations which exist among national
accounting standards. This suggests that aggregate flow of funds statistics are the most
appropriate data for describing and making international comparisons of company financing
decisions. See in particular Mayer (1988, 1990), Corbett and Jenkinson (1997), and Cobham
and Subramaniam (1998). Such data are particularly useful for identifying the financial
counterparts of company fixed investment which is one of the main objects of interest in
studying company financial decisions. Singh and Hamid (1992) use flow data based on
company accounts and their methodology is often compared to that of Mayer (1988). See for
example Cobham and Subramaniam (1998). However, Singh and Hamid's data are constructed
by first-differencing company balance sheets without a valuation adjustment, and can therefore
equally well be interpreted as stock-based data. Singh (1998) provides a defence of his general
approach against Cobham and Subramaniam's criticisms .
However, we would argue that national accounts data are not necessarily more internationally
comparable than are company accounts. To be sure, national accounts are compiled to common
standards, set out in the UN System of National Accounts (SNA, 1993). But there remain
substantial differences in detail among individual countries and, for most developing countries,
the flow of funds formats of the SNA remain largely a wish list. See Green, Murinde,
Suppakitjarak, and Moore (2000). Moreover, the compilation of national accounts rests on
national data sources and adherence to international standards in practise depends on the

C:\Documents and Settings\ECJB\Desktop\Website\Reasearchpapers\2002\4-02\erp02-4.doc 6
reliability and comparability of the underlying national sources. For the company sector, these
consist almost entirely of sample survey data, based on companies' tax returns and their
published accounts. Contrary to the argument of Corbett and Jenkinson (1997), the sample sizes
which are used in the calculation of national accounts are not necessarily larger than samples
which can be constructed from published company accounts data available from commercial
information services.
Moreover, the compilation of aggregate sources-uses data requires basic adjustments for
variations in the accounting and tax years of individual reporting companies. In general,
variations in national accounting standards will be reflected directly in the data reported to and
compiled by national statistical offices. In the major industrial countries, certain basic
adjustments can usually be made to reported data at the national level; for example, reported
profits may be adjusted for depreciation to obtain sources-uses accounts. The situation for
developing countries is more problematic. Singh and Hamid (1992) report that depreciation was
not available for most companies in their sample of company accounts from nine developing
countries. More subtle differences in standards cannot be picked up at all, either at the company
level or at the national level. In the case of India for example, FIFO inventory accounting is
required, whereas international standards permit either LIFO or FIFO, subject to certain
conditions. Brainard, Shoven and Weiss (1980) discuss the difficulties involved in correctly
adjusting published company accounts for differences in inventory valuation procedures. At the
aggregate level, such adjustments are practically impossible. A second difference between
Indian standards and international standards is in the manner in which recognition of revenue is
defined. In some respects, the Indian standards could be said to be more stringent than
international standards, but it is difficult to estimate the effect of such differences in practise.
See Price Waterhouse (1996) and ICAI (2000). All these differences will be reflected in
different national statistics to an unknown degree. In our view therefore there is no presumption
that aggregate national accounts statistics are more reliable for international comparisons than
statistics based directly on company accounts; and in this study, we do utilitize company
accounts data.

C:\Documents and Settings\ECJB\Desktop\Website\Reasearchpapers\2002\4-02\erp02-4.doc 7
Whichever data source is used, there remains the question of whether to use flows or stocks and
whether to use net or gross figures for certain items. The main methodologies that have been
used to summarise corporate financial structures are given in stylised form in table 2 (sources
and uses) and 3 (assets and liabilities). We begin with the methods that are based on flow data,
the simplest of which is Corbett-Jenkinson. This approach has as its main goal the identification
of gross investment (including inventories) and its financing3. Total uses of funds are defined to
be equal to gross investment, with other uses of funds being netted off against matching sources.
The Singh-Hamid approach focusses instead on net acquisitions of assets, including long-term
financial assets, with depreciation being interpreted as a use rather than as a source of funds.
Singh (1998) argued that this treatment of depreciation is more appropriate if the objective is to
study the financing of the growth in net assets rather than the financing of gross investment4.
Since depreciation is the main difference between gross and net acquisitions of assets, this is
almost a truism. However, it could be argued that the Singh-Hamid approach, allowing as it
does for the replenishment of existing capital, arrives at a concept for total uses which is closer
to Hicksian income5 than is gross investment. Indeed, Edwards, Kay and Mayer (1987) have
argued that the accounting rate of return, including the deduction of appropriately defined
depreciation, corresponds to an economically meaningful definition of profit. These
considerations suggest that the Singh-Hamid approach is no worse than and probably preferable
to that of Corbett-Jenkinson. Cobham and Subramaniam (1998) identify a third approach which
is similar to Corbett-Jenkinson in its treatment of depreciation but which uses gross rather than
net sources and uses. Cobham and Subramaniam argue that this third approach is more
vulnerable to international differences in reporting. Items which are classified as "gross" in the
aggregate flow of funds often include components which are in fact only available on a net basis
at the level of the reporting institution.
__________________________________________________________________________
Tables 2 and 3 about here
__________________________________________________________________________

C:\Documents and Settings\ECJB\Desktop\Website\Reasearchpapers\2002\4-02\erp02-4.doc 8
A more fundamental difficulty with the Corbett-Jenkinson approach was identified by Hackethal
and Schmidt (1999) who argued that aggregate flow of funds data do not give a meaningful
picture of company financing patterns because of the netting out of sales and purchases within a
particular asset category which is inherent in most national aggregate flow of funds accounts6.
Corbett-Jenkinson's results suggest that a high proportion of fixed business investment in the
main industrial countries is internally financed, and this is generally accepted as a stylised fact
of international corporate finance. See Prasad, Green and Murinde (2001). However,
Hackethal-Schmidt give an example in which all firms in a small model economy finance 70%
of their investment externally through bank loans but, because of the pattern of borrowing and
subsequent loan repayments by individual firms, the net flow calculations performed by Corbett-
Jenkinson appear to show that almost 100% of aggregate investment is financed internally! This
argument suggests that simple calculations of net financing ratios may be seriously misleading
in the information they provide about firm financing. As Hackethal-Schmidt point out, Corbett-
Jenkinson's method provides information about how the corporate sector as a whole is financed
but, contrary to what is commonly assumed, this information cannot be used to make inferences
about how individual firms finance their activities. Hackethal-Schmidt advocate estimating
gross flows from aggregate flow of funds data by making assumptions about average debt
maturity and the pattern of loan repayments, and then calculating the proportion of gross
investment financed by gross inflows of external funds. When this is done for Germany, the
USA and Japan, the contribution of external finance to gross investment rises dramatically, and
the relative importance of external finance among the three countries changes. The problem
with this approach is that it is entirely predictable that gross flows make an arithmetically larger
contribution to gross investment than do net flows, and the assumptions needed to derive gross
figures using aggregate data necessarily border on the heroic. These arguments reinforce our
reservations about using aggregate data.
If aggregate sources-uses data are potentially misleading, it is natural to consider disaggregation.
However, at the company level, the denominators required to calculate the relevant financing
ratios are not guaranteed to be non-negative7, and the calculated ratios may therefore be

C:\Documents and Settings\ECJB\Desktop\Website\Reasearchpapers\2002\4-02\erp02-4.doc 9
meaningless. Thus, a further disadvantage of the sources-uses approach is that it cannot readily
be applied to disaggregated data
We turn next to stock data (table 3). Given the relative paucity of such data at the national level,
calculations of company financing which are based on stocks must utilize company accounts if
international comparisons are to be made. McClure, Clayton and Hofler (MCH, 1999) utilize
the Worldscope/Global database and argue that Worldscope makes these data sufficiently
consistent across the G7 countries as to require no further adjustment for international
accounting differences. A more realistic approach is taken by Rajan and Zingales (1995) who
utilize the Global Vantage database and suggest several different methods of presenting these
data, in an effort to make them more internationally comparable.
Although it is simplistic to attempt a direct comparison between sources-uses and balance sheet
data, nevertheless the three methods shown in table 3 correspond quite closely to those in table
2. The adjusted net assets method corresponds to the Corbett-Jenkinson method, apart from the
inclusion of equity investments and other net current assets in total net assets. Likewise, there
are similarities in approach as between the net assets method and that of Singh-Hamid. There
are two major differences in practise between balance sheet and sources-uses data. First,
balance sheets include several items, such as intangibles, which do not appear in the usual
sources-uses statement. While intangibles are not directly associated with any cash expenses,
they are indirectly related to cash costs and to real financing decisions taken by individual firms,
such as the goodwill associated with a takeover. The second major difference arises because the
balance sheet embodies the company's entire financial history including the impact of financing
decisions, asset price changes, depreciation, and sales as well as purchases of fixed assets.
Therefore, it is difficult to use balance sheets to identify changes in financing patterns as they
actually take place. In contrast, sources-uses statements do show directly the counterparts to
expenditures as they were incurred, subject always to the accounting rules used to recognise
expenses.

C:\Documents and Settings\ECJB\Desktop\Website\Reasearchpapers\2002\4-02\erp02-4.doc 10
The appropriate framework for analysis of company financing depends critically on the purpose
of the analysis. Consider first the difference between aggregate data and company accounts.
Aggregate data can only provide information about the company sector as a whole. The number
and identity of companies in the sector are changing over time. Aggregate data cannot provide
precise information about individual company behaviour, especially about how companies
develop over time. This is particularly true where companies have large international operations
presented in consolidated accounts. In principle, aggregate national data include only the local
part of companies' operations. This suggests that for many purposes company accounts data are
more useful. One of the concerns of the present research is in the development of Indian
companies over time. For this reason too we prefer to use company accounts.
Turning next to balance sheets versus sources-uses, suppose that companies have an optimal
capital structure (which may be conditioned on internal and external variables) to which they
adjust over time. If so, the argument that flows provide direct information about the financing
of current expenses is illusory because current flows will include a mixture of current financing
decisions and stock adjustments. Of course, it is debatable whether companies do have an
optimal capital structure. See Harris and Raviv (1991) and Prasad, Green and Murinde (2001).
The Pecking Order hypothesis of Myers (1984) and Myers and Majluf (1984), would suggest
that firms finance their investments using a hierarchy of sources. This might suggest that
sources-uses data are more informative than balance sheet data. However, pecking order theory
is silent on whether firms reorient their pre-existing financial structure in the event of a change
in circumstances leading to a move along the pecking order for new investments. If this does
happen, then balance sheet data will be at least as useful as sources-uses data in understanding
company financial structures.
Overall therefore, we do not share the enthusiasm of several recent authors for aggregate flow of
funds data, and we believe that as much and more can be learnt from company accounts and
from balance sheets. Accordingly, our data is derived mainly from company accounts, and our
analysis focusses particularly on balance sheets. However, for purposes of comparison, we do
also provide some results of analysing company sources-uses statements8.

C:\Documents and Settings\ECJB\Desktop\Website\Reasearchpapers\2002\4-02\erp02-4.doc 11
3. Data
The basic source of our data is the Prowess database collected by the CMIE (1997). Prowess
contains data on more than 8000 Indian companies, mostly dating from 1989. These data
consist of company accounts and related information including inter alia plant location, credit-
rating and registration data, and daily share market information. The companies covered include
quoted and unquoted, foreign-owned and domestic, and financial and non-financial. A summary
of the broad composition of the whole Prowess database is contained in table 49. As is to be
expected, the largest group of companies is the quoted non-financial group. Although unquoted
companies account for about 40% of the database, there is a larger turnover among these
companies, both through births and deaths, and through variations in the timeliness with which
their accounts are reported. An important factor in India is the existence of numerous business
groups: groups of companies within which effective control is excercised by the same insider
group of shareholders. More than one-quarter of the quoted companies in the database fall
within a business group. The proportion of unquoted companies within a business group is
higher still, although this could be because reporting standards are higher within a group than
within comparable stand-alone companies. Business groups in India are of long-standing
existence and have generally followed the same conglomerate structure as business houses in
other Asian countries. However, Indian business groups vary considerably in size: from the
Tata and Birla groups with assets of over Rs100bn, to groups which consist of just a few small
companies. In the last decade, the character and identity of many business groups have changed
substantially, following the liberalization of the capital markets in the early part of the decade.
In 1991, 22 out of the top 50 companies by stock market capitalization were controlled by long-
established family groups; by 2000, this figure had fallen to just 410. On most measures, the
Tata and Birla groups have been the two largest business houses for more than 45 years, and
they trace their origins to the early years of the 20th century; but the Reliance group, which
ranked as the third largest business house by market capitalization in 2000, did not exist at all 25
years ago.

C:\Documents and Settings\ECJB\Desktop\Website\Reasearchpapers\2002\4-02\erp02-4.doc 12
__________________________________________________________________________
Table 4 about here
__________________________________________________________________________
We began by filtering the data in Prowess to identify a usable sample of companies. We
concentrated on Indian non-financial companies, both quoted and unquoted. Thus, our data
exclude foreign companies and all financial companies. The advantage of Prowess is that the
data are organized in a broadly standardized format. The original data and the Prowess data
both adhere to Indian accounting standards and no attempt has been made to correct for inter-
firm variations in the application of these standards. Balance sheet data are reported at book
value in the accounts, and it can be argued that market value data provide a more appropriate
standard of comparison. See Rajan and Zingales (1995). However, a major purpose of our
analysis is to compare quoted and unquoted companies and, by construction, only book value
data are available for the latter. We therefore use book values throughout.
A set of inter-related difficulties arises from the fact that Prowess is updated every fortnight, and
certain types of historical data, such as the composition of a company's shareholders and its
quotation status are not retained at the update. One would particularly expect to observe
systematic differences between the financial structures of quoted and unquoted companies. To
make this distinction in the data with sufficient precision, it is necessary to identify those
companies which went public within the sample. To do this, we acquired a complete list of all
public offerings on the Mumbai stock exchange from Prime (2000)11 and matched up the initial
public offerings (IPOs) with the companies in Prowess. It transpired that the majority of the
companies which went public within the sample had been collected in Prowess for just one year
prior to the IPO, with the accounts presented for that year corresponding to the statutory listing
requirements for the offer documents. For these companies, we deleted the one year's accounts
before the company was listed and concentrated on the years in which it was a public company,
provided it satisfied our other criteria for inclusion in the dataset. Companies whose accounts
were available for more than one year before the IPO were segregated from wholly-quoted and

C:\Documents and Settings\ECJB\Desktop\Website\Reasearchpapers\2002\4-02\erp02-4.doc 13
wholly-unquoted companies into a "mixed" category. This "mixed" category is not analysed in
this paper.
We included all companies with complete accounts, irrespective of the timing or length of the
financial year. Data for any particular year include companies reporting any time between
January and December of that year. However, the overwhelming majority of companies have a
report date of March, which corresponds to the end of the Indian tax year. A few companies
have a regular June report date, but companies which reported accounts at any other month
invariably did so on a once-off basis, presumably because of company-specific issues concerned
with the preparation of the accounts for that particular year. For most practical purposes, the
data can be treated as end-March.
The next step was to construct two samples of companies from the data. The "maximum
sample" consists of all companies which reported in any particular year. The number of
companies which reported each year varies over time, partly with the development of Prowess,
but more particularly with the expansion in private company activities and new flotations during
the 1990s. The second "fixed sample" consists of all those companies which reported every
year over a fixed time period. In this sample, we excluded companies whose accounts were
missing for at least one of the years in the sample period. The fixed sample is a balanced panel
in which the same companies are present each year. The maximum sample is designed to obtain
information about the company sector as a whole; the fixed sample enables us to characterise the
development over time of a fixed group of companies. In this paper we concentrate on
analysing the fixed sample.
We chose as fixed sample the one with the longest data span, covering 11 years from 1989
through 1999. This period encompasses the major liberalization measures applied to the capital
market in the early 1990s. We deleted a few companies with obvious errors in the original data,
such as balance sheets which did not balance. Companies which reported zero net sales (sales
net of indirect taxes) for more than half the sample were deleted. Zero net sales could occur for
several reasons, but most likely is that are missing for that particular period. Companies which

C:\Documents and Settings\ECJB\Desktop\Website\Reasearchpapers\2002\4-02\erp02-4.doc 14
reported negative net assets (total assets less current liabilities) in every year of the sample were
also deleted12, but those which reported negative net assets in some years followed by positive
net assets were retained.
Companies which reported negative net assets were not necessarily bankrupt according to Indian
practise. Indian bankruptcy law is laid down in the 1985 Sick Industrial Companies Act and the
reorganization of bankrupt companies is supervised by the statutory Board for Financial and
Industrial Reconstruction (BFIR)13. One of the main features of the act and its procedures is that
they involve an exceptionally slow and conservative process of recognition and reorganisation.
See Anant, Gangopadhyay, and Goswami (1992). A company is defined as “sick” if it has been
registered for at least 5 years and has a negative net worth14. Once a company is registered with
the BIFR as “sick” an indefinite moratorium is imposed on creditors' claims. A sick company
can propose a reorganization which must plan for a return to positive net worth within ten years;
otherwise BIFR appoints an operating agency to run the company. See Goswami (1996) for
details. BIFR decisions on reorganization plans routinely take several years. As of 1997, the
mean delay was 1664 days. See Goswami (2000). This process means that bankrupt companies
can continue operating for many years. We took the view that such companies should not be
excluded from our sample, since managers would still be making financial decisions during the
extended period until reorganization or winding-up. However, it would clearly be interesting to
investigate further the implications of these regulations.
The resulting sample provides us with data for a constant 793 quoted companies and a further
229 unquoted companies, giving 1022 companies in total covering 1989-99. Table 5 shows the
broad ownership composition of this sample and illustrates again the importance of business
groups in the company sector: 30% of quoted companies and 24% of unquoted companies
belong to one of the top 50 business houses; 66% of quoted Indian private sector companies and
60% of unquoted private companies belong to some business house. These figures perhaps
over-estimate the true reach of the business houses as the smaller houses include many that
control just 2 or 3 companies. Unlike many of their western counterparts, Indian companies are
under no legal obligation to produce consolidated accounts and most chose not to consolidate.15

C:\Documents and Settings\ECJB\Desktop\Website\Reasearchpapers\2002\4-02\erp02-4.doc 15
Therefore, some companies which belong to a business house may in practise be majority-
owned subsidiaries.
__________________________________________________________________________
Table 5 about here
__________________________________________________________________________
A substantial proportion of unquoted companies and some quoted companies are wholly or
majority owned by state or central governament. Table 6 gives the industrial composition of the
sample, including and excluding government, and shows that government participation in
industry is widely spread across most industrial sectors. A priori, one might expect that
government-owned firms would operate under different constraints, and perhaps have different
characteristics from those in the private sector. Government-owned unquoted companies are
mostly substantially larger on any measure than any private unquoted company. For example,
Air India falls into the unquoted government group, and its activities dwarf those of any private
unquoted company. Many government-owned firms were evidently under-capitalized or did not
present the full extent of the government's commitment in their accounts, as they had negative
net assets for most of the sample period. For these reasons, we deleted government-owned firms
from the analysis and concentrated on those which were wholly in private ownership for the
sample period. This left 748 quoted and 139 unquoted companies.
__________________________________________________________________________
Table 6 about here
__________________________________________________________________________
4. The financial structure of Indian companies
We now turn our attention to the financial structure of the sample companies. Table 7 gives the
size distribution of the sample companies, measured by the value of net assets: total assets net of
current liabilities. We also measured size by net sales (turnover less indirect taxes) but the
distributional results were essentially the same. The striking feature of table 7 is the severe
skewness of the size distribution of Indian companies, particularly in comparison with OECD

C:\Documents and Settings\ECJB\Desktop\Website\Reasearchpapers\2002\4-02\erp02-4.doc 16
countries. Throughout the sample period, just over 2% of companies fell in the top 3 quartiles
by size of assets. The vast majority of Indian companies are relatively small with just a few
companies which are exceptionally large in comparison. In contrast, Rajan and Zingales (1995),
found that 42% of US companies had above-median assets; for the other 6 OECD countries in
their study the percentage was higher still. A second feature of our data is that the median
quoted company grew substantially more rapidly than did the median unquoted company: the
net assets of the median quoted company grew at just over 8% pa in real terms whereas that of
the median unquoted company grew at just over 1.5% pa.
__________________________________________________________________________
Tables 7-9 about here; and Charts 1-2
__________________________________________________________________________
Charts 1 and 2 (also tables 8 and 9) report the evolution of the balance sheets of the two sets of
sample companies16. These data are calculated by summing assets and liabilities across
companies and then calculating proportions. They suggest several important conclusions. On
the assets side, the balance sheets of quoted and unquoted companies consist almost entirely of
fixed assets or current assets, with intangibles and longer-term financial assets (investments)
being negligible, and certainly much smaller than in the main OECD countries17. Over time
there is an upward trend in investments and intangibles offset by a decrease in current assets
(quoted companies) or fixed assets (unquoted companies). The small share of investments and
intangibles is perhaps what might be expected in a developing country where there are relatively
few mergers, and corporate financial activity has been tightly regulated. However, the share is
surprisingly small when it is recalled that these are mostly unconsolidated accounts, and given
the large number of companies in business groups.
Turning to the liabilities, a striking feature of the data is that unquoted companies have a
persistently higher proportion of financing from shareholders' funds than do quoted companies.
This is consistent with Rajan's (1992) argument that one reason companies go public is to
improve the terms on which they can obtain access to debt. It is hazardous to attempt to use

C:\Documents and Settings\ECJB\Desktop\Website\Reasearchpapers\2002\4-02\erp02-4.doc 17
balance sheet data to discuss internal financing. Nevertheless a crude indication of the scale of
internal financing can be obtained by separating shareholders' funds into the part originally
raised by share issues (shown as the equity and share premium in tables 8 and 9) and the rest,
which is derived from retentions. An outstanding feature of the data is that the stock of
retentions is very small at the outset (7.7% for quoted and 2.3% for unquoted companies) but it
rises substantially over the sample period suggesting that Indian firms were sufficiently
profitable in the 1990s so as to be able to finance internally to a greater extent than in the past.
Overall though, these data on retentions would tend to support the Singh-Hamid argument that
firms in a developing country are quite heavily reliant on external funds. The debt component
of the balance sheets of both quoted and unquoted firms is relatively stable during the 1990s.
The increase in shareholders' funds is balanced arithmetically by a reduction in current
liabilities.
__________________________________________________________________________
Table 10 about here
__________________________________________________________________________
In table 10 we provide some comparative international data. Specifically, we show the
aggregate book ratio of total debt to total assets, based on company balance sheets, as reported
in three recent studies. It is evident that, even though MCH and Rajan and Zingales perform
allegedly the same calculation for the same year and the same OECD countries, but for different
samples of companies culled from different commercial information services, they obtain
widely different figures for this basic statistic. Booth, Aivazian, Demirguc-Kunt, and
Maksimovic (2001) study the same developing countries as Hamid and Singh, and it can be seen
that our results for India are broadly in line with theirs, giving some confidence in these
calculations. Our figures suggest that the debt ratio of Indian companies is relatively high
compared with other developing countries, but is in broadly in line with that of OECD countries
according to MCH, though not according to Rajan and Zingales. Overall though, we would
observe that table 10 illustrates the difficulties involved in making international comparisons
along these lines.

C:\Documents and Settings\ECJB\Desktop\Website\Reasearchpapers\2002\4-02\erp02-4.doc 18
__________________________________________________________________________
Tables 11-12 about here; and Charts 3-4
__________________________________________________________________________
Tables 11 and 12 (summarized in charts 3 and 4) report capital structure measures for quoted
and unquoted companies. These ratios are calculated using the three separate methods outlined
in section 2 (table 3). For each of these methods we present two statistics. First, is the weighted
mean which is found by summing debt and assets separately across companies and then dividing
total debt by total assets. This is analagous to a company sector ratio. The median is found by
calculating the debt/asset ratio for each company and then computing the median of this ratio
across companies. We also calculated the unweighted mean of individual companies' debt/asset
ratios, but given the extreme skewness of the distribution of companies, it is not surprising that
this statistic behaved very erratically over time and across methods, and we therefore do not
report the results.
These statistics all show a small but perceptable rise over time in the equity share of the balance
sheet, and a corresponding fall in debt. Although there was a boom in new issues in the equity
market in this period, a part of the fall in debt appears to be attributable to improved company
profitability rather than to a switch from debt to equity. These findings do not support the
Singh-Hamid argument that external finance in developing countries is biased towards equities
rather than debt, in comparison with OECD countries. India may be a special case in that equity
market liberalization did not take place until the 1990s, so that the share of equity finance may
be lower than in developing countries which liberalized earlier. However, we do see a steady
upward trend in the share of equity financing during the 1990s, particularly for quoted
companies, which may reflect a response to the liberalization of this era. Even so, the
contribution of equity financing in 1999 was still less than for OECD countries on all our
comparable measures.
Turning next to the composition of outstanding debt, the proportion of bank debt incurred by
quoted companies fell following equity market liberalization in the early 1990s, but then rose

C:\Documents and Settings\ECJB\Desktop\Website\Reasearchpapers\2002\4-02\erp02-4.doc 19
sharply as the RBI subsequently relaxed credit controls. Overall, quoted companies did not
subatantially increase the proportion of bank debt in their balance sheets during this time. In
contrast, there was a steady increase in the proportion of both bank debt and debentures in the
balance sheets of unquoted companies which was reflected in a declining share of other
institutional debt such as Development Finance Institutions. This probably reflected a structural
effect of capital market liberalization. Although institutional debt was a relatively high
component of total debt throughout the 1990s, particularly for unquoted firms, the proportion of
bank debt in the total remained moderate and, insofar as comparison is possible, generally less
than suggested by Cobham and Subramaniam in their study.
__________________________________________________________________________
Tables 13-14 about here
__________________________________________________________________________
To test more rigorously whether any of these changes were significant, we compared the
distributions of the main debt ratios year-by-year and from beginning to end. That is, we
compared 1989 to 1990, 1990 to 1991, etc. and 1989 directly to 1999. Given the extreme
skewness of the data, we took the view that t tests (employed by Cobham and Subramaniam)
were less appropriate than non-parametric tests. We therefore employed the (normalized)
Wilcoxon/Mann-Whitney rank sum statistic, distributed as N(0,1). This is discussed in most
statistics texts, for example: Mood, Graybill and Boes (1974). We based the test on the rank
sums of the earlier of each pair of years; hence a negative statistic implies that the debt ratio rose
between the two years. The results are shown in tables 13 and 14. Comparing 1989 and 1999
directly, both quoted and unquoted companies underwent significant changes in their financial
structure. For unquoted companies the changes were gradual, as there were no significant year-
to-year changes. For quoted companies, the year-to-year changes were more significant.
Moreover, all the significant year-to-year changes took place in the period 1991-96,
immediately following the introduction of the SEBI act and the liberalization of the RBI's credit
control regime. This suggests that capital market reforms did have an impact on the financial
structure of Indian companies. For unquoted companies, the proportion of total debt and bank

C:\Documents and Settings\ECJB\Desktop\Website\Reasearchpapers\2002\4-02\erp02-4.doc 20
debt in the balance sheet fell significantly on 2 measures. As shown in table 14(ii), if
government-owned enterprises are included in this calculation18, the debt ratio is seen to have
fallen significantly on all measures. For quoted companies the behaviour of the debt ratios is
less clear-cut. The total debt ratio fell significantly on the total assets measure, while bank debt
fell significantly on one measure and rose on another. Again though, if government-owned
companies are included, the total debt ratio fell significantly on all measures.
__________________________________________________________________________
Tables 15-18 about here; and Charts 5-6
__________________________________________________________________________
Sources-uses measures of financing are displayed in tables 15 and 16 (summarized in charts 5
and 6). These are calculated according to the definitions in table 2 except that, following
Cobham and Subramaniam (1998), we did not use the gross sources-uses approach. As
discussed in section 2, calculation of individual company measures was rendered nugatory by
the existence of numerous observations with zero or negative denominators. Therefore, all the
sources-uses measures were calculated once only using the same weighted mean method as in
tables 11(i) and 12(i). These tables give an alternative and possibly more precise picture of the
relative contributions of internal and external funds to company financing. They underline
Cobham and Subramaniam’s point that the Singh-Hamid approach (net asset growth)
necessarily generates a higher share of external funding than the Corbett-Jenkinson approach.
Indeed, we find the differences between the two methods to be greater than reported by
Cobham-Subramaniam.
To compare our results with OECD countries we use the net sources-uses approach. On this
measure, Corbett-Jenkinson found internal financing ratios for four major OECD countries19 to
be consistently above 60% and, apart from Japan, well over 75%. Our table 15 confirms our
conclusion from the balance sheets that Singh-Hamid are correct in asserting that quoted
companies in developing countries rely more heavily on external funds, at least in India. The
highest internal financing ratio in any year and on either measure is just over 50%, and in most

C:\Documents and Settings\ECJB\Desktop\Website\Reasearchpapers\2002\4-02\erp02-4.doc 21
years it is much less. However, we see from table 16 that there is a substantial difference
between quoted and unquoted companies in this respect, with unquoted companies employing
internal financing at rates which varied considerably over time, but which were substantially
higher than quoted companies, and on average were comparable with the highest internal
financing ratios among the Corbett-Jenkinson countries. One reason for this could be that a
lower proportion of companies go public in developing countries. Thus, the unquoted
companies in India include many with higher internal financing ratios. However, this does not
explain why unquoted companies should have financial structures which are systematically
different from those of quoted companies. Our data also confirm that a temporary surge in
equity financing took place beginning in 1993, particularly for quoted companies, and they
suggest that this was largely at the expense of debt financing. This is consistent with the fact
that liberalization of the equity market preceded that of debt market. Mann-Whitney tests are
reported in tables 17 and 18; these were carried out in the same way as for tables 13 and 14, and
with broadly comparable results: there were some significant changes over the whole decade
for both quoted and unquoted companies; but the most significant year-to-year changes were
among quoted companies following the capital market liberalization of the early 1990s.
__________________________________________________________________________
Tables 19-20 about here
__________________________________________________________________________
We turn finally to Indian business groups. To identify the impact of group membership, the
sample was refined into 4 successively smaller categories following the categorisation in
Prowess, and shown in tables 19 and 20. In these tables we show 4 statistics for each category:
claims on group companies as a proportion of total assets (following the definition in tables 8
and 9); group debt as a proportion of total debt (following the weighted mean definitions in table
11) and Mann-Whitney tests on the ratios of group assets to total assets and of group debt to
total debt.

C:\Documents and Settings\ECJB\Desktop\Website\Reasearchpapers\2002\4-02\erp02-4.doc 22
There are several striking feature of these data. First, the absolute values of the group asset and
debt ratios are initially very small, but increase over time, especially the asset ratio of unquoted
companies. The Mann-Whitney tests confirm that there were perceptible significant changes
over time in the distribution of the debt ratios, particularly for quoted companies. Overall
though, the figures for intergroup claims are surprisingly low given that these are mainly
unconsolidated accounts. Of course, it is possible that not all group assets and liabilities are
shown separately on the balance sheet. However, even if some group claims have been included
indistinguishably in (non-group) investments, the overall figures for total investments are
sufficiently small so that any under-estimation of group claims is also likely to be small.
Second, there are quite large and expanding discrepancies between the magnitudes of the debt
ratios and the asset ratios. These can probably be attributed to group equity holdings which are
included indistinguishably in group assets but not in group debt.
Third, the data for quoted companies suggest that there are essentially no cross-sectional
differences among the asset and debt ratios by group membership or size of group. Thus, group
membership per se would seem to have little direct impact on the group asset and debt
composition of quoted companies. Group equity participation may be more important, but if so,
it is a very recent phenomenon and it is unclear from these data whether it can be attributed to
group membership or as just another effect of capital market liberalization in the 1990s. Insofar
as group membership is important, its importance does not derive from any reported direct
financial relationships among quoted companies, as these appear to be small.
Fourth, there are substantial differences among unquoted companies as between group and non-
group firms and to a lesser extent as among groups of different size. These differences arise on
the assets rather than the liabilities side. Claims on group companies were less than 2% of total
assets in each group category in 1989. By 1999 however, this proportion had risen to 13.6% for
all companies and to 28.3% within the top 50 business houses. One possible reason for these
increases relates to the issue of corporate governance. As family-oriented firms are floated on
the stock market and their share ownership is diversified, their ownership and control become

C:\Documents and Settings\ECJB\Desktop\Website\Reasearchpapers\2002\4-02\erp02-4.doc 23
more diluted. However, families can retain influence or control in such companies using a
closely-held unquoted company as an investment vehicle. This hypothesis is consistent with the
increased group equity participation which is suggested by the increasing discrepancies between
the debt and asset data of unquoted companies.
5. Summary of conclusions
Indian quoted non-financial companies exhibit financial structures which differ to some extent
from their OECD counterparts. During the 1990s quoted companies made greater use of
external funding than did firms in the OECD. However, we do not find evidence to support the
claim of Singh-Hamid that the bulk of this external funding is equity, or of Cobham-
Subramanian that it is bank debt. There are interesting and important differences between
quoted and unquoted companies. In particular, unquoted companies are more heavily reliant on
equity than quoted companies: this is consistent with the argument that companies go public to
gain access to debt markets. Unquoted companies are also more heavily reliant on internal
funds than are quoted companies. Both quoted and unquoted companies have experienced
changes in their financial structures which, it seems reasonable to conjecture, were associated
with the liberalization of the capital markets in the early 1990s. However, the changes in
unquoted companies' structures took place more gradually over time than did those of quoted
companies. An important topic for future research is to identify how far these changes were
driven by financial liberalization, and how far they were incidental to it.
In aggregate, business groups do not appear to have close financial relationships among one
another, as measured by the quantity of identified inter-group investments and debt in the
balance sheets of quoted companies. If the group relationship does perform important functions
for group members and for the economy as a whole, it must be through channels other than
direct financing among group members. However, unquoted companies have experienced a
significant rise in their intergroup assets which we conjecture may be associated with issues
related to insider control. These too are clearly important topics for future research.

C:\Documents and Settings\ECJB\Desktop\Website\Reasearchpapers\2002\4-02\erp02-4.doc 24
Footnotes
1. See Agarwal (1996) and Singh (1998).
2. See Reserve Bank of India (2000).
3. The Corbett-Jenkinson approach is often incorrectly identified with that of Mayer (1988).
See Cobham and Subramanian (1995) and Singh and Weisse (1998). Actually, Mayer's
approach has more in common with that of Singh and Hamid (1992), particularly in its
treatment of depreciation. Mayer is quite clear that his objective is to identify the sources
of financing of the net capital stock, not gross investment.
4. However, Singh and Hamid (1992) appealed to lack of data on depreciation to justify their
treatment of this variable.
5. A firm's Hicksian income can be defined as that within-period distribution of resources
which leaves its earning power unchanged. See Edwards, Kay, and Mayer (1987).
6. Hackethal and Schmidt apply their critique to Mayer (1988). Mayer does advocate the use
of net financing data but, as we have argued in footnote 3, Hackethal and Schmidt's
critique is arguably more applicable to Corbett and Jenkinson (1997).
7. Net acquisitions may obviously have either sign. “Gross investment” is the sum of fixed
investment and inventory changes, and so a combination of small or zero fixed investment
and a fall in inventories produces negative gross investment. See table 2.
8. As noted earlier, cash flow statements are only available in India from 1995/96.
9. These are data in Prowess as of the September 2000 release.
10. See Goswami (2000).
11. The Mumbai stock exchange (BSE) is by far the largest Indian stock exchange by number
of companies, although the turnover in Mumbai is now exceeded by that of the National
Stock Exchange of India (NSE).

C:\Documents and Settings\ECJB\Desktop\Website\Reasearchpapers\2002\4-02\erp02-4.doc 25
12. 22 quoted companies and 11 unquoted companies reported zero net sales. Of these, 3
quoted and 3 unquoted were deleted. 28 quoted and 43 unquoted companies reported
negative net assets. Of these 9 quoted and 3 unquoted were deleted.
13. The reorganization procedure is analagous to the US chapter 11, in which the emphasis is
on reorganizing the firm as a going concen rather than on a rapid realization of the firm's
assets, as in the UK.
14. Until 1994, a further requirement was that the company had incurred cash losses for at
least two consecutive years.
15. Rajan and Zingales (1995) report that, in OECD countries in which consolidation is not
required, around 75% of firms do nevertheless report consolidated accounts.
16. The data on financial structure are summarized in the charts and shown in more detail in
the tables. The reader who wants a quick summary of the main results could confine
attention to the charts.
17. In our comparisons with OECD countries we draw particularly on the analyses in Rajan
and Zingales (1995) and MCH (1999).
18. 45 quoted and 90 unquoted government-owned companies were otherwise omitted from
the calculations. See the discussion of table 6 earlier.
19. Japan, UK, USA and West Germany for 1970-1994.

C:\Documents and Settings\ECJB\Desktop\Website\Reasearchpapers\2002\4-02\erp02-4.doc 26
References
Agarwal, R.N., 1996, Financial liberalization in India, Delhi, BR Publishing.
Anant, T.C.A., Gangopadhyay, S.and Goswami, O., 1992, “Industrial sickness in India: characteristics, determinants, and history, 1970-1990”, Ministry of Industry Studies in Industrial Development, Paper No. 6, Government of India, October.
Booth, L., Aivazian, V, Demirguc-Kunt, A., Maksimovic, V., 2001, "Capital structures in developing countries", Journal of Finance, Vol. 56, no. 1, Febraury, pp.87-130.
Brainard, W.C., Shoven, J. and Weiss, L., 1980, "The financial valuation of the return to capital", Brookings Papers on Economic Activity, No. 2, pp. 453-502.
Centre for Monitoring the Indian Economy, 1997, Prowess user's manual, Vols I-III, CMIE, Mumbai, India.
Cobham, D. and Subramaniam, R., 1998, "Corporate finance in developing countries: new evidence for India", World Development, Vol. 26, No. 6, pp. 1033-1047.
Corbett, J. and Jenkinson, T., 1997, “How is investment financed? A study of Germany, Japan, the United Kingdom and the United States", Manchester School, Vol. 65, Supplement, pp. 69-93.
Cornelli, F., Portes, R. and Schaffer, M. E., 1996, “The capital structure of firms in central and eastern Europe”, Discussion Paper No. 1392, Centre for Economic Policy Research, London: UK.
Edwards, J. Kay, J. and Meyer, C., 1987, The Economic Analysis of Accounting Profitability, Oxford, Oxford University Press.
Goswami, O., 1996, Corporate bankruptcy in India: a comparative perspective, OECD Development Centre Studies, Paris, Organization for Economic Co-operation and Development.
Goswami, O., 2000, "The tide rises gradually: corporate governance in India", Indian Society of Capital Markets, Processed.
Green, C.J., Murinde, V., Suppakitjarak, J. and Moore, T., 2000, "Compiling and understanding the flow of funds in developing countries", Finance and Development Research Programme Working Paper, No. 21; repr as Loughborough University Department of Economics Research Paper, 00-22, December.

C:\Documents and Settings\ECJB\Desktop\Website\Reasearchpapers\2002\4-02\erp02-4.doc 27
Guha-Khasnobis, B. and Bhaduri, S.N., 2000, "A hallmark of India's new economic policy: deregulation and liberalization of the financial sector", Journal of Asian Economics, Vol. 11, pp. 333-346.
Hackethal, A. and Schmidt, R.H., 1999, "Financing patterns: measurement concepts and empirical results", Working Paper, No. 33, Frankfurt, University of Frankfurt.
Harris, M. and Raviv, A., 1991, “The theory of capital structure,” Journal of Finance, Vol. 49, pp. 297- 355.
Institute of Chartered Accountants of India, 2000, "Major differences between the Indian acounting standards and international accounting standards", Mimeo.
Mayer, C., 1988, “New issues in corporate finance”, European Economic Review, Vol. 32, pp. 1167- 1189.
Mayer, C., 1990, “Financial systems, corporate finance and economic development”, in R.G. Hubbard (ed.) Asymmetric Information, Corporate Finance and Investment, Chicago, University of Chicago Press.
McClure, K.G., Clayton, R. and Hofler, R.A., 1999, "International capital structure differences among the G7 nations: a current empirical view", European Journal of Finance, Vol. 5, pp. 141-164.
Mood, A.M., Graybill, F.A. and Boes, D.C., 1974, Introduction to the theory of statistics, McGraw-Hill, Tokyo, 3rd ed.
Myers, S.C., 1984, “The capital structure puzzle”, Journal of Finance, Vol. 34, pp. 575- 592.
Myers, S.C., and Majluf, N. S., 1984, “Corporate financing and investment decisions when firms have information that investors do not have”, Journal of Financial Economics, Vol. 13, pp. 187- 221.
Prasad, S., Green, C.J., and Murinde, V., 2001, "Company financing, capital structure, and ownership", SUERF Study No 12, Vienna, SUERF, February.
Price Waterhouse, 1996, Doing business in India, New Delhi, India, Price Waterhouse.
Prime, 2000, Public offerings list.
Rajan, R.G., 1992, "Insiders and outsiders: the choice between informed and arm's length debt", Journal of Finance, Vol. 47, pp.1367-1400.
Rajan, R. and Zingales, L., 1995, “What do we know about capital structure? Some evidence from international data”, Journal of Finance, Vol. 50, pp. 1421- 1460.
Reserve Bank of India, 1999, "The finances of large public limited companies 1997-98", Reserve Bank of India Bulletin, April.

C:\Documents and Settings\ECJB\Desktop\Website\Reasearchpapers\2002\4-02\erp02-4.doc 28
Reserve Bank of India, 2000, Flow of funds accounts of the Indian economy: 1951-52 to 1995-96, Mumbai.
Singh, A., 1995, “Corporate financial patterns in industrialising economies: a comparative study”, IFC Technical Paper No. 2, Washington D.C., International Finance Corporation.
Singh, A., 1998, “Liberalization, the stock market, and the market for corporate control: a bridge too far for the Indian economy?”, Ch. 8 in I.J. Ahluwalia and I.M.D. Litte (eds.) India's economic reforms and development: essays for Manmohan Singh, New Delhi, Oxford University Press.
Singh, A. and Hamid, J., 1992, “Corporate financial structures in developing countries”, IFC Technical Paper No. 1, Washington D.C., International Finance Corporation.
Singh, A. and Weisse, B.A., 1998, “Emerging stock markets, portfolio capital flows and long-term economic growth: micro and macroeconomic perspectives", World Development, Vol. 26, No. 4, pp. 607-622.
United Nations, 1993, Revised system of national accounts: SNA 1993, New York.

C:\Documents and Settings\ECJB\Desktop\Website\Reasearchpapers\2002\4-02\erp02-4.doc 29
Table 1: Recent Studies of Indian Company Financing Authors Date Period No of companies Industries Stocks/flows Source
Singh & Hamid 1992 1980-88 50 manufacturing balance sheet Bombay Stock ExchangeWorld bank
Singh 1995 1980-90 100 manufacturing balance sheet Bombay Stock ExchangeWorld bank
Cobham & Subramaniam
1998 1980-92 417-620; and aggregate data
non-financial companies
flow of funds ICICI Reserve Bank of India
Guha-Khasnobis & Bhaduri
2000 1989-98 620 manufacturing flow of funds CMIE-Prowess
Notes: ICICI: Industrial Credit & Investment Corporation of India
Table 2: Company financing: Sources-uses methods
Sources (s) Uses (u) Gross sources-uses method 1 EAITBD1 dividends paid 2 gross fixed investment 3 decrease in inventories increase in inventories 4 equity issues equity purchases 5 non-bank debt non-bank debt purchases 6 bank debt cash and deposits 7 other current sources2 other current uses2 8 Total sources (=Σsi) Total uses (=Σui) Net asset growth method (Singh-Hamid) 1 EAITBD1 - depreciation - dividends paid 2 gross fixed investment - depreciation - asset sales 3 increase in inventories - decrease in inventories 4 equity issues equity purchases 5 non-bank debt non-bank debt purchases 6 long-term bank debt cash and deposits - short-term bank debt 7 other current uses2 - other current sources2
8 Total sources (=Σsi) Total uses (=Σui) Net sources-uses method (Corbett-Jenkinson) 1 EAITBD1 - dividends paid 2 gross fixed investment 3 increase in inventories - decrease in inventories 4 equity issues - equity purchases 5 non-bank debt - non-bank debt purchases 6 bank debt - cash and deposits 7 other current sources2 - other current uses2 8 Total sources (=Σsi) Total uses (=Σui)
Notes: 1. EAITBD: Earnings after interest and tax, before depreciation 2. Including trade credit

C:\Documents and Settings\ECJB\Desktop\Website\Reasearchpapers\2002\4-02\erp02-4.doc 30
Table 3: Company financing: Balance sheet methods
Liabilities (d) Assets (a) Total assets method 1 net fixed assets 2 intangibles 3 inventories 4 shareholders' funds equity investments 5 non-bank debt security holdings 6 bank debt cash and deposits 7 other current liabilities1 other current assets1
8 Total liabilities (=Σdi) Total assets (=Σai) Net assets method 1 net fixed assets 2 intangibles 3 inventories 4 shareholders' funds equity investments 5 non-bank debt security holdings 6 bank debt cash and deposits 7 other current assets1 - other current liabilities1
8 Total liabilities (=Σdi) Total assets (=Σai) Net tangible assets method 1 Net fixed assets 2 3 Inventories 4 Shareholders' funds - intangibles Equity investments 5 Non-bank debt - security holdings 6 Bank debt - cash and deposits 7 Other current liabilities1 - other current assets1
8 Total liabilities (=Σdi) Total assets (=Σai) Notes: 1. Including trade credit

C:\Documents and Settings\ECJB\Desktop\Website\Reasearchpapers\2002\4-02\erp02-4.doc 31
Table 4: Prowess: Distribution of companies among industry types and ownership groups (no. of companies)
Manufacturing Services Finance Banking Total
All companies Indian Quoted Financial - - 498 36 535 Indian Quoted Non-financial 3495 646 - - 4142 Indian Unquoted financial - - 471 127 598 Indian Unquoted non-financial 1766 525 - - 2291 Foreign 279 68 25 43 415 Total 5540 1239 994 206 7981
Indian quoted companies Government 41 13 8 20 82 Top50 business houses 360 38 35 433 Other business houses 612 112 80 2 806 Private 2448 483 375 15 3321 Joint 34 34 Total Indian quoted 3495 646 498 37 4676

C:\Documents and Settings\ECJB\Desktop\Website\Reasearchpapers\2002\4-02\erp02-4.doc 32
Table 5 : Sample Company Characteristics (1989-99): Ownership Groups (no. of companies)
quoted unquoted Top 50 business houses 235 56 Large business houses 135 15 Other business houses 127 13 Other Indian private 241 53 Co-operative 0 2 Joint state/private 10 0 Sub-Total 748 139 Central Government 41 86 State Government 4 4 Total 793 229
Table 6 : Sample Company Characteristics (1989-99): Industry Groups (no. of companies)
incl government excl government quoted unquoted quoted unquoted Manufacturing 706 174 676 116 Food & beverages 57 21 57 19 Textiles 103 31 103 21 Chemical 171 33 157 20 Non-metallic mineral products 58 8 58 6 Metals & metal products 90 13 86 7 Machinery 111 37 105 25 Transport equipment 51 15 50 7 Miscellaneous manufacturing 34 7 32 4 Diversified 31 9 28 7 Services 70 40 59 22 Hotels, tourism, recreation 14 1 13 0 Health 2 0 2 0 Construction & offshore drill 14 11 13 5 Trading 24 17 20 11 Transport services 12 3 9 1 Communications 1 1 0 0 Misc. services 3 7 2 5 Infrastructure (inc irrigation) 17 15 13 1 Mining 7 10 4 1 Electricity 10 5 9 0 Total 793 229 748 139

C:\Documents and Settings\ECJB\Desktop\Website\Reasearchpapers\2002\4-02\erp02-4.doc 33
Table 7: Company size measured by net assets (total assets less current liabilities)
1989 1990 1991 1992 1993 1994 1995 1996 1997 1998 1999 Quoted (748) maximum (R10m) 2,124 2,371 2,622 4,020 5,234 6,995 10,133 13,128 16,098 20,532 24,021median (R10m) 17 23 27 32 39 50 65 81 86 94 94 minimum (R10m) -1 -5 -4 -44 -91 -142 -15 -37 -68 -125 -166 quartile 4 737 734 734 738 738 737 739 741 741 742 743 quartile 3 9 11 12 8 8 9 6 5 5 5 4 quartile 2 1 1 0 0 0 0 2 1 1 0 0 quartile 1 1 2 2 2 2 2 1 1 1 1 1 Unquoted (139) maximum (R10m) 1,338 1,287 1,311 1,528 1,571 1,557 1,720 1,947 2,855 3,828 4,042 median (R10m) 8 9 11 12 12 15 17 19 22 22 24 minimum (R10m) 0 0 -3 -17 -22 -43 -48 -10 -17 -24 -30 quartile 4 136 136 136 136 136 135 135 135 135 136 136 quartile 3 1 1 1 1 1 2 1 1 1 1 1 quartile 2 1 1 1 1 1 1 2 2 2 1 0 quartile 1 1 1 1 1 1 1 1 1 1 1 2 Exchange rate (R per $: year ave) 16.23 17.5 22.74 25.92 30.49 31.37 32.43 35.43 36.31 41.26 43.06 Consumer prices industrial workers 100 106 118 134 147 158 174 192 210 225 254

C:\Documents and Settings\ECJB\Desktop\Website\Reasearchpapers\2002\4-02\erp02-4.doc 34
Table 8: Balance sheets of quoted non-financial companies (book values: proportion of total assets)
1989 1990 1991 1992 1993 1994 1995 1996 1997 1998 1999 Assets Net tangible assets 0.456 0.432 0.441 0.452 0.460 0.463 0.456 0.466 0.476 0.485 0.479 Intangibles and misc 0.005 0.005 0.005 0.006 0.007 0.007 0.007 0.008 0.008 0.012 0.013 Investments in group companies 0.003 0.003 0.006 0.009 0.013 0.018 0.025 0.026 0.024 0.023 0.022 Other financial investments 0.044 0.060 0.052 0.039 0.038 0.063 0.071 0.057 0.066 0.072 0.070 Current assets 0.493 0.500 0.496 0.494 0.482 0.449 0.441 0.444 0.425 0.409 0.416 Cash and bank accounts 0.031 0.034 0.034 0.035 0.034 0.031 0.028 0.035 0.035 0.043 0.045 Receivables from group companies 0.011 0.012 0.011 0.011 0.012 0.010 0.016 0.013 0.010 0.011 0.019 Other receivables 0.238 0.242 0.243 0.254 0.251 0.248 0.242 0.247 0.239 0.220 0.221 Inventories 0.213 0.212 0.208 0.194 0.186 0.159 0.155 0.149 0.141 0.135 0.131 Liabilities Shareholders' funds 0.188 0.198 0.202 0.200 0.236 0.284 0.334 0.336 0.324 0.311 0.297 Equity and share premium (0.111) (0.117) (0.112) (0.107) (0.142) (0.180) (0.216) (0.203) (0.192) (0.177) (0.167)Preference capital 0.002 0.002 0.001 0.001 0.001 0.001 0.002 0.004 0.003 0.005 0.006 Specific reserves 0.123 0.112 0.118 0.114 0.110 0.108 0.095 0.090 0.088 0.087 0.091 Total debt 0.432 0.435 0.428 0.432 0.431 0.396 0.370 0.366 0.387 0.402 0.400 Bank debt (short and long-term) 0.139 0.138 0.132 0.122 0.121 0.099 0.109 0.125 0.128 0.126 0.125 Other long-term debt 0.089 0.101 0.099 0.099 0.106 0.108 0.089 0.073 0.078 0.079 0.083 Loans from government 0.007 0.007 0.007 0.009 0.008 0.008 0.007 0.007 0.007 0.007 0.012 Loans from group companies 0.001 0.001 0.001 0.001 0.001 0.001 0.000 0.000 0.001 0.001 0.001 Other debt 0.196 0.189 0.189 0.201 0.194 0.181 0.165 0.161 0.174 0.189 0.179 Current liabilities 0.257 0.253 0.251 0.253 0.223 0.211 0.199 0.203 0.196 0.195 0.206 Payables 0.148 0.144 0.142 0.147 0.132 0.126 0.121 0.120 0.117 0.110 0.115 Other current liabilities 0.108 0.109 0.109 0.107 0.091 0.084 0.079 0.084 0.079 0.085 0.091 Composition of debt Long-term (short-term) 0.850 0.763 0.738 0.738 0.731 0.759 0.733 0.689 0.707 0.721 0.710 Institutional (marketable) 0.795 0.768 0.767 0.765 0.748 0.707 0.756 0.800 0.797 0.794 0.772 Foreign currency (domestic) 0.056 0.071 0.078 0.112 0.103 0.117 0.129 0.149 0.188 0.197 0.171

C:\Documents and Settings\ECJB\Desktop\Website\Reasearchpapers\2002\4-02\erp02-4.doc 35
Table 9: Balance sheets of unquoted non-financial companies (book values: proportion of total assets)
1989 1990 1991 1992 1993 1994 1995 1996 1997 1998 1999 Assets Net tangible assets 0.431 0.404 0.370 0.355 0.334 0.319 0.282 0.303 0.356 0.342 0.325 Intangibles and misc 0.005 0.002 0.002 0.001 0.002 0.002 0.002 0.002 0.003 0.004 0.004 Investments in group companies 0.004 0.004 0.013 0.015 0.045 0.053 0.096 0.097 0.094 0.105 0.129 Other financial investments 0.039 0.037 0.059 0.054 0.018 0.020 0.015 0.013 0.012 0.012 0.012 Current assets 0.521 0.553 0.557 0.574 0.601 0.606 0.605 0.585 0.535 0.538 0.530 Cash and bank accounts 0.041 0.051 0.056 0.057 0.093 0.109 0.119 0.086 0.091 0.090 0.104 Receivables from group companies 0.005 0.006 0.005 0.005 0.007 0.007 0.006 0.007 0.006 0.006 0.006 Other receivables 0.264 0.273 0.267 0.271 0.249 0.259 0.268 0.270 0.254 0.272 0.255 Inventories 0.211 0.223 0.228 0.241 0.253 0.231 0.212 0.223 0.184 0.170 0.164 Liabilities Shareholders' funds 0.254 0.319 0.279 0.266 0.277 0.292 0.321 0.337 0.352 0.355 0.381 Equity and share premium (0.231) (0.217) (0.197) (0.165) (0.157) (0.151) (0.155) (0.142) (0.132) (0.116) (0.111)Preference capital 0.001 0.001 0.001 0.001 0.001 0.003 0.003 0.005 0.004 0.004 0.004 Specific reserves 0.104 0.088 0.122 0.146 0.146 0.146 0.130 0.120 0.104 0.100 0.094 Total debt 0.363 0.302 0.294 0.291 0.280 0.266 0.255 0.258 0.307 0.322 0.315 Bank debt (short and long-term) 0.095 0.085 0.091 0.090 0.091 0.089 0.096 0.101 0.116 0.134 0.130 Other long-term debt 0.011 0.012 0.014 0.017 0.016 0.022 0.032 0.030 0.037 0.039 0.050 Loans from government 0.079 0.033 0.031 0.024 0.014 0.010 0.007 0.006 0.008 0.006 0.006 Loans from group companies 0.002 0.002 0.001 0.002 0.002 0.003 0.002 0.003 0.003 0.005 0.003 Other debt 0.175 0.170 0.156 0.157 0.156 0.142 0.117 0.118 0.144 0.138 0.125 Current liabilities 0.278 0.290 0.304 0.297 0.297 0.293 0.292 0.280 0.233 0.219 0.206 Payables 0.170 0.183 0.189 0.186 0.178 0.169 0.171 0.158 0.152 0.140 0.129 Other current liabilities 0.108 0.107 0.115 0.111 0.119 0.124 0.121 0.122 0.081 0.079 0.078 Composition of debt Long-term (short-term) 0.923 0.780 0.728 0.709 0.696 0.659 0.653 0.629 0.685 0.709 0.696 Institutional (marketable) 0.969 0.961 0.951 0.941 0.943 0.915 0.875 0.883 0.880 0.871 0.824 Foreign currency (domestic) 0.021 0.140 0.143 0.212 0.196 0.183 0.148 0.124 0.095 0.052 0.045

C:\Documents and Settings\ECJB\Desktop\Website\Reasearchpapers\2002\4-02\erp02-4.doc 36
Table 10: An International comparison of financial structures: Book value of total debt/total assets
Country Source Date(s) of data Mean No of firms Source Date(s) of data Mean Aggregate No of firmsCanada MCH 1991 0.522 106 RZ 1991 0.36 0.38 318 France MCH 1991 0.683 99 RZ 1991 0.26 0.29 225 Germany MCH 1991 0.699 78 RZ 1991 0.20 0.16 191 Italy MCH 1991 0.659 33 RZ 1991 0.28 0.30 118 Japan MCH 1991 0.645 670 RZ 1991 0.35 0.42 514 United Kingdom MCH 1991 0.534 230 RZ 1991 0.21 0.24 608 United States MCH 1991 0.507 725 RZ 1991 0.31 0.37 2580 Brazil BADM 1985-87 0.307 49 Mexico BADM 1985-87 0.354 99 India BADM 1985-87 0.661 99 GMS 1989 0.688 748 GMS 1991 0.679 748 GMS 1999 0.606 748 South Korea BADM 1985-87 0.728 93 Jordan BADM 1985-87 0.447 38 Malaysia BADM 1985-87 0.409 96 Pakistan BADM 1985-87 0.652 96 Thailand BADM 1985-87 0.509 64 Turkey BADM 1985-87 0.618 45 Zimbabwe BADM 1985-87 0.403 48
Sources: BADM: Booth, Aivazian, Demirguc-Kunt and Maksimovic (2001) GMS: Green, Murinde and Suppakitjarak: this paper MCH: McClure, Clayton and Hofler (1999) RZ: Rajan and Zingales (1995)

C:\Documents and Settings\ECJB\Desktop\Website\Reasearchpapers\2002\4-02\erp02-4.doc 37
Table 11(i): Financial structure: weighted mean measures for quoted non-financial companies (book values: proportions)
1989 1990 1991 1992 1993 1994 1995 1996 1997 1998 1999 total assets method - ratios to total assets Equity/total assets 0.312 0.312 0.321 0.315 0.346 0.393 0.431 0.430 0.416 0.404 0.394 Debt/total assets 0.688 0.688 0.679 0.685 0.654 0.607 0.569 0.570 0.584 0.596 0.606 Bank debt/total assets 0.139 0.138 0.132 0.122 0.121 0.099 0.109 0.125 0.128 0.126 0.125 Group debt/total assets 0.001 0.001 0.001 0.001 0.001 0.001 0.000 0.000 0.001 0.001 0.001 Net other debt/total assets 0.548 0.550 0.546 0.562 0.531 0.507 0.460 0.445 0.455 0.470 0.480 net assets (na) method - ratios to net assets Equity/net assets 0.419 0.417 0.429 0.422 0.446 0.498 0.538 0.540 0.518 0.501 0.496 Debt/net assets; 0.581 0.583 0.571 0.578 0.554 0.502 0.462 0.460 0.482 0.499 0.504 Bank debt/net assets 0.187 0.184 0.176 0.164 0.156 0.126 0.136 0.157 0.159 0.156 0.158 Group debt/net assets 0.001 0.001 0.001 0.001 0.001 0.001 0.001 0.001 0.001 0.001 0.001 Net other debt/net assets 0.393 0.397 0.394 0.413 0.397 0.375 0.326 0.303 0.322 0.342 0.345 adjusted na method - ratios to net tangible assets Equity/nta 0.458 0.476 0.488 0.479 0.526 0.619 0.695 0.686 0.660 0.633 0.625 Debt/nta 0.610 0.621 0.602 0.596 0.553 0.511 0.463 0.447 0.486 0.521 0.527 Bank debt/nta 0.162 0.162 0.151 0.135 0.136 0.110 0.132 0.146 0.150 0.134 0.132 Group debt/nta -0.003 -0.003 -0.007 -0.013 -0.019 -0.027 -0.041 -0.041 -0.038 -0.037 -0.035Net other debt/nta 0.447 0.458 0.450 0.460 0.417 0.400 0.331 0.300 0.335 0.386 0.394 debt ratios Bank debt/total debt 0.322 0.316 0.308 0.283 0.282 0.251 0.294 0.340 0.330 0.313 0.314 Debentures/total debt 0.205 0.231 0.231 0.230 0.246 0.272 0.241 0.199 0.201 0.198 0.207 Group debt/total debt 0.002 0.002 0.002 0.002 0.002 0.002 0.001 0.001 0.002 0.001 0.002
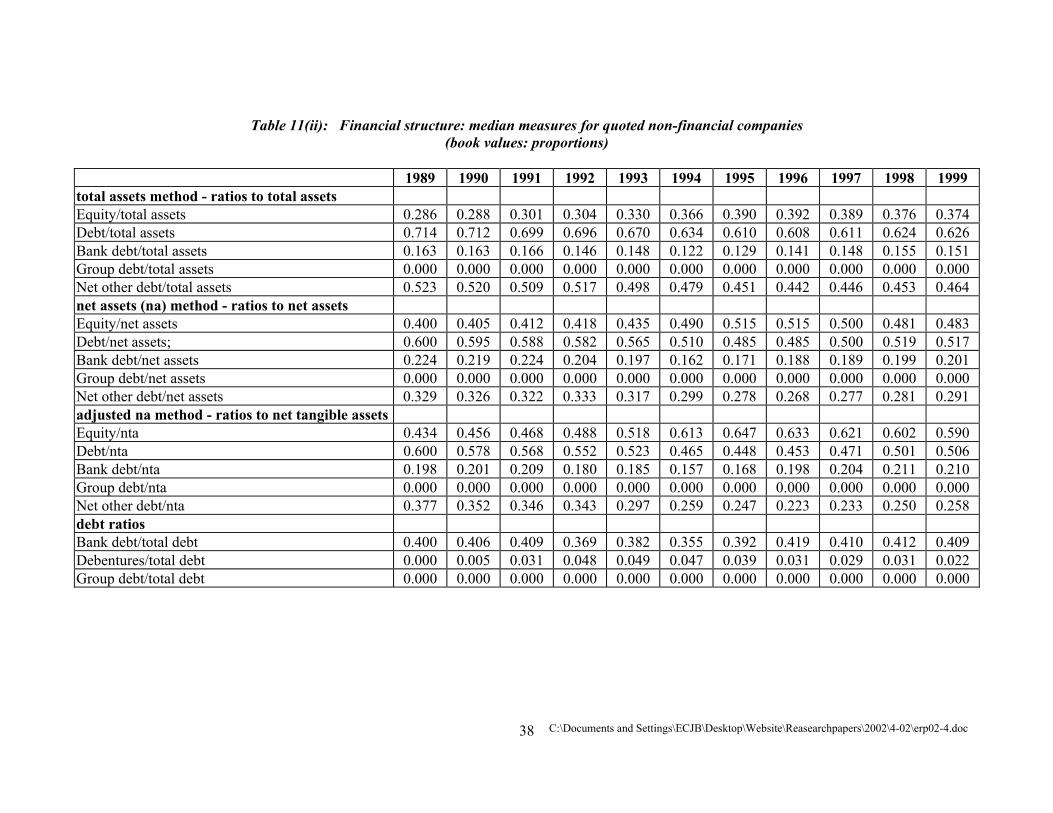
C:\Documents and Settings\ECJB\Desktop\Website\Reasearchpapers\2002\4-02\erp02-4.doc 38
Table 11(ii): Financial structure: median measures for quoted non-financial companies (book values: proportions)
1989 1990 1991 1992 1993 1994 1995 1996 1997 1998 1999 total assets method - ratios to total assets Equity/total assets 0.286 0.288 0.301 0.304 0.330 0.366 0.390 0.392 0.389 0.376 0.374 Debt/total assets 0.714 0.712 0.699 0.696 0.670 0.634 0.610 0.608 0.611 0.624 0.626 Bank debt/total assets 0.163 0.163 0.166 0.146 0.148 0.122 0.129 0.141 0.148 0.155 0.151 Group debt/total assets 0.000 0.000 0.000 0.000 0.000 0.000 0.000 0.000 0.000 0.000 0.000 Net other debt/total assets 0.523 0.520 0.509 0.517 0.498 0.479 0.451 0.442 0.446 0.453 0.464 net assets (na) method - ratios to net assets Equity/net assets 0.400 0.405 0.412 0.418 0.435 0.490 0.515 0.515 0.500 0.481 0.483 Debt/net assets; 0.600 0.595 0.588 0.582 0.565 0.510 0.485 0.485 0.500 0.519 0.517 Bank debt/net assets 0.224 0.219 0.224 0.204 0.197 0.162 0.171 0.188 0.189 0.199 0.201 Group debt/net assets 0.000 0.000 0.000 0.000 0.000 0.000 0.000 0.000 0.000 0.000 0.000 Net other debt/net assets 0.329 0.326 0.322 0.333 0.317 0.299 0.278 0.268 0.277 0.281 0.291 adjusted na method - ratios to net tangible assets Equity/nta 0.434 0.456 0.468 0.488 0.518 0.613 0.647 0.633 0.621 0.602 0.590 Debt/nta 0.600 0.578 0.568 0.552 0.523 0.465 0.448 0.453 0.471 0.501 0.506 Bank debt/nta 0.198 0.201 0.209 0.180 0.185 0.157 0.168 0.198 0.204 0.211 0.210 Group debt/nta 0.000 0.000 0.000 0.000 0.000 0.000 0.000 0.000 0.000 0.000 0.000 Net other debt/nta 0.377 0.352 0.346 0.343 0.297 0.259 0.247 0.223 0.233 0.250 0.258 debt ratios Bank debt/total debt 0.400 0.406 0.409 0.369 0.382 0.355 0.392 0.419 0.410 0.412 0.409 Debentures/total debt 0.000 0.005 0.031 0.048 0.049 0.047 0.039 0.031 0.029 0.031 0.022 Group debt/total debt 0.000 0.000 0.000 0.000 0.000 0.000 0.000 0.000 0.000 0.000 0.000

C:\Documents and Settings\ECJB\Desktop\Website\Reasearchpapers\2002\4-02\erp02-4.doc 39
Table 12(i): Financial structure: weighted mean measures for unquoted non-financial companies (book values: proportions)
1989 1990 1991 1992 1993 1994 1995 1996 1997 1998 1999 total assets method - ratios to total assets Equity/total assets 0.359 0.408 0.402 0.412 0.423 0.441 0.454 0.462 0.459 0.459 0.479 Debt/total assets 0.641 0.592 0.598 0.588 0.577 0.559 0.546 0.538 0.541 0.541 0.521 Bank debt/total assets 0.095 0.085 0.091 0.090 0.091 0.089 0.096 0.101 0.116 0.134 0.130 Group debt/total assets 0.002 0.002 0.001 0.002 0.002 0.003 0.002 0.003 0.003 0.005 0.003 Net other debt/total assets 0.543 0.505 0.505 0.496 0.483 0.466 0.448 0.434 0.422 0.402 0.388 net assets (na) method - ratios to net assets Equity/net assets 0.498 0.575 0.578 0.586 0.602 0.624 0.640 0.642 0.599 0.588 0.603 Debt/net assets; 0.502 0.425 0.422 0.414 0.398 0.376 0.360 0.358 0.401 0.412 0.397 Bank debt/net assets 0.132 0.120 0.131 0.128 0.130 0.126 0.136 0.140 0.152 0.171 0.164 Group debt/net assets 0.003 0.003 0.002 0.003 0.003 0.004 0.003 0.004 0.004 0.006 0.004 Net other debt/net assets 0.368 0.302 0.290 0.283 0.265 0.245 0.220 0.214 0.246 0.235 0.229 adjusted na method - ratios to net tangible assets Equity/nta 0.552 0.648 0.671 0.690 0.718 0.798 0.914 0.875 0.845 0.890 0.971 Net debt/nta 0.514 0.419 0.450 0.427 0.389 0.334 0.310 0.335 0.352 0.338 0.318 Gross bank debt/nta 0.084 0.055 0.058 0.055 -0.003 -0.035 -0.047 0.029 0.047 0.085 0.052 Gross group debt/nta -0.003 -0.003 -0.019 -0.022 -0.073 -0.090 -0.189 -0.179 -0.169 -0.196 -0.258Net other debt/nta 0.426 0.360 0.389 0.369 0.388 0.364 0.352 0.301 0.300 0.243 0.259 debt ratios Bank debt/total debt 0.262 0.283 0.310 0.309 0.327 0.335 0.378 0.391 0.378 0.416 0.412 Debentures/total debt 0.031 0.039 0.049 0.059 0.057 0.081 0.125 0.117 0.120 0.122 0.159 Group debt/total debt 0.006 0.007 0.004 0.007 0.008 0.012 0.010 0.011 0.009 0.015 0.011

C:\Documents and Settings\ECJB\Desktop\Website\Reasearchpapers\2002\4-02\erp02-4.doc 40
Table 12(ii): Financial structure: median measures for unquoted non-financial companies (book values: proportions)
1989 1990 1991 1992 1993 1994 1995 1996 1997 1998 1999 total assets method - ratios to total assets Equity/total assets 0.267 0.276 0.263 0.276 0.284 0.296 0.311 0.317 0.312 0.331 0.339 Debt/total assets 0.733 0.724 0.737 0.724 0.716 0.704 0.689 0.683 0.688 0.669 0.661 Bank debt/total assets 0.170 0.160 0.168 0.186 0.170 0.150 0.154 0.156 0.148 0.155 0.145 Group debt/total assets 0.000 0.000 0.000 0.000 0.000 0.000 0.000 0.000 0.000 0.000 0.000 Net other debt/total assets 0.541 0.551 0.551 0.525 0.522 0.496 0.492 0.492 0.491 0.460 0.429 net assets (na) method - ratios to net assets Equity/net assets 0.452 0.433 0.425 0.430 0.452 0.486 0.483 0.473 0.492 0.495 0.518 Debt/net assets; 0.548 0.567 0.575 0.570 0.548 0.514 0.517 0.527 0.508 0.505 0.482 Bank debt/net assets 0.272 0.276 0.283 0.300 0.281 0.250 0.248 0.261 0.241 0.224 0.209 Group debt/net assets 0.000 0.000 0.000 0.000 0.000 0.000 0.000 0.000 0.000 0.000 0.000 Net other debt/net assets 0.212 0.202 0.232 0.224 0.202 0.207 0.199 0.181 0.196 0.177 0.169 adjusted na method - ratios to net tangible assets Equity/nta 0.443 0.425 0.438 0.471 0.482 0.514 0.522 0.556 0.582 0.611 0.653 Debt/nta 0.595 0.590 0.592 0.564 0.558 0.512 0.521 0.505 0.463 0.450 0.418 Bank debt/nta 0.204 0.207 0.238 0.247 0.216 0.179 0.179 0.193 0.182 0.197 0.196 Group debt/nta 0.000 0.000 0.000 0.000 0.000 0.000 0.000 0.000 0.000 0.000 0.000 Net other debt/nta 0.338 0.372 0.363 0.339 0.297 0.252 0.272 0.274 0.246 0.175 0.173 debt ratios Bank debt/total debt 0.525 0.519 0.506 0.531 0.552 0.519 0.522 0.544 0.505 0.509 0.502 Debentures/total debt 0.000 0.000 0.000 0.000 0.000 0.000 0.000 0.000 0.000 0.000 0.000 Group debt/total debt 0.000 0.000 0.000 0.000 0.000 0.000 0.000 0.000 0.000 0.000 0.000

C:\Documents and Settings\ECJB\Desktop\Website\Reasearchpapers\2002\4-02\erp02-4.doc 41
Table 13(i): Financial structure: Mann-Whitney tests for quoted non-financial companies
1989-90 1990-91 1991-92 1992-93 1993-94 1994-95 1995-96 1996-97 1997-98 1998-99 1989-99total assets method Debt/total assets 0.817 0.364 1.071 2.679* 4.260* 2.144* 0.157 -0.987 -1.039 -0.788 7.358* Bank debt/total assets -0.942 -0.224 2.689* 0.078 3.528* -0.603 -2.400* -0.736 -1.032 0.352 0.694 net assets (na) method Debt/net assets; -0.647 -0.592 1.959* -0.126 1.823 -2.226* -2.422* 0.623 -0.188 0.665 -1.097 Bank debt/net assets -1.981 -1.021 -0.979 -0.272 0.061 0.637 0.967 -0.378 -0.241 0.584 -2.871*adjusted na method Debt/nta -0.461 -0.292 -0.011 -0.178 0.117 0.261 0.014 -0.392 0.105 -0.154 -0.623 Bank debt/nta 0.604 0.233 1.262 1.912 4.191* 2.232* -0.144 -1.208 -1.398 -0.609 5.934* debt ratios Bank debt/total debt -0.611 -0.334 2.228* 0.778 3.580* -0.571 -2.166* -0.359 -0.753 0.007 1.680 Debentures/total debt 0.856 0.560 1.550 2.392* 3.256* 1.466 -0.367 -1.523 -1.313 -0.882 4.792* Group debt/total debt -1.027 -0.369 2.273* 0.002 2.528* -0.785 -2.684* -0.496 -0.948 -0.143 -1.521
* significant at the 95% level (2-tailed test)
Table 13(ii): Financial structure: Mann-Whitney tests for quoted non-financial companies: including government-owned firms
1989-90 1990-91 1991-92 1992-93 1993-94 1994-95 1995-96 1996-97 1997-98 1998-99 1989-99total assets method Debt/total assets 0.881 0.303 1.036 2.678* 4.128* 2.232* 0.170 -0.995 -0.970 -0.698 7.526* Bank debt/total assets -1.052 -0.166 2.820* -0.227 3.502* -0.444 -2.402* -0.696 -0.894 0.361 0.734 net assets (na) method Debt/net assets; 0.650 0.184 1.280 1.838 4.053* 2.377* -0.077 -1.249 -1.257 -0.442 6.228* Bank debt/net assets -0.720 -0.298 2.269* 0.562 3.567* -0.398 -2.203* -0.341 -0.636 0.033 1.680 adjusted na method Debt/nta 0.894 0.425 1.569 2.520* 3.198* 1.554 -0.277 -1.432 -1.250 -0.766 5.227* Bank debt/nta -1.068 -0.376 2.401* -0.341 2.620* -0.619 -2.735* -0.445 -0.751 -0.045 -1.308
* significant at the 95% level (2-tailed test)

C:\Documents and Settings\ECJB\Desktop\Website\Reasearchpapers\2002\4-02\erp02-4.doc 42
Table 14(i): Financial structure: Mann-Whitney tests for unquoted non-financial companies
1989-90 1990-91 1991-92 1992-93 1993-94 1994-95 1995-96 1996-97 1997-98 1998-99 1989-99total assets method Debt/total assets -0.047 -0.099 0.384 0.406 1.010 0.339 0.130 0.464 0.740 0.449 3.449* Bank debt/total assets -0.296 -0.630 -0.219 0.550 1.016 0.041 0.170 0.143 0.179 0.090 0.896 net assets (na) method Debt/net assets; -0.120 0.264 -0.526 -0.059 0.999 -0.360 -0.104 0.448 0.078 0.438 1.306 Bank debt/net assets -0.651 -0.522 -0.157 0.003 -0.057 0.057 0.335 0.114 -0.048 0.536 0.349 adjusted na method Debt/nta 0.235 0.093 -0.122 0.005 -0.442 0.231 0.181 -0.645 -0.468 -0.049 -0.202 Bank debt/nta -0.134 -0.288 0.304 0.428 1.033 0.216 0.151 0.193 0.255 0.267 2.246* debt ratios Bank debt/total debt -0.675 -0.575 -0.162 0.590 1.200 0.132 0.079 0.563 0.334 0.124 1.429 Debentures/total debt -0.092 -0.249 0.668 0.372 1.029 -0.003 0.394 0.703 0.674 0.071 2.990* Group debt/total debt -0.517 -0.666 -0.185 0.688 0.758 0.480 -0.341 0.488 -0.124 0.366 0.776
* significant at the 95% level (2-tailed test)
Table 14(ii): Financial structure: Mann-Whitney tests for unquoted non-financial companies: including government-owned firms
1989-90 1990-91 1991-92 1992-93 1993-94 1994-95 1995-96 1996-97 1997-98 1998-99 1989-99total assets method Debt/total assets -0.426 0.063 0.399 0.911 1.076 0.367 0.154 0.537 0.534 0.589 3.852* Bank debt/total assets -0.238 -0.505 -0.040 0.198 0.818 0.402 -0.164 0.288 0.223 0.058 0.919 net assets (na) method Debt/net assets; -0.452 0.065 0.231 1.104 1.216 0.554 0.167 0.393 0.394 0.446 3.913* Bank debt/net assets -0.523 -0.299 -0.164 0.411 0.842 0.505 -0.295 0.439 0.118 0.130 1.145 adjusted na method Debt/nta -0.382 -0.336 0.625 0.923 1.126 0.174 0.515 0.821 0.448 0.180 3.773* Bank debt/nta -0.284 -0.313 -0.346 0.066 0.823 1.173 -0.505 0.294 0.330 0.149 1.383
* significant at the 95% level (2-tailed test)

C:\Documents and Settings\ECJB\Desktop\Website\Reasearchpapers\2002\4-02\erp02-4.doc 43
Table 15: Sources-Uses measures of financial structure: weighted mean measures for quoted non-financial companies (book values: proportions)
1990 1991 1992 1993 1994 1995 1996 1997 1998 1999 Net asset growth - ratios to net acquisitions of assets Internal funds 0.199 0.284 0.243 0.157 0.223 0.252 0.326 0.221 0.215 0.150 External financing 0.801 0.716 0.757 0.843 0.777 0.748 0.674 0.779 0.785 0.850 Equity financing 0.187 0.123 0.126 0.331 0.425 0.414 0.200 0.132 0.077 0.096 Debt financing 0.614 0.594 0.630 0.512 0.353 0.334 0.474 0.647 0.708 0.753 Bank financing 0.176 0.157 0.118 0.142 0.024 0.174 0.268 0.180 0.154 0.241 Group financing 0.003 0.001 0.000 0.000 0.001 -0.001 0.001 0.003 -0.001 0.006 Net other financing 0.434 0.435 0.512 0.370 0.328 0.161 0.206 0.464 0.555 0.506 Net sources-uses - ratios to gross fixed investment Internal funds 0.476 0.522 0.427 0.398 0.460 0.463 0.501 0.485 0.503 0.619 External financing 0.524 0.478 0.573 0.602 0.540 0.537 0.499 0.515 0.497 0.381 Equity financing -0.014 0.054 0.104 0.273 0.231 0.282 0.168 -0.040 -0.093 -0.014Debt financing 0.538 0.424 0.469 0.329 0.309 0.255 0.331 0.555 0.590 0.395 Bank financing 0.113 0.080 0.056 0.116 -0.006 0.187 0.176 0.126 0.008 0.055 Net group financing (excl investments) -0.021 -0.002 -0.013 -0.021 -0.007 -0.057 0.004 0.015 -0.024 -0.154Net other financing 0.446 0.346 0.426 0.234 0.321 0.125 0.151 0.414 0.606 0.493

C:\Documents and Settings\ECJB\Desktop\Website\Reasearchpapers\2002\4-02\erp02-4.doc 44
Table 16: Sources-Uses measures of financial structure: weighted mean measures for unquoted non-financial companies (book values: proportions)
1990 1991 1992 1993 1994 1995 1996 1997 1998 1999 Net asset growth - ratios to net acquisitions of assets Internal funds 1.639 0.524 0.408 0.693 0.687 0.496 0.546 0.367 0.499 0.688 External financing -0.639 0.476 0.592 0.307 0.313 0.504 0.454 0.633 0.501 0.312 Equity financing 0.046 0.019 0.015 0.061 0.147 0.216 0.088 0.035 0.045 0.034 Debt financing -0.685 0.457 0.577 0.246 0.165 0.288 0.366 0.598 0.455 0.278 Bank financing -0.045 0.280 0.175 0.167 0.093 0.183 0.179 0.224 0.261 0.097 Group financing 0.005 -0.013 0.015 0.008 0.005 0.003 0.006 0.005 0.010 0.001 Net other financing -0.645 0.190 0.387 0.071 0.067 0.102 0.180 0.369 0.184 0.180 Net sources-uses - ratios to gross fixed investment Internal funds 1.508 0.981 0.703 0.978 1.549 1.245 0.652 0.690 1.122 1.719 External financing -0.508 0.019 0.297 0.022 -0.549 -0.245 0.348 0.310 -0.122 -0.719Equity financing -0.004 -0.447 -0.066 0.059 -0.123 -0.302 -0.034 -0.048 -0.255 -0.715Debt financing -0.505 0.467 0.362 -0.037 -0.426 0.058 0.382 0.357 0.134 -0.004Bank financing -0.187 0.058 0.040 -0.386 -0.327 -0.090 0.283 0.142 0.256 -0.324Net group financing (excl investments) -0.012 -0.015 0.008 -0.021 -0.017 0.007 -0.009 0.008 0.001 -0.023Net other financing -0.306 0.423 0.314 0.370 -0.082 0.141 0.109 0.208 -0.123 0.342

C:\Documents and Settings\ECJB\Desktop\Website\Reasearchpapers\2002\4-02\erp02-4.doc 45
Table 17: Sources-uses Measures of Financial structure: Mann-Whitney tests for quoted non-financial companies
1990-91 1991-92 1992-93 1993-94 1994-95 1995-96 1996-97 1997-98 1998-99 1990-99Net acquisitions Internal funds -1.324 0.246 1.869 -2.167* 0.870 -1.205 -0.035 -1.376 -1.412 -4.259*External financing 1.323 -0.247 -1.869 2.168* -0.871 1.205 0.035 1.376 1.413 4.258* Debt financing 0.803 1.025 1.095 3.221* -1.163 -2.582* -1.096 0.835 1.041 3.519* Bank financing 0.342 2.433* -2.211* 4.366* -4.473* -1.329 2.583* 1.153 -0.096 3.067* Gross fixed investment Internal funds 0.069 1.156 0.549 -0.204 -0.243 0.304 -0.141 -0.136 -1.498 -1.089 External financing -0.068 -1.156 -0.549 0.204 0.242 -0.304 0.140 0.137 1.498 1.089 Debt financing 0.008 0.825 1.012 0.729 0.220 -2.143* -2.161* 0.852 0.262 0.235 Bank financing 0.118 2.573* -2.368* 2.733* -2.997* -2.045* 1.871 0.384 0.335 0.814
* significant at the 95% level (2-tailed test)
Table 18: Sources-uses Measures of Financial structure: Mann-Whitney tests for unquoted non-financial companies
1990-91 1991-92 1992-93 1993-94 1994-95 1995-96 1996-97 1997-98 1998-99 1990-99Net acquisitions Internal funds 0.731 -0.236 2.110* -0.932 -1.660 1.223 -0.082 -1.096 -1.039 -1.619 External financing -0.729 0.237 -2.111* 0.930 1.660 -1.224 0.084 1.093 1.047 1.619 Debt financing -0.510 0.143 -1.622 1.011 1.358 -0.796 -0.546 1.774 0.374 1.831 Bank financing -0.444 -1.001 -0.168 1.079 0.197 -0.164 0.638 0.909 1.240 2.433* Gross fixed investment Internal funds 0.779 0.437 -0.046 -0.323 -0.192 0.136 -1.133 0.606 -0.305 -0.514 External financing -0.783 -0.437 0.046 0.327 0.192 -0.138 1.133 -0.606 0.303 0.510 Debt financing -0.657 0.321 -0.404 0.745 -0.227 0.470 0.235 -0.231 0.261 0.734 Bank financing 0.487 1.054 -0.509 -0.076 -1.228 0.896 0.162 0.453 1.129 2.728*
* significant at the 95% level (2-tailed test)

C:\Documents and Settings\ECJB\Desktop\Website\Reasearchpapers\2002\4-02\erp02-4.doc 46
Table 19: Business Groups: quoted non-financial companies
No. 1989 1990 1991 1992 1993 1994 1995 1996 1997 1998 1999 Claims on group companies (in proportion of total assets) All companies 748 0.014 0.015 0.017 0.020 0.025 0.028 0.041 0.038 0.034 0.034 0.041 All business groups 497 0.014 0.016 0.017 0.022 0.026 0.030 0.044 0.041 0.036 0.036 0.043 Large business groups 370 0.014 0.016 0.018 0.022 0.027 0.030 0.045 0.041 0.036 0.035 0.043 Top 50 groups 235 0.016 0.019 0.019 0.023 0.028 0.031 0.050 0.046 0.039 0.039 0.047 Group debt/total debt (in proportions) All companies 748 0.002 0.002 0.002 0.002 0.002 0.002 0.001 0.001 0.002 0.001 0.002 All business groups 497 0.002 0.003 0.003 0.002 0.002 0.002 0.001 0.001 0.002 0.001 0.002 Large business groups 370 0.002 0.002 0.002 0.002 0.002 0.002 0.001 0.001 0.002 0.001 0.002 Top 50 groups 235 0.002 0.003 0.003 0.003 0.002 0.002 0.001 0.001 0.001 0.001 0.002 Mann-Whitney tests 1989-90 1990-91 1991-92 1992-93 1993-94 1994-95 1995-96 1996-97 1997-98 1998-99 1989-99Group assets/total assets All companies 748 -0.043 -0.891 -3.510* -1.661 -3.341* -2.374* -0.840 -0.655 -0.011 0.814 -11.89*All business groups 497 0.012 -1.071 -4.259* -1.685 -3.497* -2.512* -0.670 -0.883 0.142 1.019 -12.75*Large business groups 370 0.015 -1.251 -4.828* -1.641 -3.020* -2.029* -0.716 -0.537 0.330 0.872 -11.73*Top 50 groups 235 0.026 -1.331 -4.533* -1.177 -1.603 -1.676 -0.721 -0.389 0.115 0.859 -9.137*Group debt/total debt All companies 748 -1.027 -0.369 2.273* 0.002 2.528* -0.785 -2.684* -0.496 -0.948 -0.143 -1.521 All business groups 497 -0.601 -0.108 1.947 0.212 2.188* -1.299 -2.434* -0.629 -0.631 -0.219 -1.495 Large business groups 370 -0.549 -0.027 1.455 -0.156 2.535* -1.617 -2.290* -0.440 -0.102 -0.076 -1.268 Top 50 groups 235 -0.633 -0.339 0.838 0.068 1.863 -1.922 -2.191* -0.172 -0.311 0.272 -2.254** significant at the 95% level (2-tailed test)

C:\Documents and Settings\ECJB\Desktop\Website\Reasearchpapers\2002\4-02\erp02-4.doc 47
Table 20: Business Groups: unquoted non-financial companies
No. 1989 1990 1991 1992 1993 1994 1995 1996 1997 1998 1999 Claims on group companies (in proportion of total assets) All companies 139 0.009 0.010 0.018 0.020 0.052 0.060 0.102 0.103 0.100 0.111 0.136 All business groups 84 0.016 0.017 0.032 0.036 0.071 0.085 0.159 0.160 0.160 0.182 0.216 Large business groups 71 0.011 0.014 0.029 0.035 0.073 0.088 0.168 0.167 0.167 0.191 0.224 Top 50 groups 56 0.012 0.016 0.036 0.044 0.095 0.112 0.210 0.213 0.215 0.245 0.283 Group debt/total debt (in proportions) All companies 139 0.006 0.007 0.004 0.007 0.008 0.012 0.010 0.011 0.009 0.015 0.011 All business groups 84 0.012 0.015 0.006 0.011 0.012 0.016 0.012 0.013 0.010 0.018 0.009 Large business groups 71 0.013 0.017 0.007 0.013 0.013 0.018 0.013 0.015 0.011 0.020 0.010 Top 50 groups 56 0.022 0.022 0.007 0.016 0.014 0.020 0.014 0.016 0.011 0.021 0.011 Mann-Whitney tests 1989-90 1990-91 1991-92 1992-93 1993-94 1994-95 1995-96 1996-97 1997-98 1998-99 1989-99Group assets/total assets All companies 139 0.051 -0.192 -1.368 -1.046 -0.818 -0.036 -0.178 -0.463 0.146 0.053 -3.247*All business groups 84 0.057 -0.230 -1.554 -1.134 -0.803 -0.083 -0.152 -0.689 0.090 0.032 -3.510*Large business groups 71 0.194 -0.268 -1.576 -1.188 -0.469 0.000 -0.057 -0.666 0.089 -0.018 -3.176*Top 50 groups 56 -0.006 -0.372 -1.638 -1.161 -0.352 -0.036 -0.268 -0.583 0.082 0.069 -3.395*Group debt/total debt All companies 139 -0.517 -0.666 -0.185 0.688 0.758 0.480 -0.341 0.488 -0.124 0.366 0.776 All business groups 84 -0.758 -0.573 -0.127 0.320 0.531 0.259 -0.196 0.861 0.189 0.162 0.355 Large business groups 71 -0.651 -0.660 -0.213 -0.048 0.650 0.280 -0.172 0.581 0.289 0.321 0.228 Top 50 groups 56 -0.745 -0.244 -0.209 -0.117 0.145 0.594 -0.293 0.417 0.411 0.187 0.036 * significant at the 95% level (2-tailed test)

C:\Documents and Settings\ECJB\Desktop\Website\Reasearchpapers\2002\4-02\erp02-4.doc 48
1989 1990 1991 1992 1993 1994 1995 1996 1997 1998 19990
0.1
0.2
0.3
0.4
0.5
0.6
Proportions of total assets
Net fixed assets
Current assets
Financial inv.
Receivables
Inventories
Chart 1i. Quoted companies: assets

C:\Documents and Settings\ECJB\Desktop\Website\Reasearchpapers\2002\4-02\erp02-4.doc 49
1989 1990 1991 1992 1993 1994 1995 1996 1997 1998 1999
0
0.1
0.2
0.3
0.4
0.5
0.6
0.7
Proportions of total assets
Net fixed assets
Current assets
Group holdings
Receivables
Inventories
Chart 1ii. Unquoted companies: assets

C:\Documents and Settings\ECJB\Desktop\Website\Reasearchpapers\2002\4-02\erp02-4.doc 50
1989 1990 1991 1992 1993 1994 1995 1996 1997 1998 1999
0
0.1
0.2
0.3
0.4
0.5
Proportions of total assets
Shareholders
Debt
Current Liabilities
Bank debt
Chart 2i. Quoted companies: liabilities

C:\Documents and Settings\ECJB\Desktop\Website\Reasearchpapers\2002\4-02\erp02-4.doc 51
1989 1990 1991 1992 1993 1994 1995 1996 1997 1998 19990
0.1
0.2
0.3
0.4
Proportions of total assets
Shareholders
Debt
Current liabilities
Bank debt
Chart 2ii Unquoted companies: liabilities

C:\Documents and Settings\ECJB\Desktop\Website\Reasearchpapers\2002\4-02\erp02-4.doc 52
1989 1990 1991 1992 1993 1994 1995 1996 1997 1998 1999
0
0.2
0.4
0.6
0.8
1
Proportions
Debt/total assetsEquity/total assets
Chart 3i. Quoted companies: leverage

C:\Documents and Settings\ECJB\Desktop\Website\Reasearchpapers\2002\4-02\erp02-4.doc 53
1989 1990 1991 1992 1993 1994 1995 1996 1997 1998 19990
0.2
0.4
0.6
0.8
1
Proportions
Debt/total asetsEquity/total assets
Chart 3ii. Unquoted companies: leverage

C:\Documents and Settings\ECJB\Desktop\Website\Reasearchpapers\2002\4-02\erp02-4.doc 54
1989 1990 1991 1992 1993 1994 1995 1996 1997 1998 1999
0.15
0.2
0.25
0.3
0.35
Proportions
Bank debt/total debt
Debentures/total debt
Chart 4i. Quoted companies: debt composition

C:\Documents and Settings\ECJB\Desktop\Website\Reasearchpapers\2002\4-02\erp02-4.doc 55
1989 1990 1991 1992 1993 1994 1995 1996 1997 1998 19990
0.1
0.2
0.3
0.4
0.5
Proportions
Bank debt/total debt
Debentures/total debt
Chart 4ii. Unquoted companies: debt composition

C:\Documents and Settings\ECJB\Desktop\Website\Reasearchpapers\2002\4-02\erp02-4.doc 56
1990 1991 1992 1993 1994 1995 1996 1997 1998 1999
0
0.2
0.4
0.6
0.8
1
Proportions
Other externalGroup financingBank financingEquityInternal funds
Chart 5i. Quoted companies: sources of funds

C:\Documents and Settings\ECJB\Desktop\Website\Reasearchpapers\2002\4-02\erp02-4.doc 57
1990 1991 1992 1993 1994 1995 1996 1997 1998 1999
-0.5
0
0.5
1
1.5
Proportions
Other externalGroup financingBank financingEquityInternal funds
Chart 5ii. Unquoted companies: sources of funds

C:\Documents and Settings\ECJB\Desktop\Website\Reasearchpapers\2002\4-02\erp02-4.doc 58
1990 1991 1992 1993 1994 1995 1996 1997 1998 1999
0
0.5
1
Proportions
Other externalGroup financingBank financingEquityInternal funds
Chart 6i. Quoted companies: financing of gross investment

C:\Documents and Settings\ECJB\Desktop\Website\Reasearchpapers\2002\4-02\erp02-4.doc 59
1990 1991 1992 1993 1994 1995 1996 1997 1998 1999
-1.5
-1
-0.5
0
0.5
1
1.5
2
2.5
Proportions
Other externalGroup financingBank financingEquityInternal funds
Chart 6ii. Unquoted companies: financing of gross investment

C:\Documents and Settings\ECJB\Desktop\Website\Reasearchpapers\2002\4-02\erp02-4.doc 60