corona discharge
TRANSCRIPT

IONIZATION OF AIR BY
CORONA DISCHARGE
The members of the Committee approve the master’s thesis of Philip Koshy Panicker
Frank K. Lu Supervising Professor ______________________________________
George Emanuel ______________________________________
Bernard T. Svihel ______________________________________

Copyright © by Philip K. Panicker 2003
All Rights Reserved

IONIZATION OF AIR BY
CORONA DISCHARGE
by
PHILIP KOSHY PANICKER
Presented to the Faculty of the Graduate School of
The University of Texas at Arlington in Partial Fulfilment
of the Requirements
for the Degree of
MASTER OF SCIENCE IN AEROSPACE ENGINEERING
THE UNIVERSITY OF TEXAS AT ARLINGTON
August 2003

iv
ACKNOWLEDGEMENTS
I wish to thank Dr. Frank Lu, Director of the Aerospace Research Centre (ARC)
and Dr. Don Wilson, Chairman of the Mechanical and Aerospace Engineering
Department (MAE), for the opportunity to work at the ARC and for giving me the
Graduate Teaching Assistantship for the period of my research. I would like to thank
my advisors Dr. Lu, Dr. George Emanuel (MAE) and Dr. Bernard T. Svihel (Electrical
Engineering Department) for their guidance and direction. This project was funded by
Dr. Emanuel and the Mechanical and Aerospace Engineering Department, for which I
am very grateful. I would like to thank my project associate Satyanand Udhyavar for his
partnership and support in the project. I would like to thank Dr. Wei-Jen Lee, of the
Electrical Engineering Department, for his timely help with the electronic circuits. I
would like to thank Rod Duke of the ARC for his services in manufacturing the
hardware of the project and other technical help. I would like to thank my colleagues at
the ARC, Jason Myers and Chris Roseberry, for their help. I would like to thank Rafaela
Bellini for all her help and support.
I would like to thank my father Koshy Panicker, my mother Deenamma, my
brother John and my sister Anu for their love, support and prayers.
I want to thank my Lord and saviour Jesus Christ for all His blessings in my
life. May everything be for the glory of God.
July, 2003

v
ABSTRACT
IONIZATION OF AIR BY
CORONA DISCHARGE
Publication No. ______
Philip K. Panicker, MS
The University of Texas at Arlington, 2003
Supervising Professor: Frank K. Lu
The objective of this project is to create low density plasma by generating
corona discharge by applying a high dc potential in a test section, consisting of a steel
tube with a wedge shaped electrode. Once ionization has been initiated, a probe is
introduced into the plasma to detect plasma characteristics at various axial distances
away from the test section. This is to measure how far away from the electrodes the
plasma persists in the air. A high voltage dc power supply has been designed and
assembled specifically for this project. This study is a precursor to an upcoming
research study to ionize supersonic air in a shock tunnel by the same corona discharge
method. Therefore the test section built for this study is designed to fit onto a shock
tunnel. The high voltage dc power supply is also designed to be applied to the

vi
supersonic corona discharge study. This study will help in the design of diagnostic
probes and apparatus for the analysis of plasma created within the supersonic flow in
the upcoming project. Results from this study show that corona discharge is taking
place and it has been verified visually and by measurements of voltage and current and
ions emanating into the ambient air from the test section have been detected. These
results show that the test section, the power supply and other apparatus developed can
be applied to the supersonic corona discharge study.

vii
TABLE OF CONTENTS
ACKNOWLEDGEMENTS....................................................................................... iv ABSTRACT .............................................................................................................. v LIST OF ILLUSTRATIONS..................................................................................... xi LIST OF TABLES..................................................................................................... xiv LIST OF ABBREVIATIONS AND SYMBOLS...................................................... xv Chapter 1. INTRODUCTION ............................................................................... 1 1.1 Plasma studies in Aerospace Engineering ............................................... 1 1.1.1 Previous Research .................................................................... 1 1.2 Previous Plasma Related Work at UT Arlington..................................... 2 1.3 Brief Description of This Project............................................................. 4 1.3.1 Applications for this Study ....................................................... 6 1.3.2 Overview of the Experimental Setup........................................ 6 2. THE CORONA DISCHARGE PHENOMENON......................................... 8 2.1 Plasma……………............................................................................. 8 2.1.1 Properties of Plasma ................................................................. 10 2.2 Ionization of Air…………….............................................................. 11 2.2.1 Particle Impact Ionization......................................................... 12

viii
2.2.2 Thermal Ionization.................................................................... 12 2.2.3 Nuclear Emission...................................................................... 13 2.2.4 Photo or Irradiative Ionization.................................................. 13 2.2.5 Electric Field Ionization ........................................................... 13 2.3 Corona Discharge……………............................................................ 14 2.3.1 Features of Corona Discharge .................................................. 15 2.3.2 Corona vs. Arcs and Sparks...................................................... 19 2.3.3 Earlier Work Involving Corona Discharge............................... 20 3. DESIGN OF THE HIGH VOLTAGE POWER SUPPLY…………………. 22 3.1 Requirements of the Power Supply..................................................... 22 3.2 Types of High Voltage Generators ..................................................... 23 3.2.1 Voltage Multipliers................................................................... 24 3.2.2 Van de Graaff Generator .......................................................... 25 3.2.3 Tesla Coil………...................................................................... 25 3.2.4 Step-Up Transformer and Rectifier Power Supply................... 26 3.2.4.1 Fly Back Transformer or Line Output Transformer .... 26 3.2.4.2 Microwave Oven Power Supply .................................. 28 3.2.4.3 Ignition Transformers .................................................. 29 3.2.4.4 Neon Transformer ........................................................ 29 3.3 The Neon Transformer........................................................................ 31 3.3.1 Normal Power Transformer Operation..................................... 32 3.3.2 Power Factor............................................................................. 33
ix
3.3.3 Features………......................................................................... 34 3.4 The Autotransformer........................................................................... 36 3.5 The Diodes………….......................................................................... 38 3.6 The Capacitor……….......................................................................... 44 3.7 The Power Relays…………. .............................................................. 45 3.7.1 Electromechanical Relays vs. Solid State Switches ................. 47 3.7.2 Power Relays Used in the Circuit ............................................. 48 3.8 DC Voltage Measurement…………................................................... 49 3.9 The Control Box…………. ................................................................ 52 3.10 Features of the High Voltage Power Supply………......................... 54 3.10.1 Current Limiting and Capacitor Discharging Resistors.......... 59 3.11 Current Measurement of the High Voltage DC Output……............ 62 3.12 Safety Features of the High Voltage DC Power Supply................... 63 3.13 Drawbacks of the High Voltage DC Power Supply…….................. 64 3.14 Operation of the High Voltage DC Power Supply…….................... 65 4. THE CORONA DISCHARGE TEST SECTION ................................................ 69 4.1 Features of the Design ........................................................................ 69 4.1.1 Mechanical Aspects of this Design........................................... 70 4.1.2 Electrical Aspects of this Design.............................................. 71 5. ION DETECTION PROBES………………….................................................... 74 5.1 Langmuir Probes…............................................................................. 76 5.2 Probes Used in the Bench Test ........................................................... 78

x
6. BENCH TESTING OF TEST SECTION IN STATIC AND SLOW SPEED AIR………….. .................................................................. 81 6.1 Bench Test Results.............................................................................. 81 6.2 Malter Effect……….. ......................................................................... 85 6.3 Results of the Ion Detector Probes...................................................... 87 7. CONCLUSION AND RECOMMENDATIONS ................................................. 89 7.1 Conclusion…..….. .............................................................................. 89 7.2 Recommendations…........................................................................... 90 Appendices A. CIRCUIT DIAGRAM OF THE HIGH VOLTAGE AC GENERATOR...... 92 B. CIRCUIT DIAGRAM OF THE HIGH VOLTAGE DC POWER SUPPLY 94 C. CIRCUIT DIAGRAM OF THE CONTROL BOX ................................... 96 REFERENCES .......................................................................................................... 98 BIOGRAPHICAL INFORMATION......................................................................... 102

xi
LIST OF ILLUSTRATIONS
Figure Page 1.1 The Hypersonic Shock Tunnel of the ARC .................................................... 3 1.2 Schematic of the Detonation Driven Shock Tube........................................... 3 1.3 Schematic of the Conventional Shock Tube ................................................... 4 1.4 Schematic of the Experimental Setup ............................................................. 7 2.1 A Pulse Waveform .......................................................................................... 19 3.1 Voltage Multiplier Circuit............................................................................... 24 3.2 Schematic of the High Voltage DC Power Supply ......................................... 30 3.3 Schematic of a Transformer ............................................................................ 33 3.4 Current Lagging Voltage by 60o ..................................................................... 34 3.5 Schematic of a Neon Transformer .................................................................. 35 3.6 The Circuit Diagram of an Autotransformer................................................... 36 3.7 Connection of the Autotransformer to the Neon Transformer........................ 37 3.8 Single Phase Full Wave Rectifiers .................................................................. 38 3.9 Cascading of Diodes to Get a Higher PIV Rating........................................... 42 3.10 The Neon Transformer Output Connected to a Bridge Rectifier .................... 43 3.11 Rectifier with Capacitor Filter......................................................................... 44 3.12 Power Supply with the Power Relays at the Output Before the Test Section. 46 3.13 An SCR in the On Mode (left) and Line Commuted SCR.............................. 48

xii
3.14 The Voltage Divider and Digital Voltmeter Across the Capacitor ................. 50 3.15 The Front and Rear Panel of the Control Box................................................. 54 3.16 Schematic of the Power Supply ...................................................................... 55 3.17 Schematic of the High Voltage AC Power Supply’s Top Panel ..................... 58 3.18 Circuit Showing the Current Limiting, Capacitor Discharging and Voltage
Measurement Resistors.................................................................................... 61 3.19 Current Measurement Circuit.......................................................................... 62 4.1 Top and Side View of the Test Section........................................................... 69 4.2 A Side View Showing the Imperfection in Level of the Lexan and the Steel
Surfaces............................................................................................................ 72 5.1 Langmuir Probes, single (left) and double (right) types ................................. 76 5.2 Probe Characteristic Length ............................................................................ 77 5.3 Single Probe Circuit ........................................................................................ 79 5.4 Dual Probe Circuit........................................................................................... 79 5.5 The Probe Needles .......................................................................................... 80 6.1 Setup for Bench Testing.................................................................................. 81 6.2 Voltage-Current Characteristics of Corona for the Test Section .................... 83 6.3 Voltage-Current Characteristics for Negative Corona Before and After the
Application of Ceramic Cement ...................................................................... 84 6.4 Electrons Released from the Surface of the Insulator on the Cathode due to
Malter effect..................................................................................................... 85 6.5 Side View of the Test Section Showing the Ceramic Cement Application
Overlapped on the Wedge ............................................................................... 86

xiii
6.6 The Waveform Picked up by the Ion Detector Probes.................................... 87 6.4 Proposed New Probe Circuit ........................................................................... 88

xiv
LIST OF TABLES
Table Page 3.1 Rectifier Performance Factors......................................................................... 40
6.1 Initial Bench Test Results ............................................................................... 82

xv
LIST OF ABBREVIATIONS and SYMBOLS
A, mA, µA Ampere, milli Ampere, micro Ampere
AC, ac Alternating Current
Atm Atmospheres
C Coulombs
DC, dc Direct Current
DPDT Double Pole Double Throw (Relays and Switches)
DPST Double Pole Single Throw (Relays and Switches)
ε0 Permittivity of vacuum (and air) = 8.852 x 10⁻¹² F/m.
e Charge of an electron (1.602 x 10⁻¹⁹ C)
Ei Ionizing Potential [eV]
eV Electron Volt
E Electric Field Intensity [V/m]
F, µF Farad, micro Farad
GTO Gate Turn Off Transistor
H, mH Henry, milli Henry
Hz, kHz, MHz Hertz, kilohertz, megahertz
i1, i2 Currents of primary and secondary windings of transformer
i.d. Inner Diameter
Idc DC current output of rectifier
in. Inch
Ip Probe current
Is RMS current output of transformer secondary winding
k Boltzmann’s constant (1.3807 x 10⁻²³ J/K)

xvi
KE Kinetic Energy
λD Debye Length
LxBxH Length x Breadth x Height
LED Light Emitting Diode
m, cm, mm metre, centimetre, millimetre
M Average mass of particles in a plasma
n, ne, n(v) number of, number of electrons, number of particles of velocity v
N Total number of particles in a plasma
N1, N2 Number of turns of primary and secondary windings of
transformer
NC Normally Closed (relays and switches)
NO Normally Open (relays and switches)
NC Normally Closed (Relays and Switches)
NO Normally Open (Relays and Switches)
Ω, kΩ, MΩ Ohm (Unit of Resistance), kilo Ohm, mega Ohm
o.d. Outer Diameter
π 3.14159265
φ Magnetic Flux [unit is Weber (Wb)]
Φ Phase angle between voltage and current
φs Plasma Potential
φp Probe Potential
pf Power Factor
PIV Peak Inverse Voltage (rating for diodes)
PVA VA rating of the transformer
ℜ Reluctance [unit is Henry-1]
Re1, Re2 Power relays at the output stage of the HV DC power supply
xvii
RL Load Resistance
RMS Root Mean Square
s, ms, ns second, milli second, nano second
SCR Silicon Controlled Rectifier
SPDT Single Pole Double Throw (Relays and Switches)
SPST Single Pole Single Throw (Relays and Switches)
T, Te Temperature, temperature of electron
Up Applied Probe Potential
UV, uv Ultra violet
v Average velocity of particles in a plasma
V1, V2 Voltages of primary and secondary windings of transformer
V3 Voltage across secondary of neon transformer
V, kV Volt, kilo Volt
VA, kVA Volt-Ampere, kilo Volt-Ampere
Vdc DC voltage output of rectifier
Vs RMS voltage output of transformer
Vr Voltage read by digital Voltmeter across the Capacitor
W, kW, MW Watt, kilowatt, Megawatt

1
CHAPTER I
INTRODUCTION
1.1 Plasma studies in Aerospace Engineering
In the simplest terms, plasma is ionized gas. Plasmas have received a lot of
attention in aerospace engineering recently. Plasma studies took off in the 1920s and
developed into a broad and specialized field. Integration of the aforementioned two
disciplines will most likely result in numerous technological breakthroughs. A quick
review of some recent research in this direction is presented below.
1.1.1 Previous Research
Studies in electro and magneto hydrodynamics have been progressing for
applications such as propulsion, flow actuation and electric power generation. Miniature
thrusters called Hall thrusters [1] as small as a few millimetres in diameter, have been
developed, that use plasma for space propulsion. Hall thrusters accelerate plasma by
applying an electric field in the direction of the flow and a magnetic field perpendicular
to the flow. They can produce high thrust densities, with efficiencies of about 50%.
Such propulsion devices can be used for manoeuvring small spacecraft or propelling
small satellites.
An investigation on the electrohydrodynamic actuation of flow over a flat plate
was performed by Artana et al., [2] for low speed air flows in the range of 11 to 17.5
m/s. The study used a high voltage dc (20 to 40 kV) to create a plasma sheet on the

2
surface of the plate. By altering the electric field intensity, the flow over the plate was
shifted, causing changes to the size of the boundary layer. Thus it is possible to regulate
the fluid to surface heat transfer and bring about drag reduction.
The effects of electrostatically generated plasma on shock waves were studied
by Yano et al. [3], in wind tunnel tests at Ohio State University. Plasma was generated
in the high pressure supersonic flow by high voltage dc corona discharge (>30 kV).
Shocks were formed by the flow over a wedge. However, their results showed that there
was no detectable shock mitigation due to the weakly ionized flow compared to a non-
ionized flow. One interesting aspect of the study is that flow visualisation was made
simpler due to the corona discharge, with the shock waves clearly visible in the glow
and vivid colour pictures could be taken by a hand-held 35 mm camera. Some further
work involving corona discharge is presented in chapter 2, after the phenomenon of
corona discharge has been properly introduced.
1.2 Previous Plasma Related Work at UT Arlington
At the Aerodynamic Research Centre (ARC) of the University of Texas at
Arlington several experimental studies have been conducted involving plasma in
supersonic flows. Figure 1.1 shows the hypersonic shock tunnel [4] of the ARC in
its original configuration. This shock tunnel was modified by replacing a part of the
driven tubes with smaller diameter steel tubes. A specially made conductivity channel
was constructed from copper plates so that the conductivity of the gas flowing through
it could be measured. This setup, as shown in figure 1.2, is described in the paper by
Stuessy et al. [5]

3
Figure 1.1: The hypersonic shock tunnel of the ARC.
Figure 1.2: Schematic of the Detonation driven shock tube. The conductivity channel experiments [6] consisted of detonating hydrogen and
oxygen and seeding the combustion products with potassium carbonate powder. This
combined mixture was blown down the driven tube by the force of the detonation. The
fluid passed through the conductivity channel, across which a high voltage of 8kVdc
Driver Tube
Driven Tube
Carriages on Rails
Test Section
Nozzle Diffuser
VacuumTank
3 m 8.2 m 2.1 m
0.61 m
1.8 m
Ø 33 cm
Ø 15 cm i.d.
15.7 m
3.36 m 3.5 m
End MylarDiaphragm
H. P. Driver TubeØ 152.4 mm i.d.
ThrustStand
Double SteelPlate
Diaphragms
ConductivityChannel
Detonation Tube
Carriages on Rails
3.05 m
Ø 152.4 mm i.d.
2.74 m
Ø 41.25 mm i.d.
3.5 m
Single MylarDiaphragm
Driven Section
4
was applied, where the conductivity was measured and analysed. However, the results
did not corroborate theoretical values of conductivity and measured values were found
to be lower.
1.3 Brief Description of This Project
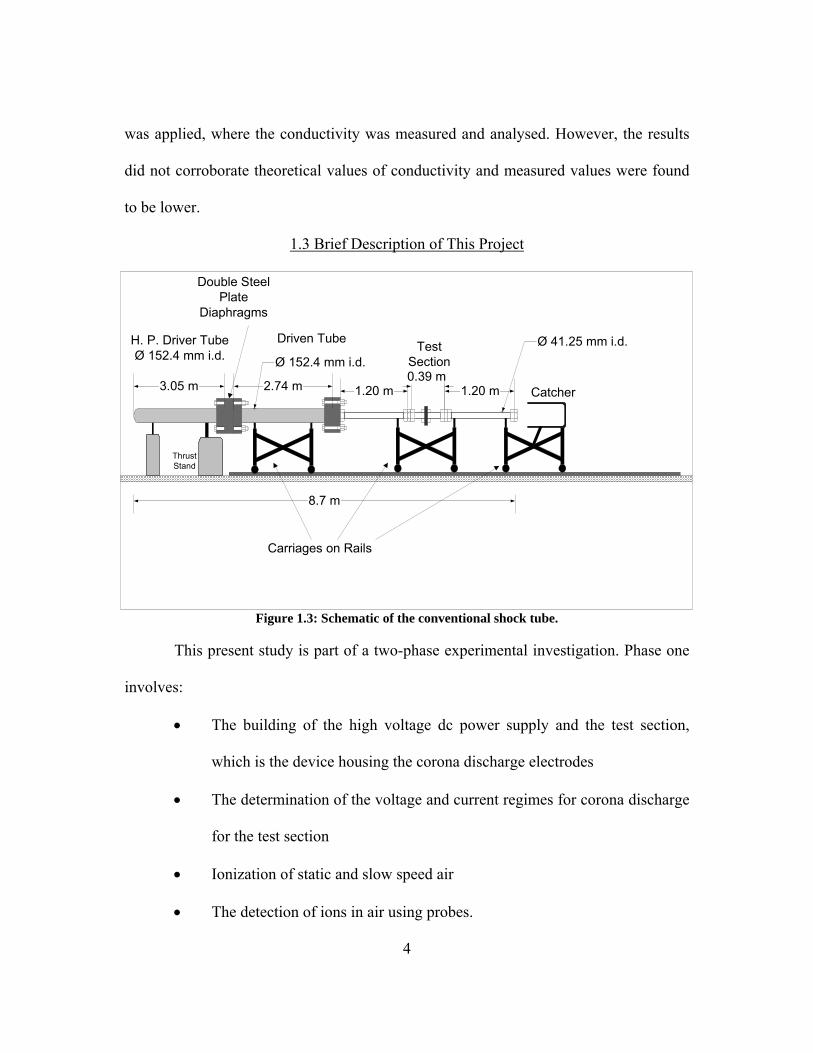
Figure 1.3: Schematic of the conventional shock tube.
This present study is part of a two-phase experimental investigation. Phase one
involves:
• The building of the high voltage dc power supply and the test section,
which is the device housing the corona discharge electrodes
• The determination of the voltage and current regimes for corona discharge
for the test section
• Ionization of static and slow speed air
• The detection of ions in air using probes.
1.20 m0.39 m
1.20 m Catcher
H. P. Driver TubeØ 152.4 mm i.d.
ThrustStand
Double SteelPlate
Diaphragms
TestSection
Driven Tube
Carriages on Rails
3.05 m
Ø 152.4 mm i.d.
8.7 m
2.74 m
Ø 41.25 mm i.d.

5
Phase two is the application of corona discharge in supersonic flows, to be
carried out by Satyanand Udhyavar as part of his Ph.D. research. In phase two, the test
section is to be fitted into the shock tube. When a supersonic flow is established through
the test section, a high dc voltage is to be applied to the electrodes to induce corona
discharge ionization. Probes introduced into the flow along the tube will detect ion
current and voltages, to determine the ion density and temperature.
This project inherited a lot of the equipment and apparatus from the earlier tests
carried out at the ARC. The supersonic tests are to be carried out in the same shock tube
which has been modified to run in a conventional shock tube configuration, as shown in
figure 1.3. The driver tube in this case can be filled with compressed air or helium. The
test section is designed to fit into the driver section, such that it is electrically isolated
from the rest of the facility.
As seen in figure 1.3, the shock tunnel now looks quite different from the earlier
configuration. A large portion of the tubes has been removed. A catcher assembly was
built to catch the high velocity flow as it blows out of the shock tunnel. The catcher is
held in place by heavy chains, which are not shown in the picture.
Another major difference to the shock tunnel is the triggering mechanism for the
data acquisition system (DAQ). Earlier, a trip-wire in the end Mylar diaphragm, shown
in figure 1.2, was used to trigger the DAQ. The shortening of the shock tubes meant that
this diaphragm could not be placed before the test section. A proposed technique is to
use the signal from a pressure transducer to trigger the DAQ.

6
1.3.1 Applications for this Study
The ramifications of supersonic combustion engines are insufficient fuel-air
mixing and inefficient combustion. The length of mixing and combustion chambers
may be increased to counter this [7]. However, this solution adds its own problems of
added weight, increased drag and reduced payload.
Ionizing the air-fuel mixture prior to combustion by means of high voltage
corona discharge will result in the creation of free electrons, ions and free radicals in the
air stream. This is a way to add enthalpy to the flow while making it more conductive
and reactive. Thus lower energy is required to ignite the mixture in the combustion
chamber. It is hoped that this will thereby increase the efficiency of the process. Corona
discharge consumes very little electrical power. The electrical apparatus for the
generation and sustenance of the corona can be designed to be very light weight and
compact, saving weight and space, two important criteria for aerospace vehicles.
1.3.2 Overview of the Experimental Setup
Figure 1.4 shows a schematic of the corona discharge apparatus. The high
voltage dc power supply has a variable output of 0-15 kVdc. The power supply is
connected to the test section through a pair of high voltage control relays. The
connectors of the power supply are such that the polarity of the output can be switched
manually. A digital voltmeter on the output side reads the voltage being applied on the
test section. A digital ammeter measures the current being delivered. These equipment
are explained in chapter 3.
The test section consists of a steel tube with a triangular steel wedge inserted

7
through a cut-out section in the tube and held in place by supports made of Lexan [8], a
plastic made by General Electric. Lexan also provides the electrical insulation between
the two electrodes, that is, the wedge and the steel tube itself. The test section is
described in chapter 4.
Figure 1.4: Schematic of the experimental setup.
When the contacts of the relays are closed, corona discharge takes place if the
electrical potential is high enough. The ions produced diffuse outwards due to thermal
and ionic convection or can be blown through the test section by a blower fan.
A probe placed outside of the tube detects the ions and the waveform is
observed on a digital oscilloscope. The probe can be moved in an axial direction of the
test section so that plasma properties can be measured spatially. The probe and the
detection method are detailed in chapter 5.
Variable High Voltage DCPower Supply
0-15000 V
A
V
Digital Voltmeter
Ammeter
Control Relays
Test Section
Wedge Electrode
+-
+ -
+ -
+-- +
-
-
+ -+-
-+
-
-+-
-
+-
+-
-+
Digital StorageOscilloscope
Probe Circuit
Probe
CoronaDischarge
Ions
FanBlower

8
CHAPTER II
THE CORONA DISCHARGE PHENOMENON
Before corona discharge can be explained, some basic concepts such as plasma
and the phenomenon of ionization have to be introduced. This chapter is a brief and
mostly qualitative description of these topics.
2.1 Plasma
There are five states of matter:
1. Solid
2. Liquid
3. Gas
4. Plasma
5. Bose Einsteinium Condensate
The first three are well known. The last one, BEC [9,10], is a state of matter
predicted by Albert Einstein using mathematical formulations developed by Satyendra
Nath Bose, in the early 1920s. It occurs when atoms, cooled down to a fraction of a
degree above absolute zero, coalesce together to form a “super atom” that behave as one
entity. BEC was created in a lab at the University of Colorado at Boulder by a team
headed by Carl E. Wieman of UC-Boulder and Eric A. Cornell of the National Institute
of Standards and Technology in 1995. They won the Nobel Prize in Physics in 2001 for
this achievement.

9
Plasma is a gaseous mixture of free electrons and ions that have a high mean
kinetic energy. The charge carriers influence each other due to their inherent charges
and energies, and are also influenced by external fields. The physical properties of
plasmas are notably different from that of other fluids that they have been classified as
the fourth state of matter.
The term ‘plasma’ for ionized gas was introduced in 1927 by Irving Langmuir
[11,12], the 1932 Nobel Laureate in Chemistry, because the way high velocity
electrons, ions and particles flow in the medium reminded him of the way blood plasma
carried corpuscles and other matter. Langmuir also invented the electrical probes that
bear his name that are used to measure plasma properties such as charge carrier density
and temperature. Langmuir probes will be examined further in chapter 5. Since the
1920s, plasma science has developed rapidly and has evolved into a field of its own. In
industry today plasma is used in a variety of services some of which are to manufacture
semiconductors and medical products, in lighting and lasers, welding technology and
also in plasma based space propulsion systems. The potential application for the
generation of plasma in this study is in supersonic combustion engines of the future.
About 99% of the universe is in the plasma state. Solar and stellar matter is
plasma. These are classified as high temperature plasmas. Other examples of HTP
would be the hot plasma created in nuclear fission and fusion reactions. On earth,
plasma is found in the ionosphere, which can be grouped along with the aurora borealis
or Northern Lights as low temperature plasma. Plasma also occurs in the atmosphere in
lightning. The densities of plasma in the core of the sun and stars are very high, being

10
about 1030 particles cm-3 at a temperature of about 15 million Kelvin. In the solar corona
plasma density is of the order of 108 cm-3 at temperatures of about 106 K. In fires and
flames the plasma density is roughly at the same level but the plasma is at a much lower
temperature. Arcs and lightning produce plasma of densities in the region of 1018
particles cm-3 with temperatures in the thousands of Kelvin. Fluorescent and neon lights
produce light by exciting low pressure plasma in glass containers with densities of
about 105 particles cm-3 and at temperatures of a few hundred degrees Celsius [13].
On the other hand, the plasma that is being generated in this study is of very low
density, in the order of 106 cm-3 at low temperatures in the region of 300 K and may be
termed weakly ionized gas.
2.1.1 Properties of Plasma
Neutral plasmas contain an equal number of positive and negative charge
carriers, such that the net charge is zero. As a result of the charge carriers, plasma is a
conductive fluid [14].
The most significant property of plasma is that it is strongly influenced by
electric and magnetic fields. The effect of electric field on a charge is described by
Coulomb’s law
EqFE
rr= (2.1)
where EFr
is the Coulomb force exerted on the particle of charge q in Coulombs and Er
is the electric field in V/m. The force exerted on the charge is independent of its
velocity.

11
The effect of magnetic field on a charge is expressed in Lorentz’ law which is
given as
BvqFB
rrr×= (2.2)
where BFr
is the Lorentz’ force in N, exerted on a moving charged particle, q is the
charge of the particle in C, vr is the velocity of the particle in m/s and Br
is the magnetic
field in T. The direction of this force can be determined by the right hand rule; the
thumb shows the direction of the velocity, the index finger, the magnetic field and the
middle finger, the force. According to Lorentz’ law, with velocity there is a linear
increase in the force exerted on the charged particle. Thus at high speeds, magneto
hydrodynamics is a viable option for flow actuation.
Each charge carrier in the plasma simultaneously applies Coulombic forces on
one another. This results in the strong force interactions and the formation of sheaths
within the fluid. These properties of plasma explain why plasma is important to electro-
magneto hydrodynamics [15].
2.2 Ionization of Air
A few methods of ionizing air or gas are mentioned below [16]:
1. Particle Impact Ionization
2. Thermal Ionization
3. Nuclear Emission
4. Photo or Irradiative Ionization
5. Electric Field Ionization:
(a) Arc Discharge Ionization
(b) Corona Discharge Ionization

12
2.2.1 Particle Impact Ionization
When an atom is struck by a particle, such as an electron or an ion, it can lose or
gain a charge depending on the amount of energy transferred in the impact. This energy
has to exceed the ionization energy Ei expressed in eV, where e (1.6x10⁻¹⁹ Coulombs) is
the absolute value of the charge of an electron. In the case of electron impacts, the
electron can be absorbed by the atom or it can cause the atom to lose electrons or just
excite the valence electrons of the atom. An electron source is required to generate
enough electrons to ionize the gas and sustain the electrons so that they last long enough
to cause ionization and the electrons have to be accelerated by means of an electric or
magnetic field. Electrons released in the ionization process can produce secondary
ionization if their energies are high enough.
In place of electrons, ions can be accelerated and made to collide with and
ionize atoms. Ions are heavier particles and therefore require much more effort to
accelerate to attain the required ionization energy. This can be done in a particle
accelerator or by means of strong electric or magnetic fields. Nuclear reactions emit
ions that have high energies that can be used in ionization of gases. However this is not
a safe approach for a study of ionization for supersonic flows.
2.2.2 Thermal Ionization
All matter above 10,000 K exists in the plasma state. And fire is filled with Ions
and free radicals. If a gas is heated to suitably high temperatures the energies of the gas
constituents become high enough to induce ionization within the medium. The
requirement of such high temperatures and the problem of contaminants in air make this
13
an impractical approach for this study.
2.2.3 Nuclear Emission
Fusion reactions involving hydrogen emit H+ and He+ ions with very high
energies in the order of MeV. Fission reactions of heavier atoms release high energy
ions that can cause secondary ionization. However, this method of ionization would not
be feasible for a small scale laboratory study. They cannot be adapted safely for
application in a shock tunnel.
2.2.4 Photo or Irradiative Ionization
An ionisable atom can be ionized by the impact of a photon if the photon’s
energy hν exceeds the ionization energy of the atom. Ultraviolet rays, x-rays and
gamma rays are preferred for photo ionization. However, if the photon energy is far
greater than the threshold ionization energy, the probability of ionization decreases. The
degree of ionization is also lower for this method. Due to this fact and also the difficulty
in adapting this technique to work in a shock tunnel, it is not viable for ionization of
supersonic air.
2.2.5 Electric Field Ionization
This method involves passing the gas in between ionized electrodes. When the
atoms or molecules come in contact with the surface of the metal electrodes, they lose
or gain a charge subject to the polarity of the electrode. However, the electric field
density has to be as high as a few kV/m to initiate ionization. The geometry of the
electrodes is also important as electric fields around sharp objects and metallic surfaces
with low radii of curvature are stronger than around blunt bodies. As the intensity of the

14
electric field is increased, the particles approaching the electrode are ionized before
reaching it. The rate of ionization falls off as the intensity of the electric field is
decreased. It is thought that at higher pressures and velocities of air, higher electric field
strengths will be required. Electric field ionization is preferred because it is easy to
generate and control high electric fields in the lab. Geometries of the electrodes can be
varied and manufactured as desired.
When the intensity of the electric field increases beyond the breakdown
potential of the gas, an arc discharge takes place. This is characterised by a heavy flow
of current through the gas between the electrodes and high dissipation of energy in the
form of heat followed immediately by a loud exploding sound. Although this method
can yield high concentration of ions and higher charges of the ions (2+, 3+, 4+ or higher
charges), it is not favoured because of damage to the electrode and apparatus, electrode
heating, instability of the arcs and the high energy dissipation. Corona discharge is on
the other hand, a low energy discharge that produces lower density ionization at the cost
of a few mW of power. It is for this reason of low power consumption that this method
of ionization has been adopted for this study.
2.3 CORONA DISCHARGE
Corona is derived from the French word for crown. Corona has been known for
centuries by mankind, and often had supernatural properties ascribed to it. In Europe, it
was known as St. Elmo’s fire, named after St. Erasmus, the patron saint of sailors
because it was often seen by sailors as a bluish-white flame on top of masts and sails of
ships, often after a thunder storm, and was thus seen as a good sign from the gods. It

15
was reportedly seen by many sailors throughout history, including Julius Caesar,
Magellan, Columbus and Charles Darwin, on his voyage aboard the H.M.S. Beagle.
William Shakespeare even mentioned it in his play “The Tempest.” Corona is also seen
on aircraft wing tips, propellers and antennae. Corona discharge is seen as a faint glow
around high voltage conductors, especially on transmission lines around broken strands.
Corona discharge is used in air purifiers to clean air by ionizing the air. Ozone is
a by-product of corona discharge and it is used to kill microbes and neutralize airborne
contaminants. Corona discharge on transmission lines cause power loss and damage to
the conductors and degrade the insulators. Thus power companies spend large sums of
money to detect corona discharge on transmission lines and prevent them. Corona
discharge on transmission lines has been known to cause radio frequency noise that
interferes with communication signals. High frequency antennas are often fitted with a
ball at the top to avoid ending in a sharp tip that is prone to corona discharge.
2.3.1 Features of Corona Discharge
Corona [17] is observed in many forms, including glows and haloes, spots,
brushes and streamers. The potential at which corona is found to originate is called
corona threshold voltage. Above this voltage, there is a limited region, in which
current increases proportionately with voltage. This is called the Ohm’s law regime.
After this region, the current increases more rapidly, leading to the complete breakdown
and arcing or sparking at a point called the breakdown potential.
Corona discharge is highly dependant on geometry. Electric field intensity is
higher around the surface of a charged conductor with higher curvature or lower radii of

16
curvature. If Q is the total charge stored in a conductor and r is its radius of curvature,
the electric field intensity E is inversely proportional to the radius, as given by the
following equation, where ε0 is the permittivity of free space (and air) and is equal to
8.852 x 10⁻¹² F/m.
r
QE04 επ
= (2.3)
Therefore, as r decreases, the intensity of the electric field increases. This is why
lightning conductors are made sharper and why antennas have to be protected from
corona discharge.
When the electric field intensity increases, it affects the electrons in the atomic
orbitals and may cause atoms or molecules to polarize or liberate electrons. The
maximum electric field that a dielectric material can withstand without conduction is
known as the dielectric strength of that material and is expressed in V/m or often
V/mm. When the electric field increases beyond the dielectric strength, the material
becomes conducting by a process called avalanche effect, whereby electrons collide
with the atomic or molecular structure, releasing more electrons which in turn lead to
the further breakdown of the material. Large currents are possible at breakdown. The
dielectric strength of air at normal temperature and pressure is 3 kV/mm. At this point
air ionizes rapidly and arcing occurs. This is what happens during a lightning strike.
Corona discharge occurs below the breakdown potential, where the electrons are excited
and release electro-luminescence. Therefore there is no massive destruction of the
material.

17
An electron that is excited by an electric field E will ionize an atom or molecule
of a gas if it has enough energy, called the ionizing potential of the particular gas,
expressed in eV. This is shown as below.
A + e → A+ + 2e (2.4)
Thus an extra electron is liberated in this process. However, if the electron does
not have enough energy, it can impart a certain amount of kinetic energy to the particle
it collides with:
A + e + KE → A* + e (2.5)
This kinetic energy gained by the atom is released as photons having a certain
energy and wavelength, resulting in the glow associated with corona discharges. If the
energy of the photon is below that of the ionizing potential, it is absorbed by other
atoms and may be re-released. If the energy of the photon exceeds the ionizing
potential, the atom struck by the photon can release one or more electron depending on
the energy level. This can result in a chain reaction, where by ionization is initiated in
the gas.
Air is composed of nitrogen (78%), oxygen (21 %), argon (0.93 %), carbon
dioxide (0.03 %), water vapour and particulate matter like dust, pollen, etc. One of the
main products of corona is ozone. Oxygen ions are of the type O+, O2+, O-, O2- and O3
-.
These combine to produce ozone. Molecular nitrogen also dissociates to form nitrogen
oxides which are unstable that lead to reaction with oxygen to create more ozone. Water
molecules produce ions of OH, H and O types of both negative and positive charges.
Moisture content in the air increases its conductivity and tends to cause break down at a

18
lower potential. This is observed during thunderstorms leading to frequent lightning.
Ionized air also contains free electrons. However, electrons being lighter have short life
times and are absorbed by heavier particles and may result in the release of more
electrons.
Dust particles are found to increase ionization rates. This has been observed in a
phenomenon called Malter effect and experimentally verified in this study. This will be
explained further in chapter 6.
When corona discharge is induced across two similar electrodes, it is called a
bipolar corona. If one of the electrodes is made in a shape advantageous to corona
discharge, i.e., with a lower radius of curvature compared to the other, a uni-polar
corona is formed, as the corona discharge would be almost entirely concentrated around
the electrode with higher curvature, which is termed the active electrode. If the active
electrode is made positive with respect to the passive electrode, a positive corona
discharge occurs. And if the active electrode is made the cathode, a negative corona is
generated.
Corona can be generated by a high dc potential or ac, in which case it can be
sinusoidal or pulsed, as shown in figure 2.1. Tesla coils, that generate dramatic corona
discharge effects, operate at high frequencies of about 300 kHz. Corona has been found
to be more intense at higher frequencies. Pulsed power is especially preferred for
industrial applications. In the case of pulsed power discharges, the duty cycle of the
waveform can be modified to alter the power consumption or the rate of ionization.
Also the dc offset can be changed to vary the effects.

19
Figure 2.1: A Pulsed power waveform.
2.3.2 Corona vs. Arcs and Sparks
Corona occurs at high electric field intensities, but lower than the dielectric
strength of the medium. Therefore, it is a low current, low power discharge with a low
intensity photo emission. Arcs and sparks occur when the dielectric strengths have been
crossed. Thus they essentially short out the voltage, creating a high current, high power
discharge, with high heat and luminescence.
Corona discharge is sustained over a longer period of time, as long as the
electric field is applied. Arcs and sparks are quickly extinguished, as the energy stored
in the source of the electric field is dissipated by the discharge.
The heating caused by corona is not as significant as that of arcs and sparks,
although it is a cause of concern to power companies, where miles and miles of
transmission lines can create a significant loss by corona discharge over a long period of
time. Corona discharge dissipates a few W of power, but usually much below that, in
the region of mW or less. However, arcs can consume hundreds, thousands or more W
of power in the fraction of a second.
Corona is faintly visible in the shorter visible wavelengths, in the blue and violet
range, but most of it is UV. Heating can be observed by infra red cameras. Arcs and
T
T1
T2

20
sparks are mostly visible and they release waves in the UV through infrared spectrum.
2.3.3 Earlier work involving Corona Discharge
Many studies have been done involving corona discharge both in aerospace
fields as well as others that might be noteworthy to the present study. These are briefly
described below.
Anikin et al. [18], performed experimental and numerical studies to create
plasma by applying pulsed high voltage in atmospheric (1 atm) and low (0.1 to 30 Torr)
pressure air. The set up was a cone shaped positive electrode, whose distance from the
passive electrode, a flat disk could be varied from 0 to 30 cm. The corona was detected
by optical means. At 1 atm pressure, the pulse was in the form of a fast rising peak of
75 ns duration and frequency of 1.2 kHz. The peak amplitude was 9 kV. Anikin et al.
observed streamers that increased in intensity with the voltage. For low pressure air,
voltage pulses of 10 to 15 kV were applied, with a duration of 25 ns, for which high
velocity ion and electron generation were observed. Another significant observation
made was that as the pressure increases the electric fields have to be increased in order
to generate a corona. The same research team has applied this high frequency fast
ionization wave technique in ignition of hydrogen and hydrocarbon fuel-air mixtures
[19].
Shale et al., [20] studied the characteristics of positive corona at various
pressures (0 to 80 psig) and temperatures (600 to 1500 oF). They studied the voltage vs.
pressure and temperatures behaviour from the onset of corona to arcing. It was found
that positive corona demonstrated a higher arc-over voltage, thereby giving a wider

21
range of operability for positive corona over negative corona. Also, for positive corona
at higher densities, the current flow decreased for a constant voltage.
Several interesting work applying corona to automobile engine combustion and
diesel exhaust treatment have been done at the University of Southern California.
Gundersen [21] has studied the use of corona discharge for the initiation of combustion
in combustion engines. He concluded that corona has certain distinct advantages over
arc combustion, including better coupling into the gas of the energy, lower radiation
losses, and lower losses due to gas dynamic disturbances. Work on treatment of diesel
exhaust has also delivered positive results.
Vinogradov et al. [22], have studied the effect of uni-polar corona discharge on
a flame. They found that the height of the flame decreased with increasing field
intensities, with total quenching of the flame at certain high field strengths. Chernikov
et al. [23], have performed experimental investigations to study the effect of corona
discharges in supersonic air-propane mixtures. They found that there was no significant
improvement in the formation of radicals of OH, CH, O and H2 in the flow due to the
discharge; however, there was an increase in the electron density in the flow. They
concluded that such discharges can be used for ignition of fuel in ramjets.
Ekchian et al. [24], have tested a device that can be retrofitted onto gasoline or
diesel engines to produce corona discharge in the exhaust. They found that this
produces radicals in the exhaust that increase the efficiency of the catalytic converter to
weed out pollutants.
22
CHAPTER III
DESIGN OF THE HIGH VOLTAGE POWER SUPPLY
3.1 Requirements of the Power Supply
The power supply that was required for this project had to do the meet the
following criteria:
1. It should supply a variable output dc voltage from 0 to a ceiling of not below 15
kV, current flow of about 10 mA, with no appreciable drop in voltage
2. The polarity of the output voltage should be easily interchangeable
3. The output voltage should be continuously variable
4. The output supply must be able to be turned on and off from a remote location
5. The output current should be limited so that the test section is not damaged
severely
6. The output voltage and current should be measurable to a high degree of
precision
7. The system should be easy to use, robust and easy to maintain
8. The high voltage equipment should not produce electrical or radio frequency
disturbance that can affect apparatus in the vicinity
9. It has to be built within the budget allotted to the project, which was rather
limited
10. It should be safe to people and equipment in the surrounding area.

23
3.2 Types of High Voltage Generators
There are plenty of ac to dc converters and switch mode power supplies
available and are easy to make; however, these are all low voltage supplies, typically
below 200 Vdc. The difficulties of manufacturing a high voltage dc power supplies are
numerous, including, procurement of devices rated at high voltages, insulation and
isolation of components from each other, just to name a few. High voltage dc power
supplies of various ratings and sizes are available from commercial manufacturers, but
they cost thousands of dollars, which was one resource that was limited. Many common
machines and appliances contain high voltage generating devices within them, such as
television sets and computer monitors, microwave ovens and automobile ignition
systems, that may be modified to use as high voltage power supplies. However, they do
have their limitations.
Some of the various high voltage power supplies that were considered are
briefly described below:
• Voltage Multiplier Circuit
• Van de Graaff generator
• Tesla coils
• Step up transformers and rectifiers circuits
1. Microwave oven power supply
2. Television and computer monitor Flyback transformers
3. Ignition transformers

24
3.2.1 Voltage Multipliers
Figure 3.1: Voltage Multiplier circuit.
Voltage Multipliers [25] are circuits that convert ac to dc and then multiply the
output several fold. These are widely used to power digital circuits; however voltage
multipliers built with high voltage/current rated components can be made to deliver as
high a voltage as required. The basic voltage multiplier circuit is shown in figure 3.1.
Each stage consists of two capacitors and two diodes connected to an ac source, as
shown. During the positive half cycle, the top side of the transformer secondary
winding in the picture is positive and current flows through capacitor C1 and through
diode D1 and capacitor C2 back to the secondary winding. Thus capacitor C2 charges to
Vmax. During the negative half cycle, the bottom side of the transformer winding is
positive and the top is negative. Therefore, diode D1 being reverse biased does not
conduct. However, diode D2 is forward biased and conducts through C1. Thus C1 is
charged to Vmax. During the next positive half cycle, Vmax from the transformer as well
as the voltage Vmax present in C1 is now applied across C2. Thus C2 charges to 2Vmax.
The output is obtained across capacitor C2. Several stages of the multiplier circuit can
be cascaded to obtain 2n x Vmax.
AC D2
C1
C2
D1
Stage 1 Stage 2 Stage n
Vmax
2 Vmax 4 Vmax 2n Vmax

25
There are several drawbacks of this circuit. As load current from the output
capacitor is drained, the voltage across it drops. Therefore, these voltage multipliers can
be used for very low current applications only. It is not possible to get a continuously
variable output voltage. Output voltage can be varied in steps only. For lower frequency
supply voltages, there is an increasing voltage drop as the number of stages is increased.
The cost of assembling a high voltage version of this circuit is high as many capacitors
and diodes are required.
3.2.2 Van de Graaff Generator
The Van de Graaff generator (VDG) [26] was invented by Robert Jemison Van
de Graaff, the American physicist, in the 1920s. This electrostatic charging generator
works by building a static charge on a sphere from a rolling belt made of a non-
conducting material such as rubber or nylon. VDGs are capable of generating as high as
20 MV with very low currents in the range of µA or lower. The voltage is a function of
time, that is, the longer it runs, the higher the voltage. However, a VDG is a constant
current source and supplies a constant feeble current until the entire charge build up is
drained. But as the current is drained, the voltage drops. Therefore, it is not a viable dc
power source as it is difficult to control the output voltage accurately and the currents
are too weak.
3.2.3 Tesla Coil
Tesla coils [26] are high voltage generators that generate high voltages of high
frequencies (100s of kHz). The secondary of the Tesla coil is not wound on a metal but
air cored. The primary side of a resonance transformer is in series with a capacitor

26
forming an LC circuit. The primary side is supplied with a high ac voltage (a few kV)
usually of line frequency (60Hz) from a step-up transformer. One end of the secondary
coil is grounded while the other is connected to a sphere or a toroid that is kept off the
ground. This creates a capacitance with the ground, thus forming another LC circuit.
When both the primary and the secondary LC circuits are tuned to the right frequency,
which is done by changing the turns ratio on the primary, a standing wave of the right
frequency is amplified to a high voltage on the secondary. Tesla coils that are 5 feet
high can reach as high as 300 kV, while miniature ones can generate up to 50 kV. They
are used to generate sparks of a few inches to a few feet in length depending on the
voltage output. However, it is hard to control the output voltage and the output voltage
cannot be rectified to obtain a steady dc voltage.
3.2.4 Step-Up Transformer and Rectifier Power Supply
The simplest power supply is to step up an ac voltage with a transformer and to
rectify the output using diodes and filter with a capacitor [27]. The ac voltage is
available from the domestic 120 V, 60 Hz supply. Some of the high voltage
transformers that are commonly available are described below.
3.2.4.1 Fly Back Transformers or Line Output Transformers
Television sets and computer monitors that have a cathode ray picture tube in
them operate on very high voltages, about 24 kV or sometimes even higher than 30 kV,
depending on the size of the screen. Such high voltages are used for accelerating the
electron beam, horizontal deflection of the beam about the screen for scanning and
focusing the beam. This voltage is generated by a special transformer known as the

27
Flyback Transformer (FBT) or Line Output Transformer (LOT) [28]. The name Flyback
originated from the fact that the output of this transformer is used to move the electron
beam back to the start of a new line on the screen once the scanning of a line has been
completed.
The FBT has several windings on both the primary and secondary side. The
secondary side is tapped at numerous points to get different levels of voltages, with the
highest for beam acceleration and horizontal deflection. FBTs are made of coils of very
fine wire, wound on a ferrite core with an air gap. Thus it is able to store energy in the
air gap and works as an inductance. The output of the transformer is rectified with
diodes and filtered with capacitors. Some CRTs have FBTs that deliver around 8 kV
which is then multiplied with a voltage multiplier circuit, similar to the ones discussed
before, to obtain the higher voltages.
The features that distinguish FBTs from other transformers are given below:
• FBTs have an air gap that store energy in them, making them pure inductors,
and also giving them a higher reluctance than regular transformers.
• The current flow in the primary and secondary coils is out of phase with each
other.
• The voltages applied to the FBTs are usually rectangular in shape, while the
current flow is usually triangular in shape.
• FBTs operate at high frequencies in the range of from a few kHz to the lower
MHz. Therefore, the diodes and capacitors used in the rectification process are
not very bulky. However, operating them at lower frequencies will cause their

28
cores to saturate, limiting the current drawn from them and can make them
susceptible to failure. The core saturation can be a safety mechanism in cases
where the secondary is shorted, in case of an arc for example, whereby the
current is limited and the transformer winding may not burn away or blow a
fuse.
• The normal operating current output of FBTs are very low, in the low milliamps
range.
• The high frequencies required make it necessary to build a more complicated
control circuit.
• These reasons render FBTs unsuitable for a power supply application for this
project.
3.2.4.2 Microwave Oven Power Supply
Microwave ovens have a transformer and diode rectifier system. The
Microwave Oven Transformer (MOT) is capable of generating about 2 to 3 kV at 1 to 4
kW depending on the oven’s model and power rating. These transformers are used to
drive the magnetron that produces the microwaves, with enough power to heat food.
The MOTs are not current limited by core saturation and are therefore dangerous in case
of shorting of the secondary. However, the voltage requirement of this project is up to
15 kV and therefore, cascading of several transformers in series would be necessary.
This is also dangerous because the insulation on the MOTs may not hold up to higher
voltages than they are rated at.

29
3.2.4.3 Ignition Transformers
Fuel Oil Ignition Transformers are used in fuel oil burning heaters to ignite the
fuel with an arc. They are usually rated at 10 kV, 20 mA. They are constructed with the
secondary winding centre tapped to the core, which is then grounded. These
transformers are also current limited by the core, if their secondary windings are shorted
but will eventually burn up due to the heat generated. They can be cascaded in parallel
or series to get higher currents or voltages. These are also a good choice for building a
high voltage power supply.
Automobile ignition coils can produce about 30 kV ac. They have a primary and
a secondary coil wound on an iron core. They also have internal connections between
the primary and secondary coils that are switched to create the high voltage output
across the secondary. They are designed to work on 12 or 24 volts and therefore require
a high frequency switching control circuit. This can create high frequency transient
noise in the system. They require a complicated circuit to obtain a variable voltage
output. Although these can be cheaply bought at a vehicle scrap yard, they are not a
good choice for a high voltage dc power supply.
3.2.4.4 Neon Transformer
After studying all these options, the conclusion drawn was that the best choice is
to use a neon light transformer to step up the input voltage and then rectify the output
with a bridge rectifier and filter it with a simple capacitor filter. This setup is shown in
figure 3.2. The ac mains supply is connected to the high voltage ac generator through an
isolation transformer, with 1:1 turns ratio. This is to isolate the high voltage side from

30
the line. The high voltage ac generator consists mainly of a variable autotransformer
that supplies the input to the neon transformer. The output of the neon transformer is
connected to a bridge rectifier containing four high voltage diode assemblies. The
rectified output is filtered and stored in a large 1 µF capacitor. The voltage across the
capacitor is measured with a high resistance voltage divider (500 MΩ) with 100:1 input
to output ratio, by a high input impedance digital voltmeter. The power is applied to the
test section through a pair of Normally Open (NO) power relays. Another pair of relays,
Normally Closed (NC) type, is used to discharge the capacitor. A power resistor of 1.1
MΩ is used to limit the current supply. Current flow in the circuit is read by a digital
voltmeter reading the voltage across a 10 Ω resistor. All these components are further
explained in this chapter.
Figure 3.2: Schematic of the High Voltage DC Power Supply.
High Voltage ACGenerator
(Neon Transformer, Auto-transformer,
Controls)
120 V, 60 Hz mains
V
A
Control Box
Bridge RectifierIsolationTransformer
TestSection
Ammeter
Voltage MeasurementCircuit
Power Relay Box
Capacitor Filter

31
3.3 The Neon Transformer
Neon lights and luminescent tubes, used in commercial displays and on bill
boards, are glass tubes filled with low pressure inert gases like neon, argon, krypton,
etc. They produce luminescence when the gases are excited by a high voltage applied
across the tubes. The different colours are characteristic of the gas inside the tubes.
Neon gives off a red colour, while a mixture of argon and mercury gives off a light blue
colour [29].
The high voltage is applied by means of a special step up transformer, known
commercially as a neon transformer. Neon transformers are available in a variety of
sizes. They are rated for their secondary open circuit voltage and short circuit current,
i.e., the listed voltage is the maximum voltage when no load is applied across the output
terminals and the listed current is the highest current that can be drawn from it.
However, this happens when the secondary is shorted, that means the effective output
voltage is zero.
The secondary open circuit voltages, short circuit currents and power ratings of
some of the common types are listed below.
9000 V 270 VA 30 mA
540 VA 60 mA
12000 V 360 VA 30 mA
720 VA 60 mA
15000 V 450 VA 30 mA
720 VA 60 mA

32
The primaries are available in 120 Vac, 60 Hz for the US or 240 Vac, 50 Hz for Europe.
A transformer with primary/secondary rated as 120 V/12000 V would have a turns ratio
of 100. Thus any voltage input to the primary would be stepped up 100 times on the
secondary. The model used for the power supply is a 120/12000 V, 720 VA, 60 mA,
60Hz transformer manufactured by Franceformer [30].
The design of the power supply is such that the maximum output voltage and
currents can be changed by replacing the transformer with one with the required power
rating. A 120/12000V, 360VA transformer and a 120/15000 V, 450 VA transformer,
both from Franceformer, are also available here at the ARC that can be used in the
power supply if required.
3.3.1 Normal Power Transformer Operation
The operation of a normal power transformer is described below [31]. If the
number of turns on the primary and secondary windings are denoted by N1 and N2
respectively and the voltage applied to the primary is V1(t) and the current flowing
through the two windings are i1(t) and i2(t) respectively, the Reluctance ℜ of the
magnetic circuit and the flux φ in the core is given by the following equation.
N1 i1 – N2 i2 = ℜ φ (3.1)
Reluctance ℜ for a core of length l and cross sectional area A and permeability µ of the
material is given by
ℜ = l/µA (3.2)
For iron, µ is 5000 µ0 (5000 x 4π x 10-7 H/m = 0.0063 H/m). For an ideal transformer,
the right hand side of equation 3.1 is zero as µ→∞.

33
i1/ i2 = N2 /N1 (3.3)
v2 /v1 = N2 /N1 (3.4)
Figure 3.3: Schematic of a transformer.
3.3.2 Power Factor
For a dc supply, power
P = V I [Watts] (3.5)
For an ac circuit, the current may be out of phase with voltage. Therefore, power is
expressed in VA (Volt Amperes) as shown below, where Φ is the phase difference
between voltage and current.
P = V I cosΦ [VA] (3.6)
The term cosΦ is known as power factor. This is important for ac circuits, especially
transformers, because inductive circuits tend to create a current phase lag and lower the
phase difference, while capacitive circuits tend to create a voltage phase lead and
increase the power factor, but never more than unity. Lower power factor means that
N1 N2
i1(t) i2(t)
V1(t) V2(t)

34
more current is required to maintain the power requirement. DC circuits have a power
factor of 100 %.
Transformers and other appliances rated Normal Power Factors have 40 to 50 %
pf. Those rated as High Power Factor has at least 90% pf.
Figure 3.4: Current lagging voltage by 60o.
3.3.3 Features
Neon transformers have a different construction and operation scheme from that
of normal power transformers. Neon transformers have an iron core. The secondary
windings are done in two parts, and they are connected in series internally. In effect
there are two secondary windings. One end of each secondary winding is shunted to the
iron core. The iron core thus forms an electrical path for joining the two secondary
windings and is the centre tapping on the secondary winding. A terminal connected to
the iron core is available on the outer box. In neon light applications this is usually
grounded.
Time
Vol
ts, A
mps
Voltage
Current
60o

35
Figure 3.5: Schematic of a neon transformer.
Neon transformers have low output voltage regulation, i.e., the output voltage
will fall with increase in current drawn. This is the biggest drawback of using the neon
transformer for a high voltage dc power supply. However, this can be somewhat solved
by adding a fairly large storage capacitor to the output of the rectifier.
The neon transformer has a normal pf rating, i.e., 40 to 50 %, due to the
magnetic shunting and the secondary windings. Neon transformers with power factor
correction are available. Power factor correction can be done by connecting a capacitor
across the primary, thus reducing the current drawn by the primary in almost half.
Neon transformers have a built in safety feature of current limiting. When the
secondary windings are shorted, only a limited current will flow through it, because the
iron core, which is magnetically coupled with the windings, gets saturated and presents
a high reluctance to the magnetic flux induced by the current, which in turn limit the
Secondarywinding
Secondarywinding
Primarywinding(120V)
Iron Core
CentreTapping
36
current flow. This feature protects the winding of the transformer from burning out
during an arc discharge, and also offers some degree of protection to the power devices
like diodes and capacitors in the power supply circuit.
The neon transformer core and winding assembly is covered with an insulating
compound, such as asphalt or epoxy resins and housed in a steel box with the terminals
isolated on ceramic stand offs. The metal container is connected to the core and is
therefore the centre tapped ground.
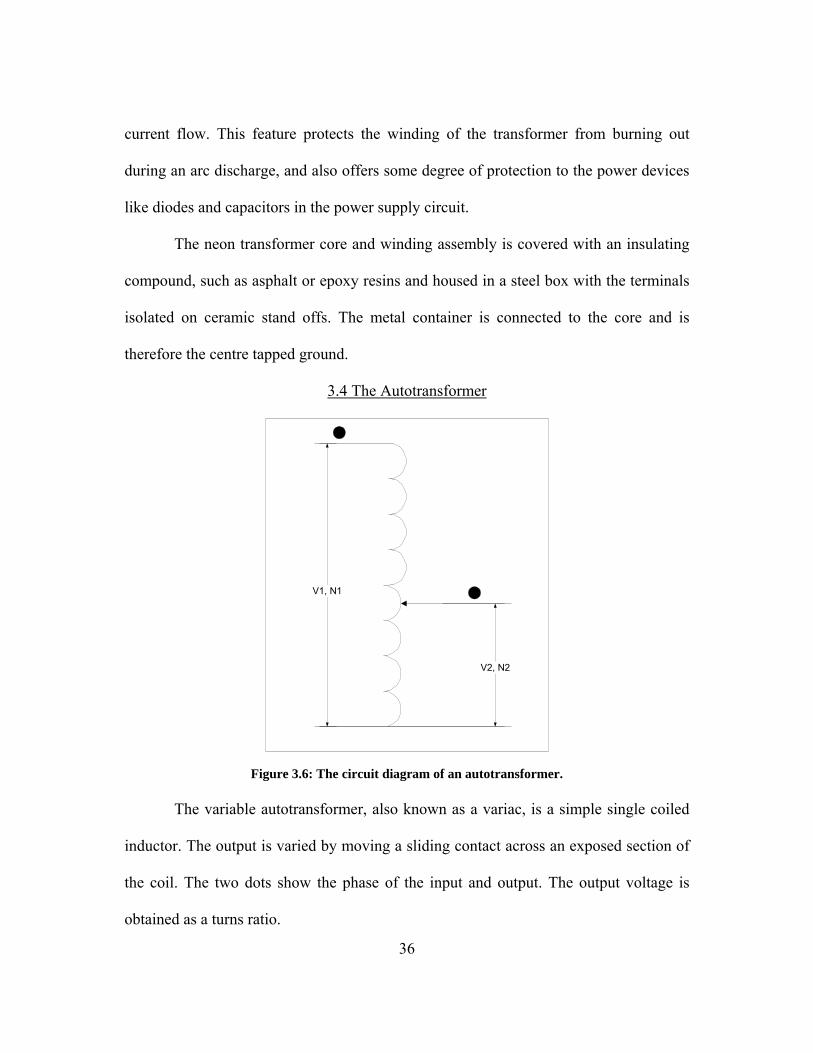
3.4 The Autotransformer
Figure 3.6: The circuit diagram of an autotransformer.
The variable autotransformer, also known as a variac, is a simple single coiled
inductor. The output is varied by moving a sliding contact across an exposed section of
the coil. The two dots show the phase of the input and output. The output voltage is
obtained as a turns ratio.
V1, N1
V2, N2
37
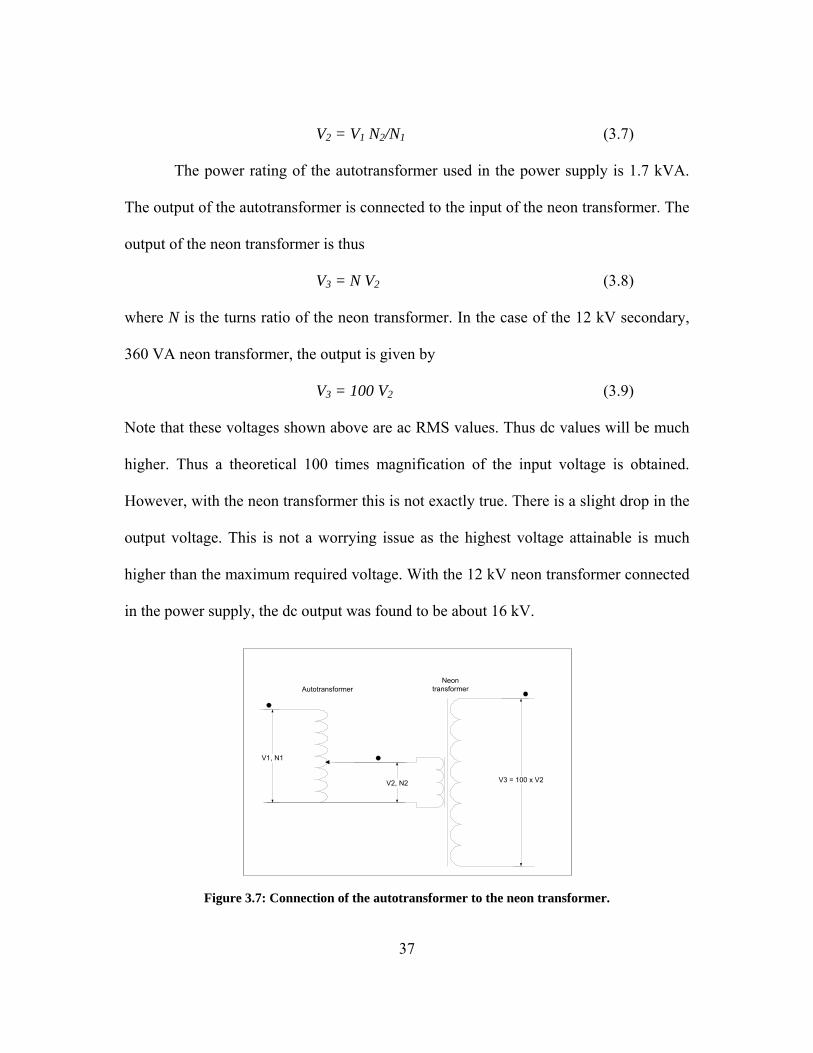
V2 = V1 N2/N1 (3.7)
The power rating of the autotransformer used in the power supply is 1.7 kVA.
The output of the autotransformer is connected to the input of the neon transformer. The
output of the neon transformer is thus
V3 = N V2 (3.8)
where N is the turns ratio of the neon transformer. In the case of the 12 kV secondary,
360 VA neon transformer, the output is given by
V3 = 100 V2 (3.9)
Note that these voltages shown above are ac RMS values. Thus dc values will be much
higher. Thus a theoretical 100 times magnification of the input voltage is obtained.
However, with the neon transformer this is not exactly true. There is a slight drop in the
output voltage. This is not a worrying issue as the highest voltage attainable is much
higher than the maximum required voltage. With the 12 kV neon transformer connected
in the power supply, the dc output was found to be about 16 kV.
Figure 3.7: Connection of the autotransformer to the neon transformer.
V1, N1
V2, N2 V3 = 100 x V2
AutotransformerNeon
transformer

38
3.5 The Diodes
The simplest way to convert ac to dc is by rectification. For high power dc
supplies like welding sets, three phase rectification is carried out. This would reduce
ripples significantly. Since the neon transformer is a single phase one, the full wave
rectification is preferable.
Figure 3.8: Single phase full wave rectifiers.
Some of the factors used to compare rectifier circuits are briefly explained
below [25].
Efficiency: Conversion efficiency of a rectifier is the ratio of dc power delivered to the
AC
Vo
AC Vo
Single Phase Full Wave Centre Tapped Rectifier
Single Phase Full Wave Bridge Rectifier
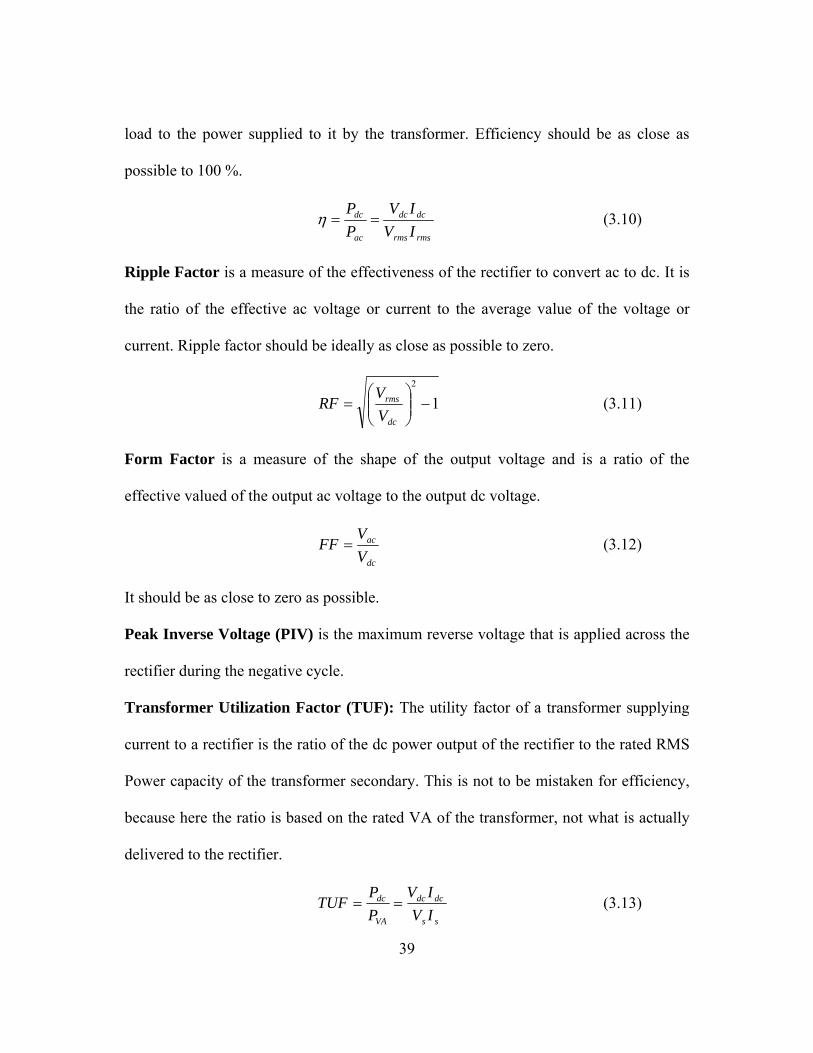
39
load to the power supplied to it by the transformer. Efficiency should be as close as
possible to 100 %.
rmsrms
dcdc
ac
dc
IVIV
PP
==η (3.10)
Ripple Factor is a measure of the effectiveness of the rectifier to convert ac to dc. It is
the ratio of the effective ac voltage or current to the average value of the voltage or
current. Ripple factor should be ideally as close as possible to zero.
12
−⎟⎟⎠
⎞⎜⎜⎝
⎛=
dc
rms
VV
RF (3.11)
Form Factor is a measure of the shape of the output voltage and is a ratio of the
effective valued of the output ac voltage to the output dc voltage.
dc
ac
VV
FF = (3.12)
It should be as close to zero as possible.
Peak Inverse Voltage (PIV) is the maximum reverse voltage that is applied across the
rectifier during the negative cycle.
Transformer Utilization Factor (TUF): The utility factor of a transformer supplying
current to a rectifier is the ratio of the dc power output of the rectifier to the rated RMS
Power capacity of the transformer secondary. This is not to be mistaken for efficiency,
because here the ratio is based on the rated VA of the transformer, not what is actually
delivered to the rectifier.
ss
dcdc
VA
dc
IVIV
PP
TUF == (3.13)

40
Vs and Is are the RMS voltage and current rating of the transformer. Vdc and Idc are the
dc voltage and dc current output of the rectifier.
Transformer VA is the equivalent capacity of the transformer secondary compared to
what it would be if it were delivering a pure ac voltage. It is the inverse of TUF.
Harmonic Factor is a measure of the distortion of a waveform. An ideal rectifier has
no voltage drop across the diodes, 100 % efficiency, Vac = 0, RF = 0, TUF = 100 %,
HF = 0, power factor = 1.
Table 3.1: Rectifier performance factors.
From the above table, it is clear that the bridge rectifier is a better choice. A few more
advantages and disadvantages of the bridge rectifier are listed below.
Advantages:
• No centre tapping is required. Therefore, a higher voltage is available from the
transformer for rectification.
• This is more robust, since the diodes only take half the peak voltage across the
transformer during any half cycle.
• There is a higher transformer utilization factor, as the whole transformer is used
rather than one half of the secondary winding.
Disadvantages:
• More number of diodes are required for the bridge configuration, four vs. two in
Rectifier Efficiency Ripple Factor Form Factor PIV TUF Transformer VA
Fundamental Ripple
Frequency
Half Wave 40.60% 121% 157% 1.414 Vmax 0.286 3.496 60 HzFW CT 57.50% 48% 111% 1.414 Vmax 0.67 1.75 120 HzFW Bridge 81.20% 48% 111% 0.707 Vmax 0.813 1.23 120 Hz

41
the case of the centre tapped FWR.
• Diodes have a voltage drop across them and in bridge rectifier setup, the drop
across two diodes in each phase has to be accounted for.
• Since there are two diodes during each phase, the diodes can be rated at just
above the peak voltage. In CTFWR, since only one diode is conducting and if
there is a capacitor in parallel across the output, the diodes have to be rated at
two times the peak voltage, thus requiring higher rated diodes.
• If one of the diodes fails, the bridge rectifier reverts to being a half wave
rectifier. However, it is the same case with the centre tapped FWR also.
For high voltage rectification, vacuum tubes work remarkably well. Most of
them are rated for high voltages and handle fairly large currents. However, they have a
few drawbacks. They require a filament heating supply and it takes a few seconds for
the filament to get hot enough for proper functioning of the tube. Their switching times
are slower than solid state devices. Tube rectifier circuits are usually connected in a full
wave centre tapped configuration, as tubes do not work well in series and the voltage
drops across them can be rather large. Although, it would seem out of the ordinary to
adopt an older technology, the incentive for using vacuum tubes is that they can be
bought cheaply from individual sellers and old equipment retailers.
On the other hand, solid state diodes are more reliable and easy to handle, not
having to care about breakage of glass or loss of vacuum. Solid state diodes are
available in all ratings. However, the faster and higher voltage or current rated diodes
are more expensive.

42
Diodes have a current rating and a Peak Inverse Voltage (PIV) rating. High
voltage diodes are also found in several common appliances. Microwave ovens,
television sets, and computer monitors etc. use diodes for rectification. These can be
purchased at spare part shops. However, their current ratings might be too small or the
voltage ratings may not be high enough. It is safer to have diodes at least twice the
highest voltage required.
One way to use lower rated diodes is to cascade several diodes till a favourable
safety factor is achieved. For example if the diode has a PIV rating of Vd, several may
be cascaded as shown in figure 3.8, to get a PIV of n x Vd.
However, at high voltages, corona losses and arcing can occur between the
terminals. Therefore, it is necessary to ‘pot’ the diodes by covering them with an
insulating material like silicon sealant or epoxy or immerse them in non-conducting oil.
Another downside to cascading diodes is that the voltage drop across each diode in the
series adds up. It can be a significant drop in case of high voltage diodes.
Figure 3.9: Cascading diodes to get a higher PIV rating.
Vd

43
Figure 3.10: The neon transformer output connected to a bridge rectifier.
The output of the neon transformer is fed into the bridge rectifier configuration
as shown. Theoretically, a maximum voltage of √2 x 100 x V2 can be expected on the
rectifier output. V2 is rms voltage at the output. The voltage across the output of the
rectifier is give by
dropo VVV −= 22100 (3.14)
However, the voltage drop across the diodes Vdrop will reduce the output by a small
amount. The diodes used for the bridge rectifier in the power supply are rated at 125 kV
PIV with 20 mA current. Each of the four sets used is a cascade of twenty one small
diodes. The diode terminals and connectors have been covered with a thick layer of
silicone sealant to prevent arcing or corona discharge. The voltage drop has been found
to be 250 V.
V1, N1
V2, N2 V3 = 100 x V2
AutotransformerNeon
transformer
Vo
BridgeRectifier

44
3.6 The Capacitor
The simplest filter for a rectifier circuit is a capacitor. With the addition of the
capacitor, the circuit is known as an unregulated linear power supply. The capacitor
used for the power supply circuit has a rating of 1 µF ±10 % at 50 kVdc. The capacitor
is large in size (22in x 8in x 5in, LxBxH) for a capacitance value of only 1 µF due to the
high voltage withstanding capability. High voltage capacitors are bigger in size so that
the dielectric medium separating the plates is thick enough to hold the increased
potential.
Figure 3.11: Rectifier with Capacitor filter.
The ripple factor for a capacitive filter can be found from the following
equation, neglecting the diode voltage drops and a load resistance RL connected across
the capacitor. Here f is the frequency of the line voltage which is at 60 Hz.
V1, N1
V2, N2 V3 = 100 x V2
AutotransformerNeon
transformer
Vo
BridgeRectifier

45
( )14211
2
−=−⎟⎟
⎠
⎞⎜⎜⎝
⎛=
CRfVV
RFLdc
rms (3.15)
For the test section, the corona discharge draws a current in the µA range, when
a voltage in the order of 103 V is applied, which indicates a very high impedance in the
order of 108 Ω. Thus, for an approximation, with the value of capacitance at 1 µF, the
RF is found to be 2.95 x 10⁻⁵, which is less than 0.3 %. This low value is because of the
low current drawn. This is the reason why an inductive filter would not work. Inductive
filters are for constant current loads, which is not the case for the test section. The test
section is made of two electrodes separated by an air gap and it is essentially a
capacitor. Therefore, it presents a high capacitive reactance to the current flow.
Capacitive filters are simple yet effective for such a load.
3.7 The Power Relays
The output of the high voltage dc power supply is output through two sets of
power relays, marked Re1 and Re2 in figure 3.12. These are fast switching high voltage
electromechanically switching relays, able to switch on and off in 15 ms. These relays
have a robust construction, with each device encased in a glass or ceramic container that
is hermetically sealed and vacuumed.
Vacuum is the best insulator [32], because there are no atoms to conduct
electricity. Vacuum can withstand an electric field density of 300 kV/cm while the
dielectric strength of pure dry air breaks down at about 30 kV/cm. Therefore, the
contacts of the relay can be very close to each other, allowing for very fast switching
and small size. The contacts are also made of metals with high work function and

46
melting point. Metals with lower work function release electrons that can then exchange
charge between the terminals of the relays at high potential. When a contact is broken
by activating the relay, the current flow that was in the circuit tries to continue flowing
and acts against the interruption forming an arc, just as the contacts are opening. This
can heat up and vapourise the metal, leading to contact erosion. Thus these vacuum
relays are made of low resistance copper alloys that can survive momentary heat.
Figure 3.12: Power supply with the power relays at the output before the Test Section.
A mode of failure of relays is shorting to the metal housing of the relays’
solenoid. This is why high voltage relays are made of ceramic, which has a very high
dielectric strength able to withstand up to 250 kV/cm.
Bridge Rectifier
0 - 1
2000
V rm
s
1 microFaradCapacitor
AC
Dual Single Pole HighVoltage Vacuum Relays
0 - 14000 V dc
Neon Transformer12000Vac rms/60mA
120V rms ACmains
0 - 100% VariableAuto-Transformer
1.1 MOhmA
TEST SECTION
200 kOhm
Re1 Re1
Re2 Re2

47
Vacuum relays are used in high frequency power switching applications, such as
the high power supply to radio antennae. Microwave devices such as radars also use
such relays to control the power to the radar antennae [33].
3.7.1 Electromechanical Relays vs. Solid State Switches
Solid state switches are semiconductor devices that can be used for very high
voltage and current applications. They have the advantage of being very fast switching
and are very robust. The fast switching speeds allow them to be easily integrated with
digital control circuits, as their response times are similar, in the micro seconds range.
Most common used solid state switches are Silicon Controlled Rectifiers. They
are similar to diodes in operation, allowing current flow in only one direction, but they
also have a gate terminal, by which a small positive gate signal can be used to turn it on.
However, once turned on, it does not turn off by itself. The process of turning off an
SCR is called commutation, which often requires complicated circuits. The process by
which the SCR is turned off by cutting off the load current is called load commutation.
This is schematically represented in figure 3.13.
Another solid state device used for high voltage dc applications is a Gate-Turn-
off Transistor (GTO), which can be turned off by a short negative pulse to the gate and
does not require any commutation circuits.
The disadvantages of solid state switches are:
• They require commutation or turn off circuitry.
• They are very expensive.
• A big drawback to solid state devices is that they have a leakage current, both in

48
the forward and reverse biased condition. This is a small current that flows when the
device is turned off and it is in the order of micro Amperes, which is the same order of
the corona current.
Figure 3.13: An SCR in the on mode (left) and Line commuted SCR (right).
Therefore, it was decided to use simple electromechanical vacuum relays for the
switching. The response time of 15 to 20 ms was deemed to be acceptable for the
experimental program.
3.7.2 Power Relays used in the Circuit
There are two types of power relays employed in the circuit. One is a pair of
Single Pole Single Throw Normally Closed relays, white in colour; model number KC-
32, shown as Re1 in the figure 3.13, manufactured by Kilovac, CA, USA. [34] They are
rated at 25 kV, 500 A peak, 45 A continuous. These are the relays that control the
power to the load device, which is the test section. They operate on 12 Vdc. They are
Normally Closed (NC) relays; therefore, they have to be energized to open the circuit.
RL
SCR
TriggerPulse
Gate
Anode
Cathode
RL
Gate
Anode
Cathode

49
The other pair of vacuum relays is the Russian made relays rated at 4kV
nominal, 15 A continuous current and are green in colour. However, they can be used
up to about 10 kV without breaking down. There are two of them in series, thereby
increasing their voltage withstanding capability. These are used to discharge the
capacitor through a total resistance of 1.3 MΩ. They operate on 24 Vdc.
3.8 DC Voltage Measurement
The voltage across the capacitor is measured as shown in figure 3.14. This is a
voltage divider across the output capacitor, as shown, that amounts to 500 MΩ. The
voltage is read across 5 MΩ resistance that yields a 1/100 voltage division.
The total resistances are made up of smaller resistors. Resistors also have a
maximum voltage rating, beyond which their dielectric strengths break down or they
conduct heavily and burn up. Therefore, resistors should be selected based on the
highest voltage that they may encounter in the circuit. High voltage resistors are hard to
find. Smaller resistors may be cascaded to achieve a higher voltage rating; however,
they must be ‘potted’ in an insulating medium, such as insulating oil, asphalt, epoxy or
silicon sealant.
The 500 MΩ resistance is composed of one 400 MΩ 1% precision resistor, one
80 500 MΩ 1% precision resistor and a series of 10 MΩ, 1%, 250 V, ¼ W resistors
soldered together and then inserted into a plastic tube and then covered with silicon
sealant. The 5 MΩ resistor is made by connecting two of the same 10 MΩ resistors in
parallel. These are enclosed in a plastic enclosure by themselves properly sealed with
silicon sealant. This box houses banana sockets that the voltmeter connects to. All the

50
wires are isolated and the probe cables going to the 5 MΩ box are isolated in a piece of
foam pipe insulation.
Figure 3.14: The voltage divider and digital voltmeter across the capacitor.
V
1 micro-Farad, 50kVCapacitor
400 M-Ohm 1% HighVoltage Precision Resistor
15 M-Ohm1% Resistor
80 M-Ohm 1%High Voltage
Precision Resistor
5 M-Ohm 1%Resistor
High Input Impedance HighSensitivity Digital Voltmeter
Re
1 HV
Vacuum
Relay
Re
1 HV
Vacuum
Relay
+
Re2 Pair of HVVacuum Relays
-
200 kOhm
1.1 MO
hm

51
The voltmeter is a high input impedance digital meter; therefore it will not load
the capacitor and cause a voltage drop. The model of the voltmeter used is Fluke 45
Digital Multimeter, rated at 650 Vdc, 250 mA.
The measurement of the final voltage output by the power supply is not affected
by the accuracies of the individual components. The use of high precision 1% tolerance
resistors in the voltage divider circuit and a high accuracy digital voltmeter guarantees
that only the uncertainties of these devices need to be considered for the voltage
measurement.
If Vo is the voltage across the capacitor, the reading on the voltmeter Vr is given
by
or VV100
1= (3.16)
%41.1100 ±=∴ ro VV (3.17)
The uncertainty of the voltage reading has been calculated to be 1.41 % of the voltmeter
reading.
Another feature to be noted here is that the voltage divider drains current from
the capacitor. Thus if the HV AC is cut off to the capacitor, it will eventually drain out.
The time constant of the RC circuit is very large, equal to 500 seconds.
R C = 500 MΩ x 1 µF = 500 seconds. (3.18)
In 500 seconds, the capacitor loses 63.2 % of its original voltage. Therefore, it
allows for the capacitor to hold a steady voltage for a significantly long time after the ac
power has been turned off [35].

52
3.9 The Control Box
The control box has a built in power supply that delivers power to the power
relays across the power capacitor. The heart of the control box power supply is a 120 V
to 24/12 V step down transformer. Bridge rectifier modules are used to convert to three
dc voltage outputs, namely two 12 Vdc and one 24 Vdc. The power supply has its own
cooling fan. The main switch is located at the back of the control box. The front panel
of the box has 3 toggle switches and 4 light emitting diodes (LED) that indicate the state
of the relays and the power supply.
On the back panel are the mated connectors that only accept the specific type of
connectors, so that no mismatched connections are possible. One two-conductor
connector is for the High Voltage AC Power Supply. Another four-conductor connector
links to the Power Relay box, which has two types of relays: one pair for the power
output and one pair for the capacitor discharge.
When the main switch is turned on, a red LED lights up indicating that AC
power to the transformer is turned on. The cooling fan also turns on simultaneously.
The three toggle switches are of different types, each controlling a different type of
relay. One toggle switch is marked HV AC P/S, standing for High Voltage Alternating
Current Power Supply. This is a SPST switch. The second toggle switch is marked O/P
RELAY CLOSE. This is a DPDT switch. The third toggle switch is marked
CAPACITOR DISCHARGE and it is a SPST spring return switch.
When the toggle switch marked HV AC P/S is put to the “ON” position, the red
LED above it turns on indicating that ac power to the neon transformer is now turned

53
on. The power output relays, the white Kilovac relays, are NC relays. Therefore, when
the control box power supply is turned on, with the toggle switch marked O/P RELAY
CLOSE in the off position, the white relays are energized and their contacts are opened
and the green LED above it will be off. When this toggle switch is put to the “ON”
position, the LED comes on and the white relay contacts are closed. (The relays are now
de-energized.)
The third toggle switch is used to discharge the capacitor. It has two positions.
When pushed up, it latches to the “ON” position and the yellow LED above it comes
on, indicating that the green relays are energized and their contacts are closed. When it
is pushed downward, it will light up the yellow LED, indicating the green relays are
energized, but the switch will go back to the off position when released. This feature is
for momentary discharging of the capacitor, for example to bring down the voltage in
the capacitor momentarily.
The function of the control box is to give the user the ability to control the high
voltage ac generator and the output relays from a remote location, for example where
the data measurement devices are located or inside the control room away from the high
voltage equipment. The cables linking the control box to the specific components are
easy to extend and thus the control box can be practically located any where in the lab.
This makes the power supply very versatile.
The detailed circuit diagram of the control box is shown in the appendix. The
following figure shows the layout of the front and rear panels of the control box.

54
Figure 3.15: The front and rear panels of the Control Box.
3.10 Features of the High Voltage Power Supply
The High Voltage DC Power Supply is built as smaller modules that are housed
in separate boxes. This serves several purposes. It helps in electrically isolating the high
voltage components from the low voltage ones. It makes it easy to locate, identify and
access parts of the circuit.
ON
OFF
ON
OFF
ON
OFF
Red Red Green Yellow
POWER
HV AC P/S O/P RELAYCLOSE
CAPACITORDISCHARGE
HIGH VOLTAGE DC POWER SUPPLY CONTROL UNIT
FanHV RELAYS
SIGNALAC Power i/p
0 1Main Switch
HV AC P/SSIGNAL
FrontPanel
RearPanel

55
Shown in figure 3.16 below is the layout of the power supply.
Figure 3.16: Schematic of the power supply
The different modules of the power supply are:
• High Voltage AC Generator (HVACG)
• Rectifier
• Capacitor
• High Voltage Measurement Circuit
• Relay Box including Capacitor Discharge Resistor
• Current Limiting Resistors
• Current Measurement Circuit
• Control Box
High Voltage ACGenerator
(Neon Transformer, Auto-transformer,
Controls)
120 V, 60 Hz mains
2 kOhmV
1.1 MOhmA
Bridge RectifierIsolation
Transformer
TestSection
Ammeter
Voltage MeasurementCircuit
Power Relay Box
Capacitor Filter
Control Box

56
The High Voltage AC Generator (HVACG): The HVACG is housed in a wooden box.
The HVACG contains the variable auto-transformer, the neon transformer and control
circuits. The top panel of the HVACG is shown in figure 3.17. This module plugs into
the domestic ac mains. The ac power for the control circuit of the module is separated
from the high voltage power side of the circuit and their connection sockets are located
on either side of the box, as seen in the figure. The high voltage side is supplied through
a large isolation transformer to protect the ac lines of the building from any high voltage
leakage back into the line.
Both sides have panel mounted line filters; the high voltage side filter has dual
6.3 A fuses. The line filters are low pass filters that allow 0 to 400 Hz signals through,
while attenuating higher frequency signals and transients. They work in both directions,
stopping noise from line to the equipment and noise from the equipment to the line [36].
When the power cables from both sides are connected to the mains, two red
LEDs marked TRANS PWR (transformer power) and CNTRL PWR (control power)
lights up on the LED panel on the top of the box. This shows that the fuses in the ac line
filter or the filters themselves are functioning properly.
When the main switch is turned on, the yellow LED marked MAINS turns on.
However, the power has not reached the transformer yet. The SPDT toggle switch next
to the main switch has to be set to the appropriate position for power to be supplied to
the transformers. In the LOCAL ON position, the SPDT relay controlling the power to
the transformer is turned on. In the REMOTE position, the signal from the control box
is required to turn on the relay. The remote control cable is plugged into the banana
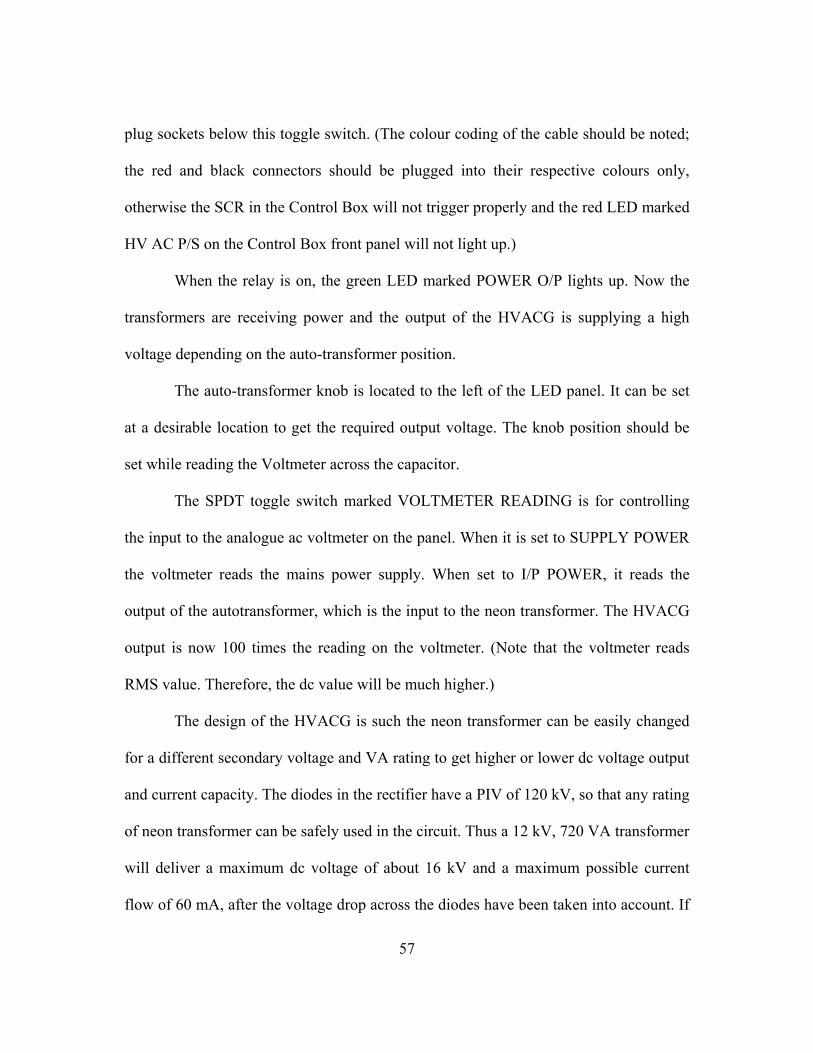
57
plug sockets below this toggle switch. (The colour coding of the cable should be noted;
the red and black connectors should be plugged into their respective colours only,
otherwise the SCR in the Control Box will not trigger properly and the red LED marked
HV AC P/S on the Control Box front panel will not light up.)
When the relay is on, the green LED marked POWER O/P lights up. Now the
transformers are receiving power and the output of the HVACG is supplying a high
voltage depending on the auto-transformer position.
The auto-transformer knob is located to the left of the LED panel. It can be set
at a desirable location to get the required output voltage. The knob position should be
set while reading the Voltmeter across the capacitor.
The SPDT toggle switch marked VOLTMETER READING is for controlling
the input to the analogue ac voltmeter on the panel. When it is set to SUPPLY POWER
the voltmeter reads the mains power supply. When set to I/P POWER, it reads the
output of the autotransformer, which is the input to the neon transformer. The HVACG
output is now 100 times the reading on the voltmeter. (Note that the voltmeter reads
RMS value. Therefore, the dc value will be much higher.)
The design of the HVACG is such the neon transformer can be easily changed
for a different secondary voltage and VA rating to get higher or lower dc voltage output
and current capacity. The diodes in the rectifier have a PIV of 120 kV, so that any rating
of neon transformer can be safely used in the circuit. Thus a 12 kV, 720 VA transformer
will deliver a maximum dc voltage of about 16 kV and a maximum possible current
flow of 60 mA, after the voltage drop across the diodes have been taken into account. If

58
a higher voltage is required, the next available step in the neon transformer secondary
voltage rating is 15 kV, which can potentially deliver a dc voltage of about 21 kV. Since
the neon transformers are poorly regulated, a different type of high voltage step up
transformer can be substituted safely if available.
Figure 3.17: Schematic of the High Voltage AC Power Supply’s Top Panel.
01
MAINSWITCH
0
90
100
Red
Red
GreenYellow
TRANSPWR
CNTRLPWR
MAINS POWER O/P
OFF
LOCALONREMOTE
SUPPLYPOWERI/P POWER
EXTERNAL VOLTMETER
Bananasockets Vac
CO
NTR
OL
PO
WE
R S
UP
PLY
120
V 6
0HZ
TRA
NS
FOR
ME
R P
OW
ER
SU
PP
LY 1
20V
60H
Z6.
3A D
UA
L FU
SE
Bananasockets
Auto-Transformer Knob

59
The rectifier assembly is housed in a Plexiglas box. The connecting cables are bolted
on to terminals extending through the walls. The output of the rectifier goes to the
capacitor, which is also housed in a Plexiglas box. The voltage measurement circuit is
composed of the high voltage resistors and the digital voltmeter. The rectifier, the
capacitor and the high voltage measurement devices are mounted on a cart, so that it can
be easily moved. The output of the capacitor is connected to the Relay Box.
All connecting cables in the high voltage side of the circuit are made of high
current 22 AWG (7/30) copper braided wire, that have insulation rated at 10 kVdc and
temperature rating of 150oC. In addition, the cables have been covered with ½ inch
thick foam pipe insulation used for thermally insulating air conditioning copper pipes
and then taped over with one layer of duct tape and a layer of electrical insulation tape.
Therefore, the wires are extremely well insulated. The insulation tape also serves as
colour coding, with the different cables covered in tapes of black, blue and red colours,
for easy identification.
The Relay Box houses the pair of white Kilovac Power relays and the pair of
green Russian capacitor discharge relays. The cables from the capacitor are bolted to
connectors on one side of the box. The output is made available through recessed high
power sockets that only accept specific sized connectors. These allow for easy plugging
in or removal. The polarity of the output power is thus changed by plugging the
connectors of the load into the positive and negative sockets as required.
3.10.1 Current Limiting and Capacitor Discharging Resistors
As mentioned earlier, when the ac power to the capacitor is cut off, the 500 MΩ

60
resistors will drain the capacitor slowly. A quicker discharge is made possible through a
set of high power resistors. The resistors are composed of 100 kΩ ±5%, 20 W resistors,
connected in series to total 1.3 MΩ. These resistors are connected in two sets of 1.1 MΩ
and 2 kΩ, as shown in figure 3.18. The 1.1 MΩ resistance is for current limiting. Thus,
at a maximum dc voltage of 15 kV, if the output terminals were shorted, the maximum
possible current flow is set as
mAM
VR
Vi 64.131.1
15000maxmax =
Ω== (3.18)
This prevents arcing. The resistors have been selected based on power
consumed during maximum current flow, rounded off to 14 mA. The calculated power
for each resistor is found to be 19.6 W.
( ) WkmARIP 6.1910014 22 =Ω== (3.19)
Each resistor has a value of 100 kΩ, 20 W, and they can withstand brief inrush
currents much higher than 25 mA without burning up. However, during normal
operations, these current limiting resistors will result in a voltage drop across them. It
was experimentally that the current flow during corona discharge is in the µA range.
Therefore, for a maximum corona current at a safe level of 50 µA, the voltage drop
across the 1.1 MΩ resistors is
VMARIV coronadrop 551.150 =Ω×== µ (3.20)

61
This is a small price to pay for a good level of safety. During normal operations,
the voltage drop across the resistors has to be deducted from the voltmeter reading to
get the voltage applied across the test section.
Figure 3.18: Circuit showing the current limiting, capacitor discharging and voltage measurement resistors.
For discharging the capacitor, the green relays have to be closed. Thus the 2 kΩ
resistors in the relay box in between the pair of green relays come in series with the 1.1
MΩ resistors, totalling 1.3 MΩ. This resistance forms a parallel resistor network as
1 micro Farad
Relay Relay
500 MOhm
2 kOhm 1.1 MOhm
RT = 1,296,628.8 OhmRTC = 1,296,628.8 Ohm x 1 micro Farad
=1.3 secs.

62
shown in the diagram above. Thus the equivalent resistance is found to be 1.297 MΩ.
Now the capacitor discharges quickly, as the time constant drops to 1.297 seconds. The
capacitor will discharge to a safe level (less than 50V) in about 15 seconds.

63
3.11 Current Measurement of the High Voltage DC Output
Figure 3.19: Current measurement circuit.
The current flow in the output is measured by a voltmeter reading the voltage
across a 10 Ω 1% ¼ W resistor. The voltmeter is a high input impedance digital HP
3468A voltmeter. The current is obtained by directly dividing the reading on the
voltmeter by 10.
Ω=
10readingV
i (3.21)
The uncertainty in the measurement of current with this circuit has been calculated at
1 microFarad
10 Ohm 1%
V
+
-
1.3 MOhm
2 KOhm

64
1%. The HP 3468A digital multimeter is capable of reading as low as 1 µV and as high
as 300 Vdc.
3.12 Safety Features of the High Voltage DC Power Supply
The safety features incorporated into the design of the High Voltage DC Power
Supply are listed below.
• The power supply to the high voltage side of the HVACG, containing the neon
transformer, is supplied through a 1 kVA Line Noise Suppressing Isolation
Transformer, that prevents line noise from getting to the HVACG and high
voltage leaks from getting back into the supply line.
• There are separate lines for the high voltage side and the low voltage control
circuits in the HVACG.
• Each supply line to the HVACG has a Line Filter. Line Filters protect the
equipment from line noise and stop transients from the equipment from going
back into the line.
• The Line Filter on the high voltage side holds two 6.3 A fuses, that protect the
circuit from over currents.
• There is a fuse in line with the input to the auto-transformer. Thus two levels of
fuse protection are present in the circuit of the HVACG.
• Neon transformers have a built in safety feature of current limiting. The iron
core of the transformer saturates if the secondaries are shorted (as in the case of
an arc across the rectified output), whereby an increase in current flow beyond
about 1.1 x the rated maximum current is not possible.

65
• The capacitor is drained by the high voltage resistors of the voltage divider
network, used for measuring the voltage across the capacitor. However, this
takes about 30 minutes for the voltage to drop to a safe handling level. This is
only a safety feature if the capacitor is not discharged.
• There is a capacitor discharge circuit set up to discharge the capacitor down to a
safe level (<50V) in about 10 seconds.
• The current is limited to a maximum of 14 mA by a current limiting resistor.
This prevents arcing at the output. However, this current at higher voltages can
still cause spark discharges to occur.
• The cables connecting the high voltage side of the circuit are all rated at 10
kVdc and then covered with ½ inch thick foam pipe insulation and tightly taped
over with electrical insulation tape.
3.12 Drawbacks of the High Voltage DC Power Supply
The Power Supply is unregulated. Therefore, as more current is drawn, the
voltage across the output falls. At regular corona discharge currents the voltage drop is
not significant and can be compensated by increasing the voltage output with the auto-
transformer until the required voltage is reached. What this does is to increase the input
to the neon transformer, thereby increasing the output of the transformer and the
corresponding rectified output. This is a dynamic compensation method. The reason for
the poor regulation is two fold. One reason is the neon transformer itself because neon
transformers are designed with poor regulation, as that is how neon tubes work. As the
neon gas in the tubes gets ionized, they draw more current, therefore, they require less

66
voltage. This works well for neon light applications. Also the current limiting feature of
the neon transformer affects the secondary winding output regulation, as the windings
are loosely coupled with the core. The second reason for poor regulation of the power
supply is that components required for constructing regulator circuits, such as inductors
and semiconductor devices are not easily available with high voltage ratings and are
very expensive. Therefore it would be very expensive to fit a voltage regulator circuit to
the power supply. Ripple in the circuit is present, although highly attenuated, but as
current flow increases the ripple factor increases. It is difficult to completely eliminate
ripple, but to further minimize ripple, more capacitors would be required. Filter circuits
for high voltage levels are not easy to build because of the difficulty in procuring
components rated at high voltages. The relays do have a small capacitance value. This
allows a 60 Hz signal to pass through to the output even when the contacts are open.
This does not affect the dc operation of the circuit. Despite its drawbacks, the High
Voltage DC Power Supply performs quite well and it meets the power requirements for
the corona discharge project.
3.14 Operation of the High Voltage DC Power Supply
1. Before operating the power supply, ensure that the circuit is complete and there
are no unconnected or loosely connected cables.
2. Connect the control box to the remote control sockets of the High Voltage AC
Power Supply Generator (HVACG) Box with the right cable, making sure the
polarity of the banana plugs are matched (red to red and black to black).
3. Connect the control box to the relay box with the right cable. Make sure all the

67
toggle switches on the front panel are in the off position.
4. Turn on the Fluke 45 multimeter to read the output of the capacitor. Also turn on
the HP 3468 multimeter to read the current flow.
5. Turn on the Control Box main switch located at the rear. The white Kilovac
relays should open as it is turned on. The relays make an audible sound. The
cooling fan at the rear of the Control Box should turn on. The red LED marked
POWER on the front panel of the Control Box should light up.
6. On the HVACG box, set the toggle switch next to the main switch to the OFF
position. Connect the two power cables of the HVACG to the mains. Make sure
the cable to the high voltage side, labelled TRANSFORMER POWER SUPPLY
120V 60HZ 6.3A DUAL FUSE, is connected to the mains through the 1 kVA
Isolation Transformer. Two red LEDs on the top panel of the HVACG marked
TRANS PWR and CNTRL PWR should light up. If they do not, it suggests that
the fuses on the transformer side are blown or the line filters are malfunctioning.
If the LEDs light up, further operations are possible. If not, the issues have to be
resolved.
7. If the LEDs are lighted, turn on the MAIN SWITCH. The yellow LED marked
MAINS should now light up. If not, the fuse in line could have been blown.
8. Set the toggle switch labelled VOLTMETER READING to SUPPLY POWER
and observe the analogue ac voltmeter reading. It should read about 120 V,
showing the voltage of the mains supply. The other position of the toggle switch
labelled I/P POWER allows the voltmeter to read the input to the neon

68
transformer. The rms voltage output of the neon transformer will be 100 times
this reading, if it is a 12000 V neon transformer.
9. The toggle switch next to the main switch may be set to LOCAL ON and the
control box control will be overridden. Set the toggle switch to REMOTE to
control the HVACG from the control box.
10. On the control box, turn on the toggle switch labelled HV AC P/S. The red LED
above the switch on the control box should now turn on. On the HVACG top
panel, the green LED labelled POWER O/P should be lit as well.
11. Now the HVACG is supplying high voltage. Rotate the knob of the auto-
transformer on the HVACG clockwise to increase the voltage and counter
clockwise to decrease the voltage. Observe the reading of the voltmeter on the
capacitor as the knob is rotated. The actual voltage across the capacitor is 100
times the reading. When a reading just below the required voltage is reached,
stop turning the knob; wait for the voltmeter reading to stabilize and then make
the finer adjustments on the knob. It takes a few seconds for the reading to
stabilize. If the capacitor overshoots the required voltage, the capacitor can be
momentarily discharged or brought low by pressing the toggle switch on the
control box marked CAPACITOR DISCHARGE downward. It has a spring
return and will reset to the off position when released. The yellow LED above
the toggle switch should light up during the discharge process.
12. Once the required voltage is reached, on the control box, turn on the toggle
switch marked O/P RELAY CLOSE. The green LED above the switch should

69
light up. The relay contacts are now closed and the capacitor output is being
applied across the load.
13. Note the current reading. The current reading is the reading of the hp digital
Multimeter, (set to dc volts), divided by 10.
14. The actual voltage across the load has to be determined by finding the voltage
drop across the current limiting resistors, which is 1.1 MΩ x the current flow.
The resistors have 5% tolerance.
15. To turn off the high voltage dc power output, turn off the toggle switch marked
O/P RELAY CLOSE.
16. Cut off power to the neon transformer in the HVACG by setting the toggle
switch marked HV AC P/S to the off position.
17. Discharge the capacitor by turning on the toggle switch marked CAPACITOR
DISCHARGE to the on position. The yellow LED should light up. Once the
capacitor is discharged to a safe level, observed by the reading on the voltmeter,
the circuit is safe to handle.
18. Turn off the HVACG by turning off the Main Switch.
19. Once the experiment is over, remove the cables to the HVACG. Turn off the
control box main switch. Turn off the voltmeters finally once it is ascertained
that there is no high voltage on the capacitor. The reading of the capacitor will
fluctuate within a positive and negative low mV reading. This is due to the
resonance in the circuit due to the capacitor, the capacitance and inductances of
the wires, resistors and other components.

70
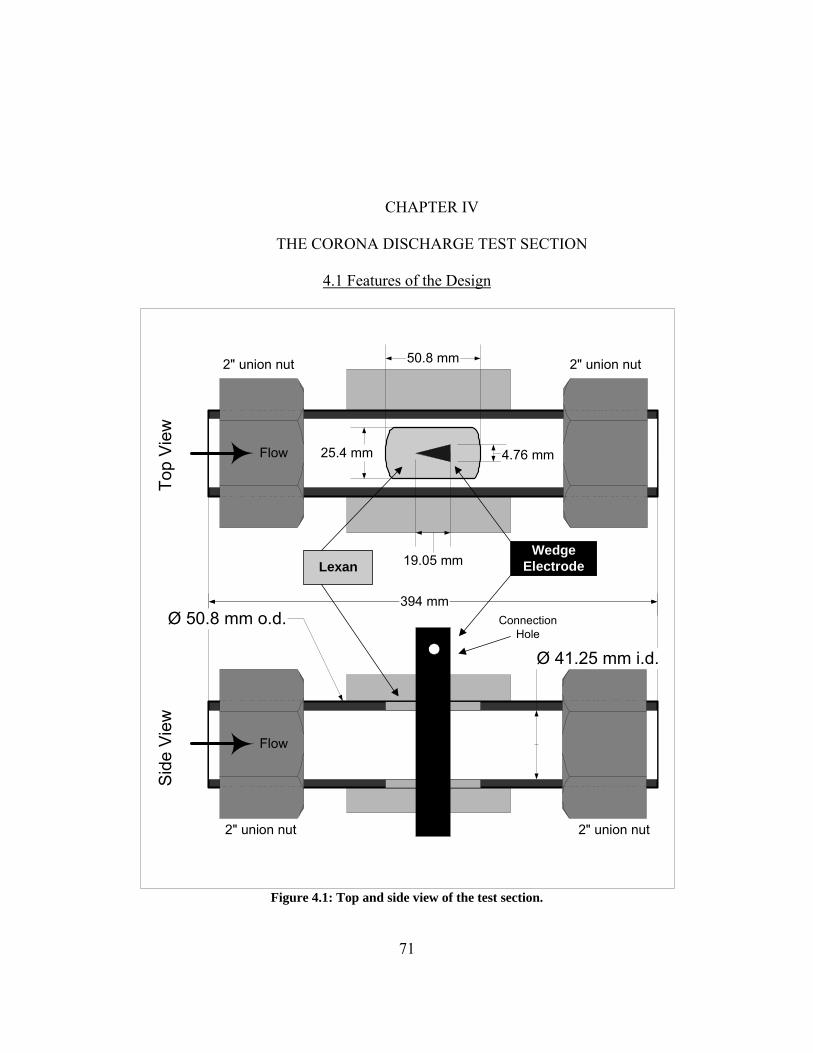
71
CHAPTER IV
THE CORONA DISCHARGE TEST SECTION
4.1 Features of the Design
Figure 4.1: Top and side view of the test section.
50.8 mm
19.05 mm
4.76 mm25.4 mm
Lexan
2" union nut 2" union nut
WedgeElectrode
Flow
Top
View
Side
Vie
w
394 mm
Flow
Ø 41.25 mm i.d.
Ø 50.8 mm o.d.
2" union nut 2" union nut
ConnectionHole

72
The test section is constructed on a piece of 304 stainless steel tube 394 mm
(15.5 in.) long and 50.8 mm (2 in.) outer diameter. The inner diameter is 41.25 mm (1
5/8 in.). Close to the middle of the tube, a cavity is cut into the tube as shown in figure
4.1 above. Into this orifice, a triangular wedge, made of 316 stainless steel, is inserted
and rigidly held in place by Lexan [8] blocks that are machined to press fit onto the
assembly such that the interior is cylindrical and the inside surface is flush with the
inside surface of the steel tube. The reasoning for this design includes mechanical and
electrical aspects.
4.1.1 Mechanical aspects of this design
The test section has to fit into the shock tube, as explained before, for the
second phase of the study involving supersonic tests. Therefore, the construction is
made of materials that can withstand the huge forces developed during the operation of
the tube. The wedge and the steel tube are joined together by machined blocks of
Lexan. Lexan has high tensile strength, is highly impact resistant and can withstand heat
up to about 150oC. It is also relatively easy to machine. Lexan is translucent.
The stainless steel tube is the same size as the shock tube. This is why the test
section has 2 inch union nuts attached to it, so that it can be screwed onto the 2 inch
union connectors on the shock tube.
The wedge shape has been adopted for its advantageous aerodynamic qualities.
In a supersonic flow, a sharp triangular wedge presents a lower profile than a blunt
body, resulting in a weak attached shock formation, whereas a blunt body creates a
strong bow shock. The pressure losses due to the attached shocks are lower. Thus the
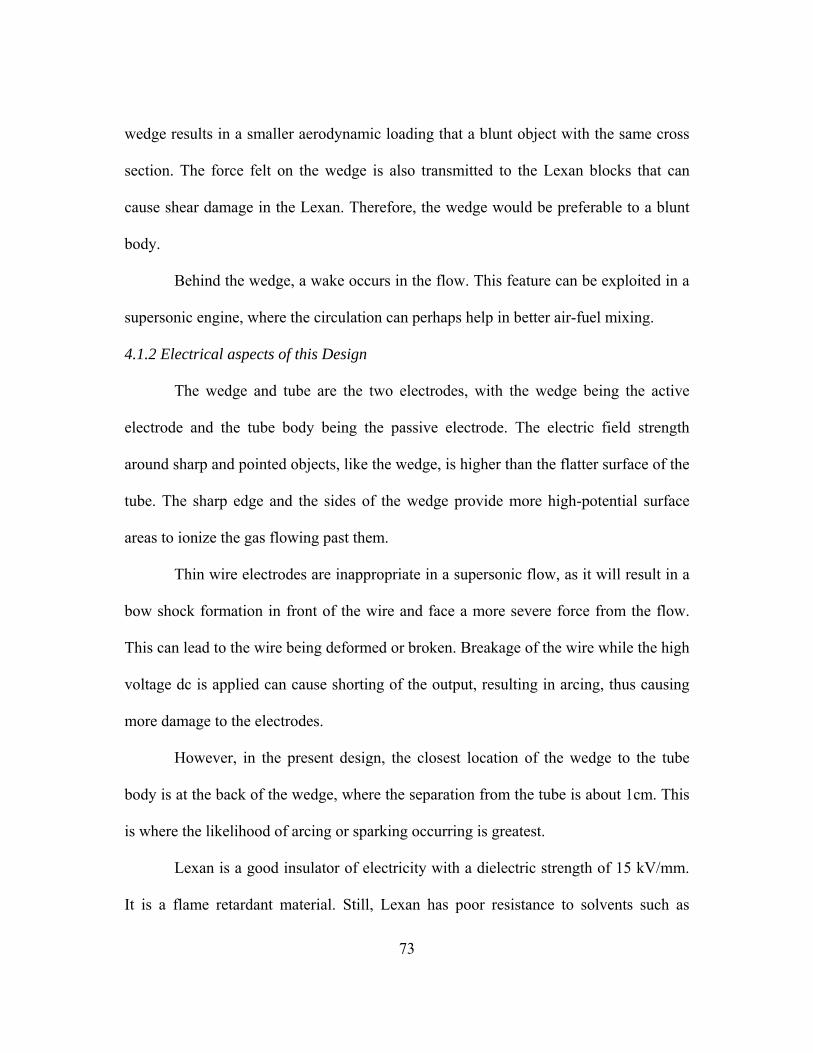
73
wedge results in a smaller aerodynamic loading that a blunt object with the same cross
section. The force felt on the wedge is also transmitted to the Lexan blocks that can
cause shear damage in the Lexan. Therefore, the wedge would be preferable to a blunt
body.
Behind the wedge, a wake occurs in the flow. This feature can be exploited in a
supersonic engine, where the circulation can perhaps help in better air-fuel mixing.
4.1.2 Electrical aspects of this Design
The wedge and tube are the two electrodes, with the wedge being the active
electrode and the tube body being the passive electrode. The electric field strength
around sharp and pointed objects, like the wedge, is higher than the flatter surface of the
tube. The sharp edge and the sides of the wedge provide more high-potential surface
areas to ionize the gas flowing past them.
Thin wire electrodes are inappropriate in a supersonic flow, as it will result in a
bow shock formation in front of the wire and face a more severe force from the flow.
This can lead to the wire being deformed or broken. Breakage of the wire while the high
voltage dc is applied can cause shorting of the output, resulting in arcing, thus causing
more damage to the electrodes.
However, in the present design, the closest location of the wedge to the tube
body is at the back of the wedge, where the separation from the tube is about 1cm. This
is where the likelihood of arcing or sparking occurring is greatest.
Lexan is a good insulator of electricity with a dielectric strength of 15 kV/mm.
It is a flame retardant material. Still, Lexan has poor resistance to solvents such as

74
Acetone. Also Lexan tends to carbonize when arcing occurs over its surface. Carbon
conducts electricity and therefore, carbon deposition on the surface defeats the purpose
of Lexan as an insulator.
A major problem with the manufacturing of the test section is that the surface of
the Lexan on the inside of the pipe is not exactly flush with the surface of the steel pipe,
as shown in figure 4.2. The Lexan is about 0.5 to 1 mm below the steel surface. This
makes the edges of the raised portion of the steel tube to appear as sharp surfaces,
causing the electric field strengths around them to be very high. Thus arcing can be
induced between these edges and the wedge. It is recommended that this depression be
filled with an insulating heat resistant material.
Figure 4.2: A side view showing the imperfection in level of the Lexan and the steel surfaces.
Steel Tube
WedgeElectrode
Side View
Lexan

75
A better material in place of Lexan would be ceramic. Ceramic has dielectric
strengths of about 250 kV/mm, can withstand very high temperatures, and has high
strength and good resistance to chemical solvents. However, it is brittle and will have to
be reinforced with some external structures and ceramic is hard to machine and cut. The
ceramic parts may have to be moulded. This can increase costs.
The electrical lead is bolted to the wedge through a ¼ inch hole drilled through
it at the top. The wires are insulated with the foam pipe insulation and taped. The joint
of the wire and the part of the wedge protruding outside the Lexan blocks are also
covered with silicon sealant to prevent any corona discharge on the outside of the test
section. The electrical cable from the wedge is covered with black and red insulation
tape and the cable from the tube is covered with blue tape, for easy identification. The
Lexan blocks are held in place by a system of clamps which are fastened with bolts and
nuts.

76
CHAPTER V
ION DETECTION PROBES
Plasma is a conducting gas composed of charged particles, ions and electrons.
Neutral plasma has an equal number of negative and positive charged particles. For
most applications involving low temperature and low kinetic energy plasma, the
Maxwell distribution of particles is adopted [14]. The Maxwell distribution is based on
the velocities of the particles. The mean kinetic energy of a particle in 3D space is
shown as
23
2
2 TvM= (5.1)
where M is the average mass of the particles, v is the average velocity and T is the
temperature. The number of particles having velocity v, n(v), out of the total population
of plasma particles N, is given by the following equation.
⎟⎟⎠
⎞⎜⎜⎝
⎛−
⎟⎟⎠
⎞⎜⎜⎝
⎛= T
vM
eT
MNvn 223 2
2)(
π (5.2)
When plasma comes into contact with a surface, the charge carriers hit the wall
and loose their charge. Electrons, having more kinetic energy, are absorbed by the wall
faster. Thus a region of net positively charged plasma is formed around the surface.
This is called a sheath. Sheaths are formed around spacecrafts and satellites as they
coast in the exosphere of the earth. Sheaths also form on the surface of probes that are

77
introduced into the plasma to measure its properties.
The charged particles within the plasma exert electrostatic (Coulombic) forces
on each other. Consider an electron within a plasma. Positive particles are attracted by
this electron and move closer to it while negative particle are repelled by the electron
and move away from it. The maximum distance within the plasma that the effect of this
electron is felt is called the Debye length or Debye screening length. It is named after
Peter J. W. Debye (1884-1966), a Dutch-born American physicist and 1936 Physics
Nobel Prize Laureate.
The region around the electron with radius equal to its Debye length forms a
Debye sphere. If a charge is present in vacuum its effect is theoretically felt into
infinity. However, for a plasma, there is a huge number of charged particles in close
proximity, and therefore, the charge effect can be neglected outside the Debye Length.
The Debye lengths λD [13] for electrons are expressed by the following equation
where k is the Boltzmann’s Constant, e is the charge of the electron, ne is the
concentration of the electrons and Te is the electron temperature.
e
eD ne
Tk24π
λ = (5.3)
Electric fields applied to a plasma can penetrate only in the order of the Debye length of
the plasma, i. e. multiples of the Debye length, and this sheath thickness is proportional
to the strength of the electric field applied. These concepts are important for the
understanding of Langmuir probes.
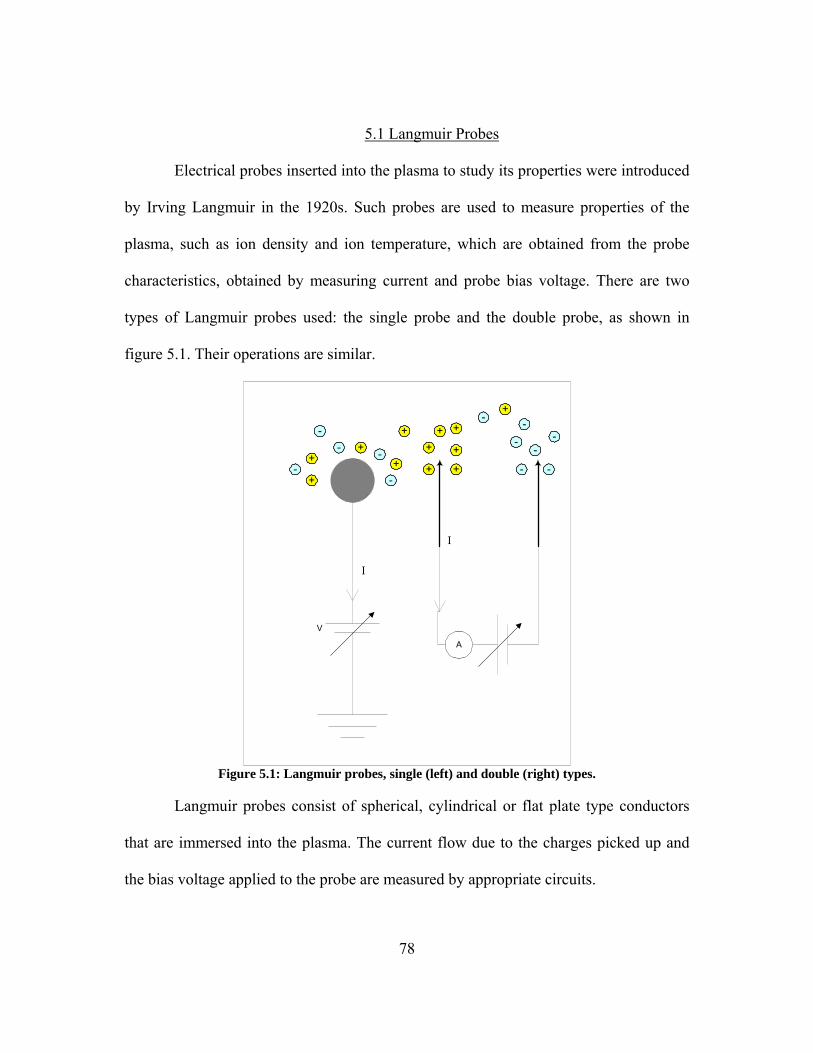
78
5.1 Langmuir Probes
Electrical probes inserted into the plasma to study its properties were introduced
by Irving Langmuir in the 1920s. Such probes are used to measure properties of the
plasma, such as ion density and ion temperature, which are obtained from the probe
characteristics, obtained by measuring current and probe bias voltage. There are two
types of Langmuir probes used: the single probe and the double probe, as shown in
figure 5.1. Their operations are similar.
Figure 5.1: Langmuir probes, single (left) and double (right) types.
Langmuir probes consist of spherical, cylindrical or flat plate type conductors
that are immersed into the plasma. The current flow due to the charges picked up and
the bias voltage applied to the probe are measured by appropriate circuits.
V
+
-
+
-+
-
+ -- +
A
+-
+
-+
-
+
--+
+ - -
+
I
I

79
Figure 5.2: Probe characteristic lengths.
The general assumption made for studying Langmuir probe characteristics is
that the plasma is composed of positive ions and electrons, i. e., there are no negatively
charged particles, except electrons. When the probe is inserted into the plasma, a
potential difference is created. The plasma may be at a different potential φs from the
probe potential φp. As a result, a sheath is formed around the probe, whose thickness is
assumed to be a multiple of the Debye length λD. The sheath thickness is directly
proportional to the probe potential. Outside of the sheath, the plasma is undisturbed by
the probe.
The probe potential is often applied in the form of a saw tooth waveform. The
probe potential and the current measured are used to study the probe characteristics.
Charge density and temperature can be determined from the probe characteristics. The
number of charged particles may be calculated from the following equation.
2 rp
2 rp lp

80
vqAI
np
p04= (5.4)
Ip0 is the probe current when probe potential is zero, Ap is the effective probe area, q is
the charge of the particle and v is the average velocity of the particle. The average
velocity is given by
mTk
vπ
8= (5.5)
where k is Boltzmann’s constant and m is the mass of the particle. The temperature of
the charge particles may be obtained from the slope of the probe characteristics on a
semi-logarithmic scale of the voltage as
⎟⎟⎠
⎞⎜⎜⎝
⎛−=
0
lnp
p
pB II
dUd
kqT (5.6)
where Up is the applied probe potential and Ip is the probe current, Ip0 is the probe
current when Up = 0.
Langmuir probes are technically simple and easy to implement. From just
simple probe voltage and current measurements, many plasma properties such as charge
densities and temperatures may be calculated. However, there are some drawbacks. The
mass of the charge carriers needs to be known. The plasma is disturbed by the
introduction of the probe and causes a draining of the charge carriers.
5.2 Probes Used in the Bench Test
The probes used for this study were very simplistic. The circuits used are shown
in figures 5.3 and 5.4 below. The probes are made by inserting stainless steel needles

81
(sewing needles) into ceramic tubes, with a portion sticking outside. To find the surface
areas of the needles that are exposed, the needles are modelled as a cone atop a cylinder.
Each needle is 1 mm in diameter, and the conic section is 5 mm long. The surface areas
of each of the double probe are found to be 3.29 x 10⁻⁵ m2 and that of the single probe is
4.87 x 10⁻⁵ m2.
Figure 5.3: Single probe circuit.
0 to 100 Vdc BiasVoltage
10 MOhm
I
I = V/R = V/10MOhm
+ -
+ -
+ -
+ -- +
Digital StorageOscilloscope

82
Figure 5.4: Dual probe circuit.
Figure 5.5: The probe needles.
With these probes, the waveform of the voltage across the resistor could be
observed on an oscilloscope. The current flow is given by Ohm’s law I = V/R = V/10
MΩ. There was no bias voltage applied for the tests.
0 to 100 VdcBias Voltage
10 MOhm
I
+-
+ -
+ -+-
- ++
- +
- +-
Digital Storage Oscilloscope
Ceramic tube
Needles

83
CHAPTER VI
BENCH TESTING OF TEST SECTION IN STATIC AND SLOW SPEED AIR
6.1 Bench Test Results
The setup for the bench testing of the test section is shown below in figure 6.1.
The test section is placed in ambient air and a high dc potential is applied. A blower fan
is placed in front of the test section to cause the ions to flow out. The high voltage dc
power is applied to the electrodes and observations of the voltage across the electrodes,
the current flow from the power supply and effects due to corona discharge are noted.
Figure 6.1: Setup for bench testing.
Table 6.1 is a qualitative record of the results of the initial bench testing. For the
wedge made negative, there was no corona visible up to 9.5 kV. There was a hissing
sound and smell of ozone in the air at lower voltages. At 9.5 kV, one glowing spot of
+ -
+ -
+ -
+ -- +
+
+
-
- -
++
+-
Blower Fan (Hot/Cold)
Oscilloscope
HV DC PowerSupply
The Test Section

84
corona was visible on the knife edge of the wedge, about 5 mm from the top. As the
voltage was increased, two corona spots became visible on the knife edge at 10 kV,
with the new one about 5 mm from the bottom. At 11 kV, there were four corona spots
visible, such that they were roughly equally spaced from each other. At a little over 11.5
kV, a loud arc shot across the wedge to the pipe. The corona is seen as bluish-white
spots on the tip of the sharp edge of the wedge.
For the tests with the wedge made positive with respect to the pipe, there was
strong hissing sound and smell of ozone in the air; however, there were no visible
corona up till the arcing at about 10 kV. It was observed that arcing occurred at a lower
voltage for positive corona. Also, there were spots of corona visible on the fixtures on
the outside of the pipe, which was negative with respect to the wedge.
Table 6.1: Initial bench test results. Negative Corona Positive Corona
Voltage Effects Voltage Effects
9000 V Nil 4500 V Spot seen on
outside, no corona inside
9550 V One corona spot 6000 V Spots of corona on outside
10000 V Two corona spots, hissing sound 7000 V Spots of corona on
outside
10570 V Two corona spots, hissing sound 8000 V Spots of corona on
outside
11040 V 4 corona spots, strong hissing. 9000 V Spots of corona on
outside
11555 V Loud Arc shot once, power supply cut off 10035 V Loud Arc, power
supply cut off.
After several tests, the arcing caused the Lexan surface to char leaving a
carbonized trail over the surface across which the arc had discharged. This carbon trail
conducted electricity. Therefore, the test section had to be removed and cleaned.

85
Following the reassembly, the test section was put through further tests. Figure 6.2
shows the results for both positive and negative corona tests. A maximum ceiling
voltage of 7 kV was maintained to prevent arcing. For negative corona tests, corona was
visible at a lower voltage now than when the test section was new. This could be
ascribed to impurities present on the wedge and inside the test section. There was no
visible corona for the case where the wedge was positive.
Figure 6.2: Voltage-current characteristics of corona for the test section.
Due to the deterioration of the Lexan surface caused by the arcing, several attempts
were made to protect it from charring. Electrical insulating varnish was applied, but this
compound has a low tolerance to high temperatures. Also the solvent present in the
varnish causes damage to the Lexan. Teflon strips were glued to the surface with special
adhesive for Teflon; however they became unstuck when pressure was applied. Finally,
a ceramic cement called Sauereiesen Electrotemp Cement No. 8 Powder [37] was
V-I Characteristics
0
2
4
6
8
10
12
14
16
0 1000 2000 3000 4000 5000 6000 7000 8000
Volts
mic
ro A
mps
. Positive CoronaNegative Corona
Visible Corona spot

86
applied. It is composed of Silica (SiO2), Zirconium Silicate (ZrSiO4), Magnesium Oxide
(MgO) and Magnesium Phosphate (MgHPO4). It is in a powder form that is mixed with
water, made into a paste and applied. It sets after half an hour and takes 24 hours to
cure. Once cured it is forms a strong contact and a hard surface. The setting is due to the
reaction of the phosphate with water. It has high electrical resistivity, heat conductivity
and resistant to thermal shocks (which can occur due to an arc). It has a dielectric
strength rated at 2900 to 3900 V/mm at 21oC. It can withstand temperatures up to
1426oC.
Figure 6.3: Voltage-current characteristics for negative corona before and after the application of ceramic cement.
When the test section was subjected to tests after the application of the cement,
it was observed that the current flow from the power supply had increased by more than
a factor of 10. This is shown in figure 6.3. The increase in current at lower voltages is
credited to a phenomenon known as Malter effect. An interesting point to note here is
Negative Corona V-I Characteristics
0
10
20
30
40
50
60
0 1000 2000 3000 4000 5000 6000 7000 8000 9000
Volts
mic
ro-A
mps
with Cementw/o Cement
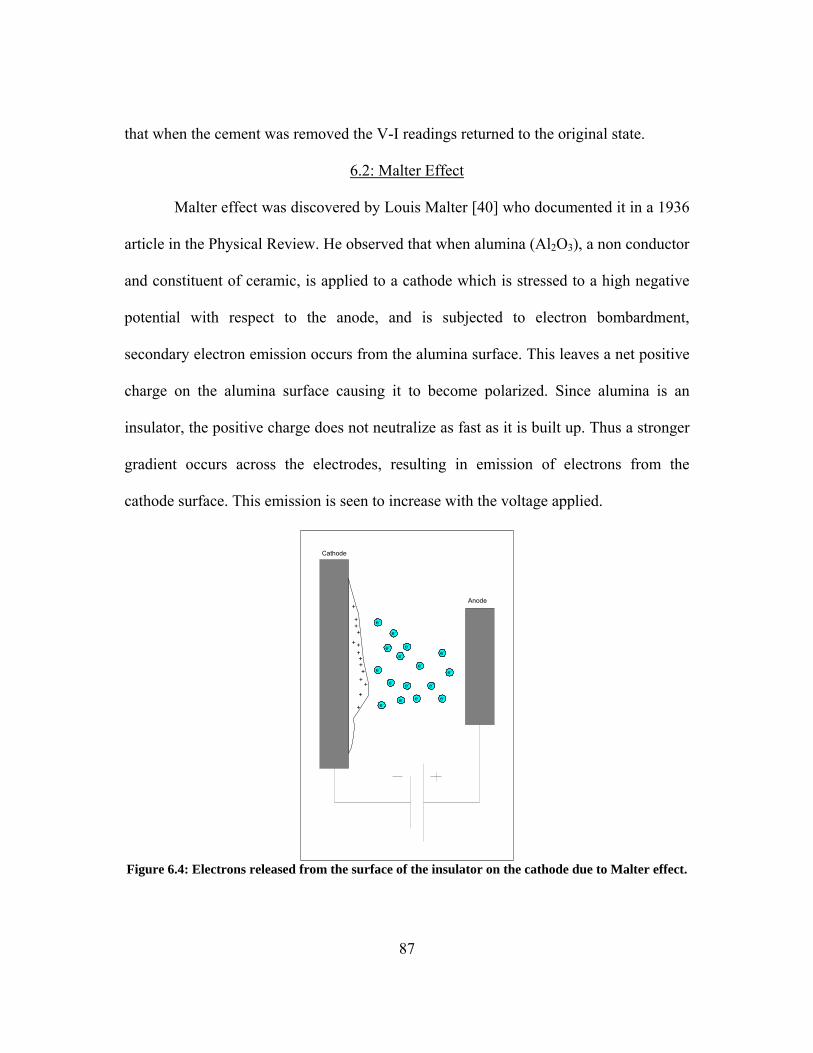
87
that when the cement was removed the V-I readings returned to the original state.
6.2: Malter Effect
Malter effect was discovered by Louis Malter [40] who documented it in a 1936
article in the Physical Review. He observed that when alumina (Al2O3), a non conductor
and constituent of ceramic, is applied to a cathode which is stressed to a high negative
potential with respect to the anode, and is subjected to electron bombardment,
secondary electron emission occurs from the alumina surface. This leaves a net positive
charge on the alumina surface causing it to become polarized. Since alumina is an
insulator, the positive charge does not neutralize as fast as it is built up. Thus a stronger
gradient occurs across the electrodes, resulting in emission of electrons from the
cathode surface. This emission is seen to increase with the voltage applied.
Figure 6.4: Electrons released from the surface of the insulator on the cathode due to Malter effect.
+
+
+
+
+
+
+
+
++
+
+
+
+
e-
e- e-
e-
e-
e-
e-
e-
e-
e-
e-
e-
e-e- e-
e-
Anode
Cathode

88
The secondary emission does not stop when the electron bombardment is
removed, but gradually decays. Shining light up on the cathode was found to reduce the
emission. Malter observed this effect on Al2O3, MgO, Zn2SiO3, SiO2, ZrO2, CaCO3,
Ta2O5 and a few other oxides.
For Malter effect to occur, the following conditions must be met. The cathode
must be covered partially by an insulator. There must be an initiating source for the
emission, like an electron bombardment or strong ionization, such as corona discharge.
The rate at which electrons are emitted must be greater than the rate of removal of the
positive charge from the surface of the insulator.
Figure 6.5: Side view of the test section showing the ceramic cement application overlapped on the wedge.
For the test section, when the ceramic cement was applied, cement was partly
overlapping the wedge electrode, as shown in figure 6.5. Subsequent tests showed that
corona was seen to occur at a lower voltage and the current flow was seen to be much
Steel Tube
Wedge Electrode
Side View
Lexan

89
higher than for the clean configuration. Malter effect is suspected for this increase in
current.
6.3: Results of the Ion Detector Probes
The ion detector probes yielded a complex waveform that was observed on a digitizing
oscilloscope. The waveform pattern was as shown in figure 6.6. It shows a sharp peak
of about 5ms duration followed by a flat plateau region. The frequency of this
waveform is 60 Hz. It is thought that the probe acts like an antennae and picks up noise
from the power supply. The sharp peak is due to the charging of the capacitor. This
peak increases in intensity as the probe is brought closer to the test section and drops as
the probe is moved away. However, it is not a conclusive evidence of ion detection.
Therefore, a more sophisticated circuit involving amplifiers has to be assembled.
Figure 6.6: The waveform picked up by the ion detector probes.
mV
16.67 ms = 60 Hz

90
A different type of probe circuit [41] is proposed to measure the current, as
shown below. This circuit has a current to voltage converter amplifier or trans-
impedance amplifier that can measure the extremely small currents that are picked up
due to the ions.
Figure 6.7: Proposed new probe circuit.
ProbeInput
SawtoothWaveform
Current toVoltage
Amp
Oscilloscope

91
CHAPTER VII
CONCLUSIONS AND RECOMMENDATIONS
7.1 Conclusions
The High Voltage Power Supply that was built has been found to fit the
requirements adequately. It is able to deliver dc voltages up to about 15 kVdc, beyond
the required level for corona discharge in the test section, which is up to 8 kVdc. There
is however a small drop in voltage as higher currents are drawn. This can be
compensated for by raising the input voltage.
The test section has been found to be suitable for the generation of corona.
Corona was observed for both positive and negative polarity. However, at higher
voltages, initially greater than 11 kV for negative corona and 10 kV for positive corona,
strong arcing was observed. Arcing was prevented by the introduction of current
limiting resistors. Yet despite the resistors, high current corona streamers were observed
at high voltages of about 9 kV that charred the surface of the Lexan. These streamers
were found to originate at the rear of the wedge, where it is closest to the steel pipe.
This caused carbonization of the surface leading to conduction. The streamers seemed
to be erratic, sometimes originating at mid level voltages about 8 kV. Several methods
were tried to treat the Lexan surface. Electrical insulating varnish caused slight erosion
of the surface but offered no protection from charring. A thin coating of ceramic cement
on the surface was found to be mechanically strong. However, the threshold of corona

92
was now found to be lowered, with corona spots being visible at as low as 4 kV.
Current flows were considerable higher, i.e., where the current at 5 kV were earlier
found to be immeasurable (< 1 µA), now it seemed to be in the range of 35 to 40 µA.
This is thought to be an indication of the Malter effect.
The probes built for the tests detected the presence of ionic charges in the area
outside the charged test section and show a drop in intensity of waveform as distance
from the test section was increased. However, the results were inconclusive and the
circuit is thought to be not sophisticated enough to determine ion density and
temperature. This is because the circuit contains only passive devices, resistors and
capacitors, with no amplifiers, and therefore, the current flow due to ions is not strong
enough to be quantified. Still, the waveform does show presence of ions.
7.2 Recommendations
A different step-up high-voltage transformer, with better secondary regulation,
would render improved regulation to the High Voltage DC Power Supply. Neon
transformers inherently have poor regulation as they are designed for neon light
applications where such performance is required. Such a powerful step up transformer
with high secondary ratings would be expensive. A flatter dc output would be obtained
if the size of the filter capacitor is increased. Although 1 µF performs quite well, a
higher rated capacitor would further reduce the ripples. It is recommendable to purchase
another high voltage power relay to cut off the 500 MΩ voltage divider resistors from
the capacitor to prevent draining the capacitor when pure dc is required from the
capacitor with the ac power turned off.

93
The biggest set back faced with the test section is the Lexan insulator blocks
getting charred by the arcing. It would be better to build the test section with ceramic
insulation instead because ceramic has better mechanical strength, can withstand higher
temperatures, has a higher dielectric strength and is resistant to solvents [38].
The probe circuit has to be modified to include a current to voltage converter or
a trans-impedance amplifier. This can enable the measurement of feeble currents that
are created by the ions.
More tests need to be carried out to determine if the Malter effect is indeed the
reason behind the lowering of the corona threshold voltage and to uncover the effects on
the test section. If Malter effect is occurring, it would be advantageous to have a lower
corona threshold in a supersonic combustion engine application [39].
AC of high frequency (>100 kHz) is recommended for increased ionization
especially at high pressures. The starting voltage for the onset of corona increases as
pressure and electrode spacing goes up. With DC corona, a sheath is formed around the
electrodes. This would not be the case for supersonic flow corona, as the plasma would
get dislodged and carried away by the flow. As the frequencies are increased, the sheath
region also changes in size and the ions cross the sheaths rapidly. Thus the ions gain
kinetic energies and two effects are observed. Firstly, it results in increased secondary
ionization away from the electrodes, and secondly, there is ionic heating of the plasma
due to the displacement current. Thus, less voltage levels are required for AC corona.
For industrial applications, plasma is generated using high frequencies in the MHz
range. Power supplies for plasma generation are available commonly at 13.56 MHz.

94
APPENDIX A
CIRCUIT DIAGRAM OF THE HIGH VOLTAGE AC GENERATOR

95

96
APPENDIX B
CIRCUIT DIAGRAM OF THE HV DC POWER SUPPLY

97

98
APPENDIX C
CIRCUIT DIAGRAM OF THE CONTROL BOX

99
120 V, 60 Hz
DPST Switch
Red(Power)
270R
Red(HV AC PS)
Green(O/P Relay)
Yellow(Discharge Relay)
Front Panel
530R 370R 530R
SCR
12 Vdc
FanTo
HV
ACPo
wer
Supp
lyTo
Rel
ayBo
x
WhiteRelays
GreenRelays
120V/12-0-12VTransformer
12 V
dc
12 Vac 12 Vac
24 Vdc
SPSTToggle
DPDTToggle
SPDTspringreturnToggle
SPDT Relay24Vdc coil
120V/6V60Hz

100
REFERENCES
1. Keidar, M., Boyd, I. D., Beilis, I. I., “Plasma Flow and Plasma-Wall Transition
in Hall Thruster Channel”, Physics of Plasmas, Vol. 8, No. 12, Dec. 2001.
2. Artana, G., D’Adamo, J., Leger, L., Moreau, E., Touchard, G., “Flow Control
with Electrohydrodynamic Actuators”, AIAA Journal, Vol. 40, No. 9, Sep. 2002.
3. Yano, R., Contini, V., Plonjes, E., Palm, P., Merriman, S., Aithal, S.,
Adamovich, I., Lempert, W., Subramaniam, V., Rich, J. W., “Supersonic
Nonequilibrium Plasma Wind-Tunnel Measurements of Shock Modification and
Flow Visualization”, AIAA Journal, Vol. 38, No. 10, Oct. 2000.
4. Stuessy, W. S., Murtugudde, R. G., Lu, F. K., Wilson, D. R., “Development of
the UTA Hypersonic Shock Tunnel”, AIAA Paper 90-0090, 1990.
5. Stuessy, W. S., Liu, H. C., Lu, F. K., Wilson, D. R., “Experiments on Weakly
Ionized Air and Nitrogen Plasmas for Hypersonic Propulsion Facility
Development”, AIAA Paper 99-2448, 1999.
6. Liu, H. C., “Electrical Conductivity Measurement of a High Pressure Seeded Air
Plasma”, Ph.D. Dissertation U.T.A., 1998.
7. Tishkoff, J. M., Drummond, J. P., Edwards, T., Nejad, A. S., “Future Directions
of Supersonic Combustion Research: Air Force/ NASA Workshop on
Supersonic Combustion”, Newport News, Virginia, 1996.
http://techreports.larc.nasa.gov/ltrs/PDF/1997/aiaa/NASA-aiaa-97-1017.pdf
8. www.geplastics.com
9. http://www.colorado.edu/physics/2000/bec/

101
10. http://www.bec.nist.gov/
11. http://www.ee.nmt.edu/~langmuir/langmuir.html
12. http://fusedweb.pppl.gov/CPEP/Chart_Pages/5.Plasma4StateMatter.html
13. Hippler, R., Pfau, S., Schmidt, M., Schoenbach, K. H., Low Temperature
Plasma Physics: Fundamental Aspects and Applications, Wiley-VCH, NY,
2000.
14. Smirnov, B. M., Introduction to Plasma Physics, Mir Publishers, Moscow,
1977.
15. The National Research Council, Plasma Science: From Fundamental Research
to Technological Applications, National Academy Press, Washington, D.C.,
1995.
16. Wilson, R.G., Brewer, G. R., Ion Beams: With Applications to Ion Implantation,
Robert E. Krieger Publishing Company, Huntington, NY, 1973.
17. Loeb, L., B., Electrical Coronas: Their Basic Physical Mechanisms, University
of California Press, Berkeley, 1965.
18. Anikin, N. B., Pancheshnyi, S. V., Starikovskaia, S. M., Starikovskii, A. Y.,
“Air Plasma Production by High Voltage Nanosecond Gas Discharge2, AIAA
2001-3088.
19. Aleksandrov, N. L., Anikin, N. B., Bazelyan, E. M., Zatsepin, D. V.,
Starikovskaia, S. M., Starikovskii, A., Y., “Chemical Reactions and Ignition
Initiation in Hydrocarbon-Air Mixtures by High Voltage Nanosecond Gas
Discharge”, AIAA 2001-2949.
20. Shale, C. C., Bowie, W. S., Holden, J. H., Strimbeck, G. R., “Characteristics of
Positive Corona for Electrical Precipitation at High Temperatures and
Pressures”, United States Department of the Interior, Bureau of Mines, 1964.

102
21. http://pulsedpower.usc.edu/
22. Vinogradov, J., Sher, E., Rutkevich, I., Mond, M., “Voltage-Current
Characteristics of a Flame-Assisted Uni-polar Corona”, Pearlstone Center for
Aeronautical Studies, Dept. of Mechanical Engg., Ben-Gurion University of the
Negev, Beer Sheva, 84105 Israel, 2001.
23. Chernikov, V. Ershov, A., Shibkov, V., Timofeev, I., Timofeev, B., Vinogradov,
V., Van Wie, D., “Gas Discharges in Supersonic Flows of Air-Propane
Mixture”, Moscow State University, Moscow, Russia, 2001.
24. Ekchian, J., Nowak, V., Rush, J., “A Compact Corona Discharge Device (CCD)
for Non –Thermal Plasma Generation in Gasoline or Diesel Engine Exhaust”,
Litex, Inc., http://www.osti.gov/hvt/deer2000/deer2000wkshp.html
25. Jackson, S., P., Selection and Application of Metallic Rectifiers, McGraw-Hill,
NY, 1957.
26. http://science.howstuffworks.com
27. Rashid, M., H., Power Electronics, Circuits, Devices and Applications, 2nd
Edition, Prentice-Hall International, New Delhi, India, 1996.
28. http://www.repairfaq.org/REPAIR/F_flytest.html
29. http://www.hills2.u-net.com/tesla/neon.htm [used with permission from
Christopher J. Hill, [email protected]]
30. http://www.franceformer.com
31. Cheng, D., K., Field and Wave Electromagnetics, 2nd Edition, Addison-Wesley
Publishing Company, NY, 1989.
32. Asokan, T., “Ceramic Dielectrics for Space Applications”, Current Science,
Vol. 79, No.3, 10 August 2000.

103
http://tejas.serc.iisc.ernet.in/~currsci/aug102000/mg7.pdf [used with permission
from the author]
33. http://www.jenningstech.com
34. http://www.kilovac.com
35. Holman, J. P.: Experimental Methods for Engineers, 7th ed., McGraw Hill, New
York, 2001
36. http://www.blpcomp.com/productinfo/filters2.php
37. http://www.sauereisen.com/index.htm
38. http://matse1.mse.uiuc.edu/~tw/ceramics/ceramics.html
39. http://www.yet2.com/app/insight/techofweek/25253?sid=200
40. Malter, L., “Thin Film Field Emission”, Phys. Rev. 49, 478, Vol. 50, July 1936.
41. Batani, D., Alba, S., Lombardi, P., Galassi, A., “Use of Langmuir Probes in a
Weakly Ionized, Steady-State Plasma With Strong Magnetic Field”, Rev. Sci.
Instrum. 68 (11), November 1997.
104
BIOGRAPHICAL INFORMATION
Philip Panicker was born on the 4th of September 1973 in the small town of
Mavelikara, in the southern most state of India called Kerala. He attended The Bishop
Moore Vidhyapith School in Mavelikara up to the 3rd standard and The Indian High
School Dubai, Dubai, United Arab Emirates, till the 12th standard. He completed the
Bachelor of Engineering in Electronics and Telecommunication degree in 1995 at M. S.
Ramaiah Institute of Technology, Bangalore, India. In 1999 he was accepted to the
college of Mechanical and Aerospace Engineering of The University of Texas at
Arlington (UTA). For two years he had to undertake prerequisite subjects for the change
of major from Electronics to Aerospace Engineering. In the fall of 2001, he joined the
research team of Drs. Frank Lu, Don Wilson, George Emanuel and Bernard Svihel at
the Aerodynamics Research Centre (ARC) of the UTA to pursue research in
experimental high speed gas dynamics and propulsion.
He has plans to obtain a PhD and continue research in several areas of interest,
including experimental gas dynamics, propulsion, power generation and the exploration
of renewable sources of energy generation. He has been a student member of the
American Institute of Aeronautics and Astronautics since the year 2000. This is a
detailed report of his work done for the Masters of Science in Aerospace Engineering
degree presented in August 2003.