core.ac.uk · i acknowledgement firstly, i would like to express my sincere gratitude to my...
TRANSCRIPT

IMPROVING THE PROPERTIES OF PHARMACEUTICAL
POWDERS USING SUPERCRITICAL ANTI-SOLVENT
PROCESSING
LIM TAU YEE, RON
NATIONAL UNIVERSITY OF SINGAPORE
2012

IMPROVING THE PROPERTIES OF PHARMACEUTICAL
POWDERS USING SUPERCRITICAL ANTI-SOLVENT
PROCESSING
LIM TAU YEE, RON
(B. Eng. (Hons.), UNIVERSITY OF BATH, U.K.)
(M. Eng., NUS)
A THESIS SUBMITTED
FOR THE DEGREE OF DOCTOR OF PHILOSOPHY
DEPARTMENT OF CHEMICAL AND BIOMOLECULAR
ENGINEERING
NATIONAL UNIVERSITY OF SINGAPORE
2012

DECLARATION
I hereby declare that this thesis is my original work and it has been written by me in its
entirety. I have duly acknowledged all the sources of information which have been used in
the thesis.
This thesis has also not been submitted for any degree in any university previously.
Lim Tau Yee, Ron 29th January 2013

i
ACKNOWLEDGEMENT
Firstly, I would like to express my sincere gratitude to my supervisor, Prof. Reginald
Tan and my co-supervisor, Dr. Ng Wai Kiong for their advice and patient guidance to
me throughout the candidature.
I am very grateful to Agency for Science, Technology and Research (A*STAR) for
providing me the scholarship during my study in NUS. I am also very grateful to Dr.
Keith Carpenter, Executive Director of Institute of Chemical and Engineering Sciences
(ICES) for supporting me throughout the candidature. I also like to thank Prof. Satoru
Watano, Prof. John Dodds, Dr. Jerry Heng, Dr. Gerry Steele and Dr. Simon Black for
giving me very useful advice in my research work. I wish to thank Dr. Elisabeth
Rodier and Ms. Sylvie for their advice and study in DSC.
The colleagues and fellow students at the ICES have been most supportive to me. I
would like to thank Dr. Martin Wijaya Hermanto, Mr. Ng Jun Wei, Ms. Tan Li Teng
and Ms. Agnes Nicole Phua for their invaluable support in analytical studies. I wish to
thank Dr. Effendi Widjaja for his support in Raman characterization and analysis. I
also like to thank Mr. Jerry Wisser, Thar USA Engineering Support Manager for his
constant help and support on the operation of Super Particle SAS50 system. My wife,
Shu Yen, and my family have been most understanding to my long research hours.
I would like to thank the Science and Engineering Research Council of A*STAR
Singapore for awarding me the Scientific Staff Development Award (SSDA) and
providing financial support to this research project.

ii
TABLE OF CONTENTS
ACKNOWLEDGEMENT ............................................................................................... i
TABLE OF CONTENTS ................................................................................................ ii
SUMMARY ................................................................................................................... vi
NOMENCLATURE ...................................................................................................... ix
ABBREVIATION .......................................................................................................... xi
LIST OF FIGURES ..................................................................................................... xiv
LIST OF TABLES ...................................................................................................... xvii
1. Introduction ......................................................................................................... 1
1.1 Research Background ................................................................................... 1
1.2 Research Objectives ..................................................................................... 7
1.3 Organization of Thesis .................................................................................. 8
2. Literature Review .............................................................................................. 10
2.1 Drug Development and Delivery ................................................................ 10
2.2 Drug Solubility and Dissolution Rate ......................................................... 12
2.3 Formulation Strategies to Enhance Dissolution Rate ................................. 13
2.3.1 Micronization ...................................................................................... 13
2.3.2 Amorphous Form/Solid Dispersion Material ...................................... 18
2.4 Co-milling ................................................................................................... 24
2.5 Supercritical Fluids Technologies .............................................................. 25
2.5.1 Physicochemical Properties of Supercritical Fluids ............................ 27
2.5.2 SCF as Solvent Process ....................................................................... 30
2.5.2.1 RESS Process ................................................................................. 30

iii
2.5.3 SCF as Solute Process ......................................................................... 32
2.5.3.1 PGSS Process ................................................................................. 32
2.5.4 SCF as Anti-solvent Processes (GAS, SAS and SEDS) ..................... 33
2.5.4.1 GAS Process ................................................................................... 33
2.5.4.2 SAS Process ................................................................................... 35
2.5.4.3 SEDS Process ................................................................................. 38
2.6 Characterizations of Solid Dispersion ........................................................ 40
2.6.1 X-ray Powder Diffraction (XRD) ....................................................... 41
2.6.2 Scanning and Transmission Electron Microscopy .............................. 41
2.6.3 Differential Scanning Calorimetry (DSC) ........................................... 42
2.6.4 Physical Stability Evaluation .............................................................. 42
2.6.5 Gravimetric Vapour Sorption (GVS) .................................................. 43
2.6.6 Fourier Transformed Infrared and Raman Spectroscopy .................... 44
2.6.7 Inverse Gas Chromatography (IGC) ................................................... 44
3. Material and Methods ....................................................................................... 47
3.1 Model Compound ....................................................................................... 47
3.2 Preparation of Physical Blends ................................................................... 48
3.3 Milling ........................................................................................................ 49
3.3.1 Co-milling of IDMC with PVP ........................................................... 49
3.3.2 Cryo-milling to Generate Amorphous Form of IDMC ....................... 49
3.4 SAS Experimental Set-up and Procedures ................................................. 49
3.5 Powder Characterizations ........................................................................... 52
3.5.1 X-ray Powder Diffraction (XRD) ....................................................... 52
iv
3.5.2 Scanning Electron Microscopy (SEM) ............................................... 52
3.5.3 Differential Scanning Calorimetry (DSC) ........................................... 52
3.5.4 USP Dissolution Tester ....................................................................... 53
3.5.5 Accelerated Physical Stability Evaluation .......................................... 53
3.5.6 Gravimetric Vapour Sorption (GVS) .................................................. 53
3.5.7 Fourier Transformed Infrared Spectroscopy (FTIR) ........................... 54
3.5.8 Inverse Gas Chromatography (IGC) ................................................... 54
3.5.8.1 Experimental Apparatus ................................................................. 54
3.5.8.2 Evaluation of Surface Energies of Powders ................................... 56
3.5.8.3 Evaluation of Surface Structural Relaxation .................................. 59
3.5.9 Raman Microscopy Mapping (RM) .................................................... 59
3.5.10 Thermogravimetric (TGA) .............................................................. 60
3.5.11 Gas Chromatography (GC) .............................................................. 60
4. Results and Discussion ..................................................................................... 62
4.1 Solid-State (XRD) ...................................................................................... 62
4.2 Morphology (SEM) .................................................................................... 66
4.3 Glass Transition Temperature of Co-precipitates (DSC) ........................... 68
4.4 Dissolution Rate Evaluation ....................................................................... 71
4.5 Accelerated Physical Stability Evaluation .................................................. 74
4.6 Moisture Sorption Isotherm (GVS) ............................................................ 78
4.7 Drug-Polymer Interactions (FTIR) ............................................................. 85
4.8 Surface Energy Properties (IGC) ................................................................ 89
4.8.1 Dispersive Energy ............................................................................... 89

v
4.8.2 Specific Polar Energy .......................................................................... 92
4.9 Surface Structural Relaxation (IGC) .......................................................... 94
4.10 Raman Mapping (RM) ................................................................................ 97
4.11 Drug Content in COM and SAS Co-precipitates (TGA) .......................... 100
4.12 Residual Solvents in SAS Processed Samples (GC) ................................ 102
5. Conclusions ..................................................................................................... 104
6. Future Recommendation Work ....................................................................... 107
REFERENCES ........................................................................................................... 109
APPENDICES ............................................................................................................ 129
A1. List of Publications .......................................................................... 129
A2. Conferences ...................................................................................... 130

vi
SUMMARY
Recently, the increase in the number of newly discovered poorly water-soluble drug
candidates has heightened the interest in developing novel methods to improve
solubility of active pharmaceutical ingredients (APIs). Amorphization is an emerging
technique to enhance the dissolution of poorly water-soluble drug. In amorphous form
the ordered crystalline lattice is not presence, thus providing the maximal solubility
advantages as compared to the crystalline and hydrated forms of a drug. There are
several strategies to generate amorphous drug substances such as solvent evaporation,
co-milling (COM), melt-extrusion, spray-drying, melt-quenching and supercritical
fluids technology. In this thesis, the effectiveness of a low-cost and easily scalable
process COM was compared with the high-cost and precise-controlled supercritical
anti-solvent (SAS) process to amorphize indomethacin (IDMC) with a water-soluble
polymer excipient poly(vinylpyrrolidone) (PVP) to improve the aqueous-solubility as
well as physical stability of IDMC amorphous form.
Both COM and SAS co-precipitation were conducted at IDMC to PVP ratios of 60:40,
50:50 and 20:80. The untreated, COM and SAS powders were characterized using
scanning electron microscopy (SEM, morphology), X-ray powder diffractometry
(XRD, crystallinity), thermogravimetric analysis (TGA, composition), differential
scanning calorimetry (DSC, glass transition temperature (Tg)), USP dissolution tester,
gravimetric vapour sorption (GVS, moisture isotherms), Fourier-transform infrared
spectroscopy (FTIR, drug-polymer interactions), inverse gas chromatography (IGC,
surface energetic and structural relaxations) and Raman mapping (RM, spatial
distribution). The residual solvent content in SAS processed samples were evaluated

vii
using gas chromatography (GC). Accelerated stability stress tests were also conducted
on COM and SAS co-precipitates in open pans at 75%RH/40oC.
Amorphous forms of IDMC produced by COM and SAS have significantly improved
the dissolution rate of IDMC as compared to the crystalline form and its physical
blends, respectively. SAS IDMC-PVP co-precipitates with PVP contents at more than
40wt.% were X-ray amorphous form and remained stable after more than 6 months of
storage at 75%RH/40oC. COM IDMC-PVP samples with PVP contents less than
50wt.% re-crystallized after 7 days of storage at 75%RH/40oC. FTIR also revealed
there were interactions between IDMC and PVP in both COM and SAS co-precipitates
and PVP may influence the re-crystallization kinetics by preventing the self association
of indomethacin molecules. IGC studies also revealed that the two different
preparation methods have an effect on its physical stability in terms of surface
structural relaxation as well as having different surface energetics. Overall the surface
structural relaxation of SAS co-precipitate was slower than COM samples indicating
that SAS co-precipitate was physically more stable than COM sample. Raman
mapping results showed the presence of crystalline γ-IDMC phase in COM sample,
which may has acted as the precursor for the re-crystallization of COM sample. The
Raman spatial distribution mapping suggested that co-linearity in composition between
PVP and amorphous IDMC in SAS sample, which resulted in the reconstruction of
single component spectrum that are resemblance to Raman peaks of PVP and
amorphous IDMC pure component references.
It was demonstrated that the drug to polymer ratio influenced the amorphous content of
the SAS co-precipitates. By using different polymer ratios, the morphologies of a drug-

viii
polymer composite can be varied using SAS process but not for co-milling. The
values of Tg as a function of mixture composition were comparable to the ideal
Gordon-Taylor equation for both COM and SAS co-precipitates. TGA analyses
revealed that the composition of both COM and SAS co-precipitates were consistent
with the experimentally designed compositions. GC analysis shows that residual
solvents content in all the SAS processed samples were way below the acceptable
maximum limit based on the International Conference of Harmonization (ICH)
guidelines.
This work has demonstrated the potential of using a suitable “amorphous inducing and
stabilizing” agent as a co-precipitant for a poorly water-soluble drug such as IDMC to
improve the bioavailability using SAS process. The co-precipitant used in this work
such as PVP to generate amorphous IDMC-PVP co-precipitates using co-milling and
SAS process showed improved physical stability (through hydrogen bonding
formation between IDMC and PVP) as compared to the IDMC amorphous form.
Furthermore, this study could provide a practical reference in helping to evaluate other
co-precipitants. The amorphous forms of SAS IDMC-PVP co-precipitates have
increased the dissolution efficiency of IDMC at 5 minutes (DE5%) to about 9-times as
compared to its crystalline form The use of KWW equation in IGC analysis may has
provided some useful insights on the amorphous surface structural relaxation prepared
using COM and SAS processes, which could be related to a faster re-crystallization at
the surface due to higher surface molecular mobility as compared to the bulk. Finally,
this study could also provide a practical reference in tackling frequently reported
physical stability issues during the development of pharmaceutical drug delivery
systems using drug-polymer co-formulations.

ix
NOMENCLATURE
Symbol Description
a Specific surface area
A Surface area of solid
B Constant
C Concentration of solute in the bulk solution
Cs Concentration of solute at saturation
D Diffusion coefficient of solute in solvent
D11 Self-diffusion coefficient
dm/dt Dissolution rate
F Gas flow rate
h Thickness of the diffusion layer
J James-Martin correction
m Mass
NA Avogadro number
Pc Critical pressure
R Gas constant
T Temperature
T3 Triple point
Tc Critical temperature
Tg Glass transition temperature
Tg1 and Tg2 Glass transition temperatures of component
to Dead time
tR Retention time
Vmin Convergent retention volume

x
VR Retention volume
w1 and w2 Weight-fractions of component
WA Energy of adhesion
WAD Van der Waals forces
WASP Specific polar interactions
Zc Critical compressibility factor
Greek letters Description
2θ 2-Theta scale
∆GA0 Molar free energy of adsorption
β Relaxation time distribution parameter
γLd Dispersive energy of vapour probes
γSd Dispersive surface energy of solid
ρ Density
η Viscosity
τ Relaxation time constant

xi
ABBREVIATION
Abbreviation Description
ABPR Automatic back pressure regulator
API Active pharmaceutical ingredient
ASES Aerosol solvent extraction system
BCS Biopharmaceutics Classification System
BTEM Band-target entropy minimization
CBZ Carbamazepine
CFA Cefuroxime axetil
CO2 Carbon dioxide
COM Co-milling
COM IDMC20-PVP80 Co-milled IDMC:PVP with 20:80 (wt./wt.%)
COM IDMC50-PVP50 Co-milled IDMC:PVP with 50:50 (wt./wt.%)
COM IDMC60-PVP40 Co-milled IDMC:PVP with 60:40 (wt./wt.%)
CSD Cambridge structural database system
DSC Differential scanning calorimetry
DE Dissolution efficiency
DVS Dynamic vapour sorption
FID Flame ionization detector
FTIR Fourier transforms infrared
GAS Gas anti-solvent
GC Gas chromatography
GI Gastrointestinal tract
GPZ Glipizide
GT Gordon-Taylor

xii
GVS Gravimetric vapour sorption
HPMC Hydroxypropylmethylcellulose
ICH International conference of harmonization
IDMC Indomethacin
IGC Inverse gas chromatography
IR Infrared
KWW Kohlraush-Williams-Watts
MW Molecular weight
NSAID Non-steroidal anti-inflammatory drug
PB Physical blended of IDMC-PVP
PB IDMC20-PVP80 Physical blended IDMC:PVP with 20:80 (wt./wt.%)
PB IDMC50-PVP50 Physical blended IDMC:PVP with 50:50 (wt./wt.%)
PB IDMC60-PVP40 Physical blended IDMC:PVP with 60:40 (wt./wt.%)
PB IDMC85-PVP15 Physical blended IDMC:PVP with 85:15 (wt./wt.%)
PCA Compressed anti-solvent
PEG Poly(ethylene glycol)
PGSS Particles from gas-saturated solutions
PVP Poly(vinylpyrrolidone)
RESS Rapid expansion of supercritical solution
RESS-N Rapid expansion of supercritical solution (non-solvent)
RH Relative humidity
RM Raman mapping
SAS Supercritical anti-solvent solution
SAS IDMC SAS processed IDMC
SAS IDMC20-PVP80 SAS IDMC:PVP with 20:80 (wt./wt.%)

xiii
SAS IDMC50-PVP50 SAS IDMC:PVP with 50:50 (wt./wt.%)
SAS IDMC60-PVP40 SAS IDMC:PVP with 60:40 (wt./wt.%)
SAS IDMC85-PVP15 SAS IDMC:PVP with 85:15 (wt./wt.%)
SAS PVP SAS processed PVP
Sc-CO2 Supercritical carbon dioxide
SCF Supercritical fluids
SEDS Solution enhanced dispersion by supercritical fluids
SEM Scanning electron microscopy
SMCR Self-modelling curve resolution
SMS Surface Measurement Systems
SVS Simvastatin
TCD Thermal conductivity detector
TEM Transmission electron microscopy
TGA Thermogravimetric
TMDSC Temperature modulated differential scanning calorimetry
VOC Volatile organic compound
XRD X-ray diffractometry
xiv
LIST OF FIGURES
Figure 2.1 Particle size ranges of different micronization techniques
Figure 2.2 A typical molecular structure of (A) Crystalline; (B) Amorphous form
Figure 2.3 Schematic diagrams of six types of solid dispersions
Figure 2.4 A typical co-milling of drug with polymer to generate amorphous material
Figure 2.5 Phase diagram of carbon dioxide
Figure 2.6 Physicochemical properties of CO2 at 35oC
Figure 2.7 Schematic diagram of RESS process
Figure 2.8 Schematic diagram of PGSS process
Figure 2.9 Schematic diagram of GAS process
Figure 2.10 Schematic diagram of SAS process
Figure 2.11 Schematic representation of SAS process
Figure 2.12 Schematic diagram of SEDS process
Figure 3.1 Chemical structures of (A) IDMC; (B) PVP repeating unit
Figure 3.2 Schematic process flow diagram of Thar SAS50 system
Figure 3.3 SMS IGC schematic diagrams
Figure 3.4 A typical net retention volume plot versus vapour probe surface properties
Figure 3.5 Temperature profiles for GC oven
Figure 4.1 CSD of γ-IDMC
Figure 4.2 CSD of α-IDMC
Figure 4.3 XRDs showing the effect of SAS co-precipitation ratios on crystallinity
Figure 4.4 XRDs showing the effect of COM co-precipitation ratios on crystallinity
Figure 4.5 Images of freshly processed SAS and COM samples
Figure 4.6 SEM images of SAS and COM processed samples
Figure 4.7 Tg of COM and SAS co-precipitates
Figure 4.8 DSC thermogram of amorphous IDMC

xv
Figure 4.9 Dissolution of SAS processed samples versus untreated IDMC
Figure 4.10 Dissolution of COM IDMC-PVPs versus untreated IDMC
Figure 4.11 Dissolution of physical blended versus untreated IDMC
Figure 4.12 XRDs of cryo-milled IDMC before/after storage at 75%RH/40oC
Figure 4.13 XRDs of SAS co-precipitates before/after storage at 75%RH/40oC
Figure 4.14 XRDs of COM IDMC-PVPs before/after storage at 75%RH/40oC
Figure 4.15 Moisture vapour sorption isotherms of IDMCs.
Figure 4.16 GVS mass-plot of amorphous cryo-milled IDMC
Figure 4.17 Moisture vapour sorption isotherm of COM IDMC-PVPs samples
Figure 4.18 Moisture vapour sorption isotherm of SAS IDMC-PVPs samples
Figure 4.19 Moisture vapour sorption isotherm of PB IDMC-PVPs samples
Figure 4.20 GVS mass-plot of COM IDMC60-PVP40
Figure 4.21 GVS mass-plot of SAS IDMC60-PVP40
Figure 4.22 GVS mass-plot of PB IDMC60-PVP40
Figure 4.23 GVS-microscopy images of COM and SAS IDMC60-PVP40
Figure 4.24 IR spectra of COM IDMC-PVPs and SAS co-precipitates
Figure 4.25 IR spectra of physical blended of IDMC-PVPs
Figure 4.26 (A) Dimerization of γ-IDMC; (B) Hydrogen bonding between IDMC-PVP
Figure 4.27 Aging time of COM IDMC60-PVP40 versus change of VR (C10) at 50oC
Figure 4.28 Aging time of SAS IDMC60-PVP40 versus change of VR (C10) at 50oC
Figure 4.29 Aging time of unmilled IDMC versus change of VR (C10) at 50oC
Figure 4.30 Pure component reference spectra of PVP, amorphous and γ-IDMC
Figure 4.31 (A) Extracted COM spectra via BTEM; (B) COM spatial distributions
Figure 4.32 (A) Extracted SAS spectra via BTEM; (B) SAS spatial distributions
Figure 4.33 Thermograms of untreated IDMC, PVP, COM and SAS samples
Figure 4.34 Thermograms of SAS co-precipitates and PB (IDMC:PVP=50:50)

xvi
Figure 4.35 GC calibration curves for (A) Acetone; (B) Dichloromethane

xvii
LIST OF TABLES
Table 2.1 Biopharmaceutics Classification System (BCS) of orally administered drugs
Table 2.2 Supercritical fluids versus conventional processes for particles formation
Table 2.3 Particle formation (micronization) using RESS, GAS, SEDS and SAS
Table 2.4 Types of solid dispersions
Table 2.5 Techniques to generate amorphous materials
Table 2.6 Critical constants of typical substances used as SCF solvents
Table 2.7 Density and viscosity of gases, liquids and SCFs
Table 2.8 Co-precipitation process using RESS/RESS-N
Table 2.9 Co-precipitation process using SAS
Table 2.10 Co-precipitation using SEDS
Table 2.11 ICH guidelines for stability testing of new drugs and products
Table 3.1 Composition of co-precipitates prepared by SAS process
Table 3.2 SMS IGC system design specifications
Table 3.3 Surface properties of vapour probes used in IGC
Table 4.1 Dispersive energy of milled, amorphous and unmilled crystalline IDMC
Table 4.2 Dispersive energy of COM and SAS IDMC60-PVP40 co-precipitates
Table 4.3 ∆𝐺𝐺𝐺𝐺𝐺𝐺0 of milled, amorphous and unmilled crystalline IDMC
Table 4.4 ∆𝐺𝐺𝐺𝐺𝐺𝐺0 of COM and SAS IDMC60-PVP40 co-precipitates
Table 4.5 Surface structural relaxation parameters of COM and SAS IDMC60-PVP40
Table 4.6 Residual solvents content in SAS processed samples

Chapter 1
1
1. Introduction
1.1 Research Background
In pharmaceutical industry, solid oral dosage forms of crystalline active
pharmaceutical ingredient (API) are normally the most preferred state. Moreover,
about two thirds of the drug products used in the pharmaceutical industry are in the
form of particulate solids [1]. Consequently, a lot of efforts have been put into research
in particle generation processes to produce particles of desired size, morphology and
crystalline structures. Besides that, APIs may exist in different solid-state and the
polymorphism of crystalline API is one of the main focuses in pharmaceutical
research. In crystalline polymorphs, API molecules can have different arrangements
and conformations in the crystal lattice, and thus having long-range molecular order.
The most thermodynamically stable polymorph is commonly used to develop the final
drug product and is unlikely to transform to different polymorphs during processing,
transportation and storage. However, with recent advances in molecular screening
techniques for identifying potential drug candidates, an increasing number of newly
discovered poorly water-soluble drug candidates pose challenges for drug development
and delivery. It has been estimated that approximately 40% of new chemical entities
have little or no water solubility [2]. Therefore, it has heightened the interest in
developing new patents and novel techniques to improve/enhance aqueous-solubility.
There are numerous formulation strategies and techniques to enhance aqueous-
solubility of poorly water-soluble drugs such as pro-drugs, salt formation,
micronization, preparation of solid dispersions with water-soluble polymer or
converting the crystalline drug to the amorphous form [3-5].

Chapter 1
2
Currently, the use of amorphous forms of APIs in various solid formulations has
received considerable attention to enhance/improve aqueous solubility. The amorphous
form of API is desirable mainly due to the advantageous of solubility, dissolution rate
and compression characteristics that it offers over crystalline forms [6, 7]. Hancock
and Parks [8] reported that the experimental solubilities of amorphous solids are at
least 2–4 times greater than their crystalline counterparts. There are two feasible ways
to amorphize crystalline APIs. First, an amorphous API can be generated alone,
without additives. However, the generated amorphous solids are mostly
thermodynamically unstable as compared to its crystals due to the higher energy level
[9-11] and have the tendency to revert back to its crystalline form especially during
storage at different temperatures and relative humidities [12]. The other method is to
generate amorphous solid dispersions to attain good physical stability as well as
enhanced dissolution and bioavailability. This technique utilizes crystallization
inhibitors such as additives together with the APIs [13-16] to generate a single-phase
amorphous mixture. These additives/inhibitors are usually hydrophilic carriers
(polymers or sugars) and could inhibit re-crystallization and generate a more stable
amorphous solid form as well as to increase the wetting property of APIs. As a result,
the dissolution rate of a poorly water-soluble drug can be improved by dispersing it in
a water-soluble biocompatible carrier such as poly(vinylpyrrolidone) (PVP),
polyethylene glycol, hydroxylpropylmethylcellulose, etc., which could inhibit the re-
crystallization of the drug. This approach leads to composite particle formation such as
those obtained from solid solution and dispersion technologies for drug substances.
The effect of a polymer on the re-crystallization rate of amorphous substances is
generally expressed in terms of properties of the meta-stable amorphous form such as
the molecular mobility, the glass transition temperature (Tg) and the interactions

Chapter 1
3
arising between the drug and the polymer. Substances with higher entropy and
enthalpy than the steady crystalline form, such as the amorphous or polymorphic forms
can be obtained using these technologies by modifying the molecular structure of the
crystals. The amorphous state of the drug can be stabilized by dissolving the drug into
the polymer matrix at molecular level and restricting the mobility of the drug
molecules, thus hindering the re-crystallization process. There are a number of
different methods to generate the amorphous form of APIs and/or amorphous solid
dispersions such as solvent evaporation [17], co-milling (COM) [18, 19], melt-
extrusion [20, 21], spray-drying [22], melt-quenching [23] and supercritical fluids
(SCF) technology [24-27]. However, some of these applications may be difficult due
to the thermal and decomposition instability of drug during melting, which often poses
a major problem [8-9].
Among the various methods that can generate amorphous form, milling is a common
unit operation employed for particle size reduction which is relatively low-cost and an
easily scalable [28, 29] manufacturing process. Depending on the crystal structure,
milling can either yield highly strained crystals with small particle size or the crystals
can lose their crystalline structure completely and form the amorphous state as in
indomethacin [30], piroxicam [31], budesonide [32] and sucrose [33]. However, this
process may also cause several undesirable effects on APIs such as aggregation of fine
particles, induction of electrostatic charges, mechanochemical transformation, APIs
degradation and solid-state reactivity [34-37], and leading to limitation in the use of
the milling process itself. In order to improve the milling efficiency, a favourable
method using co-milling (COM) of drug with additives/polymers has been successfully
applied [19, 36, 38]. Various amorphous solid dispersions were generated by co-

Chapter 1
4
milling of PVP with ibuprofen, sulfathiazole, phenothiazone, acridine, chloranil and
vitamin K3 [39-41]. Bahl et al [19] investigated the amorphization of indomethacin
(IDMC) using co-milling with six pharmaceutical silicates and the co-milled
amorphous indomethacin was physically stable for 3 to 6 months at 40oC/75%RH.
Recently, the use of SCF technologies in pharmaceutical applications has received
considerable attention. Some of these SCF technologies are supercritical fluid
extraction (extraction of seed nutrient component for use in pharmaceutics) [42],
chemical reaction (oxygenation, hydro-formulation and alkylation) [43], supercritical
fluid chromatography (analytical technique for the separation and analysis of drug
molecules) [42], supercritical fluid fractionation (phyto-pharmaceuticals preparation)
[44], polymer processing [42, 45, 46], particle coating or encapsulation [27, 46, 47]
and particle formation/design [27, 45]. The new approach of using SCF technologies
for particle design of pharmaceutical materials is one of the most actively pursued
applications due to its major advantages over conventional pharmaceutical processing
such as high purity of products, ability to control particle size and narrow particle size
distribution, able to process thermo-labile materials, single-step process and generally
free from residual solvent [27, 48, 49]. Besides that, carbon dioxide is commonly used
as the SCF for pharmaceutical materials processing due to its relatively mild critical
pressure and temperature, non-toxic, relatively inert, non-flammable, and recyclable.
There are several SCF particle formation techniques available such as rapid expansion
of supercritical solution (RESS), gas anti-solvent (GAS), supercritical anti-solvent
solution (SAS), solution enhanced dispersion by supercritical fluids (SEDS) and
particles from gas-saturated solutions (or Suspensions) (PGSS) to form particles using
Sc-CO2. A more detail description of each of the SCF particle formation techniques is

Chapter 1
5
given in Chapter 2.5. The early studies using SCF particle formation technologies were
focused on particle size, particle size distribution, particle morphology, polymer
processing and polymer coating or encapsulation [26, 27, 45, 46]. Most of the works
reported in literature are related to particle generation and formulation techniques in
order to enhance the dissolution rate by micro or nanosization through increased of
particle surface area [24, 26, 27, 49, 50]. The influence of the crystalline structure
(surface chemistry, polymorphism, amorphous phase) has previously attracted less
attention.
Recently, research in the amorphization of pharmaceutical compounds by co-
precipitation (solid dispersion formation) using supercritical fluids processing has
attracted much attention [51-54]. Kluge et al. [52] studied the effect of phenytoin to
PVP ratios using precipitation with compressed anti-solvent (PCA) process and
obtained X-ray amorphous co-formulations at PVP contents of 60wt.% and above.
Besides that, these amorphous co-formulations remained stable after one year of
storage at ambient conditions. Sethia and Squillante [55] generated carbamazepine
solid dispersion in PVP prepared using conventional solvent evaporation and a
supercritical carbon dioxide (Sc-CO2) process. It was reported that the intrinsic
dissolution of carbamazepine solid dispersion in PVP generated by Sc-CO2 process
was 4-fold higher as compared to its crystalline form. Gong et al. [56] successfully co-
formulated of IDMC and PVP particles using solvent-free supercritical fluid technique.
The X-ray amorphous products were obtained at relatively high PVP weight fractions
of 0.8 and above. Mauro et al. [57] successfully impregnated piroxicam and PVP using
supercritical solvent impregnation process and X-ray amorphous impregnated samples
were obtained at PVP contents of 85wt.% and above. They also reported that polymer

Chapter 1
6
molecular weight was mainly found to affect the dissolution rate of the different
formulations. Thus, the drug to polymer ratio plays a crucial role in the generation of
co-formulation. A critical ratio between drug and excipient in the final co-formulation
should be attained to ensure sufficient shelf life and drug therapeutic efficacy.
However, this optimisation requires more understanding on the drug-polymer
thermodynamic system and the nature of amorphous character, which has not been
well reported.
It has been shown that the choice of processes used to prepare the amorphous form has
an influence on its physical stability in terms of enthalpic relaxation and crystallization
behaviour [58]. In addition, structural relaxation of amorphous materials is believed to
be the precursor to re-crystallization. Bhugra et al. [59, 60] reported that there is a
relationship between the structural relaxation and the onset time of the re-
crystallization. Amorphous materials undergo structural relaxation to dissipate excess
energy during aging/storage because of its higher energy state as compared to the
equilibrium state [61, 62]. Moreover, it is often known that re-crystallization started to
occur at the surface of amorphous materials. Crowly and Zografi [63] reported that
smaller particles of amorphous IDMC and IDMC-PVP solid dispersion re-crystallized
faster as compared to the larger particles, indicating surface-mediated nucleated
occurred. Recently, Hasegawa et al. [64] investigated the structural relaxation of
amorphous IDMC-PVP solid dispersion using inverse gas chromatography (IGC) and
concluded that structural relaxation at the surface occurred faster as compared to the
bulk. Ke et al. [65] investigated the effect of preparation methods on surface structural
relaxation using IGC and reported that the surface has higher molecular mobility than
the bulk in all systems prepared. Hence, it will be advantageous and useful to
Chapter 1
7
investigate the surface structural relaxation of amorphous materials to
predict/understand its tendency to re-crystallize which is important for formulation
design and product manufacturing.
1.2 Research Objectives
The main objective of this study is to employ supercritical anti-solvent (SAS) co-
precipitation process as a potential new ways to amorphize pharmaceutical compound
using water-soluble polymer to generate a physically stable amorphous solid
dispersion with enhance/improve the dissolution properties. Besides that, the
effectiveness of a low-cost and easily scalable process co-milling (COM) is compared
with the high-cost and precise-controlled supercritical anti-solvent (SAS) co-
precipitation process. The model drugs used in our study is indomethacin (IDMC, a
poorly water-soluble API) and the water-soluble polymer excipient is
poly(vinylpyrrolidone) (PVP).
The specific objectives of this study are:
I. To investigate the feasibility of using SAS process to influence the crystallinity
or amorphous character of crystalline IDMC for dissolution properties
enhancement,
II. To study the effect of IDMC to PVP ratios on amorphization of COM and SAS
co-precipitated powder and its physical stability under accelerated storage
condition (75%RH/40oC),

Chapter 1
8
III. To study and understand the nature of amorphous IDMC in PVP generated by
COM and SAS co-precipitation process using Raman microscopy and FTIR,
IV. To study the surface energetic properties of amorphous solid generated by
COM and SAS processes using IGC and
V. To investigate the surface structural relaxation of amorphous COM and SAS
co-precipitated powder using IGC.
1.3 Organization of Thesis
This thesis is organized into five chapters. Chapter 1 provides an introduction and
research background of solid dosage formulation for drug delivery systems, especially
on improving the dissolution rate of poorly water-soluble drug. The objective of our
research work is defined.
Chapter 2 outlines the current challenges in drug development and delivery systems. It
also includes recent approaches and formulation strategies to enhance the dissolution
rate of poorly water-soluble drug. Among all techniques discussed, co-milling and
supercritical fluid technologies for particle formation and solid dispersion were
selected and a more detailed review on recent research was discussed. Besides that, the
recent analytical methods used to characterize solid dispersions were also covered in
this chapter.
Chapter 3 describes the material and experimental procedures used in this study. The
COM and SAS experimental set-ups employed to generate solid amorphous forms

Chapter 1
9
were outlined. It also includes characterization procedures such as powder X-ray
diffractometry (XRD, crystallinity), scanning electron microscopy (SEM,
morphology), differential scanning calorimetry (DSC, glass transition temperature),
USP dissolution tester, accelerated physical stability evaluation, gravimetric vapour
sorption (GVS, moisture sorption isotherm), Fourier-transform infrared spectroscopy
(FTIR, drug-polymer interactions), inverse gas chromatography (IGC, surface
energetic and structural relaxations), Raman mapping (RM, spatial distribution),
thermogravimetric (TGA, composition) and gas chromatography (GC, residual
solvent), used in this study.
In Chapter 4, experimental results are summarized and discussed. The accelerated
physical stabilities of COM and SAS co-precipitates were compared and discussed. In
addition, the physicochemical properties of COM and SAS co-precipitates were also
compared and discussed.
In Chapter 5, conclusions are drawn to summarize all the important results presented in
the preceding chapters and recommendations on future research work are given in
Chapter 6.

Chapter 2
10
2. Literature Review
2.1 Drug Development and Delivery
One of the current challenges in drug development and delivery are the discoveries of
new drug molecules that are poorly water-soluble. More than 90% of drugs approved
since 1995 have poor solubility, permeability or both [66]. Moreover, more than 40%
of new chemical entities have little or no water solubility [2]. Therefore, formulation
strategy and delivery of APIs have played an essential role in the development and
commercialization of new pharmaceutical products. The main objective of formulation
chemistry is to improve bioavailability, stability and convenience of the APIs to the
patient (preferably in solid dosage form). Bioavailability means the rate and extent to
which the active substance or therapeutic moiety is absorbed from a pharmaceutical
form and becomes available at the site of action [25]. Moreover, for a drug to be an
effective for oral treatment, it must be able to dissolve and be absorbed by the blood
stream. The bioavailability of an orally administered drug depends on its solubility in
aqueous media over the pH range of 1.0-7.5 and its permeability across membranes of
the epithelial cells in the gastrointestinal tract (GI). Amidon et al. [66] introduced the
Biopharmaceutics Classification System (BCS) that divides the active substances into
four classes as shown in Table 2.1.
Table 2.1 Biopharmaceutics Classification System (BCS) of orally administered drugs
Class Solubility Permeability I High High II Low High III High Low IV Low Low
Class I consists of water-soluble drugs that are well absorbed from the gastrointestinal
tract and have high bioavailability after oral administration. Drugs in Class II are

Chapter 2
11
water-insoluble or slowly dissolving APIs. The absorption of these drugs is
dissolution-rate limited. In contrast, drugs in Class III dissolve readily but having low
penetration into bio-membranes of the GI tract. In the case of Class IV (low aqueous
solubility, low permeability) drugs, oral administration is not recommended.
The oral route of drug administration is the most common and preferred mode of
delivery because of convenience and ease of ingestion. From a patient’s perspective,
ingesting a solid dosage form is more comfortable and a familiar ways of taking
medication. Therefore, patient compliance and thus drug treatment is typically more
effective with orally administered medications as compared with other routes of
administration, for example, parenteral. However, there are many newly discovered
drugs poses problematic and inefficient mode of delivery using oral administration
route due to its poor aqueous-solubility and bioavailability. Drug absorption into the
GI tract can be limited by a variety of factors with the most significant contributors
being poorly water-soluble and/or poor membrane permeability of the drug molecule.
When delivering API orally, it must first dissolve in gastric and/or intestinal fluids
before it can then permeate the membranes of the GI tract to reach systemic
circulation. As a result, a poorly water-soluble drug will generally exhibit dissolution
rate limited absorption, and a drug with poor membrane permeability will generally
exhibit permeation rate limited absorption. Therefore, it has heightened the interest of
pharmaceutical researchers in developing new patents and novel techniques to improve
oral bioavailability of APIs either in the areas of enhancing solubility and dissolution
rate of poorly water-soluble APIs or enhancing permeability of poorly permeable drug.
Hence, in our studies the work is focused on enhancing the dissolution rate of a poorly
water-soluble drug (BCS Class II) using supercritical anti-solvent (SAS) co-

Chapter 2
12
precipitation to generate a physically stable solid dispersion as well as with enhanced
dissolution properties. At the same time, co-milling was also conducted as a
comparison to SAS process.
2.2 Drug Solubility and Dissolution Rate
Prior to GI tract absorption, solid oral dosage forms must be disintegrated and
dissolved into blood stream for effective drug delivery. The dissolution of an API is
governed by thermodynamic and kinetic factors. The most important thermodynamic
parameter is the solubility which is the saturation concentration in a given aqueous
medium at equilibrium. The intrinsic solubility of a specific substance is an inherent
property and it is temperature dependent. Brittain [67] reported that the measurement
of intrinsic solubility may take several days or months. However, it is generally
accepted that to measure the solubility of substance at a meta-stable equilibrium. The
solubility measured under these conditions is known as apparent solubility and is
higher than the intrinsic solubility. Normally, the retention time for an API passes in
digestive system is quite limited and thus, the absorption is governed by kinetic factors
instead of thermodynamic properties. The dissolution rate is the amount of active
substance that leaves the surface of drug and dissolved into the solution per unit time.
Based on the modified Noyes-Whitney equation, the dissolution rate (dm/dt) is
proportional to the surface area available for dissolution (A), the diffusion coefficient
of the solute in solvent (D), the concentration across diffusion layer (concentration of
the solute at saturation (CS) - concentration of the drug in the bulk solution (C)) and
inversely proportional to the thickness of the diffusion layer (h) [68] as shown below.
𝑑𝑑𝑑𝑑𝑑𝑑𝑑𝑑
= −𝐴𝐴𝐴𝐴(𝐶𝐶𝐺𝐺−𝐶𝐶)ℎ
(2.1)

Chapter 2
13
2.3 Formulation Strategies to Enhance Dissolution Rate
Based on the Noyes-Whitney equation, the dissolution rate can be enhanced through
increasing diffusivity and decreasing both of the diffusion layer thickness and bulk
concentration. However, this method requires changing the in-vivo transport
properties, hydrodynamics and composition of the luminal fluids which is not easily
attainable. Thus, parameters such as surface area and apparent solubility of the drug
may be a more feasible way to be manipulated to enhance the dissolution rate. The
parameter such as surface area can be increased by decreasing the particle size and is
known as micronization process.
2.3.1 Micronization
Micronization enhances the dissolution rate of drug by increasing its specific surface
area (through particle size reduction). The conventional methods for particle size
reduction are based on mechanical and equilibrium controlled techniques. As for
mechanical techniques, the dry size reduction of pharmaceutical powders is
accomplished by impact size reduction. The particle size reduction is commonly
operated under mechanical impact mills or fluid-energy impact mills. Examples of
mechanical impact mills are hammer and screen mills, pin mills and air-classifying
mills. As for fluid-energy impact mills there are spiral jet mills and fluidized bed jet
mills. A typical impact mills composed of a cylindrical metallic drum filled with
spherical steel balls and when it rotates the balls inside the drum will collide with the
particles, thus crushing them into a smaller particle. Fluid-energy impact mills using
high velocity gas jets to accelerate particles against a hard surface or collision between
particles with another particles, thus crushing it them into a smaller particle. Milling is
simple and inexpensive methods for particle size reduction. However, this process may

Chapter 2
14
also cause several undesirable effects on APIs such as aggregation of fine particles,
induction of electrostatic charges, mechanochemical transformation, APIs degradation
and solid-state reactivity [34-37], and leading to limitation in the use of the milling
process itself.
Apart of this technique, the equilibrium controlled techniques also is used to improve
the efficiency of micronization employed by mechanical techniques. The equilibrium
techniques are based on the sublimation and/or re-crystallization of drug from solution.
In solution based re-crystallization, drug is dissolved in solution and subsequently
supersaturation is induced to precipitate the drug to microparticle. There several
methods to induce supersaturation in a solution such as thermal treatment (heating and
cooling), evaporation and addition of a third component (anti-solvent, precipitant or
reactant). Some of these techniques are spray-drying, solvent-evaporation and liquid
anti-solvent. Rasenack and Muller [69] conducted in-situ micronization of poorly
water-soluble drug using a controlled crystallization process to generate drug
microcrystal with enhanced dissolution rate. Steckel et al. [70] compared the physical
properties and in vitro inhalation behavior of jet-milled, in-situ micronized and
commercial disodium cromoglycate. The jet-milled powders were electrostatically
charged and agglomerated into a larger particle. In contrast, the in-situ micronized
powder has better dispersion and de-agglomeration properties. The mean particle size
of drug (~3.5μm) was within the respirable range. Recently, Varshosaz et al. [71] used
in-situ micronization via solvent change method to generate microcrystal of gliclazide.
The particle size was reduced about 50 times as compared to untreated gliclazide and
the dissolution efficiency of gliclazide at 15 minutes (DE15%) was increased about 4
times. Zhang et al. [72] employed anti-solvent and spray-drying processes to micronize

Chapter 2
15
atorvastatin calcium to ultrafine powder. The dissolution rate of atorvastatin calcium
generated using both anti-solvent and spraying processes was improved as compared
to the raw material. However, these techniques may present several disadvantages,
such as contamination of the particles with organic solvents or other toxic substances,
high energy requirement, generation of large volumes of solvent waste and may
require multiple crystallization steps [73].
Beneath the conventional methods, new particle design technologies have been
recently developed to improve the dissolution of APIs. These methods apply new
concepts based on the use of supercritical fluids or liquefied gases as solvent, anti-
solvent or cryogenic medium [24, 27]. Supercritical fluid (SCF) technology presents a
new and interesting route for particle formation, which avoids most of the drawbacks
of the conventional methods (Table 2.2 and Figure 2.1 [74]). A substance is termed as
a supercritical fluid when it exists as a single fluid phase above its critical temperature
(Tc) and critical pressure (Pc). The density, viscosity, diffusivity and other physical
properties (such as solvent strength) of SCF can be varied in a continuum between gas-
like and liquid-like characteristics when it is above its critical points. A commonly
accepted opinion is that the solvent power of a SCF is mainly related to its density in
the critical point region. A high density generally implies a strong solvating capacity.
One of the unique properties of a SCF is its solvating power can be tuned by changing
either temperature or pressure. Carbon dioxide (CO2) is the most commonly used fluid
as it is chemically inert, non-toxic and non-flammable. Having mild critical
temperature (31.1°C) and critical pressure (73.8bar) [75], CO2 is suitable to treat heat-
sensitive APIs such as peptides, DNA and steroids. Particle formations processing
using supercritical CO2 (Sc-CO2) are subjects of great interest in the pharmaceutical

Chapter 2
16
and fine chemical industries. Several techniques are available such as rapid expansion
of supercritical solution (RESS), gas anti-solvent (GAS), supercritical anti-solvent
solution (SAS), solution enhanced dispersion by supercritical fluids (SEDS) and
particles from gas-saturated solutions (or Suspensions) (PGSS) to form micronized
particles using Sc-CO2. A detail discussion on the SCF technologies for particle
formation is presented in Chapter 2.5. Table 2.3 shows some of the selected particle
formation using RESS, GAS, SEDS and SAS processes gathered from literature.
Table 2.2 Supercritical fluids versus conventional processes for particles formation
Disadvantages of conventional processes for particles formation
Excessive solvent used and disposal. Non-environmentally-friendly.
Thermal and chemical degradation of products.
Organic solvent may be present in the product as residual solvent.
Variability in particle size (broad particle size distribution).
Advantages of supercritical fluid processes over conventional processes
Higher diffusivities and lower surface tension result in enhanced mass transfer/reaction rates. It allows the formation of particles with controlled size and morphology by controlling the pressure and temperature.
Non-toxic, non-flammable and environmentally-friendly solvents leave no harmful residue when using Sc-CO2.
Ability to rapidly vary the solvent strength and the rate of supersaturation, thus nucleation of dissolved compounds. These properties allow it to manipulate the precipitations/reactions and aids in product separation.
The low viscosities of SCF allow it’s recoverable from the extract easily (depressurization).
Compounds with high boiling points can be extracted at relatively low temperatures.
Able to process thermolabile compounds.
Disadvantages of supercritical fluid processes
High capital investment is required for the equipment.
Scale-up complexity.

Chapter 2
17
Figure 2.1 Particle size ranges of different micronization techniques
Table 2.3 Particle formation (micronization) using RESS, GAS, SEDS and SAS
SCF technique Compound (Solvent)a Particle size References
RESS Carbamazipine 0.43-0.9μm [76]
RESS Artemisinin 0.55μm [77]
RESS Cephalexin 0.9-7.2μm [78]
RESS Nabumetone 3.3μm [79]
GAS Insulin (DMSO) < 4µm [80]
GAS Insulin (DMSO) < 4µm [80]
GAS Triamcinolone acetonide (THF) 5-10µm [81]
GAS Poly(L-lactide acid) (DCM) 0.5-3µm [82]
GAS Griseofulvin (AC) 300-400µm [83]
SEDS Salmeterol Xinafoate (EtOH, MeOH & AC) 1-10µm [84]
SEDS Sodium cromoglycate (MeOH) 0.1-20µm [85]
SEDS Astaxanthin (DCM) 20-30µm [86]
SEDS Chelerythrine (MeOH) 0.1-1µm [87]
SAS Cyclotrimethylenetrinitramin (DMSO, DMF, ACN, NMP & CHN)
3-18µm [88]
SAS 10-hydroxycamptothecin (DCM+EtOH) 0.2-0.3µm [89]
SAS Erlotinib hydrochloride (MeOH & EA) 2µm [90]
SAS Indomethacin (DCM & AC) 1-20µm [91] a Dimethyl sulfoxide (DMSO); dimethylformamide (DMF); dichloromethane (DCM); methanol (MeOH); ethanol (EtOH); ethyl acetate (EA); tetrahyrofuran (THF); acetone (AC); acetonitrile (ACN); n-methyl 2-pyrrolidone (NMP); cyclohexanone (CHN) were used as solvents
Chapter 2
18
Unfortunately, the enhancement of dissolution rate of drug attainable by increased
surface area is quite limited. Therefore, new formulation strategies and techniques that
can influence the drug physicochemical properties such as dissolution rate, solubility
and physical stability are currently actively being developed. Some of these techniques
are solubility enhancers (complexing agents), pro-drugs and various solid form
formulations. Under the solid form formulations group, some of these formulation
techniques are to crystallize the drug to different polymorphs, salt formations, co-
crystal formations, solid dispersions with soluble polymers or conversion of the
crystalline drug to amorphous form [3-5]. Recently, the uses of amorphous forms of
active pharmaceutical ingredients (APIs) in various solid formulations have received
considerable attention to enhance/improve aqueous solubility. When a drug substance
is converted to the amorphous form it lacks of long range molecular order. Therefore,
amorphous form has higher entropy and enthalpy as compared to its crystalline form.
The saturated solubility of the amorphous form is higher as compared to its crystalline
forms due to the higher Gibb’s free energy in amorphous form. Thus, based on Noyes-
Whitney equation increasing in saturation solubility can enhance the dissolution of the
drug. In the next chapter, the formulation techniques and recent developments on
amorphous form/solid dispersion material will be reviewed.
2.3.2 Amorphous Form/Solid Dispersion Material
The solubility of a solid is the sum of crystal packing energy, cavitation and salvation
energy. Different solid state forms of a material have different crystal packing energy.
In amorphous form the ordered crystalline lattice is not presence (Figure 2.2B), thus
providing the maximal solubility advantages as compared to the crystalline and
hydrated forms of a drug. The apparent solubility and dissolution advantage offered by

Chapter 2
19
these systems is a vital approach to enhance bioavailability of poorly water-soluble
drugs. However, amorphous forms have poor physical and chemical stabilities which
hurdle its commercialization. One of the possible approaches to overcome these
challenges is to formulate the drug with polymer/excipient to form solid dispersion.
Solid dispersion is defined as dispersion of one or more compounds in an inert
hydrophilic carrier matrix at solid state [92]. For example, it is a molecular mixture of
drug and hydrophilic polymer (carrier/excipient) in which the dispersed compounds
may be in individual molecule unities or in clusters, such as in particles [93].
Currently, there are a few commercial drug products on the market which are based on
amorphous solid dispersion technology. Some of these products are Novartis's soft
gelatine capsule Gris-PEG®, which is based on a solid dispersion of griseofulvin in
polyethylene glycol (PEG 8000) [94]. The Fujisawa's Prograf Creme is based on a
solid amorphous dispersion of tacrolimus in hydroxypropylmethylcellulose (HPMC)
[95]. Another amorphous solid dispersion drug product is called Sporanox®
(itraconazole-HPMC) and is sold as hard gelatine capsules [96].
Figure 2.2 A typical molecular structure of (A) Crystalline; (B) Amorphous form
Solid dispersion is an easier and more feasible approach as compared to chemical
approach for improving the solubility of poorly water-soluble drugs. Chemical
approach includes salt formation and formation of pro-drugs [94, 97, 98]. Salt
formation approach is reported to be associated with limitations such as limited only to

Chapter 2
20
weakly acidic or basic drugs and not applicable to neutral drugs [93]. In cases of pro-
drug approach, the parent drug moiety must have some specific chemical groups such
as hydroxyl, carboxylic, amide etc. [99] in order to generate the pro-drug. Generally,
solid dispersions are found to be more therapeutic compliant by patients than
solubilization products. In addition, the solid dispersions are more effective in
improvement the drug release as compared to milling/micronization process due to the
limitation of particle reduction which is limited typically in the range of 2-5µm. This is
significantly insufficient to improve the drug absorption in the small intestine [100,
101]. Moreover, handling of very fine solid powder is extremely difficult because of
poor mechanical properties such as poor powder flow-ability and high adhesion [102].
Therefore, the dissolution rate of poorly water-soluble drug could be improved by
dispersing it in a water-soluble biocompatible carrier such as PVP, polyethylene
glycol, HPMC, etc., which may inhibit the re-crystallization of the drug [103]. This
approach leads to composite particle formation such as those obtained from solid
solution and dispersion technologies for drug substances [21, 51, 104, 105]. The effect
of a polymer on the re-crystallization rate of amorphous substances is generally
expressed in terms of properties of the meta-stable amorphous form such as molecular
mobility, glass transition temperature (Tg) and the interactions arising between the
drug and the polymer. Substances with higher entropy and enthalpy than the steady
crystalline form, such as the amorphous or polymorphic forms can be obtained from
these technologies by modifying the physical structure of the crystals. The amorphous
state of drug can be stabilized by dissolving the drug into the polymer matrix at
molecular level and restricting the drug molecules mobility, thus hindering the re-
crystallization process.

Chapter 2
21
It is generally understood that polymers improve the physical stability of amorphous
drugs in solid dispersions by either increasing the Tg of the miscible mixture, thereby
reducing the molecular mobility at regular storage temperatures, or specifically
interacting (e.g., hydrogen bonding) with functional groups of amorphous drug
substance [106-108]. For a polymer to be effective in preventing crystallization by
these mechanisms, it has to be molecularly miscible with the amorphous substance.
For complete miscibility, interactions between the two components are necessary
[109].
A miscible system can phase separate and become unstable if specific interactions
between the components are adversely affected by a third component like water. The
extent of moisture uptake depends upon factors like hygroscopicity of the drug and/or
carrier, the concentration of the active substance in the drug product and the storage
temperature. Due to this complexity, the prediction of physical stability of a drug
substance in a solid dispersion becomes challenging. In order for the solid dispersion
systems to be effectively used by the pharmaceutical industry, it is critical to
understand the role of time, temperature, humidity in determination of the physical
stability of solid dispersion during its shelf-life and to establish a robust
characterization method for amorphous form. Table 2.4 and Figure 2.3 show six types
of solid dispersions based on their molecular arrangements [110]. The matrix can be
either crystalline or amorphous. Meanwhile, the drug can be dispersed molecularly, in
amorphous particles (clusters) or in crystalline particles [110].

Chapter 2
22
Table 2.4 Types of solid dispersions
Type of solid dispersion Matrixa Drugb No. of phases Type Eutectics C C 2 I Amorphous precipitations in crystalline matrix C A 2 II Solid solutions C M 1 or 2 III Glass suspension A C 2 IV Glass suspension A A 2 V Glass solution A M 1 VI a A: Matrix in amorphous state; C: Matrix in crystalline state b A: Drug dispersed as amorphous clusters in the matrix; C: Drug dispersed as crystalline particles in the matrix; M: Drug molecularly dispersed throughout the matrix
Figure 2.3 Schematic diagrams of six types of solid dispersions
Solid dispersions are commonly prepared by three different methods such as solvent
evaporation method, fusion-melt method, and hybrid fusion-solvent evaporation
method [93]. Some of these techniques are solvent deposition [17], co-milling (COM)
[14, 19, 111], melt-extrusion [20, 21], spray-drying [22], melt-quenching [23] and
supercritical fluids technology [24-27]. Table 2.5 shows several techniques used to
generate amorphous forms of drugs gathered from literature.
Among the various techniques that can generate amorphous form/solid dispersion,
milling is a common unit operation employed for particle size reduction which is
relatively low-cost and easily scalable manufacturing processes. Therefore, one of the
aims of this study is to compare the effectiveness of a low-cost and easily scalable
process [28, 29] co-milling (COM) with high-cost and precise-controlled [112-114]
Crystalline particle Amorphous particles Molecularly dispersed (Type I and IV) (Type II and V) (Type III and VI)

Chapter 2
23
supercritical an-solvent (SAS) co-precipitation process to amorphize IDMC with PVP
to improve its physical stability and enhance the dissolution rate of IDMC.
Table 2.5 Techniques to generate amorphous materials
Technique Possible associated problems Reference
Mechanical stress (milling, co-milling)
Dependent on crystal structure Crystal seeds may presence in formulation May not suitable for thermolabile material Milling time dependence
[6, 14, 19, 53, 111, 115, 116]
Spray-drying Energy consumption Residual solvents Many process parameters May require high temperature
[22, 117]
Melt extrusion High temperature High amount of excipients may be required Not suitable for thermolabile material
[20, 21, 118]
Freeze-drying Energy consumption Residual solvents Slow process Many processing steps
[119, 120]
Melt quenching High temperature Chemical degradation Cooling is needed Energy consumption
[6, 23, 115, 116]
Vapour deposition Chemical degradation [121]
Vacuum systems Residual solvents [122]
SCF technologies High pressure Scale-up complexity High capital cost
[24-27]
Ultrasound Cavitation Chemical degradation
[123]
Dehydration of hydrated crystals
Limited to some hydrated crystals [124]
High pressure compaction Energy consumption Pressure range from 0.1-0.5GPa Low capacity
[125]

Chapter 2
24
2.4 Co-milling
In order to improve the milling efficiency, a favourable method using co-milling
(Figure 2.4) of drug with additives has been successfully applied [19, 36, 38].
Stabilization of amorphous form generated using co-milling or co-grinding with
amorphous excipients such as PVP, magnesium aluminometasilicate (Neusilin US2),
etc., has been successfully employed [18, 126]. Several authors [13, 18, 127, 128] have
studied the physical stabilization of amorphous IDMC by co-grinding with silicates.
The effect of mass ratios of IDMC to Neusilin US2 and processing humidity on
stabilizing the amorphous form of IDMC were studied by Bahl and Bogner [18].
Plasticization of amorphous drug to allow mechanical transfer of drug to silicate,
vapour phase mass transfer, and the role of water in particle–particle surface migration
of the drug to the silicate have been put forward as possible explanations for the
formation of the stable IDMC–silicate alloy.
Figure 2.4 A typical co-milling of drug with polymer to generate amorphous material
Mura et al. [129] conducted co-milling of glisentide with PVP and studied the
physicochemical properties of the co-milled samples. The amorphous state of co-
milled sample was the main factor for obtaining 100% dissolution efficiency increase
as comparison to the untreated drug. The dissolution rate increased with PVP content
in the co-milled sample. Moreover the milling time to fully amorphize glisentide with
PVP was reduced with increase of PVP ratios [129]. Chieng et al. [130] investigated

Chapter 2
25
the physicochemical properties and stability of co-milled IDMC with various weight
ratios of ranitidine hydrochloride. They reported the stability of the amorphous binary
system (1:1) was found to be stable after 30 days of storage at 4 and 25oC. Recently,
Lobmann et al. [131] using co-milling to generate various weight ratios of co-
amorphous drug-drug from simvastatin (SVS) and glipizide (GPZ). It was found that
even though a molecular mixture was achieved with all SVS–GPZ mixture ratios, no
molecular interactions between the drugs could be detected. By formation of co-
amorphous single-phase mixtures, only the dissolution rate of GPZ could be improved.
The co-amorphous mixtures showed improved stability compared to the pure
amorphous forms and the amorphous physical mixtures, respectively. It was concluded
that this was attributable to the molecular level mixing of SVS with GPZ upon milling,
and GPZ is acting as an anti-plasticizer in these mixtures. Wang et al. [132]
investigated the physical stability and dissolution rate of co-milled ibuprofen with β-
cyclodextrin. The solubility of co-ground complex was more than ten times higher
than that of intact drug. The amorphous state of the co-ground complex was the main
responsible factor for the enhanced dissolution efficiency of drug. The result also
showed that at 25, 40 and 55°C, the co-ground complex was stable below 74%RH
[132].
2.5 Supercritical Fluids Technologies
For pharmaceutical applications, the most preferable supercritical fluid is using CO2,
which is used as either a solvent for drug and polymer matrix or act as an anti-solvent
[133, 134]. When supercritical CO2 is used as solvent, the drug and polymer matrix are
dissolved into supercritical CO2 (Sc-CO2) and sprayed through a nozzle into an
expansion vessel with lower pressure to form particles. The adiabatic expansion of the

Chapter 2
26
mixture caused a rapid cooling in the surrounding of the vessel. This technique is
known as “solvent free” process as it does not require the use of organic solvents and
also CO2 is considered as an environmentally-friendly solvent. The technique is known
as rapid expansion of supercritical solution (RESS). However, the application of this
technique is quite limited, because the solubility of most pharmaceutical compounds in
CO2 is very low (<0.01wt.%) [49] and decreases with increasing polarity. As a result,
the process scale-up for RESS to kilogram-scale may not be practically feasible.
The other supercritical techniques are using Sc-CO2 as anti-solvent to precipitate the
drug into particles. Although generally labeled as solvent-free, all these supercritical
fluid methods used organic solvents to dissolve drug and polymer matrix to overcome
the low solubility of APIs in Sc-CO2. These techniques also served as alternative
methods to remove solvents from a solution containing typically a drug and a polymer.
Moneghini et al. [135] used gas-anti-solvent technique (GAS) or precipitation from gas
saturated solutions (PGSS) on dissolved polyethylene glycol and carbamazepine in
acetone and reported this method as solvent-free. In this process, the solution is
brought into contact with compressed CO2. A process condition is chosen in order for
CO2 to be completely miscible with the solution under supercritical conditions but the
drug and polymer matrix will precipitate upon expansion of the solution. When the
volume of the solution expands, the solvent strength (i.e. the ability to dissolve the
drug) decreases and causes the polymer matrix and drug to co-precipitate as particles.
Another type of precipitation technique utilizes the spraying of a solution containing
drug and polymer matrix through a nozzle into a vessel filled with liquid or
supercritical anti-solvent. The high mass transfer rate and mixing between the
Chapter 2
27
supercritical anti-solvent and solution droplets causes the solution containing drug and
polymer matrix become supersaturated and subsequently co-precipitates as particles.
The general term for this process is known as precipitation with compressed anti-
solvent (PCA) [49]. More specific examples of PCA are supercritical anti-solvent
(SAS) or aerosol solvent extraction system (ASES), and solution enhanced dispersion
by supercritical fluids (SEDS) [49, 133]. There is another process called supercritical
fluid impregnation, the drug is dissolved in a supercritical fluid and exposed to a solid
polymer matrix that swells and absorbs the supercritical solution. By varying the
pressure and the time of exposure, the diffusion process can be controlled. The
absorption stops when the pressure is reduced. Vincent et al. [136] investigated
supercritical fluid impregnation process using poly(methyl methacrylate) and reported
that this process can be applied to other polymers as well. A more detail discussion on
RESS, PGSS, SAS and SEDS processes are presented in subsequent chapters (2.5.2-
2.5.4).
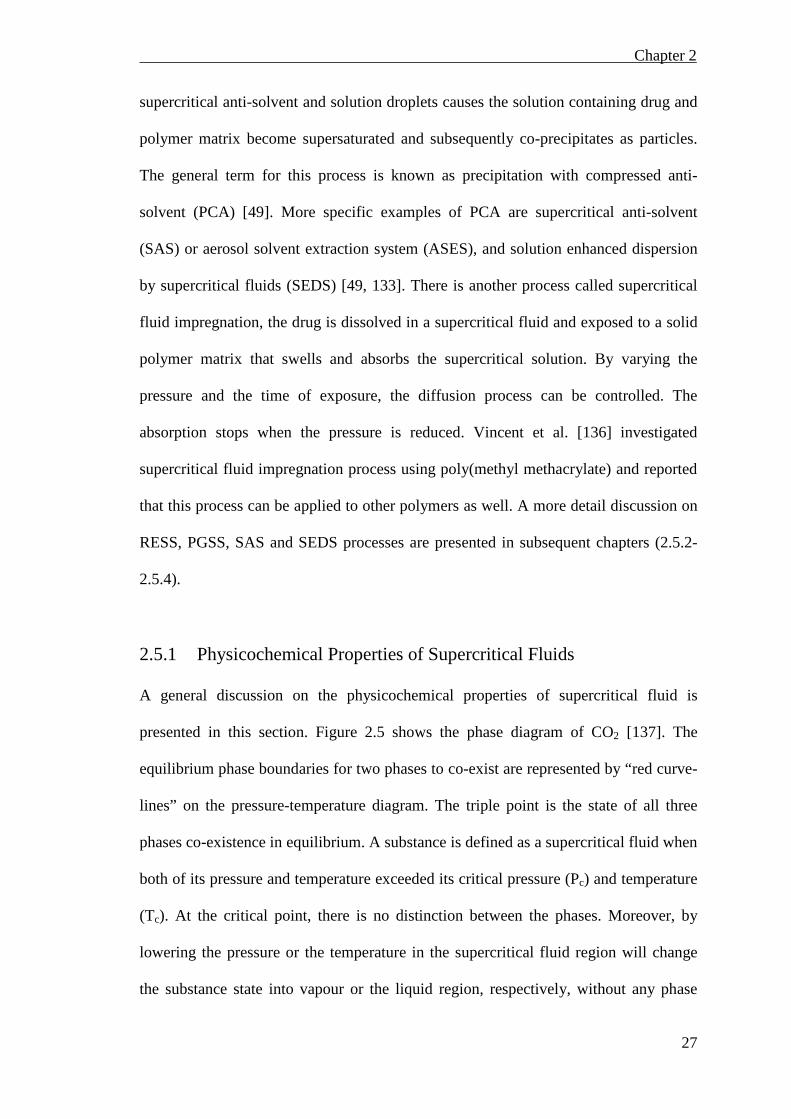
2.5.1 Physicochemical Properties of Supercritical Fluids
A general discussion on the physicochemical properties of supercritical fluid is
presented in this section. Figure 2.5 shows the phase diagram of CO2 [137]. The
equilibrium phase boundaries for two phases to co-exist are represented by “red curve-
lines” on the pressure-temperature diagram. The triple point is the state of all three
phases co-existence in equilibrium. A substance is defined as a supercritical fluid when
both of its pressure and temperature exceeded its critical pressure (Pc) and temperature
(Tc). At the critical point, there is no distinction between the phases. Moreover, by
lowering the pressure or the temperature in the supercritical fluid region will change
the substance state into vapour or the liquid region, respectively, without any phase

Chapter 2
28
change occurred during the transition. Supercritical fluid acquires unique properties of
a good solvent and the solubility of solid solutes/co-solvents in supercritical fluid,
which is dependent to pressure and temperature. The degree of freedom of variables is
1 on the phase boundary line and 0 on the triple point and critical point, whereas
outside these lines it is 2 (e.g. pressure and temperature) according to Gibbs phase rule.
Table 2.6 shows the critical constants of some of other typical substances used as SCF
solvents.
Figure 2.5 Phase diagram of carbon dioxide
Table 2.6 Critical constants of typical substances used as SCF solvents
Substance Critical temperature Tc (K)
Critical pressure Pc (bar)
Critical compressibility factor Zc
Argon 151 49 0.296 Methane 191 45 0.287 Xenon 290 58 0.287
Carbon dioxide 304 73 0.274 Ethane 305 48 0.285
Propane 370 42 0.281 Ammonia 406 111 0.244
Water 647 218 0.235

Chapter 2
29
When a pure substance (e.g. CO2) is at supercritical fluid region, the changes of its
transport properties such as density, viscosity, thermal conductivity, surface tension
and constant-pressure heat capacity are significant as shown in Figure 2.6 [138-140].
Sc-CO2 displays a liquid-like density that is tunable with pressure, a gas-like
diffusivity, and a viscosity that is quite low which is about 1/10 that of water [141]
(Table 2.7). These properties make Sc-CO2 an attractive option to replace traditional
organic solvents and anti-solvents that are often volatile organic compounds (VOCs).
SCF exploits the dramatic increase in density and thus solvent strength of CO2 at
pressures above the critical pressure. Moreover, SCFs exhibit almost zero surface
tension, which allows easy penetration into microporous materials. The combination
advantageous of these physicochemical properties allows the extraction process to be
conducted more efficiently using SCF than organic liquid solvent. High solute loading
can be achieved for non-polar substances, while polar and complex molecules are often
only sparingly soluble in Sc-CO2, even at very high pressures.
Figure 2.6 Physicochemical properties of CO2 at 35oC
Self-diffusion coefficient (D11)
Density (ρ)
Viscosity (η)

Chapter 2
30
Table 2.7 Density and viscosity of gases, liquids and SCFs
Physical state Density (g/cm3) Viscosity (g/cm·s) Gas 10-3 10-4
SCF 0.2-0.9 10-4-10-3 Liquid 0.7-1.0 10-2
2.5.2 SCF as Solvent Process
2.5.2.1 RESS Process
The rapid expansion of supercritical fluids (RESS) process takes advantage of SCF
solvent power tunability with changes in pressure [142]. As shown in Figure 2.7, the
RESS consisted of a two-step process (extraction and precipitaion). The first step is an
extraction in which the supercritical fluid is saturated with the substrates of interest.
This extraction is followed by a sudden depressurization in a nozzle (typically 10-
50µm internal diameter) which drastically decreases the solvent power and the
temperature of the fluid and causing the solute to precipitate as microparticles [143].
The decrease in the solvent power of the SCF due to the depressurization is of several
orders of magnitude, leading to supersaturations which typically are in the range 105–
106. This supersaturation is produced by a mechanical perturbation which is
propagated at the velocity of the sound, in a time scale usually of 10−6–10−4s.
Therefore, this process could achieve extremely high supersaturations which are
transmitted very quickly and homogeneously to the whole fluid, thus leading to the
formation of small particles with narrow PSD. Additionally, the process can be
performed at moderate temperatures (typically below 80°C) which is suitable for heat-
sensitive products and no organic solvents are required.
However, it is well known that the main limitation of this method is that it is only
applicable to substances with relatively high solubility in the SCF, mainly non-polar

Chapter 2
31
compounds or volatile polar compounds such as alcohols or esters, while non-soluble
compounds such as acids or salts might not be easily processed [27, 144]. Even in the
most favorable cases the production capacity of the process is often limited. This
problem can be alleviated by the use of a co-solvent [27]. Mishima et al. [145]
invented a new method called rapid expansion from supercritical solution with a non-
solvent (RESS-N) to overcome the difficulties associated with SCF-insoluble polar
compound. This process used a polymer dissolved in a SCF containing a co-solvent
and sprayed through a nozzle to atmospheric pressure. The co-solvent increases the
solubility of the API of interest significantly in Sc-CO2, but API is immiscible with the
co-solvent [146].
Figure 2.7 Schematic diagram of RESS process
Debenedetti et al. successfully co-precipitated lovastatin and pyrene with poly (L-lactic
acid) [147, 148]. Perrut et al. [149] used RESS co-precipitation process on three poorly
water-soluble APIs (nifedipine, lidocaine and sulfathiazole) with hydrophilic block co-
polymer poloxamer 188 and investigated its dissolution rate profiles. The co-
precipitates improved the dissolution rate of nifedipine and lidocaine but not
sulfathizole. Recently, Vemavarapu et al. [150] investigated co-precipitation of APIs
and their structurally related additives using RESS process. Amorphous forms of co-
CO2

Chapter 2
32
precipitates of indomethacin-salicylic acid and naproxen-α-napthelene acetic acids
were successfully generated. Table 2.8 shows some of co-precpitates generated using
RESS/RESS-N process gathered from literature.
Table 2.8 Co-precipitation process using RESS/RESS-N
Material 1 Material 2a Co-solvent Reference Naproxene L-PLA - [151] Β-sitosterol Eudragit - [152] Flurbiprofen Lactose - [153] Lipase PEG, PLA EtOH [146]a
Lysozyme PEG, PMMA EtOH p-Acetomidophenol PEG MeOH, AC, C3H7OH [154]b
Acetylsalicylic acid PEG EtOH Flavone PEG EtOH a L-Poly (lactic acid) (L-PLA); Poly (ethylene glycol) (PEG); Poly (methyl methacrylate) (PMMA) b Using RESS-N process
2.5.3 SCF as Solute Process
2.5.3.1 PGSS Process
The particles from gas saturated solution (PGSS) process does not utilize the properties
of SCF as a solvent or as an anti-solvent, but using the cooling effect produced from
depressurization of SCF at supercritical conditions to ambient pressure. In the PGSS
process (Figure 2.8), SCF is dissolved in a melted solid, and the mixture is rapidly
expanded through a nozzle and causing the solution to precipitate as particles. Sencar-
Bozic et al. [155] reported that the consumption of CO2 in PGSS method is lower than
RESS method by an order of magnitude of 103. This process is useful for substances
such as polymers due to high solubilty of CO2 in most polymers. Moreover, this
process is also useful to polymer because of the absorbed Sc-CO2 in the polymer
matrices reduces the melting/glass transition temperature of polymer.

Chapter 2
33
Figure 2.8 Schematic diagram of PGSS process
The PGSS method has been succesfully applied for a mixture of APIs and polymer to
generate co-precipitated particles [155, 156]. Sencar-Bozic et al. [155] applied the
PGSS method to micronize nifedipine. They also co-precipitated nifedipine with
polyethylene glycol (PEG) (MW=4000) using PGSS. Both co-precipitates and
micronized nifedipine have improved the dissolotion rate of nifedipine as compared to
the raw material. Kerc et al. [157] also applied the PGSS technique to micronize two
poorly water-soluble drugs (felodipine and fenofibrate) and co-preciptated both drugs
with PEG to increase their dissolution rate. They reported that dissolution rate was
improved using PGSS co-precipitation of drugs with PEG as compared to the raw
material. They reported that the improved dissolution rate of felodipine was related to
both particle size reduction and drug–polymer interactions [157].
2.5.4 SCF as Anti-solvent Processes (GAS, SAS and SEDS)
2.5.4.1 GAS Process
Gas anti-solvent (GAS) process is a complementary to RESS process. The GAS is a
batch precipitation process that exploits the low solubilities of polar compounds and
polymers in Sc-CO2 (Figure 2.9). Firstly, a solution is made of the solute in an organic
solvent and pressurized with CO2. This process typically operates at moderate
pressures (50–80bar). In this operating range, the CO2 can dissolve /miscible with most

Chapter 2
34
organic solvents but has poor solvent power on high molecular weight substrates.
Therefore, the saturation of the organic solvent with CO2 causes a decrease in the
solvent power of the liquid mixture and causing the solute to precipitate as
microparticles. Due to the high solubility of CO2 in the liquid phase and the favorable
transport properties, the kinetics of the mixing process are enhanced with respect to the
mixing with conventional liquid anti-solvents, leading to more homogenous
supersaturations. Thus, the particle size and morphology can be controlled by the rate
and method of CO2 addition [158]. Besides that, the liquid phase can be easily
separated by depressurization and both the solvent and CO2 can be recycled.
Moneghini et al. [135] applied the GAS method to co-precipitate carbamazepine
(CBZ) with PEG (MW=4000). CBZ is practically insoluble in water and PEG
increases the solubility of CBZ in water due to its hydrophilic characteristic. They
reported that the dissolution rate of CBZ was improved by increasing PEG
concentration in CBZ-PEG co-precipitate. Recently, Subra-Paternault et al. [159] co-
precipitated a poorly water-soluble drug (tolbutamide) with micrometric silica and
biopolymers (PEG and Eudragit) using batch GAS process. They reported that the
products exhibited substantially different rates of dissolution in accordance with the
polymer function. The water-soluble PEG-tolbutamide co-precipitates improved the
dissolution rate of tolbutamide as compared to the raw drug. A controlled release of
tolbutamide was observed using water-insoluble Eudragit-tolbutamide co-precipitates.
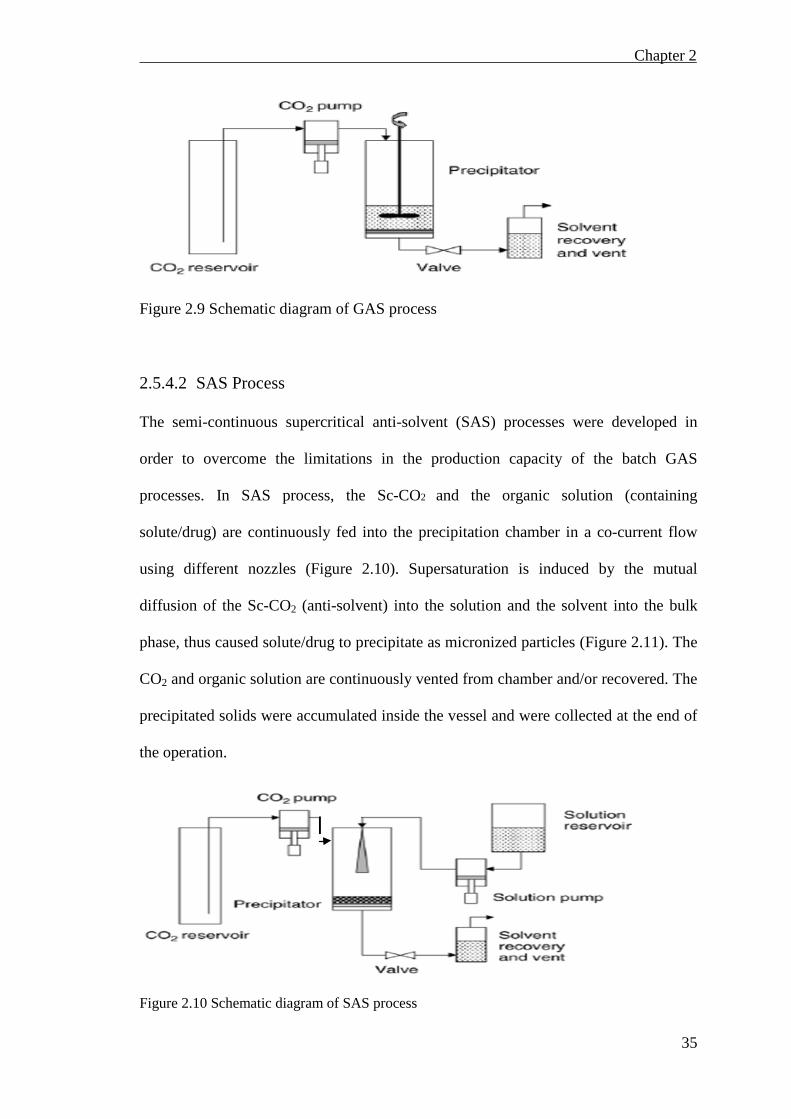
Chapter 2
35
Figure 2.9 Schematic diagram of GAS process
2.5.4.2 SAS Process
The semi-continuous supercritical anti-solvent (SAS) processes were developed in
order to overcome the limitations in the production capacity of the batch GAS
processes. In SAS process, the Sc-CO2 and the organic solution (containing
solute/drug) are continuously fed into the precipitation chamber in a co-current flow
using different nozzles (Figure 2.10). Supersaturation is induced by the mutual
diffusion of the Sc-CO2 (anti-solvent) into the solution and the solvent into the bulk
phase, thus caused solute/drug to precipitate as micronized particles (Figure 2.11). The
CO2 and organic solution are continuously vented from chamber and/or recovered. The
precipitated solids were accumulated inside the vessel and were collected at the end of
the operation.
Figure 2.10 Schematic diagram of SAS process
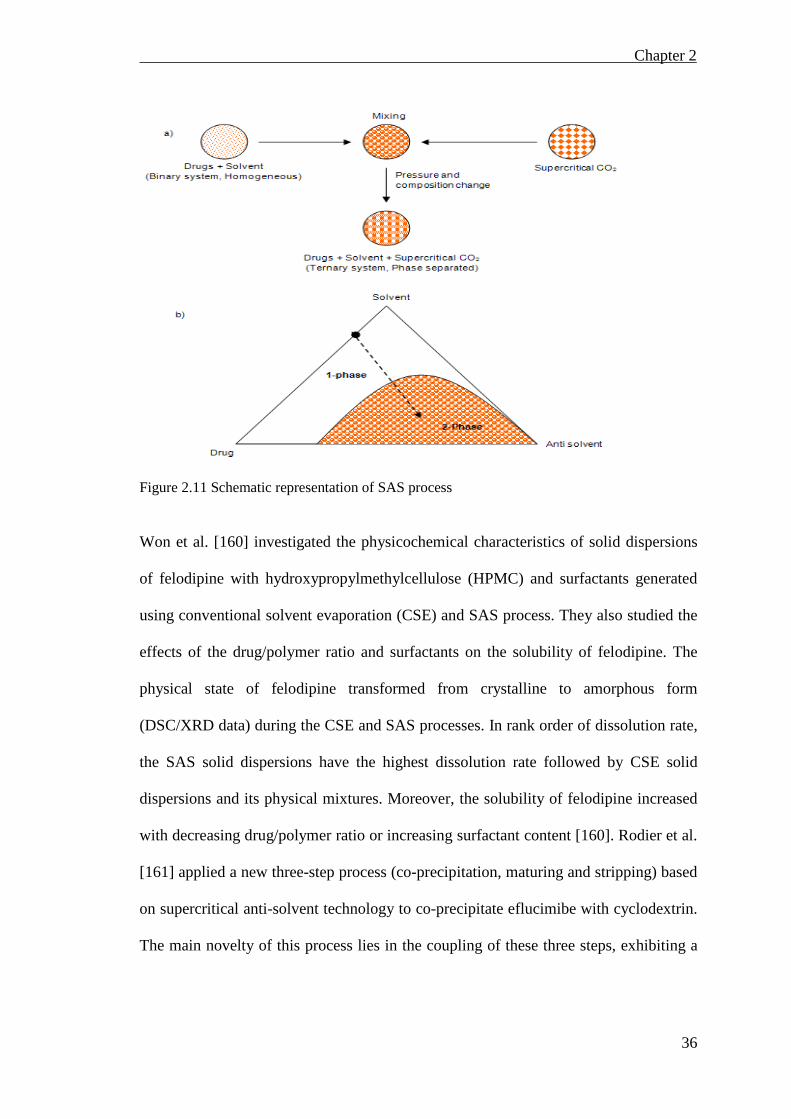
Chapter 2
36
Figure 2.11 Schematic representation of SAS process
Won et al. [160] investigated the physicochemical characteristics of solid dispersions
of felodipine with hydroxypropylmethylcellulose (HPMC) and surfactants generated
using conventional solvent evaporation (CSE) and SAS process. They also studied the
effects of the drug/polymer ratio and surfactants on the solubility of felodipine. The
physical state of felodipine transformed from crystalline to amorphous form
(DSC/XRD data) during the CSE and SAS processes. In rank order of dissolution rate,
the SAS solid dispersions have the highest dissolution rate followed by CSE solid
dispersions and its physical mixtures. Moreover, the solubility of felodipine increased
with decreasing drug/polymer ratio or increasing surfactant content [160]. Rodier et al.
[161] applied a new three-step process (co-precipitation, maturing and stripping) based
on supercritical anti-solvent technology to co-precipitate eflucimibe with cyclodextrin.
The main novelty of this process lies in the coupling of these three steps, exhibiting a

Chapter 2
37
strong synergistic effect in the improvement of the dissolved drug concentration of the
drug.
Chang et al. [162] applied SAS process to micronize sulfamethoxazole (poorly water-
soluble drug) and co-precipitate it with hydroxylpropylcellullose (HPC). They reported
that SAS co-precipitation of sulfamethoxazole with hydrophilic polymer HPC
enhanced dissolution rate of sulfamethoxazole as compared to the SAS micronized and
raw sulfamethoxazole, respectively. SAS co-precipitation of cefuroxime axetil (CFA,
antibiotic, amorphous form) with poly(vinylpyrrolidone) (PVP-K30) was performed
by Uzen et al. [163]. However, the drug release rate of SAS-co-precipitated CFA-PVP
(1:1w/w) particles was almost 10 times slower than the drug alone. As the ratio of the
polymer increased, the dissolution rate of CFA of SAS-CFA-PVP co-precipitates was
higher than the raw CFA due to the increased wetting effect of PVP. Recently, De
Zordi et al. [164] generated solid dispersion of furosemide with crospovidone using
SAS co-precipitation process. The physicochemical characterization of SAS-
Furosemide-crospovidone solid dispersions (1:1 and 1:2 wt./wt., respectively) revealed
the presence of the drug amorphously dispersed in the 1:2 wt./wt. samples at 100bar
and remained stable after 6 months of storage. The SAS solid dispersion exhibits the
best in vitro dissolution performance in the simulated gastric fluid (pH 1.2), in
comparison with the same solid dispersion obtained by conventional methods. Thus,
the drug to polymer ratio plays a crucial role in the generation of co-formulation. A
balance between drug and polymer/excipient in the final co-formulation should be
attained to ensure sufficient shelf life and drug therapeutic efficacy. However, this
optimization requires more understanding on the drug-polymer thermodynamic system

Chapter 2
38
and the nature of amorphous character, which has not been well reported. Table 2.9
shows some of co-precipitates generated using SAS process gathered from literature.
Table 2.9 Co-precipitation process using SAS
Material 1 Material 2a Material’s solventb Reference Carotenoid PEG DCM [165] Indomethacin, piroxicam & thymopentin L-PLA DCM [166] Lysozyme PGLA DCM [167] Diuron L-PLA DCM [168] Diuron L-PLA DCM [169] PMMA DCM & THF PMMA DCM EC DCM CA THF Insulin L-PLA DMSO + DCM [170] Hydrocortisone PVP EtOH [171] a L-Poly(lactic acid) (L-PLA); Poly(ethylene glycol) (PEG); Poly(methyl methacrylate) (PMMA); Ethylene cellulose (EC);Poly(lactic-co-glycolic acid) (PGLA); Cellulose acetate (CA) b Dichloromethane (DCM); Tetrahydrifuran (THF); Dimethyl sulfoxide (DMSO)
2.5.4.3 SEDS Process
Solution enhanced dispersion by supercritical fluids (SEDS) represents a specific
implementation of the GAS and SAS processes. These supercritical anti-solvent
techniques (SAS, GAS and SEDS) share the same particle formation principles and
differ in the manner in which the solution is contacted with the SCF. In the SEDS
process (Figure 2.12), both the solute solution and the anti-solvent are fed into the
precipitation chamber through a co-axial nozzle. The solute dissolved in an organic
solvent flows through the center inner tube, and the anti-solvent, typically CO2, flows
through the outer tube. This co-axial configuration allows rapid mixing (mass transfer)
of the streams in the nozzle, where the CO2 dissolves into the solution droplets and the
solvent is dissolved into the CO2-rich phase. The SEDS was invented and patented by
Hanna and York [84].

Chapter 2
39
Figure 2.12 Schematic diagram of SEDS process
The formation of solid solution particles in the SEDS process from a model drug and
two different types of carriers, mannitol and eudragit was investigated by Juppo et al.
[172]. They reported that SEDS co-precipitation generated solid solution of the drug
with eudragit only. FTIR analysis of the co-precipitate showed that interaction existed
between the acid hydroxyl group of the drug and the basic carbonyl group on the
eudragit. Jun et al. [173] applied SEDS process to co-precipitate cefuroxime axetil
with HPMC or PVP (K-30) to increase the dissolution rate of the drug. The SEDS co-
precipitates were in amorphous form and significantly improved the dissolution rate of
the drug as compared to its physical mixtures and raw drugs, respectively. Toropainen
et al. [174] generated solid budesonide-γ-cyclodextrin complexes using a single-step
SEDS process. The dissolution rate of this complexed budesonide was significantly
higher as compared to unprocessed micronized budesonide and SEDS-processed
budesonide without γ-cyclodextrin, respectively. Recently, Li et al. [175] compared the
physicochemical properties of the phospholipids complex of puerarin prepared by
conventional methods (solvent evaporation, freeze-drying and micronization) and SCF
technologies (GAS and SEDS). Phospholipids complex prepared using supercritical
fluid technologies showed similar properties of physical state, thermal stability and
molecular interaction with phospholipids to those of corresponding systems prepared

Chapter 2
40
by other three conventional methods (based on XRD, DSC, and FTIR). The best
dissolution rate was obtained by SEDS-prepared complex, while the highest solubility
was obtained using solvent evaporation method. Table 2.10 shows some of co-
precpitates generated using SEDS process gathered from literature.
Table 2.10 Co-precipitation using SEDS
Material 1 Material 2a Material’s solventb Reference Gentamycin, naltrexone & rafampin L-PLA DCM [176] Hydrocortisone DL-PLG DCM [177] Plasmid DNA Mannitol H2O+IPA [178] Budesonide PLA DCM [179] a L-Poly(lactic acid) (L-PLA); Poly(D,L-lactide-co-glycolide) (DL-PLG) b Dichloromethane (DCM); Isopropanol (IPA)
2.6 Characterizations of Solid Dispersion
Currently, the generation of amorphous drug in large scale still posed a problem to the
pharmaceutical industry [115]. Moreover, the characterization methods of
physicochemical properties of amorphous form are still lacking due to the
characterization methods mainly focused on detecting the presence of crystalline rather
than presence of amorphous state [115, 116]. Therefore, there are many
characterization methods used to detect amount of crystalline material in the
dispersion. The amount of amorphous material is not measured directly but is mostly
derived from the amount of crystalline material in the sample [115]. As a result, the
derived amorphous content of drug does not provide any information whether the drug
is present as amorphous drug or as molecularly dispersed molecules (Figure 2.3)
through the assessment of crystallinity characterization method. In some case, the
amorphous drug system was classified as amorphous form although the drug may exist
as liquid crystals due to the inadequate of physicochemical characterizations [180].

Chapter 2
41
The properties of a solid dispersion are highly affected by the uniformity of the
distribution of the drug in the matrix. The stability and dissolution behaviour could be
different for solid dispersions that do not contain any crystalline drug particles which
are the solid dispersions of type V and VI or for type II and III (Figure 2.3). However,
not only the knowledge on the physical state (crystalline or amorphous) is important
but the distribution of the drug as amorphous or crystalline particles or as separate drug
molecules is relevant to the properties of the solid dispersion too. Nevertheless, only
very few studies focus on the discrimination between amorphous incorporated particles
versus molecular distribution or homogeneous mixtures [181, 182]. In this section, a
brief discussion on some of the currently used characterization methods will be
highlighted.
2.6.1 X-ray Powder Diffraction (XRD)
X-ray powder diffraction (XRD) can be used to qualitatively detect material with long
range order. XRD also is the most convenient method for evaluating whether the
formulation is in the amorphous state. In amorphous state, the XRD measurement
provides a halo diffraction pattern. A sharp and distinct diffraction peaks indicates a
crystalline material. However, it should be stressed that nuclei and small crystals
cannot be detected using the XRD technique. Recently, the new XRD equipment is
capable to provide semi-quantitative analysis.
2.6.2 Scanning and Transmission Electron Microscopy
Scanning electron microscopy (SEM) and transmission electron microscopy (TEM)
can be used to evaluate the differences between molecularly dispersed drug and/or
nano-dispersion in amorphous solid dispersion with the aid and complementary to

Chapter 2
42
XRD [183]. The hot stage microscopy can be used to characterize the physical
properties of materials as a function of temperature, evaluation crystal forms, hydrates
and other physicochemical properties [184].
2.6.3 Differential Scanning Calorimetry (DSC)
Differential scanning calorimetry (DSC) and Hyper-DSC can be used to evaluate the
temperatures at which thermal events like glass to rubber transition, re-crystallization,
melting or degradation. Melting energy (enthalpy of fusion) can be used to detect the
amount of crystalline material. Re-crystallization energy can be used to calculate the
amount of amorphous material, and also provide the information whether all
amorphous material is transformed to the crystalline state or not [184]. Isothermal
microcalorimetry also could be used to measure the crystallization energy of
amorphous material that is heated above its glass transition temperature (Tg) [185].
However, this technique has some limitations. Firstly, this technique can only be
applied if the amorphous material re-crystallized during the measurement. Secondly, it
has to be assumed that all amorphous material crystallizes. Thirdly, in a binary mixture
of two amorphous compounds a distinction between crystallization energies of drug
and matrix is difficult. Besides that, temperature modulated differential scanning
calorimetry (TMDSC) can be used to access the amount of molecularly dispersed drug.
Subsequently, the fraction of drug that is dispersed as separate molecules can be
calculated [186].
2.6.4 Physical Stability Evaluation
Physical stability is the most challenging issue to overcome for solid dispersions.
During long-term storage, the rate-limiting step of crystallization is nucleation [187].

Chapter 2
43
However, the temperature dependence of the nucleation rate is difficult to evaluate,
and nucleation occurs in a whimsical manner. An accurate estimation of the
crystallization rate during storage can be done only by observing the stability at the
same temperature of the storage conditions. Thus, much effort is ongoing to establish a
protocol for predicting long-term physical stability [12, 188]. One of the commonly
used methods to evaluate physical stability of solid amorphous form is based on the
guideline provided by International Conference of Harmonization (ICH) as shown in
Table 2.11.
Table 2.11 ICH guidelines for stability testing of new drugs and products
Stability study Storage condition Minimum storage period
Long terma 25oC±2oC/60%RH±5%RH or 30oC±2oC/65%RH±5%RH
12 months
Intermediateb 30oC±2oC/65%RH±5%RH 6 months
Accelerated 40oC±2oC/75%RH±5%RH 6 months a It is up to the applicant to decide whether long term stability studies are performed at 25 ± 2°C/60% RH ± 5% RH or 30°C ± 2°C/65% RH ± 5% RH b If 30°C ± 2°C/65% RH ± 5% RH is the long-term condition, there is no intermediate condition
2.6.5 Gravimetric Vapour Sorption (GVS)
Water vapour sorption can be used to discriminate between amorphous and crystalline
material when the hygroscopicity is different [189]. This method requires accurate data
on the hygroscopicity of both completely crystalline and completely amorphous
samples. Young et al. [190] applied organic dynamic vapour sorption (organic-DVS)
to characterize amorphous content in known amorphous-crystalline mixtures of lactose
and salbutamol sulfate. Recently, Sheng et al. [191] employed gravimetric vapour
sorption (GVS) to induce the re-crystallization behavior of amorphous etravirine.

Chapter 2
44
2.6.6 Fourier Transformed Infrared and Raman Spectroscopy
Infrared spectroscopy (IR) can be used to detect the variation in the energy distribution
of interactions between drug and polymer matrix [192]. Sharp vibrational bands
indicate crystallinity [193]. Fourier transformed infrared spectroscopy (FTIR) was
used to accurately detect crystallinities ranging from 1-99% in pure material [107].
However, in solid dispersions only qualitative detection was possible [194]. Confocal
Raman spectroscopy can be used to evaluate the content and homogeneity of the solid
mixture in the solid dispersion [181]. Recently, Widjaja et al.[195] employed Raman
microscopy and chemometric analysis to detect trace of crystallinity in four different
amorphous systems. They also reported that the spatial distributions of drug and
polymer can be directly obtained in order to study the homogeneity of the APIs in the
solid dispersions.
2.6.7 Inverse Gas Chromatography (IGC)
It is often known that re-crystallization started to occur at the surface of amorphous
materials. Crowly and Zografi [63] reported that smaller particles of amorphous IDMC
and IDMC-PVP solid dispersion re-crystallized faster as compared to the larger
particles, indicating surface-mediated nucleated occurred. Therefore, the surface
properties of powders are important parameter in the handling and performance of a
wide range of solid materials.
Recently, inverse gas chromatography (IGC) is used to study the surface and bulk
properties of particulate and fibrous materials. IGC has been used to measure
physicochemical properties of solid materials such as powder surface energies,
acid/base/polar functionality of surfaces and phase transition temperatures/humidities.

Chapter 2
45
In addition kinetic effects such as diffusion and permeability may also be measured.
IGC is a vapour sorption technique in which the powder is packed in a column and
known vapours (usually at infinite dilution in a carrier gas) are injected. From the
retention times of the probes it is possible to assess the surface nature of the material in
the column. In keeping with the calorimetric and gravimetric techniques, it is to be
expected that this vapour sorption approach will also be able to detect differences in
samples due to small amounts of amorphous content. In summary, IGC is an excellent
tool for studies of transitions in the amorphous state, probing critical surface changes,
revealing conditions where physical transitions occur and doing this in defined
conditions.
Hellen et al. [196] employed the IGC to assess the differences in surface energy
(crystalline, amorphous and milled lactose) due to processing induced disorder and to
understand whether the disorder dominated the surfaces of particles. They reported that
materials with small amount of amorphous content can have very different surface
energies as compared to the crystalline form.
Buckton et al. [197] investigated the glass transition temperature of a powder surface
using IGC. They reported that it possible to better understand the slow and complex
changes that occur in hydrophobic amorphous materials as a function of temperature
and relative humidity using IGC. Ohta and Buckton [198] used IGC to assess the acid-
base contributions to surface energies of cefditoren pivoxil and methacrylate co-
polymers and the possible link to instability. They reported that the IGC would be
suitable to elucidate the cause of incompatibility between two different solids.
Hasegawa et al. [64] employed IGC to determine the structural relaxation at the
Chapter 2
46
surface of amorphous solid dispersion. They reported that the structural relaxation at
the surface happens faster than that of the bulk solid. Recently, Ke et al. [65]
investigated the preparation methods on surface/bulk structural relaxation and glass
fragility of amorphous solid dispersions using IGC. They also reported that the surface
had higher molecular mobility than the bulk solid.

Chapter 3
47
3. Material and Methods
3.1 Model Compound
γ-Indomethacin (1-(p-chlorobenzoyl)-5-methoxy-2-methylindole-3-acetic acid), IDMC
(Fluka) and poly(vinylpyrrolidone), PVP (molecular weight 360,000, Sigma) were
used as received. IDMC, a poorly water-soluble (<0.01µg/mL in water from Merck
Index, 2006) and non-steroidal anti-inflammatory drug (NSAID), which is classified as
class II drugs in Biopharmaceutical Classification System (BCS) has low
bioavailability and high permeability. IDMC is used as a painkiller and treating
inflammatory conditions such as arthritis, osteoarthritis, alkylosing spondylitis and
other disorders. It has a molecular weight of 357.79g/mol.
IDMC existed in two known polymorphic forms of α and γ-indomethacin. The γ-phase
(triclinic, plate morphology) constituting the monotropic system and is the
thermodynamically more stable form than α-phase (monoclinic, acicular habit) [199].
In the monoclinic form, 6 molecules of IDMC with three different conformations are
packed in a unit cell, whereas for a unit cell of the triclinic form, two molecules of the
same conformation and dimerization is formed by hydrogen bonding between
carboxylic acid functional groups [200]. The melting point of the α-form is 155oC with
a heat of fusion of 91J/g, whereas the γ-form melts at 161oC with a heat of fusion of
110J/g [200]. The decomposition temperature of IDMC is 220oC [200].
PVP is an amorphous polymer with MW ranging from 2,500 to 3,000,000. It is
classified according to the K value, which is calculated using Fikentscher's equation
[201]. Glass transition temperature (Tg) of PVP is high and depends on molecular

Chapter 3
48
weight and moisture content. The high Tg of PVPs (>160oC) may renders them
unsuitable for the preparation of solid dispersions by the hot melt method [202]. They
are soluble in a wide variety of organic solvents and are particularly suitable for the
preparation of solid dispersions by the solvent method [202]. PVP is a water-soluble,
hydrophilic and hygroscopic polymer made from the monomer N-vinylpyrrolidone.
Besides that, PVP also possessed chemical and biological inertness, low toxicity, high
media compatibility, cross-linkable flexibility and other unique properties. The
chemical structures of IDMC and the PVP repeating unit are shown in Figure 3.1. The
PVP used in this study has a Tg of 177oC.
Figure 3.1 Chemical structures of (A) IDMC; (B) PVP repeating unit
3.2 Preparation of Physical Blends
The physical blends (PB) of different IDMC to PVP ratios (20:80, 60:40 and
50:50wt./wt.) were prepared in a turbula mixer (Turbula® T2F) at 49rpm for 45
minutes. All PB was characterized immediately after harvesting the samples from the
glass vessels at the end of the mixing process (used for co-milling samples and
controls).

Chapter 3
49
3.3 Milling
3.3.1 Co-milling of IDMC with PVP
Similar physical blends of IDMC to PVP ratios were prepared using turbula mixer and
co-milled using Fritsch Pulverisette 5 (Fritsch GmbH Pulverisette 5, Idar-Oberstein,
Germany), a planetary ball mill equipped with stainless steel jar and balls (diameter
10mm). The mass ratio of ball to sample was kept at 50:1 [203]. The rotation speed
was set at 350rev/min and a milling duration of 120 minutes. The co-milled IDMC-
PVP (COM IDMC-PVP) powder was characterized immediately after harvesting the
sample from the milling jars at the end of the milling process.
3.3.2 Cryo-milling to Generate Amorphous Form of IDMC
Approximately 2g of γ-IDMC was cryo-milled in an oscillatory ball mill (Mixer Mill,
Cryomill, Retsch GmbH and Co., Germany). The powder sample was placed in a
50mL volume stainless steel milling jar containing one stainless steel ball with 50mm
diameter. Milling jars were then sealed and pre-cooled for 5 minutes with liquid
nitrogen before milling at 20Hz for 150 minutes. Pre-cooling of the milling chambers
with liquid nitrogen was performed every 2 minutes. The cryo-milled IDMC powder
was characterized immediately after harvesting the sample from the milling jars at the
end of the milling process.
3.4 SAS Experimental Set-up and Procedures
Carbon dioxide 99.95 % (SOXAL) purity was used as an anti-solvent for SAS process.
Mixtures of IDMC and PVP at various weight ratios of 85:15, 60:40, 50:50 and 20:80
were prepared by dissolving it into a mix-solvent containing reagent grade of acetone

Chapter 3
50
and dichloromethane (Table 3.1). All the various weight ratios of IDMC and PVP have
similar IDMC concentration of 12mg/mL. The composition of mix-solvent is 80 and
20 vol.% of acetone and dichloromethane, respectively. All SAS co-precipitations
processes were conducted at 85bar and 35oC.
Table 3.1 Composition of co-precipitates prepared by SAS process
Samplea T (oC) P (bar) IDMC:PVP (wt./wt.) Remark
SAS IDMC 35 85 100:0 A
SAS IDMC85-PVP15 35 85 85:15 B
SAS IDMC60-PVP40 35 85 60:40 C
SAS IDMC50-PVP50 35 85 50:50 D
SAS IDMC20-PVP80 35 85 20:80 E
SAS PVP 35 85 0:100 F a All samples were dissolved in a mix- solvents (acetone:dichloromethane=20:80 vol.%). Concentration of IDMC in the mixed solvent was 12mg/mL. b (A) SAS processed IDMC; (B) SAS IDMC-PVP with 15wt.% of PVP; (C) SAS IDMC-PVP with 40wt.% of PVP; (D) SAS IDMC-PVP with 50wt.% of PVP; (E) SAS IDMC-PVP with 80wt.% of PVP; (F) SAS processed PVP
A SAS apparatus (model: SAS50, Thar Technologies Co., USA) was used to generate
different ratios of SAS IDMC-PVP co-precipitates. Pure IDMC and PVP were also
generated using SAS process. Figure 3.2 shows the schematic diagram of Thar SAS
system using Sc-CO2 as anti-solvent. Firstly, the CO2 (1) was cooled down with a bath
cooler (3) operating at 5oC to assure liquid state in the pump. The liquefied CO2 was
then pumped into precipitation vessel (10) (500mL vessel, 54mm internal diameter and
218mm internal height) using a high-pressure pump (11) through the CO2 spray nozzle
(16) (100μm stainless steel orifice), to fill up the precipitation vessel. The flow-rate of
CO2 was set at 60g/min. The CO2 was heated using pre-heater (6) before entering the
precipitation vessel. The pressure (85bar) and temperature (35oC) in precipitation
vessel was controlled using an automatic back-pressure regulator, ABPR (13) and a
temperature controller to regulate pre-specified heat to the heating jacket (8),

Chapter 3
51
respectively. Once the steady state was established, the solution pump (11) was
switched on and sprayed the solution of drug and polymer (15) into the precipitation
vessel through the solution spray nozzle (9) (100μm stainless steel orifice). The flow-
rate of the solution pump was set at 1mL/min and approximately 50-80mL of solution
of drug and polymer was sprayed into the precipitation vessel. Rapid mixing between
the two media and the fast diffusion of Sc-CO2 into the drug solvent produces a
supersaturated solution and causes the drug to precipitate as micronized particles. Once
sufficient powders were collected in the metal frit (5), the solution pump was switched
off and Sc-CO2 was continuously pumped into the precipitation vessel to wash-up the
remaining solvent residual for duration of approximately 60-80 minutes. The
precipitation vessel was then depressurised gradually to atmospheric pressure using the
vent valves. Finally, the powders were collected from the inside of the precipitator for
further characterizations.
Figure 3.2 Schematic process flow diagram of Thar SAS50 system

Chapter 3
52
3.5 Powder Characterizations
3.5.1 X-ray Powder Diffraction (XRD)
X-ray diffraction analysis was carried out to evaluate the solid-state chemistry of
powders. XRD diffractograms were collected for powdered sample using a Bruker
XRD D8 Advance instrument. Diffraction patterns were measured in-situ by spinning
sample holders within the X-ray beam. The radiation was generated by Cu filter at
35kV and 40mA. Data were collected over the 2θ range 4-55o with a step size of
0.017o and step time of 1s.
3.5.2 Scanning Electron Microscopy (SEM)
The morphology, particle size and shape of COM IDMC-PVPs and SAS co-
precipitates were characterized using scanning electron microscopy (JEOL JSM-6700F
SEM-EDX) at 5 kV accelerating voltage. All samples were coated with a thin layer of
gold using a Cressington Sputter Coater instrument before SEM analyses.
3.5.3 Differential Scanning Calorimetry (DSC)
DSC thermograms (DSC Q200 V24.4 Build 268, TA Instruments, USA) were obtained
under a nitrogen gas flow of 50mL/min. Calibration of the DSC instrument was carried
out using indium as a standard. Sample powders (2–5mg) were crimped in an
aluminium pan and heated at a rate of 10oC/min from 20 to 200oC. The glass transition
temperature of generated powders (Tg and melting temperature (Tm) were determined
using TA Universal Analysis software, version 4.4A. The Tg was determined as the
midpoint of the change in heat capacity of the sample, while Tm was determined as the
onset temperatures.
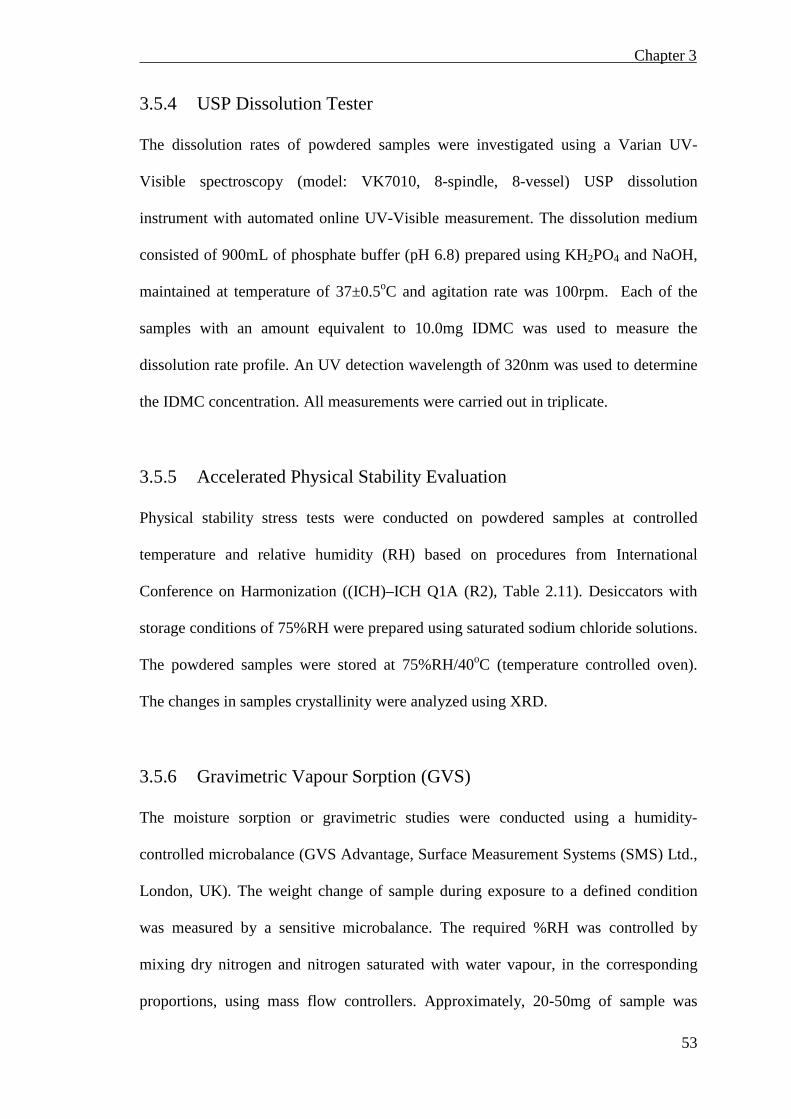
Chapter 3
53
3.5.4 USP Dissolution Tester
The dissolution rates of powdered samples were investigated using a Varian UV-
Visible spectroscopy (model: VK7010, 8-spindle, 8-vessel) USP dissolution
instrument with automated online UV-Visible measurement. The dissolution medium
consisted of 900mL of phosphate buffer (pH 6.8) prepared using KH2PO4 and NaOH,
maintained at temperature of 37±0.5oC and agitation rate was 100rpm. Each of the
samples with an amount equivalent to 10.0mg IDMC was used to measure the
dissolution rate profile. An UV detection wavelength of 320nm was used to determine
the IDMC concentration. All measurements were carried out in triplicate.
3.5.5 Accelerated Physical Stability Evaluation
Physical stability stress tests were conducted on powdered samples at controlled
temperature and relative humidity (RH) based on procedures from International
Conference on Harmonization ((ICH)–ICH Q1A (R2), Table 2.11). Desiccators with
storage conditions of 75%RH were prepared using saturated sodium chloride solutions.
The powdered samples were stored at 75%RH/40oC (temperature controlled oven).
The changes in samples crystallinity were analyzed using XRD.
3.5.6 Gravimetric Vapour Sorption (GVS)
The moisture sorption or gravimetric studies were conducted using a humidity-
controlled microbalance (GVS Advantage, Surface Measurement Systems (SMS) Ltd.,
London, UK). The weight change of sample during exposure to a defined condition
was measured by a sensitive microbalance. The required %RH was controlled by
mixing dry nitrogen and nitrogen saturated with water vapour, in the corresponding
proportions, using mass flow controllers. Approximately, 20-50mg of sample was

Chapter 3
54
weighed and conducted under 0 to 90%RH in steps of 10%RH for each experiment.
The system was considered to be in equilibrium if the rate change of mass was less
than 0.002%/min. All experiments were conducted at 25°C.
3.5.7 Fourier Transformed Infrared Spectroscopy (FTIR)
FTIR absorbance spectra of different composition of SAS IDMC-PVP co-precipitates,
COM IDMC-PVPs and PB IDMC-PVPs as well as the untreated IDMC and PVP were
obtained on a FTIR spectrometer (Perkin–Elmer, 2000, MA, USA). Samples were
prepared as a pellet in a KBr matrix. Thirty-two scans were collected for each sample
with a spectral resolution of 4cm-1.
3.5.8 Inverse Gas Chromatography (IGC)
3.5.8.1 Experimental Apparatus
In this study, powder surface characterizations were conducted using a commercial
IGC (Surface Measurement Systems (SMS) Ltd., London, UK) and Table 3.2 shows
the IGC system design specifications. The IGC system consisted of three separate
modules built with a SMS mass flow controller module, Hewlett Packard (HP) 6890
series gas chromatograph (GC) oven and SMS column temperature control oven as
shown in Figure 3.3 [204]. The IGC is a fully automated system and controlled by
SMS iGC controller v1.3 software and SMS iGC Analysis Macro is used to analyze
the data. The SMS mass flow controller is used to prepare mixtures of dry helium
carrier gas and the probe vapour. The gas/vapour mixtures are subsequently injected
into the reference gas (dry helium) and flow through the column packed with sample to
the detectors. The HP 6890 GC oven is used to control the probe solvents temperature
and comprising a flame ionization detector (FID) and thermal conductivity detector

Chapter 3
55
(TCD) connected in series at the column outlet. The HP 6890 GC data acquisition
system is used to record data from the FID and TCD. Finally, the SMS column oven is
used to control the temperature of column packed with samples and operate between
room temperature to 90oC. Powder is packed into pre-silanized glass columns
(300×3mm ID) by vertical tapping for 15 minutes and supported with silanized glass
wool at both end of the glass column.
Table 3.2 SMS IGC system design specifications
SMS IGC system
Column temperature 20-90oC
Humiditya 0-90%RH
Flow 5-40mL/min (Standard)
Samplesb 0.1-2.0cm3
Injections 250μL, 1-95% saturation a Total RH including solute concentration <95%; b Standard, typically 100-200mg for a fine powder
Figure 3.3 SMS IGC schematic diagrams

Chapter 3
56
3.5.8.2 Evaluation of Surface Energies of Powders
Untreated IDMC, PVP, PB, COM and SAS samples were packed vertically into pre-
silanized glass columns and loaded into SMS column oven. Pre-conditioning of
samples was conducted for 5 hours at 30oC/0%RH. Measurements of the dispersive
interaction were conducted using 3% of n-decane, n-nonane, n-octane, and n-heptane
at 30oC. Acetone, ethyl acetate and 2-propanol were used as the polar vapour probes
(all solvents were HPLC grade). Table 3.3 shows the surface properties of vapour
probes [205] used in this study. The gas flow rate was set at 10mL/min. All
measurements were conducted at least with two different columns and 5
measurements.
Table 3.3 Surface properties of vapour probes used in IGC
Vapour probes a(𝛾𝛾𝐿𝐿𝑑𝑑 )1/2 (m²(J/m²)1/2)a Nature
n-decane 1.15 x 10⁻¹⁹ Non-polar
n-nonane 1.04 x 10⁻¹⁹ Non-polar
n-octane 9.19 x 10⁻²⁰ Non-polar
n-heptane 8.16 x 10⁻²⁰ Non-polar
Acetone 4.37 x 10⁻²⁰ Polar (Amphoteric)
Ethyl Acetate 4.62 x 10⁻²⁰ Polar (Basic)
2-propanol 6.29 x 10⁻²⁰ Polar (Acidic) a Values were obtained from SMS-iGC analysis software (V.1.3).
The surface properties of samples under investigation are determined from net
retention volume measurement (VR). For non-polar and polar probes, symmetrical
peaks were recorded and the retention time was taken as the peak maximum. Under the
Henry’s Law region, the elution times of vapour probes are independent of the vapour
probes quantity injected. This region is also called as the infinite dilution range and
interactions of vapour probe molecules with solid surface occurred predominantly at

Chapter 3
57
surface with the highest energy sites. The net retention volume of a vapour probe is
directly related to its thermodynamic interaction with the sample solid surface, is given
by:
𝑉𝑉𝑅𝑅 = 𝑗𝑗𝑑𝑑∙ 𝐹𝐹 ∙ (𝑑𝑑𝑅𝑅 − 𝑑𝑑0) ∙ 𝑇𝑇
273.15 (3.1)
where T is the column temperature, m is the mass of sample, F is the exit flow-rate, 𝑑𝑑𝑅𝑅
is the retention time for the adsorbing probe and 𝑑𝑑0 is the mobile phase hold-up time
(dead time, using methane gas as reference). “j” is the James-Martin correction, which
corrects the retention time for the pressure drop in the column bed, is given by:
𝑗𝑗 = 32∙
[�𝐺𝐺𝑖𝑖𝐺𝐺0�
2−1]
[�𝐺𝐺𝑖𝑖𝐺𝐺0�
3−1]
(3.2)
where Pi and P0 are the inlet and outlet column pressures, respectively.
The molar free energy of adsorption (∆𝐺𝐺𝐴𝐴0) can be determined from IGC infinite probe
dilution data measurements, is given by:
−∆𝐺𝐺𝐴𝐴0 = 𝑅𝑅𝑇𝑇 ∙ 𝑙𝑙𝑙𝑙(𝑉𝑉𝑅𝑅) + 𝐶𝐶 (3.3)
where, R is the ideal gas constant, T is the absolute temperature of the column and C is
a constant, depending on the reference state of adsorption. In addition ∆𝐺𝐺𝐴𝐴0 is also
related to the energy of adhesion (WA) between vapour probe molecules and sample
solid surfaces, is given by:
−∆𝐺𝐺𝐴𝐴0 = 𝑁𝑁𝐴𝐴 ∙ 𝑎𝑎 ∙ 𝑊𝑊𝐴𝐴 (3.4)
where NA is Avogadro’s number and “a” is the surface area of the adsorbed probe
molecule. Based on the Fowkes’s work [206], the WA can be divided into two terms, is
given by:
𝑊𝑊𝐴𝐴 = 𝑊𝑊𝐴𝐴𝐴𝐴 + 𝑊𝑊𝐴𝐴
𝐺𝐺𝐺𝐺 (3.5)

Chapter 3
58
where 𝑊𝑊𝐴𝐴𝐴𝐴 denoting the van der Waals forces and 𝑊𝑊𝐴𝐴
𝐺𝐺𝐺𝐺 the specific, mainly polar
interactions. Hence, the work of adhesion WA as a geometric mean of the dispersive
surface energy of solid and liquid is given by:
𝑊𝑊𝐴𝐴 = 2�𝛾𝛾𝑠𝑠𝑑𝑑 ∙ 𝛾𝛾𝐿𝐿𝑑𝑑�12 (3.6)
where 𝛾𝛾𝐺𝐺𝑑𝑑 and 𝛾𝛾𝐿𝐿𝑑𝑑 are the dispersive surface energy of the solid and vapour probe,
respectively. Equation (3.7) is derived from equations (3.3), (3.4) and (3.6).
𝑅𝑅𝑇𝑇 ∙ 𝑙𝑙𝑙𝑙 𝑉𝑉𝑅𝑅 = 2 ∙ 𝑎𝑎 ∙ 𝑁𝑁𝐴𝐴 ∙ (𝛾𝛾𝑠𝑠𝑑𝑑)12 ∙ �𝛾𝛾𝐿𝐿𝑑𝑑�
12 + B (3.7)
The dispersive component of a solid 𝛾𝛾𝑠𝑠𝑑𝑑 as described by Schultz et al. [207], can be
determined by plotting 𝑅𝑅𝑇𝑇 ∙ ln(VR) versus 𝑎𝑎 ∙ �𝛾𝛾𝐿𝐿𝑑𝑑�1/2
as shown in Figure 3.4.
When vapour polar probes are being used, the vertical distance between the polar
probe data point and the vertical projection to the reference n-alkane line represents the
specific polar component of the free energy of adsorption (−∆𝐺𝐺𝐺𝐺𝐺𝐺0 ) of a polar probe
with a solid material as shown in Figure 3.4. In this study, all measurements were
conducted at infinite dilution range.
Figure 3.4 A typical net retention volume plot versus vapour probe surface properties

Chapter 3
59
3.5.8.3 Evaluation of Surface Structural Relaxation
SAS IDMC60-PVP40 and COM IDMC60-PVP40 samples were packed into silanized
glass column and were conditioned in the IGC using helium gas as carrier gas
(20mL/min) at 30oC/0%RH for 12 hours to minimize the effect of water on the surface
structural relaxation measurements. Once the conditioning cycle was completed, the
temperature of IGC column oven was increased to 50oC in order to induce surface
structural relaxation of SAS IDMC60-PVP40 and COM IDMC60-PVP40 samples. In
this elution study, n-decane (3%) and methane gases were used as probe and reference
gases, respectively. The n-decane and methane were repeatedly injected sequentially
into the samples column and the FID responses were recorded. The solvent oven was
set at 30oC. The estimation of retention volume (𝑉𝑉min) convergence after aging the
sample was based on the modified Kohlraush-Williams-Watts (KWW) equation is
given by:
𝑉𝑉𝑅𝑅 = 𝑉𝑉𝑑𝑑𝑖𝑖𝑙𝑙 + 𝐴𝐴 ∙ exp �− �tτ�β� (3.8)
where 𝑉𝑉𝑅𝑅 is a retention volume of n-decane at each time, 𝜏𝜏 is a relaxation time
constant, 𝛽𝛽 is a relaxation time distribution parameter (0 < 𝛽𝛽 ≤ 1), 𝑑𝑑 is an aging time
and 𝐴𝐴 is a pre-exponential factor. As (𝐴𝐴 ∙ 𝑒𝑒𝑒𝑒𝑒𝑒�−(𝑑𝑑/𝜏𝜏)𝛽𝛽 �) approached to zero when 𝑑𝑑
approaches infinite and we can define 𝑉𝑉𝑑𝑑𝑖𝑖𝑙𝑙 as the convergent retention volume. The 𝑉𝑉𝑅𝑅
data were fitted using MATLAB (version R2010A) to determine the 𝑉𝑉𝑑𝑑𝑖𝑖𝑙𝑙 , 𝜏𝜏 and 𝛽𝛽
parameters.
3.5.9 Raman Microscopy Mapping (RM)
Raman mapping (RM) measurements on COM and SAS samples (IDMC:PVP=60:40)
were performed using a Raman microscope (InVia Reflex, Renishaw, UK) equipped

Chapter 3
60
with near infrared enhanced deep-depleted thermoelectrically Peltier cooled CCD array
detector (576×384 pixels) and a high grade Leica microscope. The sample was
irradiated with a 785nm near infrared diode laser and a 50× objective lens (N.A.=0.5)
was used to collect the back-scattered light. Raman point-by-point mapping with a step
size of 5µm in both the x and y axis directions was performed in an area of 100µm by
100µm. For each mapping measurements, 441 Raman spectra were collected.
Measurement scans were collected using a static 1,800 groove per mm dispersive
grating for the spectral window from 300 to 1,800cm-1. Spectra pre-processing, i.e. de-
spiking was performed in order to remove the spikes due to the presence of cosmic
rays before the collected data was further analyzed using the band-target entropy
minimization (BTEM) algorithm [208]. BTEM algorithm is one of the self-modelling
curve resolution (SMCR) techniques, which can be used to recover the pure
component spectra of underlying constituents from a set of mixture spectra without
recourse to any a priori known spectral libraries.
3.5.10 Thermogravimetric (TGA)
Thermogravimetric (TA instrument, TGA-Q500) analysis was conducted with an
automatic analyzer system to determine the thermal stability and the composition of
samples. The weight change of substances was measured in the temperature range 25-
900°C at heating rate of 10°C/min, under nitrogen purge. The nitrogen flow-rate was
40mL/min.
3.5.11 Gas Chromatography (GC)
A GC was used to determine the concentration of residual solvents (acetone and
dichloromethane) in all SAS processed samples, as it is capable to give high-resolution

Chapter 3
61
peak, accurate and sensitive detection in low concentration. An Agilent Technologies
Auto-system (Model 6890N) GC equipped with flame ionization detector (FID) and
auto-sampler was employed. The capillary column used for GC analysis was a HP-1
(Agilent column) having dimensions of 30m×0.53mm×2.65µm (L×ID×Film). Helium
is used as the carrier gas, having a flow-rate of 50cm/s and the split ratio was set at 2:1.
The detector and injection temperature were set at 300 and 250oC, respectively. The
temperature profile of the oven is shown in Figure 3.5. The measurement of these
residual solvents was conducted using an external standard method. This method was
performed graphically and included in the software data system. The standard
solutions were prepared by dissolving weighted amounts of residual solvents in GC
grade dimethyl sulfoxide (DMSO). The injection volume for each run was set at 2µL.
The residual solvents were analyzed based on the retention times and peak areas on the
chromatogram. All measurements were carried out in triplicate.
Figure 3.5 Temperature profiles for GC oven

Chapter 4
62
4. Results and Discussion
4.1 Solid-State (XRD)
Figure 4.1 and Figure 4.2 show the X-ray diffractograms of γ-IDMC and α-IDMC
from the Cambridge Structural Database System (CSD), respectively. Figure 4.3A
shows the X-ray diffraction pattern of untreated IDMC, which was taken at room
temperature and used as a reference. The sharp and highly intense Bragg’s peaks
represented crystalline nature of the drug. The untreated IDMC (crystalline) was in γ-
polymorph form and corresponded to X-ray diffraction characteristic peaks at 2θ
diffraction angles of 11.6, 16.7 19.6, 21.9, and 26.7o [200]. Figure 4.3G shows the
untreated PVP composed of a halo diffraction pattern which indicates that the
untreated PVP was in X-ray amorphous form.
The SAS processed IDMC (crystalline) was in α-polymorph form and retaining the X-
ray diffraction characteristic peaks at 2θ diffraction angles of 8.4, 14.4, 18.5 and 22.1o
[200] as shown in Figure 4.3B. Recently, Varughese et al. [209] also employed SAS
process to prepare micronized IDMC particles using acetone and dichloromethane as
drug solvent. Similarly, they obtained α-polymorph IDMC particles after processing
the γ-IDMC using SAS. Figure 4.3C, D, E and F show the co-precipitates of IDMC
with PVP using SAS process. It was noted that the generated SAS IDMC85-PVP15
co-precipitate (SAS IDMC85-PVP15 denotes SAS co-precipitates of IDMC with
15wt.% of PVP) was in crystalline form and existed as α-polymorph form powders. As
the polymer to drug ratios were increased from 40 to 80wt.%,, the generated SAS co-
precipitates were all in X-ray amorphous form. The formation of amorphous forms was

Chapter 4
63
verified by XRD analyses, in which the diffraction patterns only showed a halo with
no crystalline peaks (Figure 4.3D, E and F).
Figure 4.1 CSD of γ-IDMC
Figure 4.2 CSD of α-IDMC
γ-IDMC
α-IDMC

Chapter 4
64
Figure 4.3 XRDs showing the effect of SAS co-precipitation ratios on crystallinity
Gong et al. [56] also obtained X-ray amorphous IDMC-PVP co-precipitates using
GAS processing technique. However, the amorphous co-precipitate in Gong’s work
required much higher PVP content of 80wt.% and above. Kluge et al. [52] studied the
effect of phenytoin to PVP ratios using precipitation with compressed anti-solvent
(PCA) process and generated X-ray amorphous co-formulations at PVP contents of
60wt.% and above. Besides that, these amorphous co-formulations remained stable
after one year of storage at ambient conditions. Banchero et al. [53] also successfully

Chapter 4
65
impregnated piroxicam and PVP using supercritical solvent impregnation process and
X-ray amorphous impregnated samples were obtained at PVP contents of 85wt.% and
above. They also reported that polymer molecular weight was mainly found to affect
the dissolution rate of the different formulations. Similarly, Sethia et al. [55] reported
that high molecular size of polymers favours the formation of solids solutions and
could inhibit the re-crystallization of the drug. In comparison to these works, our study
showed SAS could also generate X-ray amorphous solid dispersions of IDMC and
even at PVP contents as low as 40wt.%. Besides that, it can alter the polymorphic form
of γ-IDMC crystalline to the meta-stable α-IDMC form
Cryo-milling and co-milling of γ-IDMC were conducted to generate amorphous form
of IDMC. Figure 4.4B shows the diffraction pattern of freshly cryo-milled IDMC has a
halo pattern with no crystalline peaks, which indicates that it was in X-ray amorphous
form. Similarly, all the different freshly co-milled IDMC-PVP ratios were in X-ray
amorphous as shown in Figure 4.4C, D and E. The results are similar to those obtained
by Gupta et al. [128], who have demonstrated using ball-milling to amorphize three
acidic drugs (naproxen, ketoprofen and indomethacin) and a basic drugs (progesterone)
when co-milled with neusulin US2 (a synthetic magnesium aluminometasilicate)
Moreover, co-milling of IDMC with polymers or silica nano-particles to generate
amorphous solid dispersions have also been reported [13, 128]. Similar to SAS co-
precipitation, it was feasible to generate X-ray amorphous IDMC-PVP co-precipitates
with PVP contents of 40wt.% and above using co-milling.

Chapter 4
66
Figure 4.4 XRDs showing the effect of COM co-precipitation ratios on crystallinity
4.2 Morphology (SEM)
Figure 4.5A, B, C and D shows some of the images of freshly generated SAS IDMC,
SAS IDMC50-PVP50, SAS IDMC20-PVP80 and COM IDMC50-PVP50, respectively
(SAS IDMC50-PVP50 denotes SAS co-precipitates of IDMC with 50% of PVP; SAS
IDMC60-PVP40 denotes SAS co-precipitates with 40wt.% of PVP; COM IDMC50-
PVP50 denotes co-milled IDMC with 50wt.% of PVP). The untreated IDMC has
multi-faceted structures with diameter of approximately 90µm as shown in Figure

Chapter 4
67
4.6A. SAS IDMC was predominantly thread-like structures as shown in Figure 4.6B.
Co-precipitates of SAS IDMC60-PVP40, SAS IDMC50-PVP50 and SAS IDMC20-
PVP80 were predominantly agglomerated rounded fines as shown in Figure 4.6C, E
and G, respectively. All the SAS co-precipitates having approximately 100µm mean
diameter.
Co-milled powders of COM IDMC60-PVP40, COM IDMC50-PVP50 and COM
IDMC20-PVP80 were predominantly multi-faceted block structures with rough
surfaces (probably due to fusion of IDMC and PVP particles) and resembled the
untreated IDMC’s structure as shown in Figure 4.6D, F and H, respectively. All the co-
milled powders have approximately 80µm mean diameter. Figure 4.6I and J shows
SAS PVP was predominantly agglomerated rounded fines and the untreated PVP was
rod-like structures, respectively. Therefore, it was demonstrated that by varying the
IDMC to PVP weight ratios, the morphologies of untreated IDMC and PVP can be
modified using the SAS process.
Figure 4.5 Images of freshly processed SAS and COM samples (A) SAS IDMC; (B) SAS IDMC-PVP co-precipitates with 50 wt% of PVP; (C) SAS IDMC-PVP co-precipitates with 80 wt% of PVP; (D) COM IDMC-PVP with 50 wt.% of PVP in the presence of milling balls
Chapter 4
68
Figure 4.6 SEM images of SAS and COM processed samples (A) Untreated IDMC; (B) SAS IDMC; (C) SAS IDMC-PVP co-precipitates with 40wt.% of PVP; (D) COM IDMC-PVP with 40wt.% of PVP; (E) SAS IDMC-PVP co-precipitates with 50wt.% of PVP; (F) COM IDMC-PVP with 50wt.% of PVP; (G) SAS IDMC-PVP co-precipitates with 80wt.% of PVP; (H) COM IDMC-PVP with 80wt.% of PVP; (I) SAS PVP; (J) Untreated PVP
4.3 Glass Transition Temperature of Co-precipitates (DSC)
DSC analysis shows the onset melting point and enthalpy of fusion of γ–IDMC were
162oC and 110J/g, respectively (similar to reported value). Figure 4.7 shows the effect
of PVP ratios on Tg of COM and SAS IDMC-PVP co-precipitates, respectively. The Tg

Chapter 4
69
of amorphous IDMC and PVP obtained in this study were 45 and 183oC, respectively.
Takahiro and Zografi [106] generated amorphous IDMC using solvent evaporation
method and reported that the Tg of amorphous IDMC was 42oC, which was similar to
our studies (Figure 4.8). A single Tg between the Tg of the pure components were
observed for all the different COM and SAS IDMC-PVPs compositions (Figure 4.7)
and suggested that a single miscible amorphous generated for all COM and SAS
IMDC co-precipitates.
The Gordon-Taylor (GT) equation [210] was employed to calculate the theoretical Tg
of the IDMC-PVP blends and to evaluate the extent of COM and SAS co-precipitates
deviation from ideal mixing by comparing the experimental Tg values with those
calculated using GT Equation (4.1) .
𝑇𝑇𝑔𝑔 = 𝑤𝑤1𝑇𝑇𝑔𝑔1+𝐾𝐾𝑤𝑤2𝑇𝑇𝑔𝑔2
𝑤𝑤1+𝐾𝐾𝑤𝑤2 (4.1)
The w1 and w2 are the weight-fractions of each component, and Tg1 and Tg2 are the
corresponding Tg values of each component. Using the free volume theory, the
constant K can be estimated by the density (ρ1 and ρ2) of both components using the
Simha-Boyer rule [211].
𝐾𝐾 ≈ 𝜌𝜌1𝑇𝑇𝑔𝑔1
𝜌𝜌2𝑇𝑇𝑔𝑔2 (4.2)
Figure 4.7 shows the experimental values and theoretical values were in good
agreement, which indicates a fairly ideal mixing between IDMC and PVP (a similarity
between IDMC-PVP interactions and IDMC-IDMC interactions). It also shows that
the Tg of both COM and SAS co-precipitates increased with the concentration of PVP.

Chapter 4
70
Figure 4.7 Tg of COM and SAS co-precipitates
Figure 4.8 DSC thermogram of amorphous IDMC
Chapter 4
71
4.4 Dissolution Rate Evaluation
All the samples used for dissolution rate tests have approximately similar mean
diameter except SAS IDMC, which has the smallest mean diameter as shown in the
SEM images in Figure 4.6. Figure 4.9 show the SAS IDMC (crystalline form) has a
higher dissolution rate as compared to the untreated IDMC (crystalline form). The
enhancement of IDMC dissolution rate using SAS IDMC sample was mainly due to
the increase of surface area and the IDMC meta-stable α-polymorph form [212]. The
dissolution rate of IDMC was significantly enhanced in amorphous SAS co-
precipitates as shown in Figure 4.9. Gong et al. [56] reported that the dissolution rate
of IDMC-PVP co-formulations using solvent-free supercritical process enhanced the
dissolution of IDMC at low concentration but an increase in PVP content could retard
the dissolution rate of IDMC. Mauro et al. [57] also reported similar results using
supercritical solvent impregnation of piroxicam on PVP at various polymer molecular
weights. Recently, Uzun et al. [163], reported that the release rate of SAS cefuroxime
acetil-PVP co-precipitates (1:1w/w) was almost 10 times slower than the untreated
drug. They also found that as the ratio of PVP increased the cefuroxime acetil release
rate also increased due to the wetting effect of PVP.
Figure 4.10 shows the dissolution rate of amorphous COM IDMC-PVPs have
significantly enhanced the dissolution rate as compared to untreated IDMC. The COM
IDMC-PVPs also have almost similar dissolution rate as the SAS IDMC-PVP co-
precipitates. The enhanced dissolution rates of IDMC are likely due to the amorphous
nature of COM IDMC-PVPs and SAS co-precipitates, increase in surface areas or
both. Lee et al. [213] has also demonstrated co-milling of felodipine with HPMC and
poloxamer improved the dissolution rate of felodipine as compared to the untreated
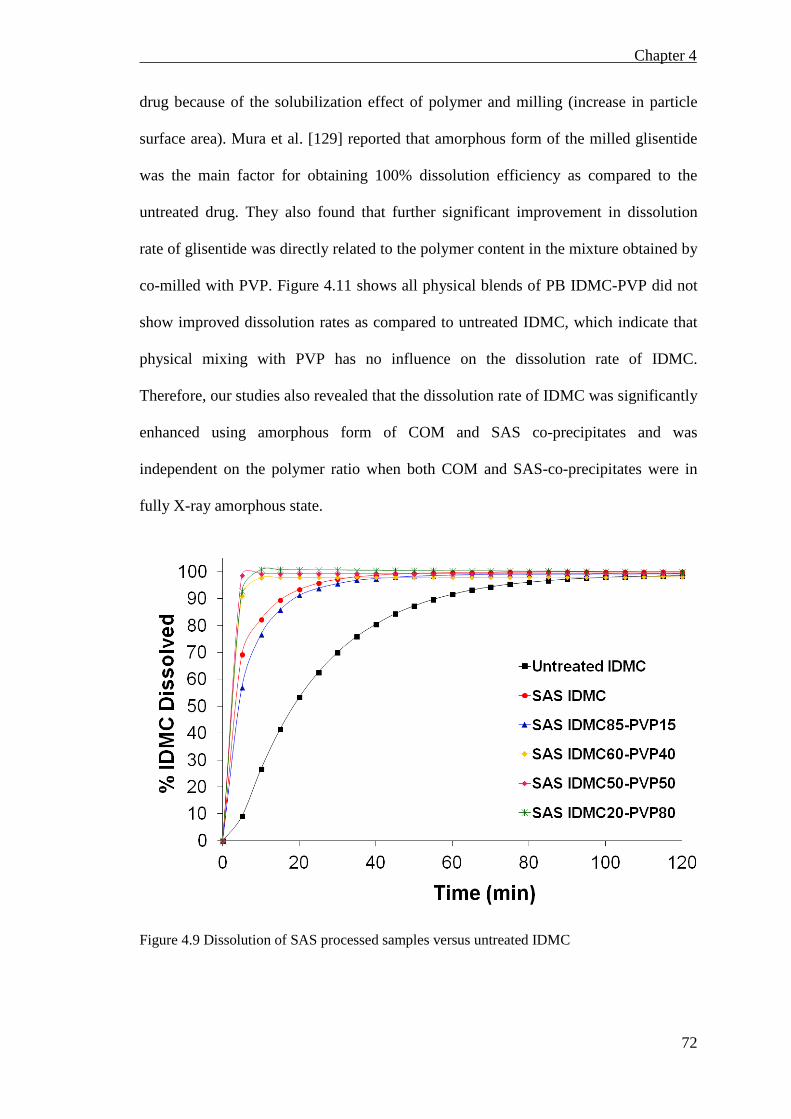
Chapter 4
72
drug because of the solubilization effect of polymer and milling (increase in particle
surface area). Mura et al. [129] reported that amorphous form of the milled glisentide
was the main factor for obtaining 100% dissolution efficiency as compared to the
untreated drug. They also found that further significant improvement in dissolution
rate of glisentide was directly related to the polymer content in the mixture obtained by
co-milled with PVP. Figure 4.11 shows all physical blends of PB IDMC-PVP did not
show improved dissolution rates as compared to untreated IDMC, which indicate that
physical mixing with PVP has no influence on the dissolution rate of IDMC.
Therefore, our studies also revealed that the dissolution rate of IDMC was significantly
enhanced using amorphous form of COM and SAS co-precipitates and was
independent on the polymer ratio when both COM and SAS-co-precipitates were in
fully X-ray amorphous state.
Figure 4.9 Dissolution of SAS processed samples versus untreated IDMC

Chapter 4
73
Figure 4.10 Dissolution of COM IDMC-PVPs versus untreated IDMC
Figure 4.11 Dissolution of physical blended versus untreated IDMC

Chapter 4
74
4.5 Accelerated Physical Stability Evaluation
The physical stability of cryo-milled IDMC, SAS co-precipitates and COM IDMC-
PVPs was evaluated under accelerated stress conditions (75RH%/40oC) based on the
International Conference on Harmonization (ICH)–ICH Q1A (R2) for more than 6
months. Figure 4.12 shows the amorphous form of cryo-milled IDMC was physically
unstable and re-crystallized to γ-IDMC after 1 day of storage at 75RH%/40oC. The
diffractograms in Figure 4.13 shows the SAS co-precipitates with PVP content more
than 40wt.% remained as stable X-ray amorphous after more than 6 months of storage,
indicating that no re-crystallization of IDMC in the PVP matrix. Recently, it was
similarly reported that the physical stability of the paclitaxel-hydroxypropyl-β-
cyclodextrin-polyoxyl 40 hydrogenated caster oil (1:20:40 weight ratio) solid
dispersions prepared by SAS remained stable after 6 months of storage at
75RH%/40oC [214].
Figure 4.12 XRDs of cryo-milled IDMC before/after storage at 75%RH/40oC

Chapter 4
75
Figure 4.13 XRDs of SAS co-precipitates before/after storage at 75%RH/40oC
A comparison between co-milled and SAS processed IDMC-PVP was shown in Figure
4.14 and Figure 4.13, respectively. The diffractograms in Figure 4.14 show all the
COM IDMC-PVPs re-crystallized from amorphous IDMC to γ-IDMC after stored at
75RH%/40oC and the re-crystallization was first observed at COM IDMC-PVP with
the least PVP content (40wt.%). In the order of ascending rate of re-crystallization,
COM IDMC60-PVP40, COM IDMC50-PVP50 and COM IDMC20-PVP80 re-
crystallized after stored for 7, 50 and 109 days at 75RH%/40oC, respectively. It was
reported that the re-crystallization of amorphous IDMC is temperature dependent and
temperatures below Tg (43-45oC) favour the formation of γ-polymorph [30, 215],
which were similarly observed in our results.

Chapter 4
76
Chieng et al. [130] performed physical characterization and stability of amorphous
IDMC and hydrochloride binary systems prepared by co-milling. It was found that
amorphous binary system with mass ratio 1:1 was stable after 30 days of storage under
dry conditions (silica gels) at 4 and 25oC. They reported that this amorphous binary
system has potential to be developed as dosage form of IDMC with a higher
dissolution rate. On another hand, no re-crystallization were observed in all SAS co-
precipitates after storage more than 6 months under same conditions, indicating SAS
co-precipitates are more physically stable than COM IDMC-PVPs. It was believed that
the re-crystallization of COM IDMC-PVPs could be due to the presence of crystalline
phase which promotes and accelerates the re-crystallization of amorphous form of
COM IDMC-PVP. This was further supported in our Raman mapping studies (see
Chapter 4.10), where γ-IDMC crystal seeds were found present in COM samples. Paes
et al. [211] reported that the re-crystallization of form I cellulose generated using ball-
milling was due to the presence of small amount of residual form I cellulose (probably
less than 5%) acting as a template for the crystallizing material. Besides that,
Shakhtshneider et al. [126] also reported that the amorphous state of IDMC generated
using cryo-milling with polymer is less stable than solvent evaporation technique
could be attributed by the presence of IDMC crystal seeds.

Chapter 4
77
Figure 4.14 XRDs of COM IDMC-PVPs before/after storage at 75%RH/40oC
Generally, the physical stability of amorphous drug prepared by milling of crystalline
solids is less stable as compared to that obtained by quenching of liquid. Fukuoka et al.
[216] reported that glassy state of IDMC generated by very slow cooling of the liquid
is stable against crystallization for 2 years, but amorphous state of IDMC generated by
milling is less stable and re-crystallized to 90% after approximately 13-15 hours [30].
The presence of PVP in SAS co-precipitates and co-milled IDMC-PVP could have
inhibited the re-crystallization of IDMC by restricting the mobility of IDMC molecules

Chapter 4
78
and presence of molecular-interaction (hydrogen bonding) between IDMC and PVP
molecules. Therefore, in the later study, the amorphous forms of COM IDMC60-
PVP40 and SAS IDMC60-PVP40 were selected to investigate the surface properties
and nature/structural relaxation because of its higher tendency to structural relaxation,
which can be induced using n-decane (vapour probe) in IGC experiments.
4.6 Moisture Sorption Isotherm (GVS)
The moisture sorption behaviour of cryo-milled IDMC, COM, SAS and PB IDMC-
PVPs were investigated using step adsorption (10 to 90%RH). As expected, no
significant moisture uptake was observed for untreated crystalline IDMC (hydrophobic
API in nature) as shown in Figure 4.15. The moisture sorption uptake of “IDMC-
milled-5min” (ball milling of IDMC for 5 minutes) increased as compared to untreated
IDMC, which could be due to the milling-induced disorder and defect on the surface of
the IDMC particles (probably generation of some amorphous surface) although its
XRD shows it was mainly still in crystalline form (inset of Figure 4.15C). This
difference was not surprising because XRD is more sensitive in detecting crystallinity
(detection limit, 1-10% of amorphous [217, 218]) and GVS is more sensitive in
detecting amorphous content (detection limit, 0.5% of amorphous [217, 219]).
The moisture sorption uptake of amorphous form IDMC generated using cryo-milling
was significant higher than its crystalline form and re-crystallization was onset at
50%RH (characterized by a sudden weight loss as shown in Figure 4.15 and Figure
4.16). The characteristic of moisture adsorption-release behaviour of amorphous
samples at certain %RH due to the moisture-induced re-crystallization is well-
documented [220, 221]. The re-crystallization of amorphous IDMC to 𝛾𝛾-IDMC was

Chapter 4
79
further evidence by XRD (measured immediately after GVS experimental) with the
presence of crystalline peaks as shown in inset of Figure 4.15A).
Figure 4.15 Moisture vapour sorption isotherms of IDMCs.

Chapter 4
80
Figure 4.16 GVS mass-plot of amorphous cryo-milled IDMC
The effect of IDMC-PVP ratios in COM and SAS co-precipitates on moisture sorption
was also studied. As indicated in Figure 4.17 and Figure 4.18 the moisture sorption
uptake of COM and SAS co-precipitates increases with PVP contents, respectively.
The moisture sorption profiles of both amorphous forms of COM and SAS co-
precipitates were almost similar and also observed that there were no moisture-induced
re-crystallization across the entire experimental %RH. XRD were also performed
immediately after GVS experimental on all the amorphous forms COM and SAS co-
precipitates and the diffraction patterns showed a halo with no crystalline peaks
indicating no re-crystallization occurred throughout the GVS experimental. Examples
Chapter 4
81
of GVS mass plot of COM and SAS co-precipitates (IDMC:PVP=60:40) were shown
in Figure 4.20 and Figure 4.21, respectively. Balani et al. [14] investigated the
moisture sorption profiles of co-milled salbutamol sulphate-PVP at different PVP
ratios. They reported that moisture sorption of co-milled salbutamol sulphate-PVP
increased with PVP ratios and observed the moisture sorption profile has an inflexion
(some extent of re-crystallization) between 50-70%RH for co-milled salbutamol
sulphate-PVP with PVP content less than 33%wt./wt. Besides that, no deliquescence of
samples were observed on all the COM and SAS co-precipitates and Figure 4.23
shows the GVS-microscopy images of COM and SAS IDMC60-PVP40 co-precipitates
at 0 and 90%RH/25oC. However, it was also noted that the proportions of moisture
sorption uptake of COM and SAS co-precipitates were not similar to its corresponding
PB IDMC-PVPs (Figure 4.19). Apparently, the PVP becoming less hygroscopic when
more IDMC is incorporated into the COM and SAS co-precipitates. The reduced
moisture sorption uptake can be considered as hydrophobization of PVP and could be
due to the additional physical-chemical effects (such as changes in surface energetics
and/or molecular interactions existed between IDMC and PVP). Hydrophobization
phenomena of PVP solid dispersions containing hydrophobic drugs which caused non-
proportional moisture sorption uptake have been reported [222, 223]. They reported
that moisture sorption uptake deviations of solid dispersion could be related to the
interactions between carrier and incorporated drug molecule. Shaun et al. [224] also
investigated the effect of moisture on PVP in accelerated stability test. They reported
that the moisture sorption isotherm of PVP shows absorption of a significant quantity
of water on exposure to elevated humidity.

Chapter 4
82
Figure 4.17 Moisture vapour sorption isotherm of COM IDMC-PVPs samples
Figure 4.18 Moisture vapour sorption isotherm of SAS IDMC-PVPs samples

Chapter 4
83
Figure 4.19 Moisture vapour sorption isotherm of PB IDMC-PVPs samples
Figure 4.20 GVS mass-plot of COM IDMC60-PVP40

Chapter 4
84
Figure 4.21 GVS mass-plot of SAS IDMC60-PVP40
Figure 4.22 GVS mass-plot of PB IDMC60-PVP40

Chapter 4
85
Figure 4.23 GVS-microscopy images of COM and SAS IDMC60-PVP40
4.7 Drug-Polymer Interactions (FTIR)
FTIR studies were conducted to further investigate the nature and extent of interactions
between drug and polymeric carrier in the solid state. In polymer blends, mixing of
two components at the molecular level will cause changes in the oscillating dipole of
the molecules. This will manifest itself as changes in the frequency and bandwidth of
interacting groups in the spectrum. Therefore, if interaction existed between the drug
and polymer, the functional groups in the FTIR spectra will show band shifts and
broadening as compared to the spectra of the pure drug and polymer [225]. Figure 4.24
shows the untreated IDMC infrared (IR) spectra was a γ polymorph as reported in the
literature [30]. The IR spectra (Figure 4.24) showed the presence of two strong bands
at 1,717 and 1,692cm-1 which corresponded to asymmetric acid C=O of a cyclic dimer
and benzoyl C=O, respectively (Figure 2.2A). As for untreated PVP, the strong
bandwidth at 1,675cm-1 was corresponded to the non-hydrogen bonded amide C=O
(Figure 2.2B). At 40wt.% of PVP and above, both of the COM IDMC-PVPs and SAS
No deliquescence of samples was observed
No deliquescence of samples was observed

Chapter 4
86
co-precipitates have a single broad peak at 1,724cm-1 which developed into a shoulder
as the concentration of PVP increases and the absorbance of PVP carbonyl dominates
the spectrum. The peak at 1,724cm-1 is assigned to the non hydrogen bonded carbonyl
stretch of an acid group of an IDMC molecule which is hydrogen bonded through the
hydroxyl group to a PVP molecule [30] (Figure 4.26B). This phenomenon was not
present in the physical blends of IDMC-PVPs IR spectra, which indicates no hydrogen
bonding between IDMC and PVP molecules (Figure 4.25).
Figure 4.24 IR spectra of COM IDMC-PVPs and SAS co-precipitates

Chapter 4
87
Figure 4.25 IR spectra of physical blended of IDMC-PVPs
Figure 4.26 (A) Dimerization of γ-IDMC; (B) Hydrogen bonding between IDMC-PVP
The IDMC molecules existed as symmetrical dimers (Figure 4.26A), where two IDMC
molecules are associated through intermolecular hydrogen bonding between their
carboxylic acid functional groups [30]. During the co-milling and SAS process, the
IDMC dimers may have been disrupted in the presence of PVP and lead to the

Chapter 4
88
hydroxyl group of carboxylic acid functional group in IDMC to form intermolecular
hydrogen bonding with PVP and increased its bond strength. The ability to inhibit
dimerization would seem to be important because such dimerization is required in the
formation of the γ–crystal nucleus, as shown from its crystal structure [226] and thus
prevents molecules from making contact with each other. As a result of such obstacle,
the desired atomic and molecular arrangements for forming a crystal lattice were
inhibited (through IDMC-PVP hydrogen bonding) and thus preventing re-
crystallization.
It is known that hydrogen bonding plays a crucial role in the stabilization of organic
structures [227]. There are many different configuration or ways hydrogen bonds can
be formed between different acceptors and donors and caused the retarded re-
crystallization of molecules due to the possibility of mismatches in hydrogen bonds
[228, 229]. Price [230] proposed an interaction model to explain the formation of a
non-crystalline state by the disruption of specific drug-drug interactions or by the
formation of specific drug-excipient interactions. He reported that the re-crystallization
of glasses network is prevented by directional bonds that inhibit the formation of long
range order. Kim and Karis [231] also proposed that hydrogen bonds act as a network
to prevent re-crystallization of sugar glasses.
Therefore, in our study the presence of PVP in the amorphous phase of COM IDMC-
PVPs and SAS co-precipitates could be stabilized by the intermolecular hydrogen
bond between IDMC and PVP and improved its physical stability against re-
crystallization. Besides that, the PVP hydrophobization phenomena shown in GVS
moisture sorption experimental was supported by IR spectra of COM IDMC-PVPs and

Chapter 4
89
SAS co-precipitates with the presence of intermolecular interactions between IDMC
and PVP molecules.
4.8 Surface Energy Properties (IGC)
4.8.1 Dispersive Energy
The dispersive energies (𝛾𝛾𝐺𝐺𝑑𝑑) of samples were determined from the IGC retention
volume of n-alkane hydrocarbon series (C7-C10). Ball milling of IDMC for 5 minutes
was also conducted as a comparison and denoted as IDMC-milled-5min. Table 4.1
shows the 𝛾𝛾𝐺𝐺𝑑𝑑 of IDMC-milled-5min, amorphous (cryo-milled IDMC) and unmilled
crystalline IDMC. In ascending order of dispersive energy, the IDMC-milled-5min
(52.0mJ/m2) has the highest dispersive energy followed by unmilled IDMC
(50.1mJ/m2) and amorphous IDMC (cryo-milled) (47.4mJ/m2). The value 𝛾𝛾𝐺𝐺𝑑𝑑 of
IDMC-milled-5min (XRD shows mainly crystalline, inset Figure 4.15C) was higher
than its crystalline form could be due to the crystal fracturing and reducing in particle
size during milling. Heng et al. [232] reported that 𝛾𝛾𝐺𝐺𝑑𝑑 of milled paracetamol to be
inversely related to the particle size. On the other hand, York et al. [233] reported that
as particle size of D, L-propranolol hydrochloride decreases during milling, the value
of 𝛾𝛾𝐺𝐺𝑑𝑑 increases until a critical point is reached where there is a plateau followed by a
small decrease for the finest powder. However, it was also noted that the amorphous
form of IDMC generated using cryo-milling has the lowest value of 𝛾𝛾𝐺𝐺𝑑𝑑 . This
phenomenon was also observed by Hadjar et al. [234, 235] where the value of the
dispersive component of the surface energy of the crystalline silica was higher than
that of the amorphous silica.

Chapter 4
90
Table 4.1 Dispersive energy of milled, amorphous and unmilled crystalline IDMC
Indomethacin (IDMC)
Crystalline
(unmilled)
Mainly crystalline
(milled-5min)
Amorphous
(cryo-milled)
𝛾𝛾𝐺𝐺𝑑𝑑 (mJ/m2) 50.1 (±1.5) 52.0 (±0.4) 47.4 (±0.3)
Table 4.2 Dispersive energy of COM and SAS IDMC60-PVP40 co-precipitates
IDMC:PVP=60:40
PVP
Amorphous
(unmilled)
PB
Partial
crystalline
COM-5min
Partial
crystalline
COM
Amorphous
𝜸𝜸𝑺𝑺𝒅𝒅 (mJ/m2)
SAS
Amorphous
38.5 (±1.5) 47.8 (±0.2) 53.2 (±0.3) 45.4 (±2.3) 42.3 (±1.9)
Table 4.2 shows the dispersive energies of PB IDMC60-PVP40 (as a control), COM
IDMC60-PVP40 and SAS IDMC60-PVP40. As a comparison, ball-milling of COM
IDMC60-PVP40 for 5 minutes was also conducted and denoted as “COM-5min”.
Similarly, it was noted that 𝛾𝛾𝐺𝐺𝑑𝑑 of COM-5min (53.2mJ/m2) was higher than its physical
blended mixtures (47.8mJ/m2). Again the same observations were also obtained for
𝛾𝛾𝐺𝐺𝑑𝑑of both amorphous forms co-precipitates (SAS IDMC60-PVP40 (42.3mJ/m2) and
COM IDMC60-PVP40 (45.4mJ/m2)) were lower than 𝛾𝛾𝐺𝐺𝑑𝑑 of PB IDMC60-PVP40
(47.8mJ/m2). Grimsey et al. [236] compared the surface energetic properties of
unprocessed poly(l-latide) microparticles (PLLA) with particles generated from spray
drying and solution enhanced dispersion with supercritical fluids (SEDS) process. The
SEDS process generated the lowest dispersive energy (34.5mJ/m2) of PLLA, while the
spray dried amorphous PLLA (35.7mJ/m2) has a lower dispersive energy as compared
to the unprocessed semi-crystalline PPLA (36.6mJ/m2). They concluded that
processing methods used to generate PLLA particles has a significant effect on the

Chapter 4
91
crystallinity and specific component of the surface free energy of the resulting powder,
with material prepared by SEDS having significantly lower surface free energy.
Newell et al. [196] also reported that dispersive energy of spray dried amorphous
forms of lactose (37.1mJ/m2) was lower as compared to the milled lactose (0.7%
amorphous) (41.6mJ/m2). They suggested different processing methods could generate
particles with different orientations and spacing between the surface molecules and
thus giving rise to the different energy states.
From a thermodynamic standpoint, the crystalline and amorphous forms of IDMC are
the most and least stable, respectively. A possible explanation to this phenomenon
could be due to the amorphous nature of material in possessing the highest free energy
and degree of molecular mobility. Besides that, the disorder in the amorphous material
is co-operative in nature. Therefore, with the combination of high molecular mobility
and co-operative of amorphous form has enabled the molecules in the bulk of the
amorphous phase to re-orientate/re-arrangement in order to minimize the energy of its
surface. Although not completely the same, this phenomenon is mimic the ability of a
liquid to minimize its interfacial energy. Recently, Chamarthy et al. [237] reported that
amorphous forms of both griseofulvin and felodipine generated using melt-quench
cooling have lower 𝛾𝛾𝐺𝐺𝑑𝑑 than its crystalline forms. On the other hand, crystal
defects/fractures caused during milling do not exhibit the co-operative re-arrangement
as of the amorphous form. Therefore, there is no co-operative molecular re-
arrangement to minimize the activated surface energy. In this study, although the
surface energy of amorphous form was more lower as compared to its crystalline form
but it still follows the thermodynamic stability where in rank order of stability,
crystalline > milled (mainly crystalline) > amorphous. Therefore, in this study it was

Chapter 4
92
demonstrated that the potential of IGC to detect and quantify differences in surface
energetic of powder samples before/after micronization as well as the different
processing methods which is importance for secondary processing such as powder
flow-ability.
4.8.2 Specific Polar Energy
The specific polar component free energy of adsorption (−∆𝐺𝐺𝐺𝐺𝐺𝐺0 ) of each different
vapour polar probes (acetone, ethyl acetate and 2-propanol) was determined from the
difference between the (RT ∙ ln(VR)) values obtained and the n-alkane reference line
(dispersive line). Table 4.3 shows the −∆GSP0 of unmilled crystalline, milled (5mins)
and amorphous IDMC. Ethyl acetate and 2-propanol were used to probe the acidic and
basic nature of sample surfaces, respectively. Overall the surfaces of crystalline,
IDMC-milled-5min and amorphous IDMC were in acidic nature due to the high
interaction with ethyl acetate and weak interaction with 2-propanol.
Table 4.3 ∆𝐺𝐺𝐺𝐺𝐺𝐺0 of milled, amorphous and unmilled crystalline IDMC
−∆𝐺𝐺𝐺𝐺𝐺𝐺0 (kJ/mol)
Indomethacin
Crystalline
(unmilled)
Mainly crystalline
(milled-5min)
Amorphous
(cryo-milled)
Acetone (amphoteric) 6.2 (±0.4) 6.6 (±0.1) 4.2 (±0.1)
Ethyl Acetate (basic) 8.7 (±0.1) 9.3 (±0.1) 8.5 (±0.1)
2-propanol (acidic) 4.4 (±0.1) 4.7 (±0.1) 4.2 (±0.1)
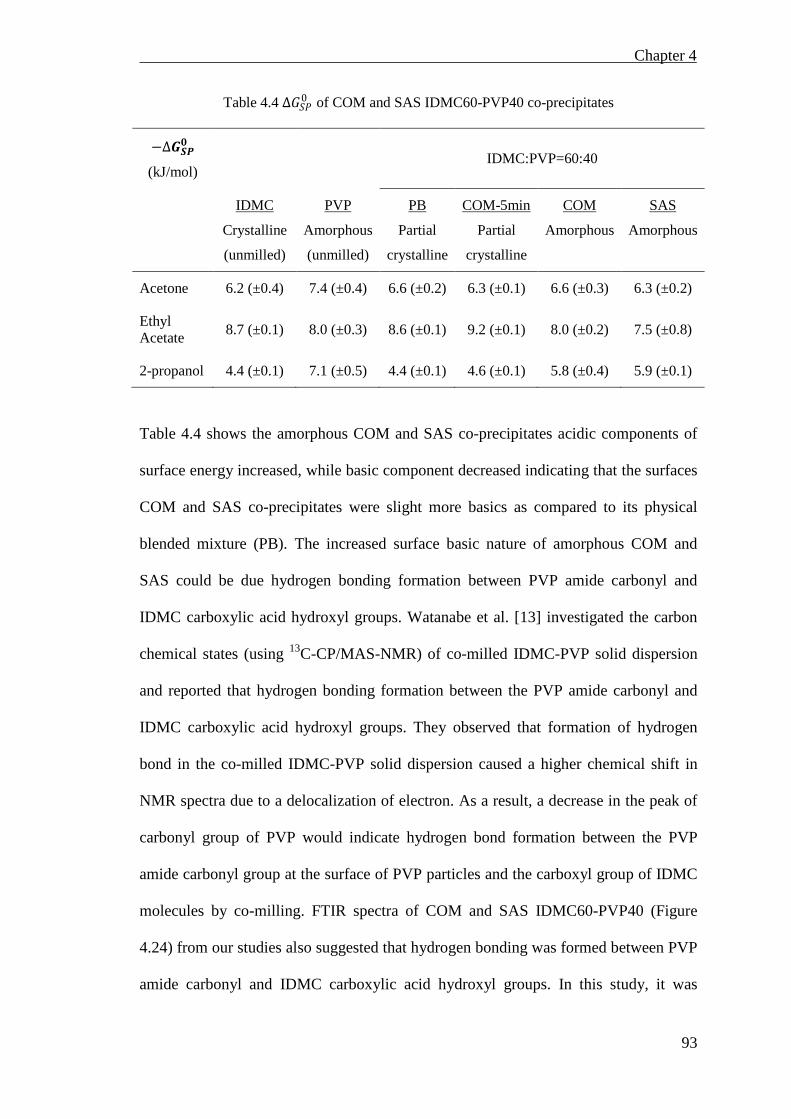
Chapter 4
93
Table 4.4 ∆𝐺𝐺𝐺𝐺𝐺𝐺0 of COM and SAS IDMC60-PVP40 co-precipitates
−∆𝑮𝑮𝑺𝑺𝑺𝑺𝟎𝟎 (kJ/mol)
IDMC:PVP=60:40
IDMC
Crystalline
(unmilled)
PVP
Amorphous
(unmilled)
PB
Partial
crystalline
COM-5min
Partial
crystalline
COM
Amorphous
Acetone
SAS
Amorphous
6.2 (±0.4) 7.4 (±0.4) 6.6 (±0.2) 6.3 (±0.1) 6.6 (±0.3) 6.3 (±0.2)
Ethyl Acetate 8.7 (±0.1) 8.0 (±0.3) 8.6 (±0.1) 9.2 (±0.1) 8.0 (±0.2) 7.5 (±0.8)
2-propanol 4.4 (±0.1) 7.1 (±0.5) 4.4 (±0.1) 4.6 (±0.1) 5.8 (±0.4) 5.9 (±0.1)
Table 4.4 shows the amorphous COM and SAS co-precipitates acidic components of
surface energy increased, while basic component decreased indicating that the surfaces
COM and SAS co-precipitates were slight more basics as compared to its physical
blended mixture (PB). The increased surface basic nature of amorphous COM and
SAS could be due hydrogen bonding formation between PVP amide carbonyl and
IDMC carboxylic acid hydroxyl groups. Watanabe et al. [13] investigated the carbon
chemical states (using 13C-CP/MAS-NMR) of co-milled IDMC-PVP solid dispersion
and reported that hydrogen bonding formation between the PVP amide carbonyl and
IDMC carboxylic acid hydroxyl groups. They observed that formation of hydrogen
bond in the co-milled IDMC-PVP solid dispersion caused a higher chemical shift in
NMR spectra due to a delocalization of electron. As a result, a decrease in the peak of
carbonyl group of PVP would indicate hydrogen bond formation between the PVP
amide carbonyl group at the surface of PVP particles and the carboxyl group of IDMC
molecules by co-milling. FTIR spectra of COM and SAS IDMC60-PVP40 (Figure
4.24) from our studies also suggested that hydrogen bonding was formed between PVP
amide carbonyl and IDMC carboxylic acid hydroxyl groups. In this study, it was

Chapter 4
94
demonstrated that IGC technique was practically useful to characterize the surface
energetic of powdered materials and also provided important relations for
understanding how the surface of materials change as they are being processed, and
how these changes affect material behaviour.
4.9 Surface Structural Relaxation (IGC)
Kawakami and Pikal [238] and Liu et al. [239] reported that structural relaxation might
be related to the loss of energy during aging. Recently, Hasegawa et al. [64]
demonstrated that surface energy of an amorphous system decreased during aging
using IGC. They also reported that decreased of surface energy was related to
structural relaxation. Therefore, in this study, a similar method applied by Hasegawa et
al. [64] was used to determine the relaxation profile of COM and SAS IDMC60-
PVP40 co-precipitates using n-decane (C10) as the probe because of its longer retention
time (higher sensitivity and interaction with solid surface). Three different batches
were used for the each measurement and Figure 4.27 and Figure 4.28 show one of the
batches relaxation profiles of COM and SAS IDMC60-PVP40 co-precipitates as a
function of aging time, respectively. The retention volumes (VR) of both COM and
SAS IDMC60-PVP40 decreased drastically in the first 10 hours and then decreased at
a slower rate until it reached plateau. However, there was a slight difference between
the absolute VR measured for each batch, which may be due to the difference in the
surface area and/or the morphology. Nonetheless, similar trend of relaxation profiles
were obtained. As a control, the relaxation profile of unmilled IDMC (crystalline) was
also measured and no significant decrease in VR was observed as shown in Figure
4.29. XRD were also conducted on the COM and SAS IDMC60-PVP40 co-
precipitates that were treated with n-decane using IGC. Both samples have diffraction

Chapter 4
95
patterns with a halo and no crystalline peaks indicating no re-crystallization occurred
throughout the IGC aging experiments. Therefore, the changes of VR were due to the
structural relaxation of amorphous form of both COM and SAS IDMC60-PVP40.
Figure 4.27 Aging time of COM IDMC60-PVP40 versus change of VR (C10) at 50oC
Figure 4.28 Aging time of SAS IDMC60-PVP40 versus change of VR (C10) at 50oC

Chapter 4
96
Figure 4.29 Aging time of unmilled IDMC versus change of VR (C10) at 50oC
KWW equation was used to fit the relaxation profile of samples and Table 4.5 shows
the structural relaxation parameters of COM and SAS IDMC60-PVP40. Kawakami
and Pikal [238] suggested to employ the use of 𝜏𝜏𝛽𝛽 as an appropriate parameter to
compare amorphous forms. The 𝜏𝜏𝛽𝛽 of SAS IDMC60-PVP40 (4.4) was higher than
COM IDMC60-PVP40 (3.6) indicating that surface structural relaxation of COM
IDMC60-PVP40 was faster than SAS IDMC60-PVP40. Besides that, the 𝛽𝛽 value of
COM (0.41) was lower than SAS IDMC60-PVP40 (0.55) indicating that the SAS co-
precipitate has a more homogenous distribution of relaxation than COM samples.
Therefore, in this study it was demonstrated that the amorphous form samples
generated from different processing methods have different surface structural
relaxations. This result also supported the XRD showing that SAS co-precipitate was
more physically stable than COM sample. It also demonstrated that IGC can be used to
distinguish different amorphous forms processed by SAS and COM methods which

Chapter 4
97
were not able to be distinguished by XRD and GVS. Moreover, it can be used to detect
the structural relaxation at the surface of amorphous samples.
Table 4.5 Surface structural relaxation parameters of COM and SAS IDMC60-PVP40
Samples 𝜏𝜏(ℎ) 𝛽𝛽 𝜏𝜏𝛽𝛽
COM IDMC60-PVP40 (Amorphous) 22.7 (± 2.7) 0.41 (± 0.03) 3.6
SAS IDMC60-PVP40 (Amorphous) 14.7 (± 4.4) 0.55 (± 0.02) 4.4
4.10 Raman Mapping (RM)
The collected Raman mapping data of COM IDMC60-PVP40 sample were pre-
processed and analyzed using the BTEM method. Three spectra were extracted from
COM sample via BTEM and were compared to the pure component reference spectra
of PVP, amorphous IDMC, and crystalline γ-IDMC as shown in Figure 4.30.
Figure 4.30 Pure component reference spectra of PVP, amorphous and γ-IDMC Figure 4.31A shows the extracted spectra of three pure components were similar to its
pure component reference spectra (PVP and both amorphous and crystalline γ-IDMC).
Furthermore, the spatial distributions of these three components were generated by

Chapter 4
98
projecting the extracted pure component spectra onto the measured Raman mapping
data as shown in Figure 4.31B. The spatial distribution of COM sample shows that
PVP and amorphous IDMC were almost well distributed on the mapped areas with
5µm resolution. However, it was also noted that in some mapping area there were
presence of crystalline γ-IDMC seeds, which may act as the precursor for re-
crystallization of COM samples. Moreover, the γ-IDMC crystalline seeds were not
well-distributed and only can be found in some random locations. The Raman mapping
results of COM sample also further supported the characterization results obtained
from XRD which show COM samples re-crystallized after storage at 40oC/75%RH.
Although, co-milling of γ-IDMC with PVP has generally improved the physical
stability of amorphous IDMC, however, the re-crystallization was still likely to happen
upon storage due to the presence of crystalline γ-IDMC seeds in the COM sample.
Similarly, the collected Raman mapping data of SAS IDMC60-PVP40 sample were
pre-processed via BTEM method. The BTEM analysis of SAS sample was not able to
extract its pure components and only resulted in the reconstruction of single
component spectrum as shown in Figure 4.32A. The extracted spectrum exhibited a
combination of Raman peaks of PVP and amorphous IDMC, which show a high
resemblance to Raman peaks of PVP and amorphous IDMC pure component
references. This result suggested that there was co-linearity composition between PVP
and amorphous IDMC (having homogeneous distribution of PVP and amorphous
IDMC component in SAS sample). This was also evidence in the generated spatial
distribution of SAS sample showing a homogeneous distribution of PVP and
amorphous IDMC components in the mapped areas with 5µm resolution as shown in
Figure 4.32B. In addition, no crystalline γ-IDMC seed was observed in SAS sample.
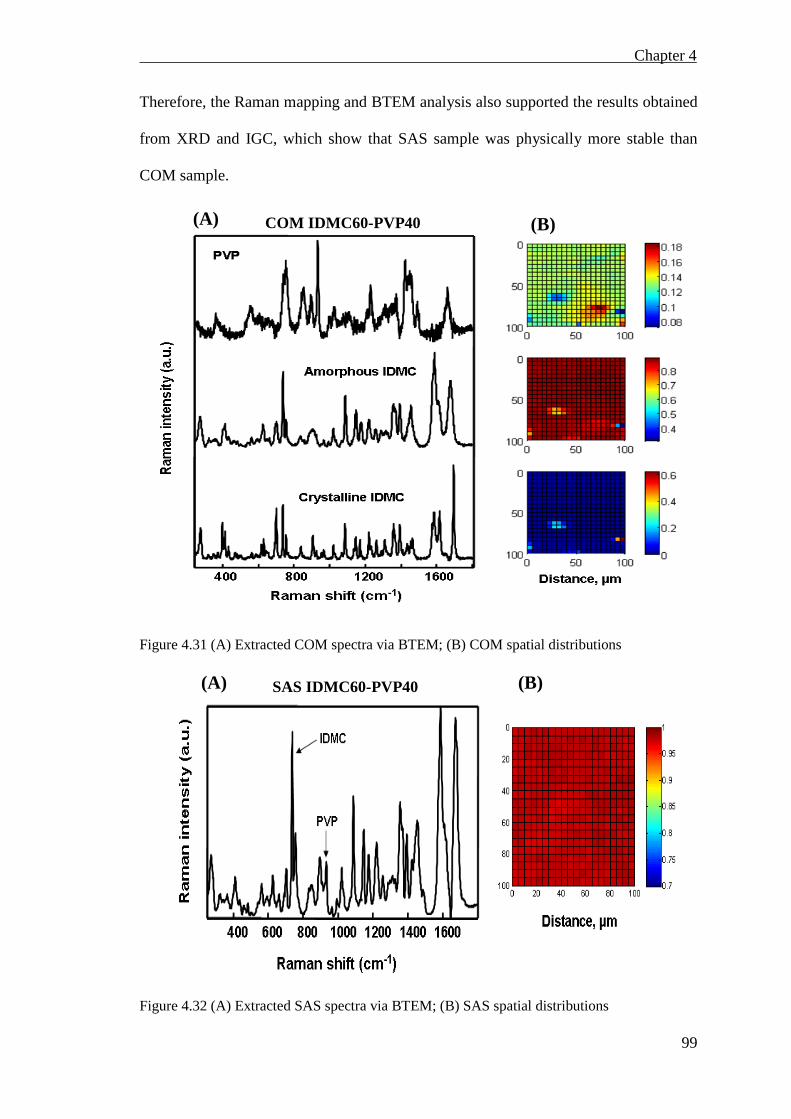
Chapter 4
99
Therefore, the Raman mapping and BTEM analysis also supported the results obtained
from XRD and IGC, which show that SAS sample was physically more stable than
COM sample.
Figure 4.31 (A) Extracted COM spectra via BTEM; (B) COM spatial distributions
Figure 4.32 (A) Extracted SAS spectra via BTEM; (B) SAS spatial distributions
(A) (B)
(A) (B) COM IDMC60-PVP40
SAS IDMC60-PVP40

Chapter 4
100
4.11 Drug Content in COM and SAS Co-precipitates (TGA)
Figure 4.33A and E shows the untreated PVP and SAS IDMC started to decompose at
approximately 380oC and 220oC (which is similar to the reported value [200]),
respectively. The thermograms also show the composition of both co-milled powders
(COM IDMC60-PVP40, COM IDMC50-PVP50 and COM IDMC20-PVP80) and SAS
co-precipitates (SAS IDMC60-PVP40, SAS IDMC50-PVP50 and SAS IDMC20-
PVP80) were similar to the experimental feed composition, which indicate that the co-
milling and SAS co-precipitating process were well controlled. As a control, respective
physical blends of PB IDMC-PVPs were also analyzed (Figure 4.34) and their
thermograms also superimposed on COM IDMC-PVPs and SAS co-precipitates,
which provide further evidence that COM IDMC-PVPs and SAS co-precipitates have
similar compositions to the experimental feed compositions.

Chapter 4
101
Figure 4.33 Thermograms of untreated IDMC, PVP, COM and SAS samples
Figure 4.34 Thermograms of SAS co-precipitates and PB (IDMC:PVP=50:50)

Chapter 4
102
4.12 Residual Solvents in SAS Processed Samples (GC)
Based on the ICH Q3C (R4) guideline for residual solvents content in pharmaceutical
products, dichloromethane (DCM) and acetone (AC) are classified as Class II and
Class III solvents, respectively. The objective of this guideline is to recommend
acceptable amounts of residual solvents in pharmaceuticals for the safety of the patient.
According to the guideline, Class II solvents are associated with less severe toxicity
and should be limited in order to protect patients from potential adverse effects. The
concentration limit for DCM in pharmaceutical products is 600 ppm. Class III covers
less toxic solvents, which are of lower risk to human health. The concentration limit
for AC is less than 5,000 ppm. GC-FID was used to measure the residual solvents
content in SAS processed samples. Figure 4.35 shows the calibration curves obtained
from GC analysis of acetone and dichloromethane. Table 4.6 shows the content of
residual solvents in SAS processed samples. The results show that AC was not
detectable in all SAS processed samples. Besides that, the concentrations of DCM
were less than 50 ppm in all the SAS processed samples, which is way below the ICH
acceptable limit. Similarly, Bleich and Mueller [166] employed SCF anti-solvent
process to generate drug loaded particles (IDMC-PLA) and the DCM residual solvents
in the co-precipitates were less than 30 ppm. Therefore, SAS process could be a useful
method for preparing drug delivery systems with low content of residual solvents.
Moreover, the SAS washing process step (after particle formation) is very efficient in
extracting residual solvents [166].

Chapter 4
103
Figure 4.35 GC calibration curves for (A) Acetone; (B) Dichloromethane
Table 4.6 Residual solvents content in SAS processed samples
Sample Acetone content (ppm) Dichloromethane content (ppm)
SAS IDMC ND 50
SAS IDMC85-PVP15 ND 48
SAS IDMC60-PVP40 ND 46
SAS IDMC50-PVP50 ND 44
SAS IDMC20-PVP80 ND 45
SAS PVP ND 48 ND: Not detectable (Detection limit is 5 ppm)

Chapter 5
104
5. Conclusions
Our results revealed that it is technically feasible to generate X-ray amorphous IDMC-
PVP with minimum of 40wt.% PVP using co-milling and SAS co-precipitation. The
morphology of the SAS co-precipitates can be modified by varying the drug to
polymer ratio but not using co-milling. Amorphous forms of IDMC produced by COM
and SAS have significantly improved the dissolution as compared to the crystalline
form and its physical blends, respectively.
Amorphous pure form of IDMC generated using cryo-milling was physically unstable
and re-crystallized to γ-IDMC after one day of storage at 75%RH/40oC. The use of
crystallization inhibitors such as PVP to generate a single-phase amorphous mixture
with PVP using co-milling and SAS co-precipitation have improved the physical
stability of the amorphous form of IDMC. However, COM IDMC-PVP samples with
PVP contents less than 50wt.% re-crystallized after 7 days of storage at 75%RH/40oC.
On another hand, no re-crystallization were observed in all SAS co-precipitates after
storage more than 6 months under same conditions, which indicate SAS co-precipitates
are more physically stable than COM IDMC-PVPs. The measured Tg values as a
function of mixture composition were comparable to the ideal Gordon-Taylor equation
for COM and SAS co-precipitates, which suggested ideal mixing between IDMC and
PVP.
GVS results show that hydrophobization of PVP phenomena were observed for both
COM and SAS co-precipitates due to the changes in surfaces energetic and/or
formation of molecular interaction between IDMC and PVP. FTIR spectra suggested
the presence of hydrogen bonding formed due to interactions of amide carbonyl groups
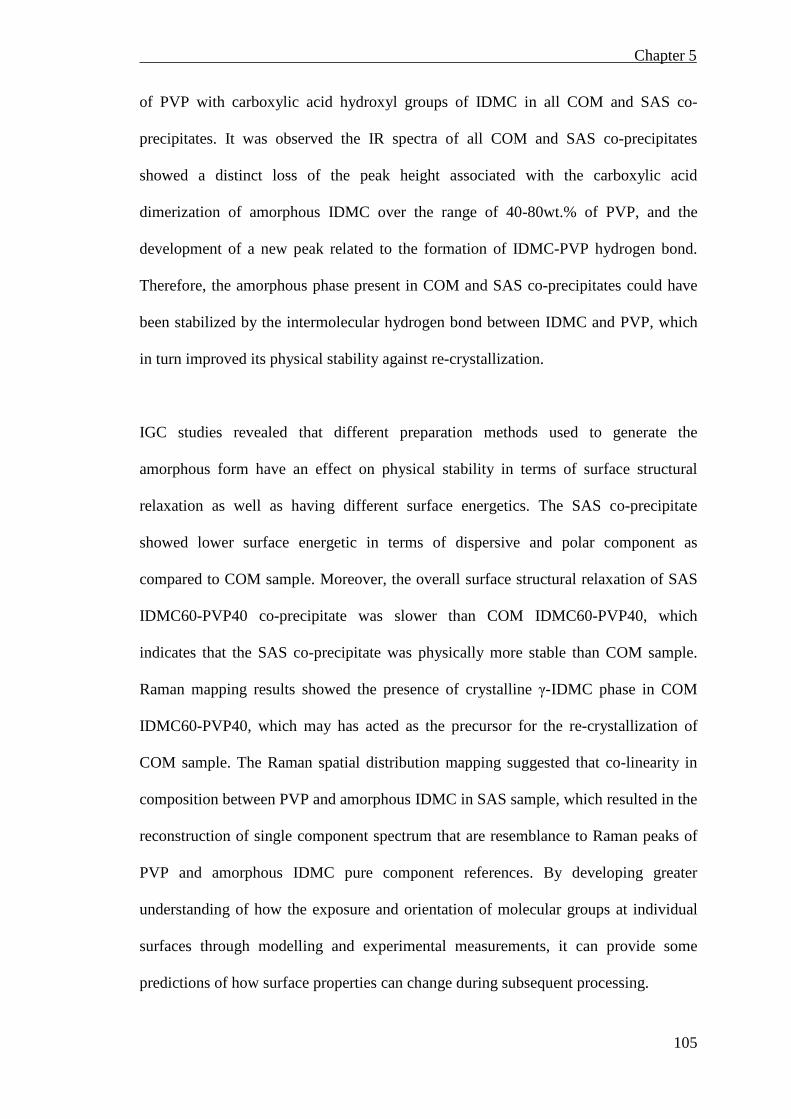
Chapter 5
105
of PVP with carboxylic acid hydroxyl groups of IDMC in all COM and SAS co-
precipitates. It was observed the IR spectra of all COM and SAS co-precipitates
showed a distinct loss of the peak height associated with the carboxylic acid
dimerization of amorphous IDMC over the range of 40-80wt.% of PVP, and the
development of a new peak related to the formation of IDMC-PVP hydrogen bond.
Therefore, the amorphous phase present in COM and SAS co-precipitates could have
been stabilized by the intermolecular hydrogen bond between IDMC and PVP, which
in turn improved its physical stability against re-crystallization.
IGC studies revealed that different preparation methods used to generate the
amorphous form have an effect on physical stability in terms of surface structural
relaxation as well as having different surface energetics. The SAS co-precipitate
showed lower surface energetic in terms of dispersive and polar component as
compared to COM sample. Moreover, the overall surface structural relaxation of SAS
IDMC60-PVP40 co-precipitate was slower than COM IDMC60-PVP40, which
indicates that the SAS co-precipitate was physically more stable than COM sample.
Raman mapping results showed the presence of crystalline γ-IDMC phase in COM
IDMC60-PVP40, which may has acted as the precursor for the re-crystallization of
COM sample. The Raman spatial distribution mapping suggested that co-linearity in
composition between PVP and amorphous IDMC in SAS sample, which resulted in the
reconstruction of single component spectrum that are resemblance to Raman peaks of
PVP and amorphous IDMC pure component references. By developing greater
understanding of how the exposure and orientation of molecular groups at individual
surfaces through modelling and experimental measurements, it can provide some
predictions of how surface properties can change during subsequent processing.

Chapter 5
106
The compositions of both COM IDMC-PVPs and SAS co-precipitates were close to
the respective feed compositions, which indicate that both processes can be well
controlled. GC analysis shows that residual solvents content in all the SAS processed
samples were way below the acceptable maximum limit based on the International
Conference of Harmonization (ICH) guidelines.
Finally, this work has demonstrated the potential of using a suitable “amorphous
inducing and stabilizing” agent as a co-precipitant for a poorly water-soluble drug such
as IDMC to improve the bioavailability using SAS process. The co-precipitant used in
this work such as PVP to generate amorphous IDMC-PVP co-precipitates using co-
milling and SAS process showed improved physical stability (through hydrogen
bonding formation between IDMC and PVP) as compared to amorphous IDMC.
Furthermore, this study could provide a practical reference in helping to evaluate other
co-precipitants. The amorphous forms of SAS IDMC-PVP co-precipitates have
increased the dissolution efficiency of IDMC at 5 minutes (DE5%) to about 9-times as
compared to its crystalline form The use of KWW equation in IGC analysis may has
provided some useful insights on the amorphous surface structural relaxation prepared
using COM and SAS processes, which could be related to a faster re-crystallization at
the surface due to higher surface molecular mobility as compared to the bulk. It could
also provide some practical insights into the physical stability of pharmaceutical drug-
polymer formulations.

Chapter 6
107
6. Future Recommendation Work
Most of the research work presented in this thesis was related to the effect of polymer
to drug ratios on the crystallinity or amorphous character of crystalline IDMC for
dissolution enhancement as well as modifying its physicochemical properties using co-
milling and SAS co-precipitation process. This work has demonstrated the potential of
using a suitable “amorphous inducing and stabilizing” agent as a co-precipitant for a
poorly water-soluble drug such as IDMC to improve the bioavailability using SAS
process. Our results revealed that it is technically feasible to generate X-ray amorphous
IDMC-PVP with minimum of 40wt.% PVP using co-milling and SAS co-precipitation.
Improvements can be made by investigating other processing conditions and
experimental parameters. Below are some of the recommendations for future research
work.
I. To further understand the amorphous nature/phase separation kinetics
of amorphous COM and SAS co-precipitates powder
(IDMC:PVP=60:40), thermal analysis (DSC) could be conducted to
determine the Tg of SAS amorphous molecular dispersions stored under
accelerated storage condition (75%RH and 40oC) and monitored
throughout the studies. The measurement of the drug phase separation
from the solid dispersion could provide a reliable estimate for the
kinetics of physical instability. The kinetics of drug phase separation
could be determined by monitoring the changes in Tg of drug-polymer
miscible phase. The time-dependent changes Tg values could be used to
calculate the fraction of the drug phase separated using 1st order rate
equation such as Kolmogorov-Johnson-Mehl-Avrami (KJMA),

Chapter 6
108
II. To study the effect of different molecular weight of PVP on the
crystallinity or amorphous character of crystalline IDMC for dissolution
enhancement as well as modifying its physicochemical properties using
co-milling and SAS co-precipitation process,
III. Another commonly particle/powder formation process such spray-
drying could be employed to co-spray drying IDMC with PVP. The
effect of polymer to drug ratios on the crystallinity or amorphous
character of crystalline IDMC for dissolution enhancement as well as
modifying its physicochemical properties using co-spray drying process
could be studied and compared to co-milling and SAS co-precipitation
process in this study,
IV. To evaluate other co-precipitants to co-precipitate with IDMC, such as
Eudragit, PEG, PVP-VA and other water-soluble polymers using SAS
process to generate solid dispersion,
V. To evaluate other actives (poorly water-soluble APIs) to co-precipitate
with PVP using SAS process to generate solid dispersion and/or
VI. To study the effect of SAS co-precipitation processing conditions such
as pressure, temperature and/or Sc-CO2 flow-rate on SAS co-
precipitates physicochemical properties.

References
109
REFERENCES
[1] Roberts, C. J.; Debenedetti, P. G., Engineering pharmaceutical stability with amorphous solids. AlChE J. 2002, 48, 1140-1144.
[2] Lipinski, C. A., Avoiding investment in doomed drugs, is poor solubility an industry wide problem? Curr. Drug Dis. 2001, 4, 17-19.
[3] Ford, J. L., The current status of solid dispersions. Pharm. Acta Helv. 1986, 61, 69-88.
[4] Hancock, B. C.; Zografi, G., Characteristics and significance of the amorphous state in pharmaceutical systems. J. Pharm. Sci. 1997, 86, 1-12.
[5] Martin, A., Physical Pharmacy. 4th ed.; Lea and Febiger: Philadelphia, 1993.
[6] Yu, L., Amorphous pharmaceutical solids: preparation, characterization and stabilization. Adv. Drug Deliv. Rev. 2001, 48 27-42.
[7] Florence, A. T.; Attwood, D., Physicochemical Principles of Pharmacy. 4th ed.; Pharmaceutical Press: 2006.
[8] Hancock, B. C.; Parks, M., What is the true solubility advantage for amorphous pharmaceuticals. Pharm. Res. 2000, 17, 397-404.
[9] Chadha, R.; Kashid, N.; Jain, D. V. S., Characterization and quantification of amorphous content in some selected parenteral cephalosporins by calorinetric method. J. Therm. Anal. Calorim. 2005, 81, 277-284.
[10] Craig, D. Q. M.; Royall, P. G.; Kett, V. L.; Hopton, M. L., The relevance of the amorphous state to pharmaceutical dosage forms: Glassy drugs and freeze dried systems. Int. J. Pharm. 1999, 179, 179-207.
[11] Pokharkar, V. B.; Mandpe, L. P.; Padamwar, M. N.; Ambike, A. A.; Mahadik, K. R.; Paradkar, A., Development, charaterization and stabilization of amorphous form of a low Tg drug. Powder Technol. 2006, 167, 20-25.
[12] Bhugra, C.; Pikal, M. J., Role of thermodynamic, molecular and kinetic factors in crystallization from the amorphous state. J. Pharm. Sci. 2008, 97, 1329-1349.
[13] Watanabe, T.; Hasegawa, S.; Wakiyama, N.; Kusai, A.; Senna, M., Comparison between polyvinylpyrrolidone and silica nanopariticles as carriers for indomethacin in a solid state dispersion. Int. J. Pharm. 2003, 250, 283-286.

References
110
[14] Balani, P. N.; Wong, S. Y.; Ng, W. K.; Tan, R. B. H.; Chan, S. Y., Influence of polymer content on stabilizing milled amorphous salbutamol sulphate. Int. J. Pharm. 2010, 391, 125-136.
[15] Lim, R. T. Y.; Ng, W. K.; Tan, R. B. H., Amorphization of pharmaceutical compound by co-precipitation using supercritical anti-solvent (SAS) process (Part I). J. Supercrit. Fluids 2010, 53, 179-184.
[16] Takeuchi, H.; Nagira, S.; Yamamoto, H.; Kawashima, Y., Solid dispersion particles of tolbutamide prepared by fine silica particles by spray dried method. Powder Technol. 2004, 141, 187-195.
[17] Yang, K. Y.; Glemza, R.; Jarowski, C. I., Effects of amorphous silicon dioxides on drug dissolution. J. Pharm. Sci. 1979, 68, 560-565.
[18] Bahl, D.; Bogner, R. H., Amorphization of indomethacin by co-grinding with neusilin US2: Amorphization kinetics, physical stability and mechanism. Pharm. Res. 2006, 23, 2317-2325.
[19] Bahl, D.; Hudak, J.; Bogner, R. H., Comparison of the ability of various pharmaceutical silicates to amorphize and enhance dissolution of indomethacin upon co-grinding. Pharm. Dev. Technol. 2008, 13, 255-269.
[20] Yusuke, S.; Makiko, F.; Yuka, S.; Ryusuke, Y.; Shinji, F.; Sayaka, N.; Yuya, M.; Naoya, K.; Masaki, Y.; Kiyohisa, O.; Yoshiteru, W., The preparation of solid dispersion powder of indomethacin with crospovidone using a twin-screw extruder or kneader. Int. J. Pharm. 2009, 365, 53-60.
[21] Breitenbach, J., Melt extrusion: from process to drug delivery technology. Eur. J. Pharm. Biopharm. 2002, 54, 107-117.
[22] Yonemochi, E.; Kitahara, S.; Maeda, S.; Yamamura, S.; Oguchi, T.; Yamamoto, K., Physicochemical properties of amorphous clarithromycin obtained by grinding and spray drying. Eur. J. Pharm. Sci. 1999, 7, 331-338.
[23] Usui, F.; Ikeda, M.; Isobe, T.; Senna, M., Stability of amorphous indomethacin compounded with silica. Int. J. Pharm. 2001, 226, 81-91.
[24] Majerik, V.; Horv'ath, G.; Charbit, G.; Badens, E.; Szokonya, L.; Bosc, N.; Teillaud, E., Novel particle engineering techniques in drug delivery: review of formulations using supercritical fluids and liquefied gases. Hung. J. Ind. Chem. 2004, 32, 41-56.
[25] Majerik, V.; Charbit, G.; Badens, E.; Horv'ath, G., Bioavailability enhancement of an active substance by supercritical antisolvent precipitation. J. Supercrit. Fluids 2007, 40, 101-110.

References
111
[26] Fages, J.; Lochard, H.; Letourneau, J. J.; Sauceau, M.; Rodier, E., Particle generation for pharmaceutical applications using supercritical fluid technology. Powder Technol. 2004, 141, 219-226.
[27] Jung, J.; Perrut, M., Particle design using supercritical fluids: literature and patent survey. J. Supercrit. Fluids 2001, 20, 179-219.
[28] Al Shaal, L.; Müller, R. H.; R, S., SmartCrystal combination technology - Scale up from lab to pilot scale and long term stability. Pharmazie 2010, 65, 877-884.
[29] Stein, J.; Fuchs, T.; Mattern, C., Advanced milling and containment technologies for superfine active pharmaceutical ingredients. Chem. Eng. Technol. 2010, 33, 1464-1470.
[30] Crowley, K. J.; Zografi, G., Cryogenic milling of indomethacin polymorphs and solvates: Assesment of amorphous phase formation and amorphous phase physical stability. J. Pharm. Sci. 2002, 91, 492-507.
[31] Shaktshneider, T. P., Phase transformations and stabilization of metastable states of molecular crystals under mechanical activation. Solid State Ionics 1997, 101-103, 851-856.
[32] Dudognon, E.; Willart, J. F.; Caron, V.; Capet, F.; Larsson, T.; Decamps, M., Formations of budesonide/alpha-lactose glass solutions by ball-milling. Solid State Commun. 2006, 138, 68-71.
[33] Font, J.; Muntasell, J.; Cesari, E., Amorphization of organic compounds by ball-milling. Mater. Res. Bull. 1997, 32, 1691-1696.
[34] Bailey, A. G., Electrostatic phenomena during powder handling. Powder Technol. 1984, 37, 71-85.
[35] Atkinson, M. B. J.; Bucar, D. K.; Sokolov, A. N.; Friscic, T.; Robinson, C. N.; Bilal, M. Y.; Sinada, N. G.; Chevannes, A.; MacGillivray, L. R., General application of mechanochemistry to templated solid-state reactivity: rapid and solvent-free access to crystalline supermolecules. Chem. Commun. 2008, 396, 83-90.
[36] Descamps, M.; Willart, J. F.; Dudognon, E.; Caron, V., Transformation of phar- maceutical compounds upon milling and comilling: The role of Tg. J. Pharm. Sci. 2007, 96, 1398-1407.
[37] Barzegar-Jalali, M., Valizadeh, H., Shadbad, M.R., Adibkia, K., Mohammadi, G., Fara- hani, A., Arash, Z., Nokhodchi, A., Cogrinding as an approach to enhance dissolution rate of a poorly water-soluble drug (gliclazide). Powder Technol. 2010, 197, 150-158.

References
112
[38] Colombo, I.; Grassi, G.; Grassi, M., Drug mechanochemical activation. J. Pharm. Sci. 2009, 98, 3961-3986.
[39] Kaneniwa, N.; Ikekawa, A., Solubilization of water insoluble organic powders by ball-milling in the presence of polyvinylpyrrolidone. Chem. Pharm. Bull. 1975, 23, 2973-2986.
[40] Sekizaki, H.; Danjo, K.; Eguchi, H.; Yonezawa, Y.; Sunada, H., Solid-state interaction of ibuprofen with polyvinylpyrrolidone. Chem. Pharm. Bull. 1995, 43, 988-993.
[41] Boldyrev, V. V.; Shathshneider, T. P.; Severtsev, V. A., Preparation of the disperse systems of sulfathiazole-polyvinylpyrrolidone by mechanical activation. Drug Dev. Ind. Pharm. 1994, 20, 1103-1114.
[42] Vasukumar, K.; Bansal, A., Supercritical fluid technology in pharmaceutical research. Crips 2003, 4, 8-12.
[43] Jessop, C.; Leitner, W., Chemical synthesis using supercritical fluids. Wiley-VCH: Weinheim, 1999.
[44] Perrut, M., Supercritical fluid applications: Industrial developments and economic issues. Ind. Eng. Chem. Res. 2000, 39, 4531-4535.
[45] Yeo, S. D.; Kiran, E., Formation of polymer particles with supercritical fluids: A review. J. Supercrit. Fluids 2005, 34, 287-308.
[46] Bahrami, M.; Ranjbarian, S., Production of micro- and nano-composite particles by supercritical carbon dioxide. J. Supercrit. Fluids 2007, 40, 263-283.
[47] Wang, Y.; Dave, R.; Pfeffer, R., Polymer coating/encapsulation of nanoparticles using a supercritical anti-solvent process. J. Supercrit. Fluids 2004, 28, 85-99.
[48] Perrut, M.; Jung, J.; Leboeuf, F., Enhancement of dissolution rate of poorly-soluble active ingredients by supercritical fluids process, Part 1: Micronization of neat particles. Int. J. Pharm. 2005, 288, 3-10.
[49] Subramaniam, B., Pharmaceutical Processing with Supercritical Carbon Dioxide. J. Pharm. Sci. 1997, 86, 885-890.
[50] Subra, P.; Laudani, C. G.; Gonzalez, A. V.; Reverchon, E., Precipitation and phase behavior of theophylline in solvent-supercritical CO2 mixtures. J. Supercrit. Fluids 2005, 35, 95-105.

References
113
[51] Sauceau, M.; Rodier, E.; Fages, J., Preparation of inclusion complex of piroxocam with cyclodextrin by using supercritical carbon dioxide. J. Supercrit. Fluids 2008, 47, 326-332.
[52] Kluge, J.; Fusaro, F.; Muhrer, G.; Thakur, R.; Mazzotti, M., Rational design of drug-polymer co-formulations by CO2 anti-solvent precipitation. J. Supercrit. Fluids 2009, 48, 176-182.
[53] Banchero, M.; Manna, L.; Ronchetti, S.; Campanelli, P.; Ferri, A., Supercritical solvent impregnation of piroxicam on PVP at various polymer weight. J. Supercrit. Fluids 2009, 49, 271-278.
[54] Lim, R. T. Y.; Ng, W. K.; Tan, R. B. H., Amorphization of pharmaceutical compound by co-precipitation using supercritical anti-solvent (SAS) process (Part I). Journal of Supercritical Fluids 2010, 53, 179-184.
[55] Sethia, S.; Squillante, E., Solid dispersion of carbamazepine in PVPK30 by conventional solvent evaporation and supercritical methods. Int. J. Pharm. 2004, 272, 1-10.
[56] Gong, K.; Viboonkiat, R.; Rehman, I. U.; Buckton, G.; Darr, J. A., Formation and characterization of porous indomethacin-PVP coprecipitates prepared using solvent-free supercritical fluid processing. J. Pharm. Sci. 2005, 60, 2583-2590.
[57] Mauro, B.; Luigi, M.; Silvia, R.; Pasquale, C.; Ada, F., Supercritical solvent impregnation of piroxicam on PVP at various polymer weight. J. Supercrit. Fluids 2009, 49, 271-278.
[58] Surana, R.; Pyne, A.; Suryanarayanan, R., Effect of preparation method on physical properties of amorphous trehalose. Pharm. Res. 2004, 21, 1167-76.
[59] Bhugra, C.; Shmeis, R.; Krill, S. L.; Pikal, M. J., Predictions of onset of crystallization from experimental relaxation time I-Correlation of molecular mobility from temperatures above the glass transition to temperatures below the glass transition. Pharm. Res. 2006, 23, 2277-2290.
[60] Bhugra, C.; Shmeis, R.; Krill, S. L.; Pikal, M. J., Predictions of onset of crystallization from experimental relaxation times-II. Comparison between predicted and experimental onset time. J. Pharm. Sci. 2008, 97, 455-472.
[61] Hodge, I. M., Enthalpy relaxation and recovery in amorphous materials. J. Non-Cryst. Solids 1994, 169, 211-266.
[62] Angell, C. A.; Ngai, K. L.; Mckenna, G. B.; McMillan, P. F.; Martin, S. W., Relaxation in glassforming liquids and amorphous solids. Appl. Phys. Rev. 2000, 88, 3113-3157.

References
114
[63] Crowley, K. J.; Zografi, G., The effect of low concentration of molecularly dispersed polyvinylpyrrolidone on indomethacin crystallization from the amorphous state. Pharm. Res. 2003, 20, 1417-1422.
[64] Hasegawa, S.; Ke, P.; Buckton, G., Determination of the structural relaxation at the surface of amorphous solid dispersion using inverse gas chromatography. J. Pharm. Sci. 2009, 98, 2133-2139.
[65] Ke, P.; Hasegawa, S.; Al-Obaidi, H.; Buckton, G., Investigationof preparation methods on surface/bulk structural relaxation and glass fragility of amorphous solid dispersions. Int. J. Pharm. 2012, 422, 170-178.
[66] Amidon, G. L.; Lunnernas, H.; Shah, V. P.; Crison, J. R., A theoretical basis for a biopharmaceutical drug classification: the correlation of in vitro drug product dissolution and in vivo bioavailibility. Pharm. Res. 1995, 12, 413-420.
[67] Brittain, H. G., Solubility of pharmaceutical solids. ed.; M. Dekker: New York, 1995.
[68] Noyes, A.; Whitney, W., The rate of solution of solid substances in their own solutions. J. Am. Chem. Soc. 1897, 19, 930-934.
[69] Rasenack, N.; Müller, B. W., Dissolution rate enhancement by in-situ-micronization of poorly water-soluble drugs using a controlled crystallization process. Pharm. Res. 2002, 19, 1896-1902.
[70] Steckel, H.; Rasenack, N.; Müller, B. W., In-situ-micronization of disodium cromoglycate for pulmonary delivery. Eur. J. Pharm. Biopharm. 2003, 55, 173-180.
[71] Varshosaz, J.; Talari, R.; Mostafavi, S. A.; Nokhodchi, A., Dissolution enhancement of gliclazide using in situ micronization by solvent change method Powder Technol. 2008, 187, 222-230.
[72] Zhang, H.-X.; Wang, J.-X.; Zhang, Z.-B.; Le, Y.; Shen, Z.-G.; Chen, J.-F., Micronization of atorvastatin calcium by antisolvent precipitation process Int. J. Pharm. 2009, 374, 106-113.
[73] Martin, A.; Cocero, M. J., Micronization process with supercritical fluids: Fundamental and mechanisms. Adv. Drug Deliv. Rev. 2008, 60, 339-350.
[74] Miranda, S.; Yaeger, S., Homing in on the best size reduction method. Chem. Eng. 1998, 105, 102-110.
[75] Angus, S.; Armstrong, B.; (Eds.), K. d. R., International Thermodynamic Tables of the Fluid State. ed.; Division of Physical Chemistry, Pergamon Press, Oxford: 1976; Vol. 3.
References
115
[76] Bolten, D.; Turk, M., Micronisation of carbamazepine through rapid expansion of supercritical solution (RESS). J. Supercrit. Fluids 2012, 66, 389-397.
[77] Yu, H.; Zhao, X.; Zu, Y.; Zhang, X.; Zu, B.; Zhang, X., Preparation and characterization of micronized artemisinin via a rapid expansion of supercritical solutions (RESS) method. Int. J. Mol. Sci. 2012, 13, 5060-5073.
[78] Hezave, A. Z.; Esmaeilzadeh, F., Investigation of the rapid expansion of supercritical solution parameters effects on size and morphology of cephalexin particles. J. Aerosol Sci 2010, 41, 1090-1112.
[79] Su, C.-S.; Tang, M.; Chen, Y.-P., Micronization of nabumetone using the rapid expansion of supercritical solution (RESS) process. J. Supercrit. Fluids 2009, 50, 69-76.
[80] Yeo, S.; Debenedetti, P.; Patro, S.; Przybycien, T., Secondary Structure Characterization of Microparticle Insulin Powders, Journal Pharm. Sci., 38(1994) 1651-1656. J. Pharm. Sci. 1994, 38, 1651-1656.
[81] Schmitt, W. Finely Divided Solid Crystalline Powers via Precipitation into an Antisolvent. WO 90/03782, 1990
[82] Randolph, T.; Randolph, A.; Mebes, M.; Yeung, S., Sub-Micrometer-Sized Biodegradable Particles of Poly(L-Lactid Acid) via the Gas Antisolvent Spray Precipitation Process. Biotechnol. Progr. 1993, (9), 429-435.
[83] Ranjit, T.; Auburn, E. H.; Elisabete, G.; Gerhard, M., Particle size and bulk powder flow control by supercritical anti-solvent precipitation. Ind. Eng. Chem. Res. 2009, 48, 5302-5309.
[84] Hanna, M.; York, P.; Rudd, D.; Beach, S., A Novel Apparatus for Controlled Particle Formation Using Supercritical Fluids. Pharm. Res. 1995, 12, 5141-5150.
[85] Jaarmo, S.; Rantakylä, M.; Aaltonen, O. In Particle Tailoring with Supercritical Fluids: Production of Amorphous Pharmaceutical Particles, The 4th International Symposium on Supercritical Fluids, Sendai, 1997; Saito, S.; Arai, K., Eds. Sendai, 1997; pp 263-266.
[86] Hong, H. L.; Suo, Q. L.; Han, L. M.; Li, C. P., Study on Precipitation of Astaxanthin in Supercritical Fluid Powder Technol. 2009, 191, 294-298.
[87] Hong, H.; Suo, Q.; Li, F.; Wei, X.; Zhang, J., Precipitation and characterization of chelerythrine microparticles by the supercritical antisolvent process. Chem. Eng. Technol. 2008, 31, 1051-1055.

References
116
[88] Lee, B.-M.; Jeong, J.-S.; Lee, Y.-H.; Lee, B.-C.; Kim, H.-S.; Kim, H.; Lee, Y.-W., Supercritical antisolvent micronization of cyclotrimethylenetrinitramin: Influence of the organic solvent Ind. Eng. Chem. Res. 2009, 48, 1162-1167.
[89] Jiang, Y.; Sun, W.; Wang, W., Recrystallization and micronization of 10-hydroxycamptothecin by supercritical antisolvent process. Ind. Eng. Chem. Res. 2012, 51, 2596-2602.
[90] Tien, Y.-C.; Su, C.-S.; Lien, L.-H.; Chen, Y.-P., Recrystallization of erlotinib hydrochloride and fulvestrant using supercritical antisolvent process J. Supercrit. Fluids 2010, 55, 292-299.
[91] Varughese, P.; Li, J.; Wang, W.; Winstead, D., Supercritical antisolvent processing of γ-Indomethacin: Effects of solvent, concentration, pressure and temperature on SAS processed Indomethacin Powder Technol. 2010, 201, 64-69.
[92] Li, P.; Zhao, L., Developing early formulations: Practice and perspective. Int. J. Pharm. 2007, 341, 1-19.
[93] Dhirendra, K.; Lewis, S.; Udupa, N.; Atin, K., Solid Dispersion: a review. Pak. J. Pharm. Sci. 2009, 22, 234-246.
[94] Serajuddin, A. T., Solid dispersion of poorly water-soluble drugs: Early promises, subsequent problems, and recent breakthroughs. J. Pharm. Sci. 1999, 88, 1058-1066.
[95] Yamashita, K.; Nakate, T.; Okimoto, K.; Ohike, A.; Tokunaga, Y.; Ibuki, R.; Higaki, K.; Kimura, T., Establishment of new preparation method for solid dispersion formulation of tacrolimus. Int. J. Pharm. 2003, 267, 79-91.
[96] Gilis, P. M. V.; De Conde, V. F. V.; Vandecruys, R. P. G. Beads having a core coated with antifungal and a polymer. WO9405263A1, 1993.
[97] Mei, L.; Zhang, Z.; Zhao, L.; Huang, L.; Yang, X.-L.; Tang, J.; Feng, S.-S., Pharmaceutical nanotechnology for oral delivery of anticancer drugs Adv. Drug Deliv. Rev. 2013, (Article in Press).
[98] Gao, J.; Feng, S.-S.; Guo, Y., Nanomedicine against multidrug resistance in cancer treatment Nanomed. 2012, 7, 465-468.
[99] Craig, D. Q., The mechanisms of drug release from solid dispersions in water- soluble polymers. Int. J. Pharm. 2002, 231, 131-144.
[100] Pouton, C. W., Formulation of poorly water-soluble drugs for oral administration: physicochemical and physiological issues and the lipid formulation classification system. Eur. J. Pharm. Sci. 2006, 29, 278-287.

References
117
[101] Muhrer, G.; Meier, U.; Fusaro, F.; Albano, S.; Mazzotti, M., Use of compressed gas precipitation to enhance the dissolution behavior of a poorly water-soluble drug: generation of drug microparticles and drug-polymer solid dispersions. Int. J. Pharm. 2006, 308, 69-83.
[102] Karavas, E.; Ktistis, G.; Xenakis, A.; Georgarakis, E., Effect of hydrogen bonding interactions on the release mechanism of felodipine from nanodispersions with polyvinylpyrrolidone. Eur. J. Pharm. Biopharm. 2006, 63, 103-114.
[103] Leuner, C.; Dressman, J., Improving drug solubility for oral delivery using solid dispersions. Eur. J. Pharm. Sci. 2000, 50, 47-60.
[104] Bounaceur, A.; Rodier, E.; Fages, J., Maturation of a ketoprofen/β-cyclodextrin mixture with supercritical carbon dioxide. J. Supercrit. Fluids 2007, 41, 429-439.
[105] Hu, J.; Johnston, K. P.; Williams, R. O., Rapid dissolving high potency danazol powders produced by spray freezing into liquid(SFL) process with organic solvent. Int. J. Pharm. 2004, 271, 145-154.
[106] Matsumoto, T.; Zografi, G., Physical properties of solid molecular dispersions of indomethacin with poly(vinylpyrrolidone) and poly(vinylpyrrolidone-co-vinylacetate) in relation to indomethacin crystallization. Pharm. Res. 1999, 16, 1722-1728.
[107] Taylor, L. S.; Zografi, G., Spectroscopic characterization of interactions between PVP and indomethacin in amorphous molecular dispersions. Pharm. Res. 1997, 14, 1691-1698.
[108] Yoshioka, M.; Hancock, B. C.; Zografi, G., Inhibition of indomethacin crystallization in poly(vinylpyrrolidone) coprecipitates. J. Pharm. Sci. 1995, 84, 983-986.
[109] Coleman, M. M.; Graf, J. F.; Painter, P. C., Specific interactions and the miscibility of polymer blends. Technomic Publishing, Lancaster, Basel 1991.
[110] Chiou, W. L.; Riegelman, S., Pharmaceutical applications of solid dispersion systems. J. Pharm. Sci. 1971, 60, 1281-1302.
[111] Bahl, D.; Bogner, R. H., Amorphization of indomethacin by co-grinding with neusilin US2: Amorphization kinetics, physical stability and mechanism. Pharm. Res. 2006, 23, 2317-2325.
[112] Lozowski, D., Supercritical CO2: A green solvent. Chem. Eng. (New York) 2010, 117, 15-18.
[113] Shoyele, S. A.; Cawthorne, S., Particle engineering techniques for inhaled biopharmaceuticals. Adv. Drug Deliv. Rev. 2006, 58, 1009-1029.

References
118
[114] Yasuji, T.; Takeuchi, H.; Kawashima, Y., Particle design of poorly water-soluble drug substances using supercritical fluid technologies. Adv. Drug Deliv. Rev. 2008, 60, 388-398.
[115] Kaushal, A. M.; Gupta, P.; Bansal, A. K., Amorphous drug delievry systems: Molecular aspects, design and performance. Crit. Rev. Ther. Drug Carrier Syst. 2004, 21, 133-193.
[116] Hancock, B. C., Disordered drug delivery: destiny, dynamics and the deborah number. J. Pharm. Pharmacol. 2002, 54 737-746.
[117] R. A. Beyerinck; R. J. Ray; D. E. Dobry; D. M. Settell Method form making homogeneous spray-dried solid amorphous drug dispersions using pressure nozzles. WO03/063821A2, 2003.
[118] O. L. Sprockel; M. Sen; P. Shivanand; W. Prapaitrakul, A melt-extrusion process for manufacturing matrix drug delivery systems. Int. J. Pharm. 1997, 155, 191-199.
[119] M. C. Lai; E. M. Topp, Solid-state chemical stability of proteins and peptides. J. Pharm. Sci. 1999, 88, 489-500.
[120] W. Wang, Lyophilization and development of solid protein pharmaceuticals. Int. J. Pharm. 2000, 203, 1-60.
[121] S. F. Swallen; K. L. Kearns; M. K. Mapes; Y. S. Kim; R. J. McMahon; M. D. Ediger; T. Wu; L. Yu; S. Satija, Organic glasses with exceptional thermodynamic and kinetic stability. Science 2007, 315, 353-356.
[122] A. M. Abdul-Fattah; D. Lechuga-Ballesteros; D. S. Kalonia; Pikal, M. J., The impact of drying method and formulation on the physical properties and stability of methionyl human growth hormone in the amorphous solid state. J. Pharm. Sci. 2008, 97, 163-184.
[123] G. Ruecroft; D. Hipkiss; T. Ly; N. Maxted; P. W. Cains, Sonocrystallization: The use of ultrasound for improved industrial crystallization. Org. Process Res. Dev. 2005, 9, 923-932.
[124] Y. Li; J. Han; G. G. Z. Zhang; D. J. W. Grant; Suryanarayanan, R., In situ dehydration of carbamazepine dihydrate: A novel technique to prepare amorphous anhydrous carbamazepine. Pharm. Dev. Technol. 2000, 5, 257-266.
[125] T. J. Smith; G. Gauzer High pressure compaction for pharmaceutical formulations. WO2004058222A1, 2003.
[126] Shakhtshneider, T. P.; Danède, F.; Capet, F.; Willart, J. F.; Descamps, M.; Paccou, L.; Surov, E. V.; Boldyreva, E. V.; Boldyrev, V. V., Grinding of drugs with

References
119
pharmaceutical excipients at cryogenic temperatures : Part II. Cryogenic grinding of indomethacin-polyvinylpyrrolidone mixtures. J. Therm. Anal. Calorim. 2007, 89, 709-715.
[127] Watanabe, T.; Wakiyama, N.; Usui, F.; Ikeda, M.; Isobe, T.; M., S., Stability of amorphous indomethacin compounded with silica. . Int. J. Pharm. 2001, 226, 81-91.
[128] Gupta, M. K.; Vanwert, A.; Bogner, R. H., Formation of physically stable amorphous drugs by milling with neusilin. J. Pharm. Sci. 2003, 93, 536-551.
[129] Mura, P.; Cirri, M.; Faucci, M. T.; Gines-Dorado, J. M.; Bettinetti, G. P., Investigation of the effects of grinding and co-grinding on physicochemical properties of glisentide. J. Pharm. Biomed. Anal. 2002, 30, 227-237.
[130] Chieng, N.; Aaltonen, J.; Saville, D.; Rades, T., Physical characterization and stability of amorphous indomethacin and ranitidine hydrochloride binary systems prepared by mechanical activation. Eur. J. Pharm. Biopharm. 2009, 71, 47-54.
[131] Lobmann, K.; Strachan, C.; Grohganz, H.; Rades, T.; Korhonen, O.; Laitinen, R., Co-amorphous simvastatin and glipizide combinations show improved physical stability without evidence of intermolecular interactions Eur. J. Pharm. Biopharm. 2012, 81, 159-169.
[132] Wang, Q.; Li, S.; Che, X.; Fan, X.; Li, C., Dissolution improvement and stabilization of ibuprofen by co-grinding in a β-cyclodextrin ground complex Asian J. Pharm. Sci. 2010, 5, 185-190.
[133] Kompella, U. B.; Koushik, K., Preparation of drug delivery systems using supercritical fluid technology. Crit. Rev. Ther. Drug Carrier Syst. 2001, 188, 173-199.
[134] Palakodaty, S.; York, P., Phase behavioral effects on particle formation processes using supercritical fluids. Pharm. Res., 16(7): 976-985. Pharm. Res. 1999, 16, 976-985.
[135] Moneghini, M.; Kikic, I.; Voinovich, D.; Perissutti, B., Processing of carbamazepine-PEG 4000 solid dispersions with supercritical carbon dioxide: preparation, characterization, and in vitro dissolution. Int. J. Pharm. 2001, 222, (129-138).
[136] Vincent, M. F.; Kazarian, S. G.; Eckert, C. A., Tunable diffusion of D2O in CO2-swollen poly(methyl methacrylate) films. . AlChE J. 1997, 43, 1838-1848.
[137] http://wikis.lawrence.edu/display/CHEM/Changes+in+Physical+State+-phase+transitions+-+Laura+Qiu
[138] Huang, F. H.; Li, M. H.; Lee, L. L.; Starling, K. E.; Chung, F. T. H., An accurate equation of state for carbon dioxide. J. Chem. Eng. Jpn. 1985, 18, 490-496.

References
120
[139] O’Hern, H. A.; Martin, J. J., Diffusion in carbon dioxide at elevated pressure. Ind. Eng. Chem. Res. 1955, 47, 2081.
[140] Fenghour, A.; Wakeham, W. A.; Vesovic, V., The viscosity of carbon dioxide. . J. Phys. Chem. Ref. Data 1998, 27, 31-44.
[141] Beckman, E. J., Supercritical and near-critical CO2 in green chemical synthesis and processing. J. Supercrit. Fluids 2004, 28, (121-191).
[142] Fages, J.; Lochard, H.; Rodier, E.; Letourneau, J.-J.; Sauceau, M., Generation of divided solids by supercritical fluids Can. J. Chem. Eng. 2003, 81, 161-175.
[143] M. Turk; P. Hils; B. Helfgen; K. Schaber; H.J. Martin; M.A. Wahl, Micronization of pharmaceutical substances by the Rapid Expansion of Supercritical Solutions (RESS): a promising method to improve bioavailability of poorly soluble pharmaceutical agents. J. Supercrit. Fluids 2002, 22, 75-84.
[144] Reverchon, E., Supercritical antisolvent precipitation of micro- and nanoparticles. J. Supercrit. Fluids 1999, 15, 1-21.
[145] Mishima, K.; Yamaguchi, S.; Umemot H Patent JP 8104830, 1996.
[146] Mishima, K.; Matsuyama, K.; Tanabe, D.; Yamauchi, S.; Young, T. J.; Johnston, K. P., Microencapsulation of proteins by rapid expansion of supercritical solution with a nonsolvent. AlChE J. 2000, 46, 857-865.
[147] Debenedetti, P. G.; Tom, J. W.; Yeo, S. D.; Lim, G. B., Application of supercritical fluids for the production of sustained delivery device. J. Controlled Release 1993, 24, 27-44.
[148] Debenedetti, P. G.; Tom, J. W.; Jerome, R., Precipitation of poly(L-lactic acid) and composite poly(L-lactic acid)-pyrene particles by rapid expansion of supercritical solutions. J. Supercrit. Fluids 1994, 7, 9-29.
[149] Perrut, M.; Jung, J.; Leboeuf, F., Enhancement of dissolution rate of poorly soluble active ingredients by supercritical fluid processes: Part II: Preparation of composite particles Int. J. Pharm. 2005, 288, 11-16.
[150] Vemavarapu, C.; Mollan, M. J.; Needham, T. E., Coprecipitation of pharmaceutical actives and their structurally related additives by the RESS process Powder Technol. 2009, 189, 444-453.
[151] J. Kim; Paxton, T. E.; Tomasko, D. L., Microencapsulation of naproxen using rapid expansion of supercritical solutions. Biotechnol. Progr. 1996, 12, 650-661.
References
121
[152] Turk, M.; Hils, P.; Lietzow, R.; Schaber, K., Stabilization of pharmaceutical substances by rapid expansion of supercritical solutions (RESS). In Proceedings of the Sixth International Symposium on Supercritical Fluids, ed.; Versailles, France, 2003; Vol. 3, pp 1747-1752.
[153] Sonoda, R.; Hara, Y.; Iwasaki, T.; Watano, S., Improvement of dissolution property of poorly water-soluble drug by supercritical freeze granulation Chem. Pharm. Bull. 2009, 57, 1040-1044.
[154] Matsuyama, K.; Mishima, K.; Hayashi, K.; Ishikawa, H.; Matsuyama, H.; T.Harada., Formation of microcapsules of medicines by the rapid expansion of a supercritical solution with a nonsolvent. J. Appl. Polym. Sci. 2003, 89, 742-752.
[155] P. Sencar-Bozic; S. Srcic; Z. Knez; J. Kerc, Improvement of nifedipine dissolution characteristics using supercritical CO2. Int. J. Pharm. 1997, 148, 123-130.
[156] Calderone, M.; Rodier, E. Coating of powdery solid active substances, for use in e.g., a pharmaceutical formulation, comprises contacting a mixture (having coating) and individualized particles of active substance. WO2006030112, 2006.
[157] J. Kerc; S. Srcic; Z. Knez; P. Sencar-Bozic, Micronization of drugs using supercritical carbon dioxide. Int. J. Pharm. 1999, 182, 33-39.
[158] Gallagher, P. M.; M. P. Coffey; V. J. Krukonis; N. Klasutis, Gas Antisolvent Recrystallization - New Process to Recrystallize Compounds Insoluble in Supercritical Fluids. ed.; Acs Symposium Series: 1989; Vol. 406.
[159] Subra-Paternault, P.; Vrel, D.; Roy, C., Coprecipitation on slurry to prepare drug-silica-polymer formulations by compressed antisolvent J. Supercrit. Fluids 2012, 63, 69-80.
[160] Won, D.-H.; Kim, M.-S.; Lee, S.; Park, J.-S.; Hwang, S.-J., Improved physicochemical characteristics of felodipine solid dispersion particles by supercritical anti-solvent precipitation process. Int. J. Pharm. 2005, 301, 199-208.
[161] Rodier, E.; Lochard, H.; Sauceau, M.; Letourneau, J.-J.; Freiss, B.; Fages, J., A three step supercritical process to improve the dissolution rate of Eflucimibe. Eur. J. Pharm. Sci. 2005, 26, 184-193.
[162] Chang, Y.-P.; Tang, M.; Chen, Y.-P., Micronization of sulfamethoxazole using the supercritical anti-solvent process. J. Mater. Sci 2008, 43, 2328-2335.
[163] Uzun, I. N.; Sipahigil, O.; Dincer, S., Co-precipitation of cefuroxime axetil-PVP composite microparticles by batch supercritical antisolvent process. J. Supercrit. Fluids 2011, 55, 1059-1069.

References
122
[164] De Zordi, N.; Moneghini, M.; Kikic, I.; Grassi, M.; Del Rio Castillo, A. E.; Solinas, D.; Bolger, M. B., Applications of supercritical fluids to enhance the dissolution behaviors of Furosemide by generation of microparticles and solid dispersions. Eur. J. Pharm. Biopharm. 2012, 81, 131-141.
[165] Martin, A.; Mattea, F.; L.Gutierrez; Miguel, F.; Cocero, M. J., Co-precipitation of carotenoids and bio-polymers with the supercritical anti-solvent process. J. Supercrit. Fluids 2007, 41, 138-147.
[166] Bleich, J.; Muller, B. W., Production of drug loaded microparticles by the use of supercritical gases with the aerosol solvent extraction system (ASES) process. J. Microencapsulation 1996, 13, 131-139.
[167] Young, T. J.; Johnston, K. P.; Mishima, K.; Tanaka, H., Encapsulation of lysozyme in a biodegradable polymer by precipitation with a vapor-over-liquid anti-solvent. J. Pharm. Sci. 1999, 88, 640-650.
[168] Taki, S.; Badens, E.; Charbit, G., Controlled release system formed by super-critical anti-solvent coprecipitation of a herbicide and a biodegradable polymer. J. Supercrit. Fluids 2001, 21, 61-70.
[169] Boutin, O.; Badens, E.; Carretier, E.; Charbit, G., Coprecipitation of a herbicide and biodegradable materials by the supercritical anti-solvent technique. J. Supercrit. Fluids 2004, 31, 89-99.
[170] Elvassore, N.; Bertucco, A.; Caliceti, P., Production of protein-loaded polymeric microcapsules by compressed CO2 in a mixed solvent. Ind. Eng. Chem. Res. 2001, 40, 795-800.
[171] Corrigan, O. I.; Crean, A. M., Comparative physicochemical properties of hydrocortisone-PVP composites prepared using supercritical carbon dioxide by the GAS anti-solvent re-crystallization process, by co-precipitation and by spray drying. Int. J. Pharm. 2002, 245, 75-82.
[172] Juppo, A. M.; Boissier, C.; Khoo, C., Evaluation of solid dispersion particles prepared with SEDS. Int. J. Pharm. 2003, 250, 385-401.
[173] Jun, S. W.; Kim, M.-S.; Jo, G. H.; Lee, S.; Woo, J. S.; Park, J.-S.; Hwang, S.-J., Cefuroxime axetil solid dispersions prepared using solution enhanced dispersion by supercritical fluids. J. Pharm. Pharmacol. 2005, 57, 1529-1537.
[174] Toropainen, T.; Velaga, S.; Heikkila, T.; Matilainen, L.; Jarho, P.; Carlfors, J.; Lehto, V.-P.; Jarvinen, T.; Jarvinen, K., Preparation of budesonide/γ-cyclodextrin complexes in supercritical fluids with a novel SEDS method. J. Pharm. Sci. 2006, 95, 2235-2245.

References
123
[175] Li, Y.; Yang, D.-J.; Chen, S.-L.; Chen, S.-B.; Chan, A. S.-C., Process parameters and morphology in puerarin, phospholipids and their complex microparticles generation by supercritical antisolvent precipitation. Pharm. Res. 2008, 25, 563-577.
[176] R. Falk; T.W. Randolph; J.D.Meyer; R.M.Kelly; M.C. Manning, Controlled release of ionic compounds from poly(l-lactide) microspheres produced by precipitation with a compressed anti-solvent. J. Controlled Release 1997, 44, 77-85.
[177] R. Ghaderi; P. Artursson; J. Carlfors, A new method for preparing biodegradable microparticles and entrapment of hydrocortisone in dl-PLG microparticles using supercritical fluids. Eur. J. Pharm. Sci. 2000, 10, 1-9.
[178] M. Tservistas; M.S. Levy; M.Y.A. Lo-Yim; R.D. O’Kennedy; P. York, The formation of plasmid DNA loaded pharmaceutical powder using supercritical fluid technology. Biotechnol. Bioeng. 2001, 72, 12-18.
[179] T.M. Martin; N. Bandi; N. Shulz; C.B. Roberts; U.B.Kompella, Preparation of budesonide and budesonide–PLA microparticles using supercritical fluid precipitation technology. AAPS PharmSciTech 2002, 3, 1-11.
[180] Stevenson, C. L.; Bennett, D. B.; Lechuga-Ballesteros, D., Pharmaceutical liquid crystals: The relevance of partially ordered systems. J. Pharm. Sci. 2005, 94, 1861-1880.
[181] Breitenbach, J.; Schrof, W.; Neumann, J., Confocal raman spectroscopy: Analytical approach to solid dispersion and mapping of drug. Pharm. Res. 1999, 16, 1109-1113.
[182] Li, J.; Guo, Y.; Zografi, G., The solid-state stability of amorphous quinapril in the presence of beta-cyclodextrins. J. Pharm. Sci. 2002, 91, 229-243.
[183] Karavas, E.; Georgarakis, M.; Docoslis, A.; Bikiaris, D., Combining SEM, TEM and micro-Raman techniques to differentiate between the amorphous molecular level dispersions and nanodispersions of a poorly water-soluble drug within a polymer matrix. Int. J. Pharm. 2007, 340, 76-83.
[184] Bikiaris, D.; Papageorgiou, G. Z.; Stergiou, A.; Pavlidou, E.; Karavas, E.; Kanaze, F.; al., e., Physicochemical studies on solid dispersions of poorly water-soluble drugs- evaluation of capabilities and limitations of thermal analysis techniques. Thermochim. Acta 2005, 439, 58-67.
[185] Sebhatu, T.; Angberg, M.; Ahlneck, C., Assessment of the degree of disorder in crystalline solids by isothermal microcalorimetry. Int. J. Pharm. 1994, 104, 135-114.

References
124
[186] Vasanthavada, M.; Tong, W. Q.; Joshi, Y.; Kislalioglu, M. S., Phase behavior of amorphous molecular dispersions I: Determination of the degree and mechanism of solid solubility. Pharm. Res. 2004, 21, 1598-1606.
[187] K. Kawakami, Isothermal crystallization of Imwitor 742 from supercooled liquid state. Pharm. Res. 2007, 24, 738-747.
[188] V. Caron; C. Bhugra; M.J. Pikal, Prediction of onset of crystallization in amorphous pharmaceutical systems: phenobarbital, nifedipine/PVP, and phenobarbital/PVP. J. Pharm. Sci. 2010, 99, 3887-3900.
[189] Buckton, G.; Darcy, P., The use of gravimetric studies to assess the degree of crystallinity of predominantly crystalline powders. Int. J. Pharm. 1995, 123, 265-271.
[190] Young, P. M.; Chiou, H.; Tee, T.; Traini, D.; Chan, H.-K.; Thielmann, F.; Burnett, D., The use of organic vapor sorption to determine low levels of amorphous content in processed pharmaceutical powders. Drug Dev. Ind. Pharm. 2007, 33, 91-97.
[191] Sheng, Q.; Weuts, I.; De Cort, S.; Stokbroekx, S.; Leemans, R.; Reading, M.; Belton, P.; Craig, D. Q. M., An investigation into the crystallisation behaviour of an amorphous cryomilled pharmaceutical material above and below the glass transition temperature. J. Pharm. Sci. 2010, 99, 196-208.
[192] Forster, A.; Hempenstall, J.; Tucker, I.; Rades, T., Selection of excipients for melt extrusion with two poorly water-soluble drugs by solubility parameter calculation and thermal analysis. Int. J. Pharm. 2001, 226, 147-161.
[193] Bugay, D. E., Characterization of the solid-state: Spectroscopic techniques. Adv. Drug Deliv. Rev. 2001, 48, 43-65.
[194] Broman, E.; Khoo, C.; Taylor, L. S., A comparison of alternative polymer excipients and processing methods for making solid dispersions of a poorly water soluble drug. Int. J. Pharm. 2001, 222, 139-151.
[195] Widjaja, E.; Kanaujia, P.; Lau, G.; Ng, W. K.; Garland, M.; Saal, C.; Hanefeld, A.; Fischbach, M.; Maio, M.; Tan, R. B. H., Detection of trace crystallinity in an amorphous system using Raman microscopy and chemometric analysis Eur. J. Pharm. Sci. 2011, 42, 45-54.
[196] Newell, H. E.; Buckton, G.; Butler, D. A.; Thielmann, F.; Williams, D. R., The Use of Inverse Phase Gas Chromatography to Measure the Surface Energy of Crystalline, Amorphous, and Recently Milled Lactose. Pharm. Res. 2001, 18, 662-666.
[197] Buckton, G.; Ambarkhane, A.; Pincott, K., The use of inverse phase gas chromatography to study the glass transition temperature of a powder surface. Pharm. Res. 2004, 21, 1554-1557.

References
125
[198] Ohta, M.; Buckton, G., The use of inverse gas chromatography to access the acid-base contributions to surface energies of cefditoren pivoxil and methacrylate co-polymers and possible links to instability. Int. J. Pharm. 2003, 272, 121-128.
[199] Andronis, V.; Zografi, G., Crystal nucleation and growth of indomethacin polymorphs from the amorphous state. J. Non-Cryst. Solids 2000, 271, 236-248.
[200] Okumura, T.; Ishida, M.; Takayama, K.; Otsuka, M., Polymorphic transformation of indomethacin under high pressures. J. Pharm. Sci. 2006, 95, 689-700.
[201] Walking, W. D., Povidone. American Pharmaceutical Association/The Pharmaceutical Press: Washington, DC/London, 1994.
[202] Modi, A.; Tayade, P., Enhancement of Dissolution Profile by Solid Dispersion (Kneading) Technique. AAPS PharmSciTech 2006, 7, 68.
[203] Parrott, G. L., Milling of pharmaceutical solids. J. Pharm. Sci. 1974, 63, 813-829.
[204] Butler, D. A.; Levoguer, C.; Williams, D. R. Apparatus and a method for investigating the properties of a solid material by inverse chromatography. 1999.
[205] Santos, J. M. R. C. A.; Fagelman, K.; Guthrie, J. T., Characterization of the surface Lewis acid-base properties of poly(butyl terephthalate) by inverse gas chromatography. J. Chromatogr. A 2002, 969, 111-118.
[206] Fowkes, F. M., Attractive forces at interfaces. Ind. Eng. Chem. Res. 1964, 56, 40-52.
[207] Schultz, J.; Lavielle, L.; C, M., The role of the interface in carbon fibre-spoxy composites. J. Adhes. 1987, 23, 45-60.
[208] Widjaja, E.; Li, C. Z.; Chew, W.; Garland, M., Band target entropy minimization. A general and robust algorithm for pure component spectral recovery. Anal. Chem. 2003, 75, 4499–4507.
[209] Varughese, P.; Li, J.; Wang, W.; Winstead, D., Supercritical antisolvent processing of ã-Indomethacin: Effects of solvent, concentration, pressure and temperature on SAS processed Indomethacin. Powder Technol. 2010, 201, 64-69.
[210] Gordon, M.; Taylor, J. S., Ideal copolymers and the second -order transition of synthetic rubbers 1. Non-crytalline co-polymers. J. Appl. Chem 1952, 2, 493-500.

References
126
[211] Paes, S. S.; Sun, S.; MacNaugtan, W.; Ibbett, R.; Ganster, J.; Foster, T. J.; Mitchell, J. R., The glass transition and crystallization of ball milled cellulose. Cellulose 2010, 17, 693-709.
[212] Aceves-Hernandez, J. M.; Nicolas-Vazquez, I.; Aceves, F. J.; Hinojosa-Torres; J.; Paz, M.; Castano, V. M., Indomethacin Polymorphs: Experimental and Conformational Analysis. J. Pharm. Sci. 2009, 98, 2448-2463.
[213] Lee, K. R.; Kim, E. J.; Seo, S. W.; Choi, H. K., Effect of poloxamer on the dissolution of felodipine and preparation of controlled release matrix tablets containing felodipine. Arch. Pharmacal Res. 2008, 31, 1023-1028.
[214] Park, J. H.; Yan, Y. D.; Chi, S. C.; Hwang, D. H.; Shanmugam, S.; Lyoo, W. S.; Woo, J. S.; Yong, C. S.; Choi, H. G., Preparation and evaluation of cremophor-free paclitaxel solid dispersion by a supercritical antisolvent process. J. Pharm. Pharmacol. 2011, 63, 491-499.
[215] Patterson, J. E.; James, M. B.; Forster, A. H.; Lancaster, R. W.; Butler, J. M.; Rades, T., The influence of thermal and mechanical preparative techniques on amorphous state of four poorly soluble compound. J. Pharm. Sci. 2005, 94, 1998-2012.
[216] Fukuoka, E.; Markita, M.; Yamamura, S., Some physicochemical properties of glassy indomethacin. Chem. Pharm. Bull. 1986, 34, 4314-4321.
[217] Gerhardt, A. S.; Ahlneck, C.; Zografi, G., Assessment of disorder in crystalline solids. Int. J. Pharm. 1994, 101, 237-247.
[218] Chen, X.; Bates, S.; Morris, K. R., Quantifying amorphous content of lactose using parallel beam X-ray powder diffraction and whole pattern fitting. J. Pharm. Biomed. Anal. 2001, 26, 63-72.
[219] Burnett, D.; Malde, N.; Williams, D. R., Characterizing amorphous materials with gravimetric vapour sorption techniques. Pharm. Technol. Eur. 2009, 21, 41-45.
[220] Handcock, B. C.; Dalton, C. R., The effect of temperature on the water vapor sorption by some amorphous pharmaceutical sugars. Pharm. Dev. Technol. 1999, 4, 125–31.
[221] Roe, K. D.; Labuza, T. P., Glass transition and crystallization of amorphous trehalosesucrosemixtures. Int. J. Food Prop. 2005., 8, 559-574.
[222] Crowley, K. J.; Zografi, G., Water vapor absorption into amorphous hydrophobic drug/poly(vinylpyrrolidone) dispersions. J. Pharm. Sci. 2002, 91, 2150–2165.

References
127
[223] Van Drooge, D. J.; Hinrichs, W. L. J.; Visser, M. R.; Frijlink, H. W., Characterization of the molecular distribution of drugs in glassy solid dispersions at the nano-meter scale, using differential scanning calorimetry and gravimetric water vapour sorption techniques. Int. J. Pharm. 2006, 310, 220-229.
[224] Shaun, F.; James, F. M.; Catherine, R. P.; Steven, W. B., Effect of moisture on polyvinylpyrrolidone in accelerated stability testing. Int. J. Pharm. 2002, 246, 143-151.
[225] Silverstein, R. M.; Bassler, G. C.; Morril, T. C., Spectrometric identification of organic compounds. ed.; Wiley: New York, 1991.
[226] Kistenmacher, T. J.; March, R. E., Crystal and moelecular structure of an anti-inflammatory agent-Indomethacin. AlChE J. 1972, 94, 1340-1345.
[227] Allison, S. D.; Chang, B.; Randolph, T. W.; Carpenter, J. F., Hydrogen bonding between sugar and protein is responsible for inhibition of dehydration-induced protein unfolding. Arch. Biochem. Biophys. 1999, 365, 289-298.
[228] Almarsson, O.; Zaworotko, M. J., Crystal engineering of the composition of pharmaceutical phases. Do pharmaceutical co-crystals represent a new path to improved medicines? Chem. Commun. 2004, 1889-1896.
[229] Almarsson, O.; Gardner, C. R., Novel approaches to issues of developability. Curr. Drug Dis. 2003, 3, 21-26.
[230] D. L. Price, Intermediate-range order in glasses. Curr. Opin. Solid State Mater. Sci. 1996, 1, 572-577.
[231] Kim, S.-J.; Karis, T. E., Glass formation from low molecular weight organic melts. J. Mater. Res. 1995, 10, 2128-2136.
[232] Heng, J. Y. Y.; Thielmann, F.; Williams, D. R., The Effects of Milling on the Surface Properties of Form I Paracetamol Crystals. Pharm. Res. 2006, 23, 1918-1927.
[233] York, P.; Ticehurst, M. D.; Osborn, J. C.; Roberts, R. J.; Rowe, R. C., Characterization of the surface energetic of milled dl-propranolol hydrochloride using inverse gas chromatography and molecular modelling. Int. J. Pharm. 1998, 174, 176-186.
[234] Hadjar, H.; Balard, H.; Papirer, E., An inverse gas chromatography study of crystalline and amorphous silicas. Colloids Surf. A Physicochem. Eng. Asp. 1995, 99, 45-51.
[235] Hadjar, H.; Balard, H.; Papirer, E., Comparison of crystalline (H-magadiite) and amorphous silicas using inverse gas chromatography at finite concentration conditions Colloids Surf. A Physicochem. Eng. Asp. 1995, 103, 111-117.

References
128
[236] Grimsey, I. M.; Edwards, A. D.; Shekunov, B. Y.; Forbes, R. T.; York, P., The effect of processing on the surface energetics of poly(l-lactide) microparticles as determined by inverse gas chromatography (igc). Pharm. Sci. Supp. 1999, 1, 4.
[237] Chamarthy, S. P.; Pinal, R., The nature of crystal disorder in milled pharmaceutical materials. Colloids Surf. A Physicochem. Eng. Asp. 2008, 331, 68-75.
[238] Kawakami, K.; Pikal, M., Calorimetric investigation of the structural relaxation of amorphous materials: Evaluating validity of the methodologies. J. Pharm. Sci. 2005, 94, 948-965.
[239] Liu, J.; Rigsbee, D. R.; Stotz, C.; Pikal, M., Dynamic of pharmaceutical amorphous solids: The study of enthalpy relaxation by isothermal microcalorimetry. J. Pharm. Sci. 2002, 91, 1853-1862.

Appendices
129
APPENDICES
A1. List of Publications
[1] Lim, R. T. Y.; Ng, W. K.; Tan, R. B. H., Amorphization of pharmaceutical
compound by co-precipitation using supercritical anti-solvent (SAS) process (Part I). J.
Supercrit. Fluids 2010, 53, 179-184.
[2] Lim, R. T. Y.; Ng, W. K.; Tan, R. B. H., Dissolution enhancement of indomethacin
via amorphization using co-milling and supercritical co-precipitation processing.
Powder Technol. (DOI: 10.1016/j.powtec.2012.07.004) 2012.
[3] Lim, R. T. Y.; Ng, W. K.; Widjaja, E.; Tan, R. B. H., Comparison of the physical
stability and physicochemical properties of amorphous indomethacin prepared by co-
milling and supercritical anti-solvent co-precipitation. J. Supercrit. Fluids (Submitted).
[4] Ng, W. K.; Shen, S.-C.; Lim, R. T. Y.; Tan, R. B. H., Recent developments in
process analysis for gas-solid fluidization. In Advances in Chemistry Research; Taylor,
J. C., Ed. Nova Publisher: 2011; 10, 143-176.

Appendices
130
A2. Conferences
[1] Lim, R. T. Y.; Ng, W. K.; Tan, R. B. H., Effect of co-precipitation on crystallinity
of pharmaceutical compounds using supercritical anti-solvent process. AIChE The
2008 Annual Meeting, Philadelphia, PA, 15-21 November 2008.
[2] Lim, R. T. Y.; Ng, W. K.; Tan, R. B. H., Amorphization of pharmaceutical
compounds by co-precipitation using supercritical anti-solvent process. 9th
International Symposium on Supercritical Fluids (ISSF9), Bordeaux, France, 18-20
May 2009.
[3] Lim, R. T. Y.; Ng, W. K.; Tan, R. B. H., Influence of supercritical anti-solvent co-
precipitation on the solid-state properties of pharmaceutical compound. 9th Conference
on Supercritical Fluids and Their Applications, Sorrento, Italy, 5-8 September 2010.
[4] Lim, R. T. Y.; Ng, W. K.; Tan, R. B. H., Dissolution enhancement of indomethacin
via amorphization using supercritical, co-precipitation and co-milling. Engineering
Conferences International (ECI): Particulate Processes in the Pharmaceutical Industry
III, Gold Coast, Australia, 24-29 July 2011.
[5] Lim, R. T. Y.; Ng, W. K.; Tan, R. B. H., Physical stabilities of indomethacin via
amorphization using co-milling and supercritical co-precipitation processing. 10th
International Symposium on Supercritical Fluids (ISSF10), San Francisco, California,
USA, 13-16 May 2012.
Appendices
131
[6] Lim, R. T. Y.; Ng, W. K.; Widjaja, E; Tan, R. B. H., Amorphization of
pharmaceutical compounds using co-milling and supercritical co-precipitation
processing. 5th Asian Particle Technology Symposium (APT 2012), Singapore, 2-4
July 2012.
[7] Hoong, Y. J. A.; Lim, R. T. Y.; Ng, W. K.; Widjaja, E.; Tan, R. B. H.,
Investigating milling-induced amorphization effects on properties of an active
pharmaceutical ingredients (API). AAPS Annual Meeting and Exposition, Chicago,
Illinois, USA, 14-18 October 2012.