copyright © allyn & bacon 2007 chapter 2: research methods
TRANSCRIPT

Copyright © Allyn & Bacon 2007
Chapter 2:Chapter 2:
Research MethodsResearch Methods

Copyright © Allyn & Bacon 2007
How Do Psychologists How Do Psychologists Develop New Knowledge?Develop New Knowledge?
Psychologists, like researchers in all other
sciences, use the scientific method to test their ideas
empirically.

Copyright © Allyn & Bacon 2007
Empirical investigation – An approach to research that relies on sensory experience and observation as research data.
How Do Psychologists How Do Psychologists Develop New Knowledge?Develop New Knowledge?
Scientific method –A five-step process for empirical investigation of a hypothesis under conditions designed to control biases and subjective judgments.

Copyright © Allyn & Bacon 2007
The Five Steps of the Scientific MethodThe Five Steps of the Scientific Method
Developing a hypothesisDeveloping a hypothesis
Performing a controlled testPerforming a controlled test
Gathering objective dataGathering objective data
Analyzing the resultsAnalyzing the results
Publishing, criticizing, and Publishing, criticizing, and replicating the resultsreplicating the results

Copyright © Allyn & Bacon 2007
Developing a Developing a hypothesishypothesis
Performing a controlled test
Gathering objective data
Analyzing the results
Publishing, criticizing, and replicating the
results
Hypothesis –A statement predicting the outcome of a scientific study.
Operational definitions –Exact procedures used in establishing experimental conditions and measurement of results.
The Five Steps of the Scientific MethodThe Five Steps of the Scientific Method

Copyright © Allyn & Bacon 2007
Operational DefinitionOperational Definition
• A definition that specifies the operations used to produce or measure something; a way to give it a numerical value.
• Example of an operational definition:
Televised violence = the # of acts shown or described in which one person injures another.

Copyright © Allyn & Bacon 2007
Developing a hypothesis
Performing a Performing a controlled testcontrolled test
Gathering objective data
Analyzing the results
Publishing, criticizing, and replicating the
results
Independent variable –The variable manipulated by the experimenter.
Random presentation –Using chance alone to determine the order in which the stimulus is presented.
The Five Steps of the Scientific MethodThe Five Steps of the Scientific Method

Copyright © Allyn & Bacon 2007
Developing a hypothesis
Performing a controlled test
Gathering Gathering objective dataobjective data
Analyzing the results
Publishing, criticizing, and replicating the
results
Data –Information gathered by researcher and used to test a hypothesis.
Dependent variable –The measured outcome of a study; the responses of participants in a study.
The Five Steps of the Scientific MethodThe Five Steps of the Scientific Method

Copyright © Allyn & Bacon 2007
Developing a hypothesis
Performing a controlled test
Gathering objective data
Analyzing the Analyzing the resultsresults
Publishing, criticizing, and replicating the
results
Based on statistical analyses of results, the hypothesis is accepted or rejected.
The Five Steps of the Scientific MethodThe Five Steps of the Scientific Method

Copyright © Allyn & Bacon 2007
Developing a hypothesis
Performing a controlled test
Gathering objective data
Analyzing the results
Publishing, Publishing, criticizing, and criticizing, and replicating the replicating the
resultsresults
The Five Steps of the Scientific MethodThe Five Steps of the Scientific Method
Researchers must find out whether their work can withstand the scrutiny of the scientific community.

Copyright © Allyn & Bacon 2007
Types of Psychological ResearchTypes of Psychological Research
In experiments, the researcher controls all the conditions and directly manipulates the conditions.
Non-experimental methods include:• Correlational studies• Surveys• Naturalistic observation• Longitudinal studies• Cross-sectional studies• Cohort-sequential studies

Copyright © Allyn & Bacon 2007
Sources of BiasSources of Bias
-Sources of bias include:• Personal bias• Expectancy bias
-Bias could affect the way an experimenter designs a study, collects data, or interprets results.
-Double blind studies attempt to control bias.
-Researchers must also attempt to control confounding variables.

Copyright © Allyn & Bacon 2007
Ethics in ResearchEthics in Research
APA – American Psychological Association
IRB – Institutional Review Board
IACUC – Animal research (must be Appropriate, Beneficial, and Caring)
• Deception
• Debriefing

Copyright © Allyn & Bacon 2007
Questions Science Cannot AnswerQuestions Science Cannot Answer
• The scientific method is not appropriate for answering questions that cannot be put to an objective, empirical test:
• Ethics
• Religious beliefs
• Values

Milgram Experiment


Shock GeneratorCaution
Amps
On
Intensity Resistance
Amp Meter
SlightShock
ModerateShock
StrongShock
VeryStrongShock
IntenseShock
ExtremeShock
Danger XXXXXX
Milgram ExperimentMilgram Experiment
Two thirds of participants delivered the maximum 450 volts to the learner!

Statistical EvaluationStatistical Evaluation

Statistical EvaluationStatistical Evaluation
Descriptive Statistics:
Statistical procedures used to describe characteristics and responses of groups of subjects.
Mathematical summaries of results.

Statistical EvaluationStatistical Evaluation
Frequency distribution:A summary chart,
showing how frequently each of the various scores in a set of data occurs.
Rank Degree of agreement Number
1 Strongly agree 25
2 Agree somewhat 35
3 Not sure 20
4 Disagree somewhat 15
5 Strongly disagree 5

Statistical EvaluationStatistical Evaluation
Histogram: A bar graph depicting
a frequency distribution.
The height of the bars indicates the frequency of a group of scores.

Measures of Central TendencyMeasures of Central Tendency
AVERAGES
1. Mean
2. Median
3. Mode

Measures of Central TendencyMeasures of Central Tendency
Mean:Most commonly used to describe a set of data.
Calculated by adding all the scores and dividing by the total number of scores.
*What is the mean of the following numbers?
2, 4, 8, 9, 7, 3, 9

Answer:Answer:
6

Measures of Central TendencyMeasures of Central Tendency
Median:The middle score in a list of
scores arranged from highest to lowest.
*What is the median in this number list?
2, 3, 5, 7, 9Answer: 5
Find the median:11, 6, 9, 12, 4, 7,
2, 5

AnswerAnswer::
6.5

Measures of Central TendencyMeasures of Central Tendency
Mode:The score that occurs the most frequently.
*What is the mode of this distribution?
2, 3, 4, 6, 6, 7, 9

Answer:Answer:
6

Measures of Central TendencyMeasures of Central Tendency
What happens if there is more than mode???
Example:
2, 3, 4, 4, 5, 6, 7, 7, 8, 9

Measures of Central TendencyMeasures of Central Tendency
The distribution is called BIMODAL.
2 modes = bimodal
What is the mode?
2, 3, 4, 4, 5, 6, 7, 7, 8, 9
ANSWER:
4 AND 7

Measures of VariationMeasures of Variation
Variance:A measure of
difference or spread
(high or low).
Range:Subtract the lowest score in the data set from the highest score and add 1.
*If the highest quiz grade was 12 and the lowest quiz grade was 0, what is the range?

Answer:Answer:
13

Sampling

SamplingSampling
Random sample:A sample group of subjects
selected by chance (without bias).
Representative sample:A sample that reflects the
distribution of important variables in the larger population in which the researchers are interested.

CorrelationCorrelation::
The measure of a relationship between two variables.
Correlation Coefficient:A mathematical estimate of the relationship
between two variables.-1.0 to +1.0
0 = No Relationship


Statistical EvaluationStatistical Evaluation
POSITIVE CORRELATION: +As one variable increases, the second variable
increases.
Example???
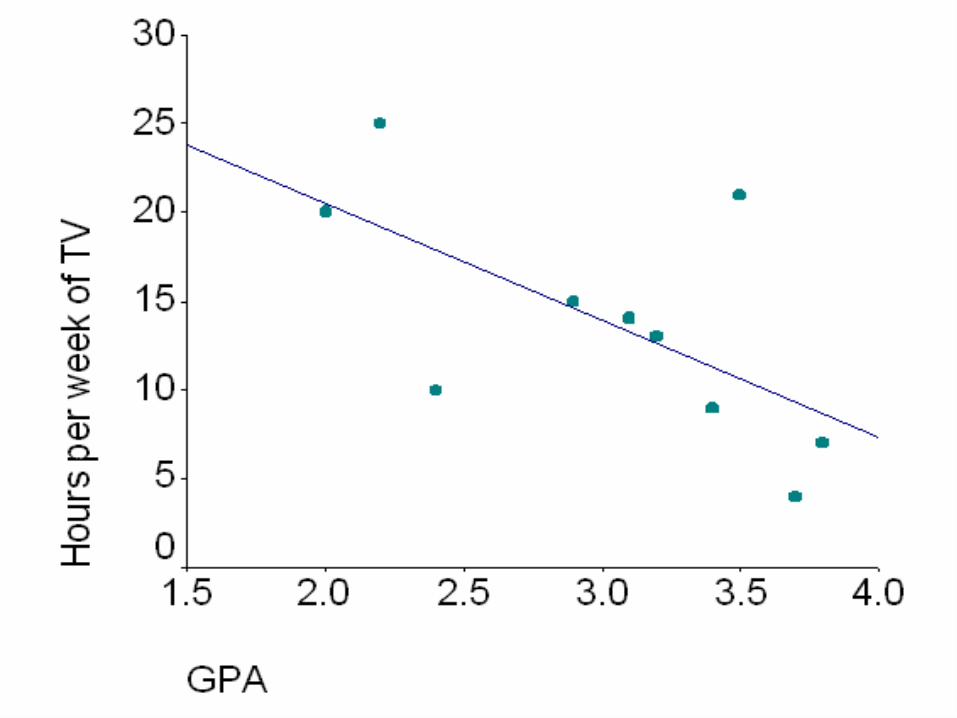
NEGATIVE CORRELATION: -As one variable increases, the second variable
decreases.
Example???

Participant Income
Years of Education
#1 125,000 19
#2 100,000 20
#3 40,000 16
#4 35,000 16
#5 41,000 18
#6 29,000 12
#7 35,000 14
#8 24,000 12
#9 50,000 16
#10 60,000 17


Participant GPA
TV (hours per week)
#1 3.1 14
#2 2.4 10
#3 2.0 20
#4 3.8 7
#5 2.2 25
#6 3.4 9
#7 2.9 15
#8 3.2 13
#9 3.7 4
#10 3.5 21

CorrelationsCorrelations
Imagine reading four correlational studies with the following scores:
-.3 -.8 .4 .7
Which study has the strongest results?
CorrelationsCorrelations
-.8
is the strongest correlation
(The negative sign means that its direction is
negative)

Statistical EvaluationStatistical Evaluation
Normal distribution:A symmetrical frequency of scores clustered
around the mean.
Bell-shaped curve

Statistical EvaluationStatistical Evaluation
Standard Deviations:A measure of variability that describes an
average distance of every score from the mean.

Statistical EvaluationStatistical Evaluation
Inferential statistics:Used to assess
whether the results of a study are reliable or whether they might be simply the result of chance.

Statistical SignificanceStatistical Significance
p<.05The probability that randomly generated results
would resemble the observed results is less than 5%
* The smaller the p value, the more impressive the results!

Statistical EvaluationStatistical Evaluation
Statistically significant:Unlikely that the effects have arisen by
chance.
