converting poultry litter into heat and power: a techno...
TRANSCRIPT
UNIVERSITA’ DEGLI STUDI DI PADOVA
Dipartimento di Ingegneria Industriale DII
Corso di Laurea Magistrale in Ingegneria Energetica
Converting poultry litter into heat and power:
A techno-economic analysis and comparison of a fluidised
bed combustor with various co-generation technologies
Relatore: Prof.ssa Anna Stoppato
Correlatore: Dott.ssa Elizabeth Massey (IERC)
Laureando: Simone Bon
Matricola: 1081757
Anno Accademico 2014/2015

ii

iii
Acknowledgments
I would like to express my gratitude to the International Energy Research Centre (IERC) for giving
me the opportunity to develop my project in such a stimulating environment. Thanks to all of the team
for their constant support and kindness, for their precious advices and the inspiring conversations.
I wish to express my gratitude to my supervisor, professor Anna Stoppato, for her great helpfulness
and assistance although the distance dividing us.
My sincere thanks are extended to my family and all my relatives for encouraging me during all these
years and for their incredible generosity; especially, I would like to thank my mother Luisa and my
brother Andrea for their infinite love and their continuous support. A special thanks also to my
wonderful niece Margherita and her ability to make me smile in every occasion.
Thanks to all my friends, my flatmates, my classmates and all the people that I have met during my
Erasmus period in Ireland. Thanks for all the wonderful moments we have spent together and for
being next to me during hard times.
Finally, a special thanks to all the people that are not beside me anymore, but without whom I could
not have done this.

iv
v
Abstract
Poultry litter (PL) is the material that must be removed and replaced each time a flock of birds is
reared and sent to the processor; it consists of a mixture of bedding material, feathers, manure, urine
and food particles. Current disposal practices in Ireland mainly include land spreading on agricultural
fields. Developing concern about human and environmental pollution derived by in-farm manure
management and over application in agricultural fields, has created the opportunity for the
development of other disposal processes and in particular for those that involve energy generation.
Especially interesting is the possibility to exploit the raw material energy content directly where it is
produced for generating heat and electricity that could be used for the farm purposes. The main aim of
this thesis work consisted of performing a techno-economic analysis of a small-scale co-generative
plant fuelled by PL, in order to understand the economic feasibility for deploying such technology
within poultry farm context. The co-generative plant analysed is based on a fluidised bed combustor
(FBC) system coupled with different co-generative units that comprehend a back pressure Steam
Turbine (ST) an Externally Fired Gas Turbine (EFGT) and two Organic Rankine Cycles (ORC) with
two configurations (with or without internal heat exchanger) using two working fluids (toluene and
ethylbenzene). Combustion and FBC technology were selected after an ample technology review on
energy conversion processes available for PL, carried in the first part of this thesis, where there was
also reported a review of the European and Irish policies and regulations related with the topic and an
overview of the main characteristics of PL intended as fuel for combustion usage (comprehending
proximate and ultimate analysis results from literature).
The techno-economic analysis required the construction of an articulate model for the overall system,
including: the poultry farm model together with the plant layout, the FBC and the cogeneration unit
and the plant operation setting in each hour of the year. The farm model consisted of 25 poultry
houses (each of them containing 8,000 birds), located in the city of Kilkenny, Ireland. Heat for the
poultry houses was considered supplied by a hydronic circuit connected with a water tank and linked
to the co-generation plant. According to the results from the simulation, the nominal heating power in
output from the unit was set at 900 kWth and the circuit was integrated with an auxiliary LPG boiler
for peak period demand. Two scenarios were considered for the FBC operation setting: the Heat
Driven (HD) case where plant follows exactly the poultry farm heat demand and the “Choice” case
(CH) where it is possible increasing the electricity generation (once the heat demand is matched) if
economically favoured.
vi
Desired economic output parameters from the analysis were the Net Present Value (NPV), the simple
Pay Back period (PB) and the Internal Rate of Return (IRR). Simulation results showed that: the NPV
results positive for all the co-generation technologies at the end of the 20 years period considered for
the investment and above 1.3 million euro in all the operative methods; the PB period results ranged
between 3.3 and 3.9 years in both the scenarios analysed; the IRR (considered for a five years period)
reaches values between 9.52% ÷13.13% in the HD scenario and between 11.36% ÷ 14.87% in the CH
scenario. This work also considered the environmental impact, taking into account only the CO2
emissions avoided. CO2 savings achieved by burning a biomass source instead of LPG reached values
of 621.77 tons/year for the model considered and reduced electricity dependence from the grid ranged
between 169.37 to 313.61 tons per year.
A sensitivity analysis of the economic results was carried out, monitoring the dependence of the
economic parameters in output varying the temperature inside the poultry houses, the litter cost and
the investment cost.
vii
Sommario
I residui dell’attività di allevamento avicolo (PL) (poultry litter) consistono in una mistura di lettiera
(paglia, cippato di legno fine, ecc.), piume, deiezioni e residui di cibo che è necessario rimuovere dai
pollai alla fine di ogni periodo di allevamento, dopo che gli animali sono stati inviati al macello. Nel
contesto irlandese, il metodo tipico per lo smaltimento di questo materiale consiste semplicemente nel
suo spargimento sui terreni agricoli limitrofi. Tuttavia, recenti limiti sulle quantità di concime animale
spandibile sui campi agricoli e sempre più stringenti regole nella gestione dei concimi all’interno
degli allevamenti (imposti da normative e direttive Europee per evitare possibili rischi di
contaminazione ambientale e pericolo per la salute umana), hanno portato ad un sempre maggiore
interesse per metodi alternativi di smaltimento e in particolare per metodi che consentano la
generazione di energia. Particolarmente interessante è la possibilità di sfruttare il contenuto energetico
dei PL direttamente dove essi sono prodotti con generazione combinata di elettricità e calore che
possono essere destinati ai consumi interni degli edifici adibiti all’allevamento degli animali.
L’obbiettivo primario del presente lavoro di tesi è stato lo sviluppo di un’analisi tecnico-economica
per un impianto cogenerativo di piccola taglia, per valutare la fattibilità economica di un possibile
sviluppo di questa tecnologia nel contesto degli allevamenti di pollame irlandesi.
L’analisi tecnico-economica è stata sviluppata per un impianto composto da un combustore a letto
fluido (FBC) alimentato da PL e accoppiato con diverse unità cogenerative; le unità prese in
considerazione sono state: un ciclo a vapore con turbina a contropressione (ST), una turbina a gas a
combustione esterna (EFGT) e due sistemi a ciclo organico (ORC) con e senza scambiatore interno di
calore, testati con due diversi fluidi organici (toluene ed etilbenzene). La combustione e l’utilizzo
della tecnologia a letto fluido sono stati selezionati per l’analisi dopo un’ampia revisione della
letteratura sui correnti metodi disponibili per la generazione di energia da PL, sviluppata nella prima
parte del lavoro di tesi; la revisione affronta anche il campo delle normative e legislazioni europee e
irlandesi relative alle tematiche del trattamento e della conversione energetica della biomassa animale
e provvede ad una generale caratterizzazione dei PL in relazione al loro utilizzo come combustibili.
La metodologia usata per l’analisi tecnico-economica ha compreso l’utilizzo e il dialogo di diversi
modelli, necessari per simulare il comportamento dell’intero sistema: la struttura della fattoria
(necessaria per determinare i carichi termici ed elettrici) assieme al layout dell’impianto sono stati
sviluppati attraverso l’utilizzo del software Energy +, il modello del FBC e dell’unità cogenerativa
sono stati sviluppati invece attraverso il programma Engineering Equation Solver (EES), mentre la
viii
modalità operativa dell’impianto cogenerativo in ogni singola ora dell’anno è stata stabilita attraverso
la scrittura di un codice Matlab.
La tenuta avicola modellata nell’analisi è costituita dall’insieme di 25 stabili (ciascuno in grado di
contenere 8000 animali) ed è situata nella cittadina di Kilkenny in Irlanda. L’impianto di
riscaldamento si avvale di un circuito idronico (utilizzante ventilconvettori) collegato ad un serbatoio
d’acqua a sua volta connesso all’impianto cogenerativo attraverso un ulteriore circuito idronico; in
base ai risultati ottenuti dalla simulazione, la taglia dell’unità cogenerativa è stata scelta imponendo
una potenza termica nominale in output di 900 kWth, con la possibilità di apportare maggiore potenza
attraverso l’utilizzo di un boiler ausiliario a Gas di Petrolio Liquefatto (GPL) durante i periodi di
picco della potenza termica richiesta.
Due scenari sono stati ipotizzati nell’impostare le modalità di operazione dell’impianto: il primo,
denominato Heat Driven (HD), nel quale l’unità cogenerativa viene regolata per seguire solamente la
richiesta termica della tenuta e il secondo, denominato “Choice” (CH), dove la priorità è sempre data
alla richiesta termica, ma è possibile incrementare la produzione di elettricità dissipando calore se
conveniente economicamente.
I parametri di interesse valutati dall’analisi economica sono il Valore Attuale Netto (VAN), il Tempo
di Ritorno (TR) semplice dell’investimento e il Tasso Interno di Rendimento (TIR).
I risultati della simulazione mostrano che: il VAN dell’investimento, considerando un orizzonte
temporale di 20 anni per l’impianto, è positivo per tutte le tecnologie investigate, raggiungendo valori
superiori a 1.3 milioni di euro in entrambi gli scenari; valori del TR oscillano tra 3.3 e 3.9 anni; il
TIR, considerato su un orizzonte di 5 anni, raggiunge valori compresi tra 9.52% ÷ 13.13% nel caso
HD e tra 11.36% ÷ 14.87% nel caso CH.
Ulteriore parametro considerato nell’analisi riguarda le emissioni evitate di CO2 in atmosfera. Dai
risultati dell’analisi, per il modello in considerazione, sostituendo l’utilizzo di GPL con biomassa
avicola per il riscaldamento degli stabili, le emissioni evitate di CO2 ammontano a 621.77 tonnellate
per anno. Inoltre, riducendo la quantità di elettricità prelevata dalla rete elettrica, considerando il
valore medio di emissioni del parco elettrico irlandese, il valore della quantità di emissioni evitate
deve essere incrementato a seconda dello scenario e della tecnologia considerati di un fattore
compreso tra 169.37 e 313.61 tonnellate per anno.
Per ultimo, a causa del grande numero di assunzioni adottate durante tutto lo sviluppo del modello, si
è operato uno studio sulla sensitività dei risultati ottenuti, variando tre parametri fondamentali
all’interno dell’analisi: la temperatura di riferimento all’interno degli stabili adibiti per gli animali, il
costo dei PL e il costo totale dell’investimento.
ix
Table of contents
Chapter 1: Introduction ....................................................................................................................... 1
1.1 Background .................................................................................................................................. 1
1.2 General overview ......................................................................................................................... 5
References ........................................................................................................................................... 6
Chapter 2: Literature review ............................................................................................................... 9
2.1 Overview of Conversion Technologies ........................................................................................ 9
2.1.1 Biochemical processes: Anaerobic Digestion ..................................................................... 10
2.1.1.1 Poultry litter Anaerobic Digestion ............................................................................... 10
2.1.2 Thermochemical processes: Combustion ............................................................................ 12
2.1.2.1 Fixed bed combustion systems..................................................................................... 12
2.1.2.2 Poultry litter fixed bed: large combustion plants ......................................................... 13
2.1.2.3 Fluidised Bed combustion systems .............................................................................. 14
2.1.2.4 Poultry litter Fluidised Bed: large combustion plants .................................................. 16
2.1.2.5 Small scale poultry litter fluidised bed combustion ..................................................... 17
2.1.3 Thermochemical processes: Pyrolysis ................................................................................ 19
2.1.3.1 Poultry litter pyrolysis tests .......................................................................................... 20
2.1.4 Thermochemical processes: Gasification ............................................................................ 21
2.1.4.1 Poultry litter and manure gasification .......................................................................... 21
2.1.5 Thermochemical processes: Direct liquefaction ................................................................. 24
2.1.6 Conclusions ......................................................................................................................... 24
2.2 Poultry litter fuel characterisation .............................................................................................. 25
2.3 Policies and Regulations ............................................................................................................ 30
2.3.1 Council Directive 91/676/EEC (Nitrates Directive) & Good Agricultural Practice for
Protection of Waters Regulations 2014 (S.I. No. 31 of 2014) ...................................................... 30
2.3.2 Regulation (EC) No 1069/2009 and Commission regulation (EU) No 142/2011 .............. 31
2.3.3 Commission regulation (EU) No 592/2014 ........................................................................ 32
2.3.4 European Union (Animal By-Products) regulations 2014 (S.I. No 187 of 2014) ............... 33
x
2.3.5 COM (2013) 919 final 2013/0442 (COD) .......................................................................... 33
2.3.6 Renewable Energy Feed in Tariff (REFIT) 3 ..................................................................... 33
2.3.7 EU Directive 2009/28/EC ................................................................................................... 34
2.3.8 National Renewable Energy Action Plan (NREAP) ........................................................... 35
2.3.9 Decision No 406/2009/EC .................................................................................................. 35
References ......................................................................................................................................... 37
Chapter 3: Techno-economic analysis ............................................................................................... 43
3.1 Poultry farm & plant layout ....................................................................................................... 44
3.1.1 Building characteristics ....................................................................................................... 44
3.1.2 Internal heat gains and lights .............................................................................................. 46
3.1.3 Ventilation and infiltration .................................................................................................. 46
3.1.4 Heating system & plant layout ............................................................................................ 47
3.2 Fluidised Bed Combustor & Co-generation unit ....................................................................... 52
3.2.1 Back Pressure Steam Turbine ............................................................................................. 54
3.2.2 Externally Fired Gas Turbine .............................................................................................. 55
3.2.3 Organic Rankine Cycle ....................................................................................................... 56
3.2.4 Plants results & off-design conditions ................................................................................ 57
3.3 CHP operation setting ................................................................................................................ 60
3.4 Economic Analysis .................................................................................................................... 63
References ......................................................................................................................................... 65
Chapter 4: Results and Discussion .................................................................................................... 67
4.1 Net Present Value ...................................................................................................................... 67
4.2 Pay Back period ......................................................................................................................... 68
4.3 Internal Rate of Return ............................................................................................................... 70
4.4 CO2 emissions avoided ............................................................................................................... 71
4.5 Sensitivity analysis results ......................................................................................................... 72
4.5.1 Indoor set temperature ........................................................................................................ 73
4.5.2 Poultry litter cost ................................................................................................................. 77
4.5.3 Investment cost ................................................................................................................... 80
References ......................................................................................................................................... 83
Chapter 5: Conclusions ...................................................................................................................... 85
1
Chapter 1: Introduction
1.1 Background
The Irish food and drink sector recorded the fifth consecutive year of growth in exports during 2014
with an estimated value of circa 10.5 billion euro. Poultry farming and industry represents almost the
3% of this income with an estimated poultry export value of 310 million euro during 2014 and with an
increase of 20% over 2013 (BordBia, 2015a).
According to the Department of Agriculture, Food & Marine (DAFM) data reported by BordBia,
(2015b), the number of poultry birds processed during 2014 in Ireland was approximately 76 million
heads. Of this amount, the majority was composed of broiler chickens (that accounted for 85%) which
represent also the major source of litter consumption (SEI, 2003), followed by turkeys at 8%, ducks at
5% and hens at 2% (BordBia, 2015b).
The Central Statistics Office (CSO)’s Census of Agriculture, published in 2012 showed that there
were slightly more than 8500 poultry farms in Ireland during 2010, revealing the activity being an
intensive agriculture practice within the Country carried out by a small number of specialised
producers (CSO, 2012).Concentrated poultry rearing activities such as the Irish case imply large
manure and litter production in relatively small areas with issues regarding their disposal process.
Poultry litter is the material that must be removed and replaced each time a flock of birds is reared and
sent to the processor. It consists of a mixture of bedding material (wood shavings, straw or paper),
feathers, manure, urine and food particles, with a consistency and physical appearance similar to a
mixture of wood chips and sawdust (Abelha et al., 2002, Lynch et al., 2013, SEI, 2003).
Available data, SEI (2003), estimates that the total amount of poultry litter generated in the Country
was approximately 140,000 tonnes per annum, and the National Waste Report of 2004 (EPA, 2004)
reported a production of 172,435 tonnes of litter per year. Poultry litter consumption could be roughly
evaluated using simple rules of thumb: for example, Lynch et al. 2013 reports a value of 1.4 tonnes of
poultry litter production per 1000 birds, while BHSL suggests that the litter produced by a poultry
house is approximately half the weight of the birds removed from the same house (www.bhsl.com).
Current practices in Ireland for litter disposal include re-use as a compost material for mushroom
production, land spreading on agricultural fields and stock piling (Leahy et al., 2007).
2
The majority of poultry litter is spread on farmland since it has long been recognised for its beneficial
fertilising impact on crop production and considered a relatively cheap source of nutrients. Poultry
litter increases the soil organic carbon content, increases soil porosity and enhances soil microbial
activity (Nyakatawa et al., 2001).
Mushroom compost is used to produce mushrooms, and depending on the producer, contains
approximately 20-30% poultry litter (SEI, 2003).
In the end, stock piling of manure is done when the weather is not suitable for land spreading or there
is insufficient available land (Leahy et al., 2007, Dimache et al., 2014).
In recent years, great concern has been developed on animal manure management and applications for
agricultural fields mainly because of human and environmental pollution.
For example, the Nitrates Directive (91/676/EEC), part of the larger Water Framework Directive
(2000/60/EC) was introduced providing guidelines for limiting water pollution produced from
agricultural sources. This Directive led the implementation of limits in fertiliser’s application in
agricultural fields, allowing land spreading only in certain periods during the year and laying down
requirements for manure management.
Kelleher et al. (2002) reports that over-application of poultry litter in agricultural crops can lead to an
increase in water nutrients resulting in eutrophication of water bodies, the spread of pathogens, air
pollution and emission of greenhouse gases; Leahy et al. (2007) adds also the possibility of heavy
metal contamination.
The stock piling practice can lead to environmental issues, causing bacteria to leach into the ground
water, release of carbon dioxide and ammonia into atmosphere and also the loss of manure nutrients
(Leahy et al., 2007, Kelleher et al., 2002).
Regarding human health pollution, a series of manure management practices and regulations has been
established with Regulation 1069/2009 and its amendments.
These challenges connected with environmental safety and human health have created opportunities
for possible applications of litter disposal and in particular for energy conversion; specifically the
biomass energy potential of litter and animal manure in general can lead to benefits in both the Irish
energy and wider European contexts.
Under the Renewable Energy Directive (EU Directive 2009/28/EC), Ireland has undertaken to reach a
16% share of renewable energy in gross final consumption (GFC) by 2020. This obligation is to be
met by 40% from electricity, 12% from heat and 10% from transport.
According to the National Renewable Energy Action Plan (NREAP), bioenergy is estimated to
contribute a significant role reaching those goals, sharing the 7.2% on the renewable electricity target,
the 82.2% on the renewable heat target and more than 90% on the renewable transport target.
3
In 2013 the primary renewable energy supply accounted for 911 ktoe (279 ktoe from biomass), with a
primary energy requirement of 13,332 ktoe and a total final consumption of 10,825 ktoe (total final
energy consumption of biomass equalled 203 ktoe) (SEAI).
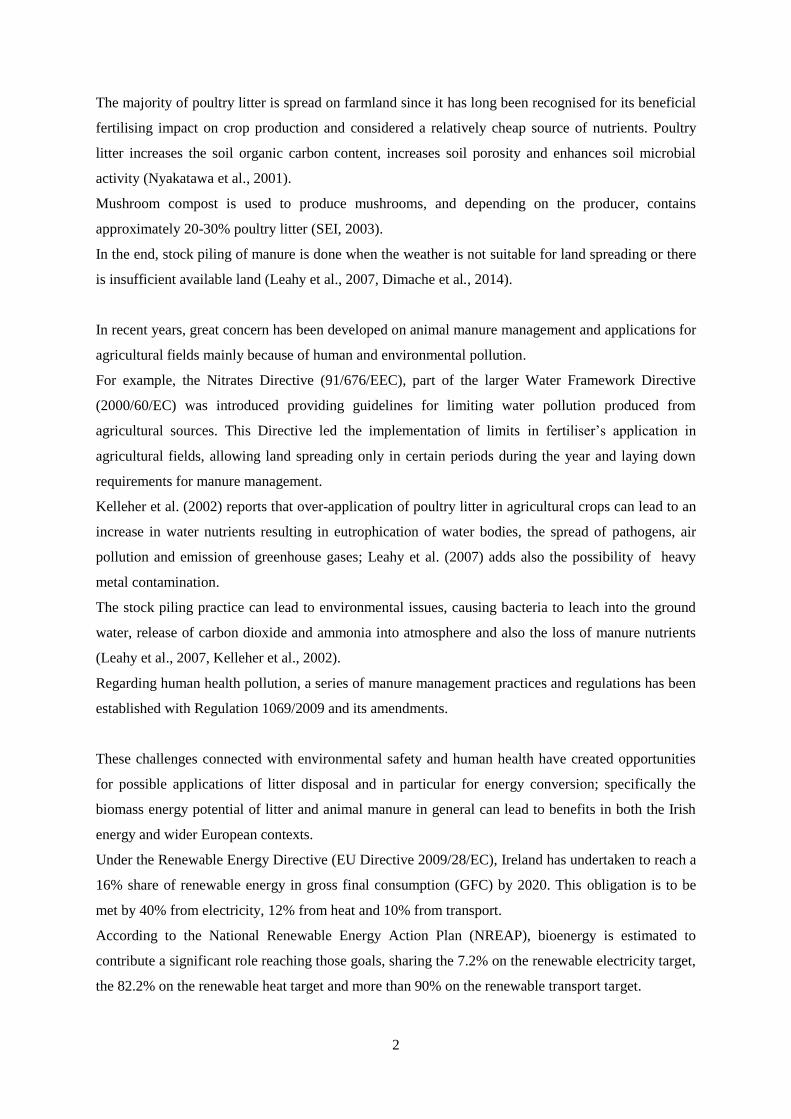
Data for 2013 revealed that renewable energy counted for circa 7.77% of the gross final consumption,
obtained by a share of 20.9% in the gross electricity consumption, 5.7% of the thermal energy and
2.8% of transport energy (SEAI). Figure 1.1 gives an overview from the period 2000-2013 of the
renewable energy share to the gross final consumption in Ireland.
Figure 1.1. Renewable energy contribution to final consumption - directive 2009/28/EC.
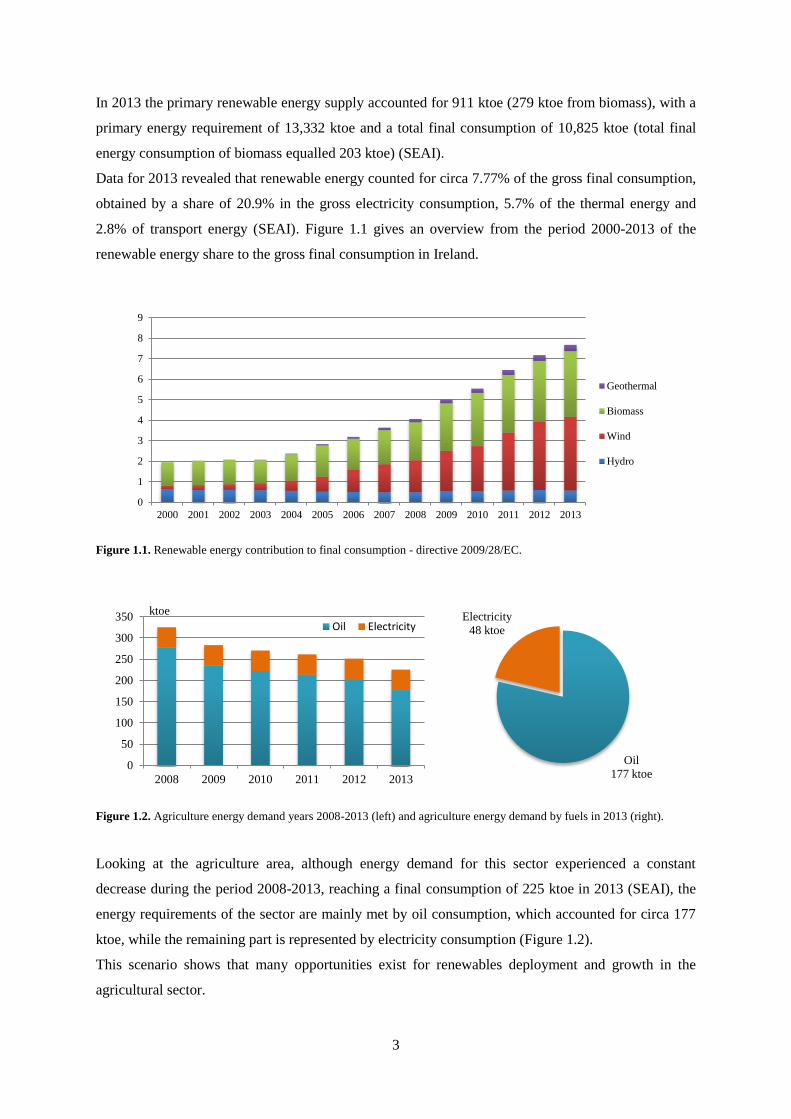
Figure 1.2. Agriculture energy demand years 2008-2013 (left) and agriculture energy demand by fuels in 2013 (right).
Looking at the agriculture area, although energy demand for this sector experienced a constant
decrease during the period 2008-2013, reaching a final consumption of 225 ktoe in 2013 (SEAI), the
energy requirements of the sector are mainly met by oil consumption, which accounted for circa 177
ktoe, while the remaining part is represented by electricity consumption (Figure 1.2).
This scenario shows that many opportunities exist for renewables deployment and growth in the
agricultural sector.
0
1
2
3
4
5
6
7
8
9
2000 2001 2002 2003 2004 2005 2006 2007 2008 2009 2010 2011 2012 2013
Geothermal
Biomass
Wind
Hydro
Oil
177 ktoe
Electricity
48 ktoe
0
50
100
150
200
250
300
350
2008 2009 2010 2011 2012 2013
ktoe
Oil Electricity
4
Additionally, Ireland submitted the EU’s Effort Sharing Decision (Decision No 406/2009/EC) which
set 2020 targets in greenhouse gas (GHG) emissions for the EU Member States.
These targets cover GHG limits from sectors that are not included in the EU Emissions Trading
Scheme (which include also agriculture) and Ireland’s target is to achieve a 20% reduction by 2020 on
2005 levels.
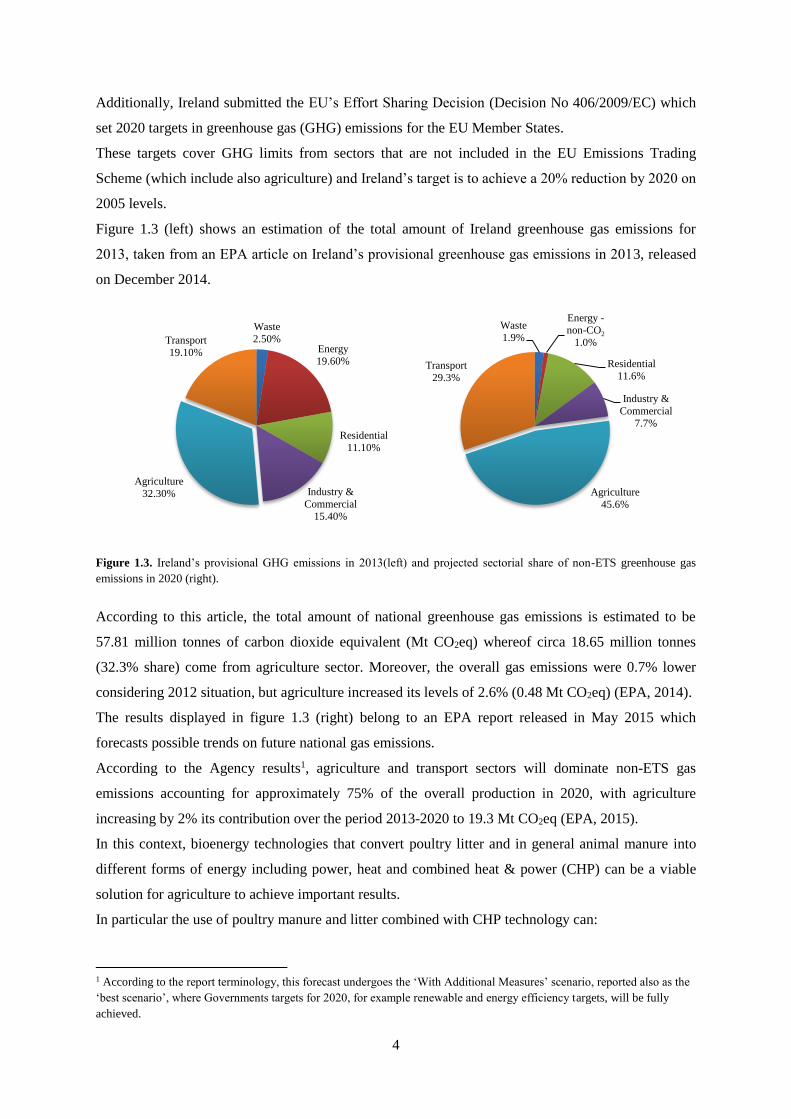
Figure 1.3 (left) shows an estimation of the total amount of Ireland greenhouse gas emissions for
2013, taken from an EPA article on Ireland’s provisional greenhouse gas emissions in 2013, released
on December 2014.
Figure 1.3. Ireland’s provisional GHG emissions in 2013(left) and projected sectorial share of non-ETS greenhouse gas
emissions in 2020 (right).
According to this article, the total amount of national greenhouse gas emissions is estimated to be
57.81 million tonnes of carbon dioxide equivalent (Mt CO2eq) whereof circa 18.65 million tonnes
(32.3% share) come from agriculture sector. Moreover, the overall gas emissions were 0.7% lower
considering 2012 situation, but agriculture increased its levels of 2.6% (0.48 Mt CO2eq) (EPA, 2014).
The results displayed in figure 1.3 (right) belong to an EPA report released in May 2015 which
forecasts possible trends on future national gas emissions.
According to the Agency results1, agriculture and transport sectors will dominate non-ETS gas
emissions accounting for approximately 75% of the overall production in 2020, with agriculture
increasing by 2% its contribution over the period 2013-2020 to 19.3 Mt CO2eq (EPA, 2015).
In this context, bioenergy technologies that convert poultry litter and in general animal manure into
different forms of energy including power, heat and combined heat & power (CHP) can be a viable
solution for agriculture to achieve important results.
In particular the use of poultry manure and litter combined with CHP technology can:
1 According to the report terminology, this forecast undergoes the ‘With Additional Measures’ scenario, reported also as the
‘best scenario’, where Governments targets for 2020, for example renewable and energy efficiency targets, will be fully
achieved.
Waste
1.9%
Energy -
non-CO2
1.0%
Residential
11.6%
Industry &
Commercial
7.7%
Agriculture
45.6%
Transport
29.3%
Waste
2.50%Energy
19.60%
Residential
11.10%
Industry &
Commercial
15.40%
Agriculture
32.30%
Transport
19.10%
5
Reduce environmental impact (reducing emissions, pollution and pathogenic contamination
that can derive from manure management and use as a fertiliser);
Provide energy security;
Increase the use of renewable resources to produce energy;
Turn the litter disposal from a cost into an income stream from selling energy and by-
products.
1.2 General overview
The general aim of this research work is to perform a techno-economic analysis of a small-scale co-
generation plant based on a fluidised bed combustion system, in order to understand the feasibility
and opportunity for deploying technologies able to provide heat and electricity using poultry litter as a
feedstock. Together with this main purpose, there was also the intent to provide a brief overview on
current energy conversion technologies available for animal waste/manure in order to understand the
possible alternatives for poultry litter combustion and possible trends for the future. In order to
succeed on this aim the following objectives were specified:
Identify and compare the range of technologies available for animal manure and in particular
for poultry litter energy conversion processes;
Identify related policies and regulations for Ireland and European Union;
Analyse the economic viability of a cogeneration plant based on a fluidised bed combustion
system installed in a Irish farm;
Assess a potential environmental impact from the analysis.
The methodology used in this project for reaching those objectives includes:
Literature review of the state-of-the art technologies for energy conversion processes for
animal manure and in particular for poultry litter;
Review of European and Irish policies and regulations related with the topic;
Produce an economic model evaluating the Internal Rate of Return, Net Present Value and
Pay Back period for a co-generation plant based on a fluidised bed combustor;
Evaluate the CO2 emission savings achievable with the co-generative fluidised bed
installation.
6
References
BordBia, Irish Food Board. (2015a). Export, Performance & Prospects, Irish food, drink &
horticulture 2014-2015, available at:
http://www.bordbia.ie/industry/manufacturers/insight/publications/MarketReviews/Documents/Export
-Performance-and-Prospects-2015.pdf. (Last access 01/10/2015).
BordBia, Irish Food Board. (2015b). Meat and Livestock Review & Outlook 2014/2015, available at:
http://www.bordbia.ie/industry/buyers/industryinfo/meat/Documents/MeatandLivestockReviewandOu
tlook2014to2015.pdf. (Last access 26/08/2015).
Central Statistics Office (CSO). (2012). Census of Agriculture 2010.
Sustainable Energy Ireland (SEI). (2003). An Assessment of the Renewable Energy Resource
Potential of Dry Agricultural Residues in Ireland.
Abelha P., Gulyurtlu I., Boavida D., Seabra Barros J., Cabrita I., Leahy J., Kelleher B., Leahy M.
(2003). Combustion of poultry litter in a fluidised bed combustor. Fuel, 82, 687-692, Elsevier.
Lynch Deirdre, Henihana Anne Marie, Bowen Barry, Lynch Declan, McDonnell Kevin, Kwapinski
Witold, Leahy J.J. (2013). Utilisation of poultry litter as an energy feedstock. Biomass and Bioenergy,
49, 197-204, Elsevier.
Environmental Protection Agency (EPA), National Waste Report 2004, available at:
http://www.epa.ie/pubs/reports/waste/stats/nationalwastereport2004.html#.VbD05vlVhBc.
(Last access 12/08/2015).
BHSL. http://www.bhsl.com/poultry-home-page/producing-your-own-fuel/. (Last access 02/10/2015).
Leahy M. J., Henihan A. M., Kelleher B. P., Leahy J.J., O’Connor J. (2007). Mitigation of large-scale
organic waste damage incorporating a demonstration of a closed loop conversion of poultry waste to
energy at the point of source. Environmental Protection Agency, Environmental RTDI Programme
2000-2006.
Nyakatawa E., Reddy K., Sistani, K. (2001). Tillage, cover cropping, and poultry litter effects on
selected soil chemical properties. Soil and Tillage Research, 58, 69-79, Elsevier.
Dimache A., O’Connor J., Kearney D. (2014). Environmental Analysis of the Use of Poultry Manure
as Fuel for Combustion on Broiler Farms: A Case Study. World expo for animal husbandry and
processing, Utrecht, Netherlands.
Kelleher B.P., Leahy J.J., Henihan A.M., O’Dwyer T.F., Sutton D., Leahy M.J. (2002). Advances in
poultry litter disposal technology – a review. Bioresource Technology, 83, 27-36, Elsevier.
Nitrates Directive (91/676/EEC), available at:
http://eur-lex.europa.eu/legal-content/en/TXT/?uri=CELEX:31991L0676. (Last access 02/10/2015).
Regulation (EC) No 1069/2009 of the European Parliament and of the Council, available at:
http://eur-lex.europa.eu/LexUriServ/LexUriServ.do?uri=OJ:L:2009:300:0001:0033:EN:PDF.
(Last access 25/07/2015).
7
Directive 2009/28/EC, available at:
http://eur-lex.europa.eu/legal-content/EN/TXT/?qid=1443731364498&uri=CELEX:32009L0028.
(Last access July 2015).
Ireland’s National Renewable Energy Action Plan (NREAP). (2010), available at:
http://www.dcenr.gov.ie/energy/en-ie/Renewable-Energy/Pages/Action-Plan.aspx.
(Last access 01/10/2015).
Sustainable Energy Authority of Ireland (SEAI), Energy Statistics Portal, available at:
http://statistics.seai.ie/overview.php. (Last access 08/09/2015).
Environmental Protection Agency (EPA). (2014). Ireland’s Provisional Greenhouse Gas Emissions in
2013, 3rd December.
Environmental Protection Agency (EPA). (2015). Ireland’s Greenhouse Gas Emission Projections
2014-2035, 18th May.
Foged Henning Lyngsø, Flotats Xavier, Bonmati Blasi August, Palatsi Jordi, Magri Albert, Schelde
Karl Martin. (2011). Inventory of manure processing activities in Europe. Technical Report No. I
concerning “Manure Processing Activities in Europe” to the European Commission, Directorate-
General Environment. 138 pp.

8
9
Chapter 2: Literature review
2.1 Overview of Conversion Technologies
The aim of this paragraph is to provide a general overview of the current co-generation technologies
capable to process animal manure and in particular poultry litter; the analysis intention is to
understand the basic characteristics of the different technologies and try to evaluate the best
conversion procedure and possible alternatives to combustion.
Since poultry litter is considered a biomass source, the first step undertaken was the identification of
the general range of biomass energy conversion processes suitable for heat and electricity production;
basically, these include a primary conversion technology that converts the raw material into an energy
vector, such as hot water, steam, gaseous or liquid products and a secondary conversion technology
that transforms these products into heat and electricity inside a CHP unit (Dong et al., 2009).
Following this partition, the analysis reported on this paragraph refers only to the first process and not
towards the entire system.
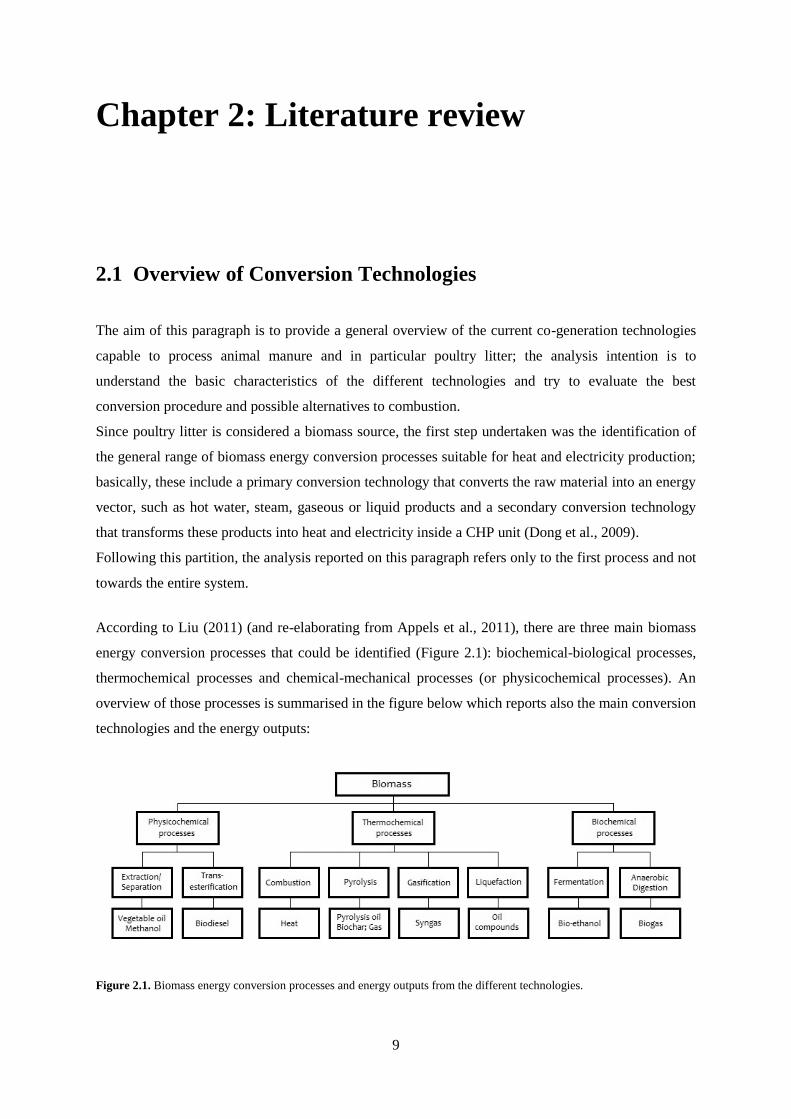
According to Liu (2011) (and re-elaborating from Appels et al., 2011), there are three main biomass
energy conversion processes that could be identified (Figure 2.1): biochemical-biological processes,
thermochemical processes and chemical-mechanical processes (or physicochemical processes). An
overview of those processes is summarised in the figure below which reports also the main conversion
technologies and the energy outputs:
Figure 2.1. Biomass energy conversion processes and energy outputs from the different technologies.

10
Biochemical conversion processes include two main conversion technologies: fermentation and
anaerobic digestion. While the latter procedure shares the majority of the manure energy conversion
market (Foged et al., 2011), poor literature was found for the first method and for this reason manure-
to-bioethanol technologies are not further investigated.
Thermochemical processes include four main procedures: combustion, pyrolysis, gasification and
liquefaction; a brief review is provided for the last three technologies while a more accurate
description is assessed for the combustion process.
The last category (physicochemical processes) includes two main practices: extraction or separation
and transesterification. Currently publish literature was not found for manure processing with those
two methods and as such were neglected from the analysis.
2.1.1 Biochemical processes: Anaerobic Digestion
The anaerobic digestion (AD) is a conversion process operated by diverse microbial population in
absence of oxygen and is a well-known procedure for a wide range of biomass material and especially
for animal wastes such as slurry or manure (Al Seadi and Lukehurst, 2012, Zupančič and Grilc, 2012).
It consists of the biological degradation of complex organic compounds through four mainly
metabolic reactions (hydrolysis, acidogenesis, acetogenesis and methanogenesis), resulting in biogas
and other energy-rich organic compounds (digestate) production (Zupančič and Grilc, 2012, Liu,
2011, Khalid et al., 2011). Usually animal manure is co-digested with other biomass feedstock, which
means that different biomass wastes are mixed together in the anaerobic digester; this treatment
imparts many process benefits such as the enhancement of biogas production and dilution of toxic
compounds (Al Seadi and Lukehurst, 2012, Khalid et al., 2011). Several types of anaerobic reactors
have been developed and also several classifications could be find in literature generally based on
critical operating parameters or reactor design (Khalid et al., 2011, Zupančič and Grilc, 2012, Li et al.,
2011, DARD and AFBI, 2012). Of particular interest for the analysis is the reactor classification
derived from the feedstock solid content (or dry matter DM) which differentiates “wet” from “dry”
digesters. There is not a consistent opinion in the literature for how to distinguish the two categories.
For example, according to Luning et al. (2003) "wet" reactors are designed for feedstock containing
less than 10-15% of DM while "dry" digesters are intended for 24-40% of DM, whereas Li et al.
(2011) reports that “dry” processes are characterized by solid content greater than 15%.
2.1.1.1 Poultry litter Anaerobic Digestion
According to Kelleher et al. (2002), the anaerobic digestion is considered a relatively efficient
conversion process for poultry litter, producing a collectable biogas mixture with an average methane
content of 60% and a stable residual sludge that can be used as a soil fertiliser. The poultry litter
11
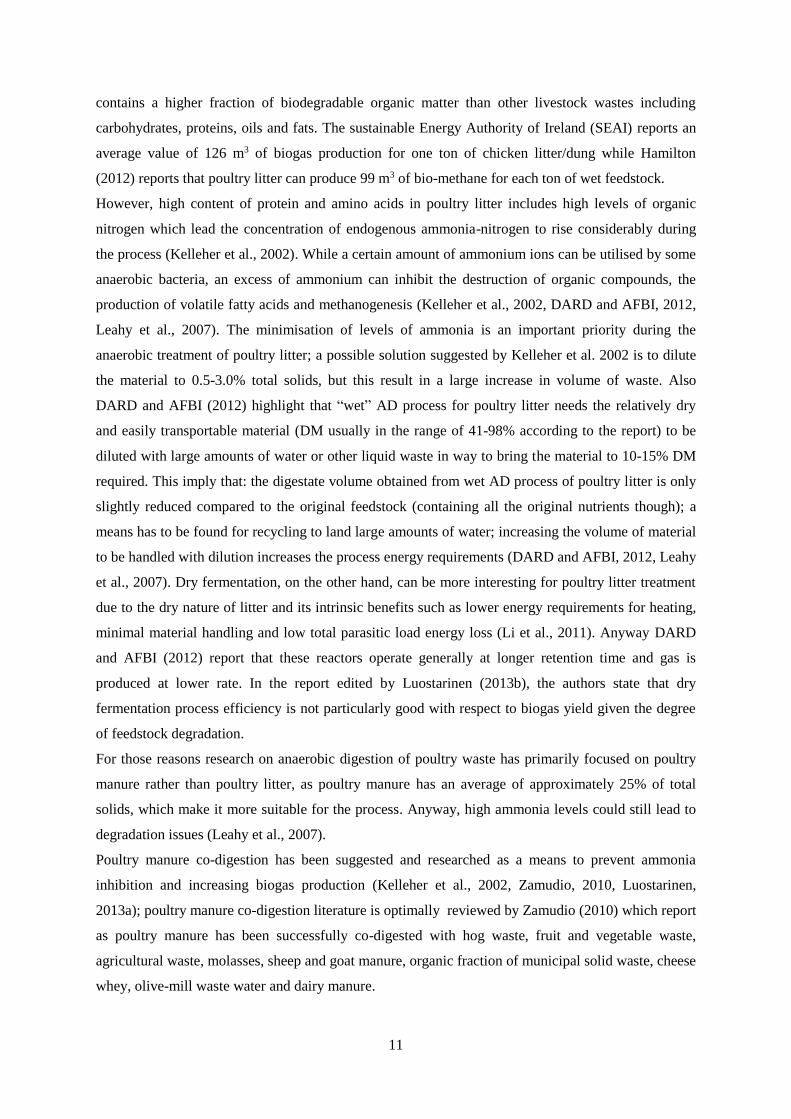
contains a higher fraction of biodegradable organic matter than other livestock wastes including
carbohydrates, proteins, oils and fats. The sustainable Energy Authority of Ireland (SEAI) reports an
average value of 126 m3 of biogas production for one ton of chicken litter/dung while Hamilton
(2012) reports that poultry litter can produce 99 m3 of bio-methane for each ton of wet feedstock.
However, high content of protein and amino acids in poultry litter includes high levels of organic
nitrogen which lead the concentration of endogenous ammonia-nitrogen to rise considerably during
the process (Kelleher et al., 2002). While a certain amount of ammonium ions can be utilised by some
anaerobic bacteria, an excess of ammonium can inhibit the destruction of organic compounds, the
production of volatile fatty acids and methanogenesis (Kelleher et al., 2002, DARD and AFBI, 2012,
Leahy et al., 2007). The minimisation of levels of ammonia is an important priority during the
anaerobic treatment of poultry litter; a possible solution suggested by Kelleher et al. 2002 is to dilute
the material to 0.5-3.0% total solids, but this result in a large increase in volume of waste. Also
DARD and AFBI (2012) highlight that “wet” AD process for poultry litter needs the relatively dry
and easily transportable material (DM usually in the range of 41-98% according to the report) to be
diluted with large amounts of water or other liquid waste in way to bring the material to 10-15% DM
required. This imply that: the digestate volume obtained from wet AD process of poultry litter is only
slightly reduced compared to the original feedstock (containing all the original nutrients though); a
means has to be found for recycling to land large amounts of water; increasing the volume of material
to be handled with dilution increases the process energy requirements (DARD and AFBI, 2012, Leahy
et al., 2007). Dry fermentation, on the other hand, can be more interesting for poultry litter treatment
due to the dry nature of litter and its intrinsic benefits such as lower energy requirements for heating,
minimal material handling and low total parasitic load energy loss (Li et al., 2011). Anyway DARD
and AFBI (2012) report that these reactors operate generally at longer retention time and gas is
produced at lower rate. In the report edited by Luostarinen (2013b), the authors state that dry
fermentation process efficiency is not particularly good with respect to biogas yield given the degree
of feedstock degradation.
For those reasons research on anaerobic digestion of poultry waste has primarily focused on poultry
manure rather than poultry litter, as poultry manure has an average of approximately 25% of total
solids, which make it more suitable for the process. Anyway, high ammonia levels could still lead to
degradation issues (Leahy et al., 2007).
Poultry manure co-digestion has been suggested and researched as a means to prevent ammonia
inhibition and increasing biogas production (Kelleher et al., 2002, Zamudio, 2010, Luostarinen,
2013a); poultry manure co-digestion literature is optimally reviewed by Zamudio (2010) which report
as poultry manure has been successfully co-digested with hog waste, fruit and vegetable waste,
agricultural waste, molasses, sheep and goat manure, organic fraction of municipal solid waste, cheese
whey, olive-mill waste water and dairy manure.
12
In general, retention times for digestion substrates strongly depend on type of process, type of
feedstock and operational temperatures. Typically hydraulic retention times2 for anaerobic digestion
processes range between 10-40 days (Zupančič and Grilc, 2012), while Sakar (2009) reviewed the
anaerobic digestion in poultry and livestock waste treatment and found HRTs from 13.2 hours for
poultry waste water up to 91 days for co-digestion of broiler manure.
Finally, Bijman (2014) asserts that AD of poultry litter produce biogas with high values of hydrogen
sulphide and so cooling and cleaning is highly recommended due to the very corrosive effect of
hydrogen sulphide (H2S) when it interacts with water (SEAI).
2.1.2 Thermochemical processes: Combustion
Combustion is the most developed and most frequently applied process used for solid biomass fuels
because of its low costs and high reliability (IEA, Task 32). Generally, combustion is an exothermic
redox chemical reaction in which the fuel is completely oxidized by an oxidant mean (usually oxygen
from air). There are three main stages occurring during biomass combustion: drying, pyrolysis and
reduction, and combustion of volatile gases and solid char (Zhang et al., 2010). The biomass first
loses its moisture at temperatures up to 100°C, using heat from other particles that release their heat
value. As the dried particle heats up, volatile gases containing hydrocarbons, CO, CH4 and other
gaseous components are released. In a combustion process, these gases contribute about 70-75% of
the heating value of the biomass (Zhang et al., 2010, Liu, 2011). Finally, char oxidises (char
combustion is the slowest of the stages and a sufficient combustion time has to be provided for its
combustion) and inert matter becomes clinker, slag or bottom ash (Liu, 2011, IEA, Task 32).
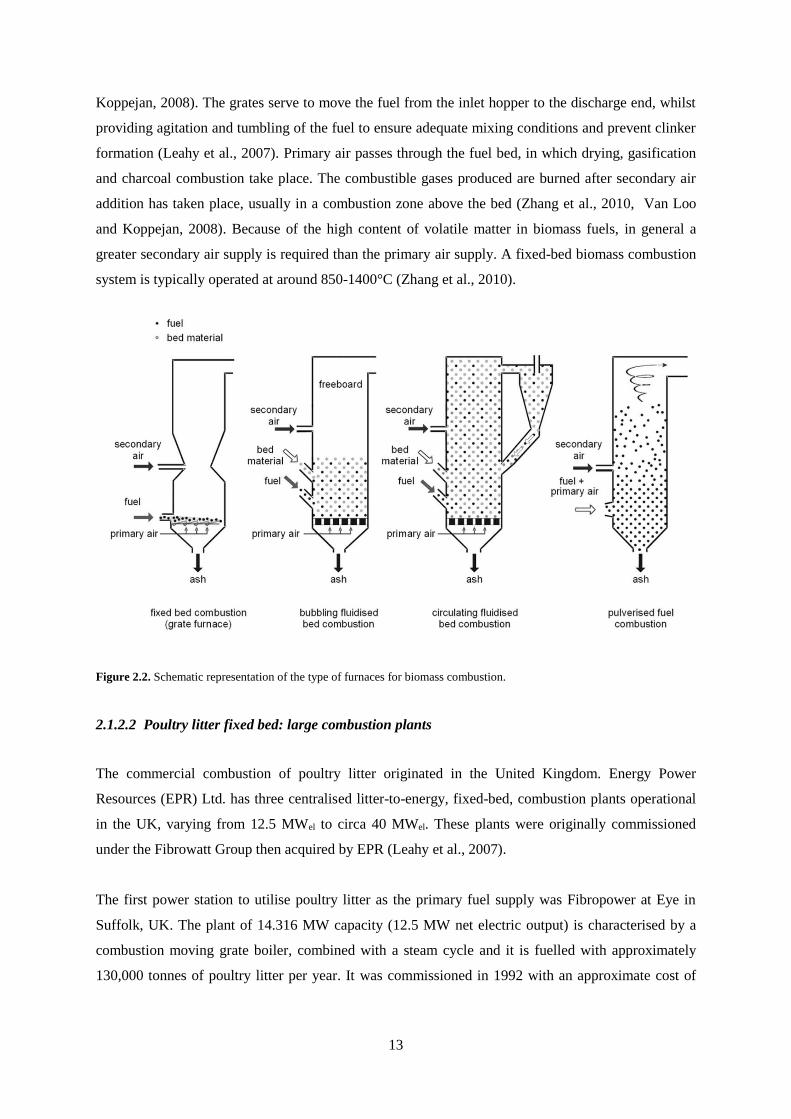
According to Zhang et al. (2010) and Van Loo and Koppejan (2008) there are three main types of
combustors used for biomass combustion (with nominal thermal capacity exceeding 100 kW): fixed
bed, fluidized bed and entrained flow (or pulverized fuel) combustors (Figure 2.2).
In the following, only a brief description is provided for fixed-bed furnaces, giving more attention on
fluidised bed combustion technologies, while entrained flow combustors are not taken into account
due to their high constrain on fuel quality. Anyway detailed information for all those categories could
be found in Zhang et al. (2010) and especially in Van Loo and Koppejan (2008).
2.1.2.1 Fixed bed combustion systems
Fixed bed combustion systems consist mainly of grate-based combustors, the design and
configuration of which dictate the system classification (further details could be found in Van Loo and
2 The hydraulic retention time (HRT) is a measure to describe the average time that a certain substrate resides in
a digester and usually is expressed in hours or days (Nayono, 2009).
13
Koppejan, 2008). The grates serve to move the fuel from the inlet hopper to the discharge end, whilst
providing agitation and tumbling of the fuel to ensure adequate mixing conditions and prevent clinker
formation (Leahy et al., 2007). Primary air passes through the fuel bed, in which drying, gasification
and charcoal combustion take place. The combustible gases produced are burned after secondary air
addition has taken place, usually in a combustion zone above the bed (Zhang et al., 2010, Van Loo
and Koppejan, 2008). Because of the high content of volatile matter in biomass fuels, in general a
greater secondary air supply is required than the primary air supply. A fixed-bed biomass combustion
system is typically operated at around 850-1400°C (Zhang et al., 2010).
Figure 2.2. Schematic representation of the type of furnaces for biomass combustion.
2.1.2.2 Poultry litter fixed bed: large combustion plants
The commercial combustion of poultry litter originated in the United Kingdom. Energy Power
Resources (EPR) Ltd. has three centralised litter-to-energy, fixed-bed, combustion plants operational
in the UK, varying from 12.5 MWel to circa 40 MWel. These plants were originally commissioned
under the Fibrowatt Group then acquired by EPR (Leahy et al., 2007).
The first power station to utilise poultry litter as the primary fuel supply was Fibropower at Eye in
Suffolk, UK. The plant of 14.316 MW capacity (12.5 MW net electric output) is characterised by a
combustion moving grate boiler, combined with a steam cycle and it is fuelled with approximately
130,000 tonnes of poultry litter per year. It was commissioned in 1992 with an approximate cost of
14
£22 million. The poultry litter necessary for running the plant is collected from 100 farms, within a 50
km range (Bridgwater et al., 2011, Leahy et al., 2007).
The second power plant was commissioned at the end of 1993 at Glanford, UK at a cost of
approximately £24 million. It consists of a furnace equipped with a spreader stoker coupled with a
steam cycle for the electricity production; it was designed to annually combust 150,000 tonnes of
poultry litter, straw and wood shavings in order to generate a net electrical output of 13.5 MWel (16.7
MW of gross capacity). The unit operated consistently at temperatures over 850°C, with a feed rate of
24 tonnes per hour. Boiler efficiency was approximately 27.3%, with low excess air levels and
comparatively low exit flue gas temperatures (Bridgwater et al., 2011, Leahy et al., 2007).
The third power station was commissioned in 1998 at Thetford at a cost of approximately £70,000.
The plant consumes approximately 400,000 tonnes of poultry litter along with 60,000 tonnes of
woodchips and other biomass residues per year, generating a net electric output of 38.5 MWel. It is
composed by a combustion moving grate (feeders transfer litter at a rate of 55 tonnes per hour)
combined with a steam cycle (Bridgwater et al., 2011, Leahy et al., 2007).
2.1.2.3 Fluidised Bed combustion systems
Fluidised Bed Combustion (FBC) is a recognised technology capable of burning a wide range of fuels
in an environmentally and efficient manner (Leahy et al., 2007). It generally consists of a cylindrical
vessel with a perforated plate filled with a bed of inert and granular material (usually silica sand and
dolomite) (IEA, Task 32, Leahy et al., 2007). The fluidisation consists in the suspension of the bed-
particles due to the upward flow of the primary combustion air entering from the bottom of the
furnace through an air distribution plate: in this way the bed becomes a seething mass of particles and
bubbles. Depending on the fluidisation velocity, different fluidised bed regimes can be obtained for
the particle suspension but in practice FBC systems can be divided into bubbling fluidised bed (BFB)
and circulating fluidised bed (CFB) (Zhang et al., 2010, Van Loo and Koppejan, 2008, Leahy et al.,
2007). In BFB, bed material is located in the bottom part of the furnace (the height of the solids above
the distributor plate is called the bed height) and is usually composed by silica sand of about 0.5-1.0
mm in diameter. The fluidisation velocity of the air varies between 1.0 and 2.0 m/s according to Van
Loo and Koppejan (2008) (value of 0.5 m/s is observed by Lynch et al., 2013b) while the secondary
air is introduced through several inlets at the beginning of the upper part of the furnace (called
freeboard).
Instead, in CFB fluidizing velocity is increased to values between 5-10 m/s and usually smaller sand
particles (0.2-0.4mm in diameter) are used. With those values of fluidised air velocity, the sand
particles are elutriated out of the bed, carried with the flue gas into a hot cyclone and fed back into the
combustion chamber.
15
The sand used in FBC systems represents about 95 to 99% of the bed material, while the fuel makes
up the remainder (Van Loo and Koppejan, 2008, Leahy et al., 2007).
The intimate mixing enhanced by the fluidised bed provides intense heat transfer characteristics
between the fuel and the bed-particles and between them and the gas flow, allowing good conditions
for complete combustion with low excess air demand (between 110 and 120% for CFB and between
120 and 130% for BFB) and uniform temperatures (Zhang et al., 2010, Van Loo and Koppejan, 2008,
Leahy et al., 2007). Due to the higher turbulence in CFB furnaces, better heat transfer and a very
homogeneous temperature distribution in the bed are achieved with respect BFB. This is of advantage
for more stable combustion conditions and more control of air staging (Van Loo and Koppejan, 2008).
Operating temperatures are usually between 650-900°C according to Van Loo and Koppejan (2008)
or 700-1000°C according to Zhang et al. (2010) and have to be kept low in order to prevent ash
sintering in the bed (fixed bed combustion temperatures are usually 100-200°C higher than in FBC
units). According to Van Loo and Koppejan (2008) this can be achieved by internal heat exchanger
surfaces, by flue gas recirculation, by water injection or by sub-stoichiometric bed operation while
Leahy et al. (2007) states that bed temperature is stabilised by passing excess air through the bed or by
using heat exchanger tubes in the bed.
Due to the good mixing achieved, FBC plants can deal flexibly with various fuels mixtures but are
limited when it comes to fuel particle size and impurities contained in the fuel. Usually a particle size
below 40 mm is recommended for CFB units and below 80 mm for BFB units. Another critical point
is related to the utilisation of high alkali biomass fuels due to possible ash agglomeration. However,
BFB furnaces with low bed temperatures of 650-850°C can burn fuels with low ash-melting
temperature without any sintering problems in the bed (Van Loo and Koppejan, 2008).
The FBC design promotes the dispersion of incoming fuel with rapid heating to ignition temperature,
promoting sufficient residence times in the reactor for its complete combustion. In addition, the
surface of the burning fuel material is continuously abraded by the bed material, enhancing the rate of
new char formation and the rate of char oxidation (Leahy et al., 2007).
Fluidised bed combustion systems usually need an auxiliary burner for start-up operation in order to
bring the bed at the set temperature.
With regard to emissions, low NOx emissions can be achieved owing to good air staging, good
mixing, temperature control and a low requirement of excess air (Van Loo and Koppejan, 2008,
Leahy et al., 2007). Moreover the utilization of additives (e.g. limestone addition for S capture) works
well due to the good mixing behaviour. The low excess air quantities necessary increase combustion
efficiency and reduce the flue gas volume flow. One disadvantage of FBC plants is posed by the dust
loads entrained with the flue gas (especially high for CFB) that required gas cleaning systems before
they could be released from the stack. Bed material is also lost with the ash, making it necessary to
periodically add new material to the plant (Van Loo and Koppejan, 2008). Other disadvantages of
16
FBC with respect fixed bed furnaces can be identified in the higher pressure drop that has to be
overcome by the air fans for the bed fluidisation and the erosion problems caused by bed particles
rubbing the furnace surfaces (Leahy et al., 2007).
The major advantages of fluidized bed combustors can be summarised as follow:
Uniform temperature distribution due to intense solid mixing (no hot spots);
Large solid–gas exchange area by virtue of the small solids size;
High heat-transfer coefficients between bed and the heat exchanging surfaces;
The intense motion of the fluidized bed makes it possible to combust a wide range of fuels
having different sizes, shapes, moisture contents and heating values. The fuel supplied can be
either wet or dry and either a paste or a solid;
The high heat capacity of the fluidized bed permits stable combustion at low temperature, so
that the formation of thermal and prompt nitrogen oxides can be suppressed;
No moving parts in the combustion chamber.
Set against these advantages are the following disadvantages:
Solid separation or gas purification equipment required because of solids entrained by
fluidizing gas and the high dust load in the flue gas;
Erosion of internals resulting from high solids velocities;
Chance of de-fluidization due to agglomeration of solids;
High fan power demand due to fluidisation reasons.
2.1.2.4 Poultry litter Fluidised Bed: large combustion plants
Westfield Power Station in Fife, Scotland was the first plant to use a FBC system to burn poultry litter
to generate power. The project was developed by Energy Power Resources (EPR) Limited, at a cost of
£22 million and commenced operation in 2000 (Leahy et al., 2007).
The Westfield plant converts 115,000 tonnes of the litter per year into electricity and fertiliser ash. A
key feature at Westfield is the totally enclosed fuel store which incorporates an automated mixing
system and can hold 3,500 tonnes of poultry litter; this ensures that the plant can accept deliveries in
accordance with production cycles of the poultry farming industry. The poultry litter requires no pre-
treatment and is fed directly to the FBC, at a rate of 14 tonnes per hour via a semi-automatic crane to
a push floor feeder. The FBC is of the bubbling bed type and incorporates flue gas recycling for
17
combustion temperature control, hence, Flue gas emissions are typically less than half the limits set by
the Scottish Environmental Protection Agency (SEPA) (Bridgwater et al., 2011, Leahy et al., 2007).
The poultry litter combustion temperature is maintained at 850°C. The Westfield plant, which has a
net electricity output of 10 MWel generates around 87,000 MWh per year. The ash from the
combustor is extracted at four stages; the fluidised bed, the super-heater, the economiser and the bag
filter, and is pneumatically conveyed to a storage silo with a capacity of 200 tonnes. It is then sold as
a fertiliser (www.sesg.strath.ac.uk).
The BMC power plant in Moerdijk, Netherlands is the only power plant on the Europe mainland
fuelled by poultry litter (www.bmcmoerdijk.nl). It consists of a bubbling fluidized bed combustor,
followed by an energy recovery section (used for powering a steam Rankine cycle) and an intensive
flue gas cleaning installation, including an electrostatic precipitator (ESP), a semidry scrubber with
baghouse filter and a selective catalytic reductor (SCR). The installation has a net output of 31 MWel
with a net efficiency of approximately 28%.The efficiency is lower than that of comparable coal
plants, because the sticky nature of the ash and corrosiveness of the flue gas limit the steam
temperature in the boiler. As a consequence, the emissions of poultry manure combustion are higher
per kWh of electricity produced. The throughput of the installation is 440,000 tonnes per year of
poultry litter, originating from more than 600 chicken farms all over the Netherlands and 9300 tonnes
per year of silica sand for supplying bed material losses. The operative bed temperature of the furnace
ranges between 750-765°C while the freeboard temperature can reach up to 900°C (Billen et al.,
2015).
2.1.2.5 Small scale poultry litter fluidised bed combustion
The FBC characteristics highlighted in the previous paragraphs and in particular the technology
ability to handle low grade fuels represents a very interesting solution for poultry litter treatment on
farm-scale (Lynch et al., 2013a, Kelleher et al., 2002, Leahy et al., 2007).
According to Kelleher et al. (2002) fluidised bed technology can greatly facilitate the use of poultry
litter close to where it is produced, either on its own or mixed with other domestic or industrial waste,
to produce heat and power. Also Lynch et al. (2013a) assert that poultry litter could be a useful
biomass source where produced locally (transport off site is costly and fuel heavy) and FBC has the
ability to exploit its potential due to its capacity in operating on a small scale.
Lynch et al. (2013a) suggest that care must be taken to minimise harmful emissions during
combustion, and adequate dust collection must be employed, but the use of poultry litter in FBC has
several benefits such as reducing the waste to 10% of its original mass, mitigate the environmental
pollution caused by land spreading and concentrate nutrients in a sterile and easily transportable ash
(Lynch et al., 2013a).

18
Also Leahy et al. (2007) report that the combustion can reduce litter into a biologically sterile ash,
making pathologically contaminated material, such as poultry litter, suitable for final disposal (Leahy
et al., 2007), and according to Kelleher et al. (2002) use of FBC has the advantage of low cost
associated with fuel preparation, and operational flexibility with regard to ash collection.
Combustion studies of poultry litter alone or mixed with peat by 50% on weight basis were
undertaken by Abelha et al. (2003) in an atmospheric bubbling fluidised bed. The main parameters
investigated in the study were the influence of litter moisture content, the air staging in the combustor,
and the variations in excess air levels along the freeboard. Results of the test showed that co-
combustion of poultry litter alone or mixed in equal amounts with peat can be carried out in a
fluidised bed. The main problem associated with the combustion of poultry litter was the level of
moisture content which influenced its feeding to the combustor. If the moisture content was above
25%, the screw feeding technique was not found to operate smoothly to lead to a stable combustion.
The combustion efficiency was found to be improved with introducing part of the air as secondary to
the freeboard in stages and with some turbulence. The amounts of CO formed decreased considerably
when these steps were taken. The amounts NOx and N2O formed were also dependent on the staging
of the secondary air and were lower that the permitted emission values with the effective staging of
the secondary air (Abelha et al., 2003).
The table below (left) summarise some of the operating conditions of the BFB used during the tests
carried by (Abelha et al., 2003) while the table on the right shows some of the process conditions for a
200 kWth BFB combustor used by Lynch et al. (2013b) inspecting poultry litter ashes agglomeration
and deposition in the combustion process:
Table 2.1. Operative conditions for two BFB using poultry litter as a fuel (Abelha et al., 2003 (left), Lynch et al., 2013b
(right)).
Operating conditions Values
Bed temperature 1023-1123 K
Freeboard temperature 1103-1223 K
Chicken litter feed rate 4.0-8.0 kg/h
Peat feed rate 4.0 kg/h
Gas velocity 0.4-0.6 m/s
Excess air levels in the bed 5.0-12.0 %
Excess air levels in the riser 45.0-70.0 %
Average chicken litter
particle size 1.0 mm
Average peat particle size 2.5 mm
Bed height 200-300 mm
Average sand particle size 0.5 mm
The Sustainable Poultry Production thru’ Environmental Recycling (SUPPER) project, coordinated by
the Irish company BHSL and supported by the European Eco-Innovation programme, demonstrated
the feasibility of recycling poultry manure using small-scale fluidised bed combustors.
Operating conditions Values
Fuel feed rate (range) 60.2 (55-65) kg/h
PL particle size (range) 8.0 (6-8) mm
Sand particle size (range) 0.75 (0.55-0.95) mm
Bed pressure (range) 22 (17-23) mbar
Bed height 200 mm
Bed temperature (range) 655 (619-688) ºC
Freeboard temperature (range) 934 (898-994) °C
Inlet bag filters temperature 141 °C
Exit temperature 117 °C
Fluidizing air velocity 0.5 m/s
Secondary air velocity 1.11 m/s
Excess air 134.13 %
19
The achieved results from the project were the change in EU Animal By-Product (ABP) regulations to
facilitate the on-farm use of used poultry litter as an animal by-product and the installation of four
poultry litter combustion systems (http://ec.europa.eu/).
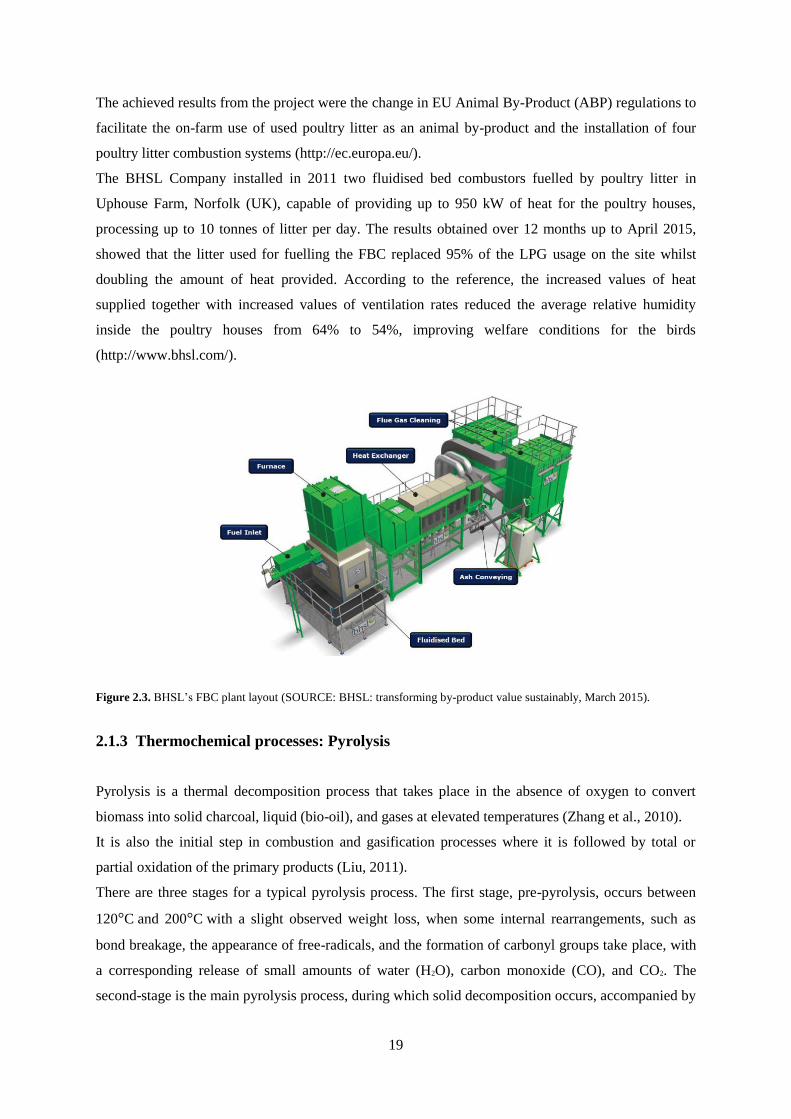
The BHSL Company installed in 2011 two fluidised bed combustors fuelled by poultry litter in
Uphouse Farm, Norfolk (UK), capable of providing up to 950 kW of heat for the poultry houses,
processing up to 10 tonnes of litter per day. The results obtained over 12 months up to April 2015,
showed that the litter used for fuelling the FBC replaced 95% of the LPG usage on the site whilst
doubling the amount of heat provided. According to the reference, the increased values of heat
supplied together with increased values of ventilation rates reduced the average relative humidity
inside the poultry houses from 64% to 54%, improving welfare conditions for the birds
(http://www.bhsl.com/).
Figure 2.3. BHSL’s FBC plant layout (SOURCE: BHSL: transforming by-product value sustainably, March 2015).
2.1.3 Thermochemical processes: Pyrolysis
Pyrolysis is a thermal decomposition process that takes place in the absence of oxygen to convert
biomass into solid charcoal, liquid (bio-oil), and gases at elevated temperatures (Zhang et al., 2010).
It is also the initial step in combustion and gasification processes where it is followed by total or
partial oxidation of the primary products (Liu, 2011).
There are three stages for a typical pyrolysis process. The first stage, pre-pyrolysis, occurs between
120°C and 200°C with a slight observed weight loss, when some internal rearrangements, such as
bond breakage, the appearance of free-radicals, and the formation of carbonyl groups take place, with
a corresponding release of small amounts of water (H2O), carbon monoxide (CO), and CO2. The
second-stage is the main pyrolysis process, during which solid decomposition occurs, accompanied by
20
a significant weight loss from the initially fed biomass. The last stage is the continuous
char devolatilization, caused by the further cleavage of C-H and C-O bonds (Zhang et al., 2010).
Depending on the reaction temperature and residence time, pyrolysis can be divided into fast
pyrolysis, intermediate pyrolysis, and slow pyrolysis. Fast pyrolysis has an extremely short residence
time (1-2 s) combined with temperatures of approximately 500°C. Short reaction times and elevated
temperature generally results in a higher yield of liquid product. Intermediate pyrolysis provides
moderate temperature (around 500°C) and moderate hot vapour residence times (10-20 seconds),
instead slow pyrolysis is characterized by low temperatures (around 400°C) and very long solids
residence times (hours or days) (IEA, Task 34, Zhang et al., 2010).
2.1.3.1 Poultry litter pyrolysis tests
In (DARD and AFBI, 2012) a fast pyrolysis system has been developed experimentally for poultry
litter, heating the fuel at 400°C for 1 minute, producing bio-char, bio oil and gases. However the
authors raise doubts about the possible use of bio-oil and bio-char produced by poultry litter at the
moment because they are virtually untested respectively as fuel and as soil fertiliser and there is not a
developed market for those products.
Serio et al. (2002) operated experimental pyrolysis test and studies on five samples of manure (2 of
chicken litter, 1 of turkey manure, 1 of cow manure and 1 of seabird manure). Experiments with two
two-stage pyrolysis reactors were performed at different temperatures for one sample of chicken litter,
proving the feasibility to produce a medium Btu fuel gas (350-550 Btu/ft3, 13.04-20.05 MJ/m3) from
pyrolysis of poultry manure.
Carta et al. (2012) presented the experimental results of dry fowl manure pyrolysis in a pilot plant,
working with slow, wet and catalytic pyrolysis process. Feed material had residence time of about 1.5
hours at 500°C. The gas production was about 0.6 kg per kg of solid with an LHV of 17.1 MJ/kg (the
average LHV of dry fowl manure (mean values of five samples) was 10.9 MJ/kg) while about 0.16 kg
of bio-char and inorganic components and 0.24 kg of aqueous condensate were produced.
Ro et al. (2010) used a commercial pilot-scale pyrolysis reactor system to produce combustible gas
and bio-char at 620°C from three sources (chicken litter, swine solids, mixture of swine solids with
rye grass). Feedstock were heated at a rate of 13°C/min and pyrolyzed for two hours in the reactor.
Gas, liquid, and solid end products from the system were collected and subsequently analysed for
their chemical and thermal properties. Bio-char yield ranged from 43 to 49% based on dry weight and
approximately 50% of the feedstock energy was retained in bio-char and 25% in produced
gas. According to the reference chicken litter produced gas and bio-char had an HHV of 15.0 ±
0.6 MJ/Sm3 and 13.5 ± 0.2 MJ/kg respectively.
21
The current literature on pyrolysis technologies for animal manures is almost solely based on results
from laboratory-scale, batch reactors, or micro-scale thermo-gravimetric analysers (Hollis et al.,
2013). Also Flotats et al. (2011) reports that pyrolysis of manure is on laboratory/research and pilot
plant stage and no full scale pyrolysis plant exists.
2.1.4 Thermochemical processes: Gasification
Biomass gasification is a process that converts carbonaceous biomass into combustible gases (e.g. H2,
CO, CO2, and CH4) in the presence of a partial oxygen supply (typically 35% of the O2 demanded for
complete combustion) or suitable oxidants such as steam and CO2 (Zhang et al., 2010). The purpose
of gasification is to create valuable gaseous products (usually called synthetic gas or syngas or
producer gas) that can be used directly for combustion, or be stored for other applications.
Gasification is made up of five discrete thermal processes: Drying (the process in which water present
in biomass is evaporated), Pyrolysis (biomass is pyrolized into medium-energy calorific volatile
gases, liquid and char), Combustion (oxidizing process with heat generation) , Cracking (the process
of breaking down large complex molecules such as tar into lighter gases by exposure to
heat), and Reduction (the oxygen stripping process of hydrocarbon (HC) molecules from combustion
products; reduction zone is where CO and H2 are produced) (Zhang et al., 2010).
Various types of gasifiers, different in design and operational characteristics, have been developed
and new gasifying reactors are under research.
Reactors can be differentiated by several parameters such as: gasifying agent, operating pressure and
source of heat that they require (Ruiz et al., 2013). However, they are usually divided into three main
categories: fixed-bed, fluidized bed and entrained flow gasifiers (Zhang et al., 2010, Balat et al.,
2009). According to Ruiz et al. (2013) the Twin-fluidised bed category can be added, which consists
mainly in coupling two interactive reactors: the first reactor is used for the pyrolysis process of the
fuel and is sustained by the heat provided by the other reactor which burns the char formed in the
previous one.
Due to the focus of this work on fluidised bed combustors, no further details will be reported on
gasification reactors. However, additional information may be found in Heidenreich and Foscolo
(2015), Zhang et al. (2010), Ruiz et al. (2013) and Balat et al. (2009).
2.1.4.1 Poultry litter and manure gasification
The interest in manure and litter gasification resides basically in the opportunity to convert a waste
material into a more valuable and high-quality energy fuel. This involves some benefits also
comparing with direct combustion of manure/litter. Syngas burning can achieve higher efficiencies
22
and better combustion control with respect to the direct combustion process, including limits in NOx,
sulphur, particulate and dioxins emissions. A brief review of some tests and trials are reported below.
In order to gasify biomass resources with high content of low melting ash compounds such as manure
fibres, sewage sludge, straw, organic waste, Pyroneer has developed a new type of gasifier known as
Low Temperature Circulating Fluidized Bed (LT-CFB), which is a combination of a fast pyrolysis in
a fast fluidized bed and subsequent char gasification in a slowly fluidized bubbling bed chamber. The
maximum temperature achieved in the process was kept below 750°C, below the melting point of the
ash components but requirements were necessary for fuel use, such as particle size (3-4 mm) and
limited water content (<30 wt%) (Ahrenfeldt et al., 2013, Møller, 2014).
An LT-FBC pilot gasifier of 500 kWth has been tested in Technical University of Denmark using
digested manure coming from a biogas plant subsequently dried and pelletized (Kuligowsky and
Luostarinen, 2011). Anyway the producer gas resulting from the process had got very high content of
tar particles rendering it unsuitable for synthesis processes, as well as fuel cell and gas engine
operation (anyway possible usage can be possible in co-combustion with coal) (Ahrenfeldt et al.,
2013).
Bench-scale testing was used to determine the feasibility of small-scale poultry litter gasification and
ash recovery by (Reardon et al., 2001). The feasibility to produce electric power in a Small Modular
System (SMS) using poultry litter as a fuel was demonstrated with a modified gasifier and a five-hour
power production test was successfully completed using poultry litter as a fuel.
A feasibility study was performed by Coaltec Energy (www.coaltecenergy.com) that demonstrated
economic viability of a bio-based fuel-to-energy system using poultry litter with a fixed-bed gasifier.
The project is the culmination of a research and development work for a poultry system, and included
commissioning, evaluation, and field testing of a gasification system specifically designed for the
poultry industry.
A techno-economic analysis of the production of biochar and heat and electricity from poultry litter is
reported by Huang et al. (2015). The study modelled and simulated the gasification system integrated
with an Organic Rankine Cycle. Results showed that is technically and economically feasible to use
poultry litter as the feedstock to generate biochar together with heat and power production; among the
options examined in the study, the combination of biochar production along with the possibility of
selling heat and electricity was the most financially attractive because of its highest profit margins
offering a significant CO2 saving opportunity. The simulation results showed that when a reference
poultry litter is used with a set feed rate of 1500 kg/h, the yield of biochar from the process is around
398 kg/h with 38% carbon content and the producer gas has a calorific value of 4.72 MJ/Nm3. The
total available heat waste recovered for space heating is estimated at 1831 kWhth and the electricity
generated by the ORC system is 388 kWhel. The results of the economic analysis suggest that when
paying £20/tonne for handling and storing the feedstock without any options of selling either heat or
23
electricity, the break-even selling price (BESP) of biochar is around £218/tonne. If the sale of
electricity and heat produced is considered to be around £60/MW he and £5/MW hth, the BESP will
decrease to £178/tonne. The case studies also indicate that when a gate fee of £10/tonne is introduced
the BESP can be further reduced to £65/tonne, equivalent to a 63% reduction.
A study conducted by Pandey et al. (2014) aimed to simulate the gasification process of poultry litter
in a downdraft gasifier with focus on energy recovery while investigating the effect of process
parameters on composition and quality of product gas and developing optimum conditions for thermo-
chemical conversion process. The results showed the optimum condition of poultry litter gasifier
should be in the temperature range of 700-850°C and equivalence ratio between 0.25-0.30.
Predictions showed that produced gas was nearly free from CH4 and tar and H2 yield increased with
temperature, moisture content and Steam to Biomass Ratio.
The authors suggest that in order to counteract fuel-ash induced in-bed agglomeration additives need
to be utilized with manure based biomass (to increase ash melting temperature).
In Yoshikawa and Hara (2008) a new gasification process for generating a fuel gas by high-
temperature air reforming of the pyrolysis gas produced by chicken manure was developed to drive a
dual-fuelled diesel engine for electricity and heat production. A commercial plant has been installed
with a capacity of 2 tons/day of dried chicken manure reaching 90 days of continuous operation and
55 days continuous operation for the diesel engine. The reactor was fed at a rate of 90 kg/h achieving
a syngas flow rate of 156 Nm3/h with an LHV of approximately 4 MJ/Nm3 and a small amount of tar;
The cold gas efficiency declared exceeded 70%. Issues outlined in the study were the low calorific
value of the produced gas and the fluctuation of gas heat value and flow rate.
Although great efforts are undertaken for exploiting the manure and litter gasification potential, there
are still some problems and drawbacks that must be overcome.
According to Ruiz et al. (2013) gasification plant operation is more complex than with combustion,
and it is sensitive to numerous parameters, which means that it may incur in unwanted operating
instabilities.
The same reference states that gasification is a complex technology that is inflexible, less competitive
than others, as yet not mature and, therefore, subject to certain risks.
Main problems for biomass gasification can be find in: fuel pre-treatment which usually requires
drying processes and sometimes grinding before conversion (Kuligowsky and Luostarinen, 2011,
Pereira et al., 2012); requirement of expensive equipment in order to free the synthesis gas from
contaminants, then further prevent pollution during combustion; and tar presence in the synthesis gas
despite special equipment and treatments (Pereira et al., 2012).
Pandey et al. (2014) report that poultry litter high amount of moisture and ash make it difficult to
gasify without continuous removal of ash. The presence of inorganic elements such as phosphorous,
potassium and calcium may cause agglomeration and blockage of bed problems.
24
According to DARD and AFBI (2012), gasification appears to offer most potential as an alternative to
fluidised bed combustion of poultry litter. The report identifies some issues and barriers that must be
taken into account for future deployment of this technology: the first is the little experience achieved
using poultry litter as a feedstock for thermal gasification; the second is the high energy requirements
for feedstock pre-treatment and gas cleaning; the last one is the lack of information on the properties
of the biochar as an end product of the process.
2.1.5 Thermochemical processes: Direct liquefaction
Direct liquefaction is a low-temperature and high pressure thermo-chemical process during which
biomass is broken down into fragments of small molecules in water or another suitable solvent (Zhang
et al., 2010, Smith and Keener, 2012). These light fragments, which are unstable and reactive, can
then re-polymerize into oily compounds with various ranges of molecular weights. Direct liquefaction
has some similarity with pyrolysis in terms of the target products (liquid products). However, they are
different in terms of operational conditions.
Specifically, direct liquefaction requires lower reaction temperatures but higher pressures than
pyrolysis (5-20MPa). In addition, drying of the feedstock is not a necessary step for direct
liquefaction, but it is crucial for pyrolysis. Moreover, catalysts are always essential for liquefaction,
whereas they are not as critical for pyrolysis. Compared with pyrolysis, liquefaction technology is
more challenging as it requires more complex and expensive reactors and fuel feeding systems (Zhang
et al., 2010).
Furthermore, liquefaction systems remain, for the most part, under research and development, and
systems for individual farm use are not commercially available (Smith and Keener, 2012).
2.1.6 Conclusions
A general review of the state of the art and the possible alternatives in biomass and litter conversion
technologies has been carried even though only few of these seem really attractive and competitive
when speaking of poultry litter treatment.
Anaerobic digestion at the moment does not appear to be an optimum solution for exploiting the full
potential of poultry litter. In general, this kind of process results more interesting for high moisture
biomass for which the energy required for drying is inordinately large compared to the energy content
of the product formed. With current wet technologies, poultry litter digestion alone needs large
volumes of water or other liquids to achieve the total solids threshold required, which lead the waste
volume treated to increase. High levels in ammonia production due to the high levels of nitrogen
present in poultry litter, could affect the digestion process and the biogas yield. Co-digestion could be
25
an alternative solution, increasing biogas yields and lowering ammonia effect, but could only be a
partial solution for the disposal of the large amount of litter produced.
Poultry litter is generally considered a ‘dry’ biomass resource which is usually considered more
suitable to thermochemical processes. Anyway, at the moment pyrolysis and gasification are not
mature technologies with respect poultry litter or manure conversion processes, leading to greater
costs of investment and high risks. Considering pyrolysis, other uncertainties grow with bio-oil and
bio-char use and/or trade. Gasification could increase its competitiveness in the future, but some
issues shown in the previous paragraphs need to be solved for this technology deployment.
In this context, combustion processes and, in particular the Fluidised Bed Combustion technology due
to its intrinsic characteristics, seems the most attractive procedure for exploiting the energy potential
of poultry litter.
2.2 Poultry litter fuel characterisation
The paragraph below intends to characterise poultry litter properties and highlight the main features in
relation to its use in combustion treatment. According to Liu (2011) there are three commonly
analysis adopted to characterise a solid biomass fuel: proximate analysis, ultimate analysis and
calorific value. Substantially the proximate analysis determines the contents of moisture, volatile
matter, ash and fixed carbon of the fuel of biomass (serves as a simple means for determining the
behaviour of a solid biomass fuel when is heated), the ultimate analysis evaluates the elemental
composition of the solid fuel substance while the calorific value measures the chemical energy stored
(Liu, 2011).
Due to the heterogeneous nature of poultry litter, parameter values for proximate and ultimate analysis
could vary considerably, especially considering moisture content and ash composition. Furthermore,
the composition of the material can vary significantly depending on the litter origin and management
practices of the farm (Font-Palma, 2012).
Proximate analyses of poultry litter samples on as received basis (ar) and on dry basis (db) are
displayed in Table 2.2 and Table 2.3 (see also Font-Palma, 2012, Dávalos et al., 2002 and Lynch et
al., 2013b).
Moisture content is one of the most important parameters to consider when characterising litter as a
fuel. A high moisture content affects the combustion properties of litter including lowering the
calorific value of the fuel, lowering the temperature inside the combustion unit and increasing the fuel
throughput and the volume of flue gas produced (Lynch et al., 2013a, Abelha et al., 2003).
Average values of moisture content in poultry litter samples shown in Table 2.2 are quite high and
range between 39.88 and 44.8% (ar). Results reported by Lynch et al. (2013a) are obtained from
samples of poultry litter mixed with wood shavings; values from Billen et al. (2015) were obtained
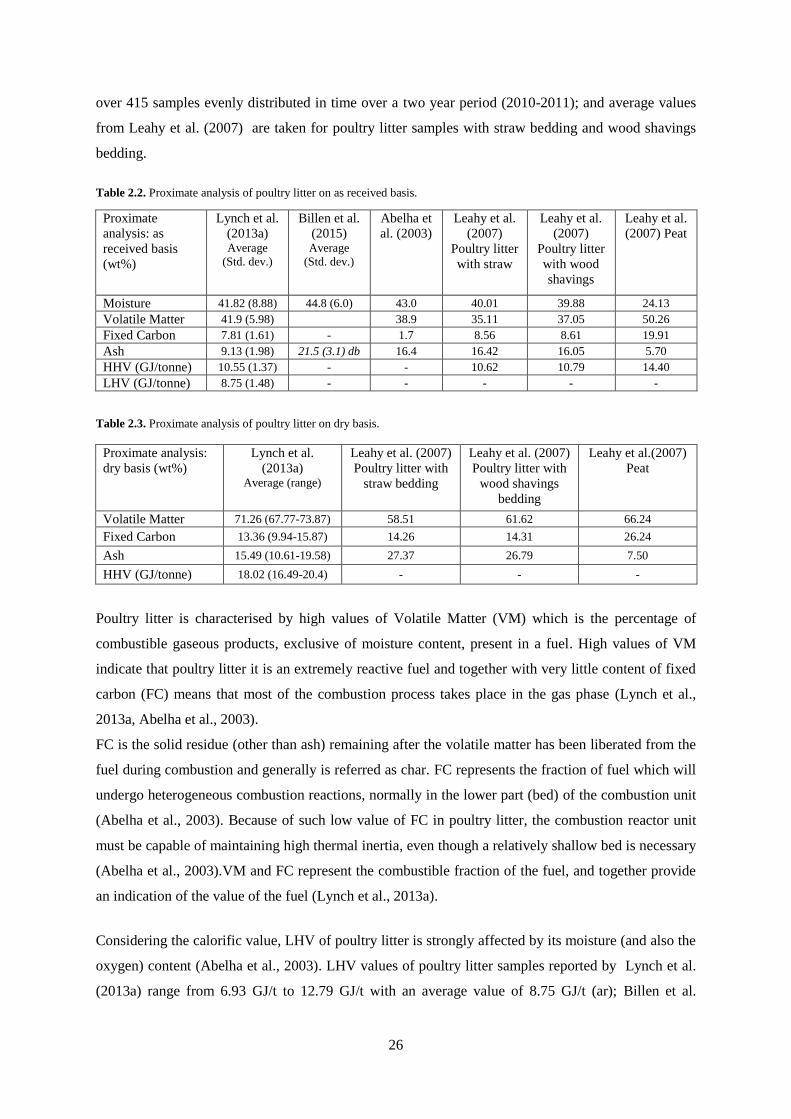
26
over 415 samples evenly distributed in time over a two year period (2010-2011); and average values
from Leahy et al. (2007) are taken for poultry litter samples with straw bedding and wood shavings
bedding.
Table 2.2. Proximate analysis of poultry litter on as received basis.
Table 2.3. Proximate analysis of poultry litter on dry basis.
Poultry litter is characterised by high values of Volatile Matter (VM) which is the percentage of
combustible gaseous products, exclusive of moisture content, present in a fuel. High values of VM
indicate that poultry litter it is an extremely reactive fuel and together with very little content of fixed
carbon (FC) means that most of the combustion process takes place in the gas phase (Lynch et al.,
2013a, Abelha et al., 2003).
FC is the solid residue (other than ash) remaining after the volatile matter has been liberated from the
fuel during combustion and generally is referred as char. FC represents the fraction of fuel which will
undergo heterogeneous combustion reactions, normally in the lower part (bed) of the combustion unit
(Abelha et al., 2003). Because of such low value of FC in poultry litter, the combustion reactor unit
must be capable of maintaining high thermal inertia, even though a relatively shallow bed is necessary
(Abelha et al., 2003).VM and FC represent the combustible fraction of the fuel, and together provide
an indication of the value of the fuel (Lynch et al., 2013a).
Considering the calorific value, LHV of poultry litter is strongly affected by its moisture (and also the
oxygen) content (Abelha et al., 2003). LHV values of poultry litter samples reported by Lynch et al.
(2013a) range from 6.93 GJ/t to 12.79 GJ/t with an average value of 8.75 GJ/t (ar); Billen et al.
Proximate
analysis: as
received basis
(wt%)
Lynch et al.
(2013a) Average
(Std. dev.)
Billen et al.
(2015) Average
(Std. dev.)
Abelha et
al. (2003)
Leahy et al.
(2007)
Poultry litter
with straw
Leahy et al.
(2007)
Poultry litter
with wood
shavings
Leahy et al.
(2007) Peat
Moisture 41.82 (8.88) 44.8 (6.0) 43.0 40.01 39.88 24.13
Volatile Matter 41.9 (5.98) 38.9 35.11 37.05 50.26
Fixed Carbon 7.81 (1.61) - 1.7 8.56 8.61 19.91
Ash 9.13 (1.98) 21.5 (3.1) db 16.4 16.42 16.05 5.70
HHV (GJ/tonne) 10.55 (1.37) - - 10.62 10.79 14.40
LHV (GJ/tonne) 8.75 (1.48) - - - - -
Proximate analysis:
dry basis (wt%)
Lynch et al.
(2013a) Average (range)
Leahy et al. (2007)
Poultry litter with
straw bedding
Leahy et al. (2007)
Poultry litter with
wood shavings
bedding
Leahy et al.(2007)
Peat
Volatile Matter 71.26 (67.77-73.87) 58.51 61.62 66.24
Fixed Carbon 13.36 (9.94-15.87) 14.26 14.31 26.24
Ash 15.49 (10.61-19.58) 27.37 26.79 7.50
HHV (GJ/tonne) 18.02 (16.49-20.4) - - -
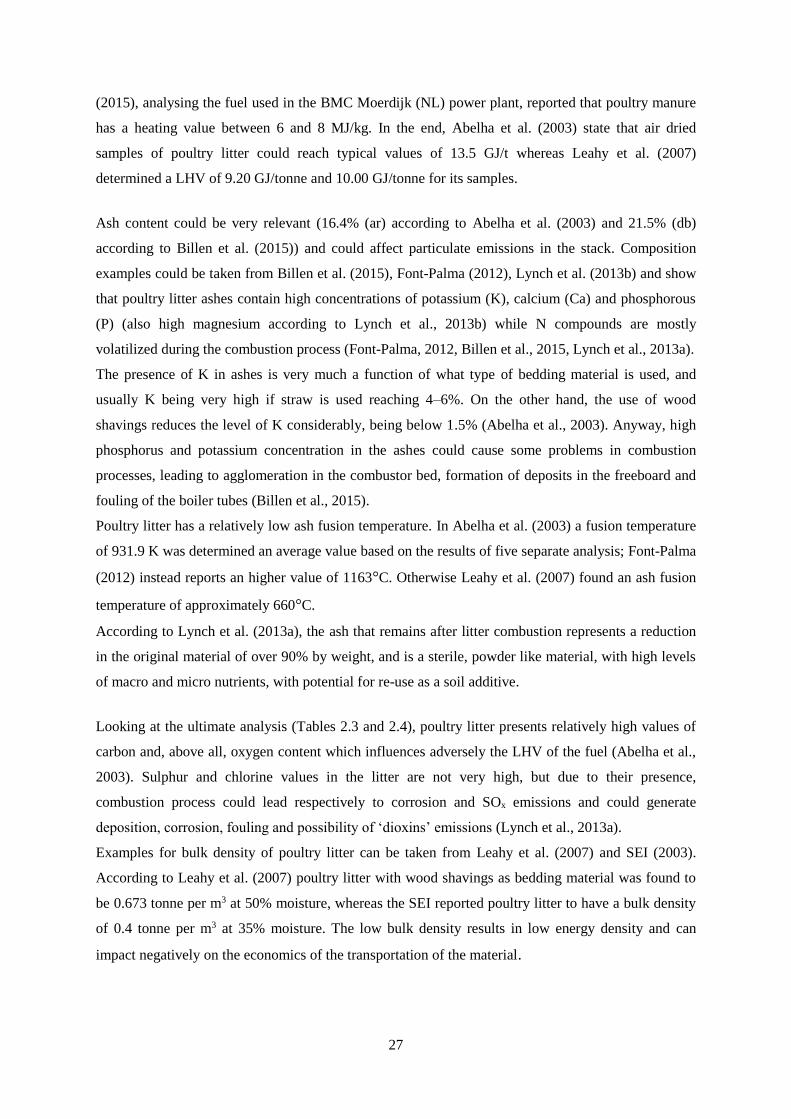
27
(2015), analysing the fuel used in the BMC Moerdijk (NL) power plant, reported that poultry manure
has a heating value between 6 and 8 MJ/kg. In the end, Abelha et al. (2003) state that air dried
samples of poultry litter could reach typical values of 13.5 GJ/t whereas Leahy et al. (2007)
determined a LHV of 9.20 GJ/tonne and 10.00 GJ/tonne for its samples.
Ash content could be very relevant (16.4% (ar) according to Abelha et al. (2003) and 21.5% (db)
according to Billen et al. (2015)) and could affect particulate emissions in the stack. Composition
examples could be taken from Billen et al. (2015), Font-Palma (2012), Lynch et al. (2013b) and show
that poultry litter ashes contain high concentrations of potassium (K), calcium (Ca) and phosphorous
(P) (also high magnesium according to Lynch et al., 2013b) while N compounds are mostly
volatilized during the combustion process (Font-Palma, 2012, Billen et al., 2015, Lynch et al., 2013a).
The presence of K in ashes is very much a function of what type of bedding material is used, and
usually K being very high if straw is used reaching 4–6%. On the other hand, the use of wood
shavings reduces the level of K considerably, being below 1.5% (Abelha et al., 2003). Anyway, high
phosphorus and potassium concentration in the ashes could cause some problems in combustion
processes, leading to agglomeration in the combustor bed, formation of deposits in the freeboard and
fouling of the boiler tubes (Billen et al., 2015).
Poultry litter has a relatively low ash fusion temperature. In Abelha et al. (2003) a fusion temperature
of 931.9 K was determined an average value based on the results of five separate analysis; Font-Palma
(2012) instead reports an higher value of 1163°C. Otherwise Leahy et al. (2007) found an ash fusion
temperature of approximately 660°C.
According to Lynch et al. (2013a), the ash that remains after litter combustion represents a reduction
in the original material of over 90% by weight, and is a sterile, powder like material, with high levels
of macro and micro nutrients, with potential for re-use as a soil additive.
Looking at the ultimate analysis (Tables 2.3 and 2.4), poultry litter presents relatively high values of
carbon and, above all, oxygen content which influences adversely the LHV of the fuel (Abelha et al.,
2003). Sulphur and chlorine values in the litter are not very high, but due to their presence,
combustion process could lead respectively to corrosion and SOx emissions and could generate
deposition, corrosion, fouling and possibility of ‘dioxins’ emissions (Lynch et al., 2013a).
Examples for bulk density of poultry litter can be taken from Leahy et al. (2007) and SEI (2003).
According to Leahy et al. (2007) poultry litter with wood shavings as bedding material was found to
be 0.673 tonne per m3 at 50% moisture, whereas the SEI reported poultry litter to have a bulk density
of 0.4 tonne per m3 at 35% moisture. The low bulk density results in low energy density and can
impact negatively on the economics of the transportation of the material.
28
Another important parameter that must be taken into account considering poultry litter utilisation as a
fuel is its particle size. Suggestions for particle size constraints in FBC have been based on the
analysis of FBC properties and particle dimensions can impact strongly on burners operation,
influencing fluidisation properties and possible agglomeration formation in the bed, but also
emissions values in the stack (Leahy et al., 2007). For example over feeding the furnace into poorly
mixed areas can lead to operational problems, blocking flow and causing imbalance in combustion,
and excess emissions such as carbon monoxide. Size uniformity of fuel particle is essential too in
order to achieve good distribution inside the bed. Results of size distribution of poultry litter samples
are provided by Leahy et al. (2007), which found that the average particle size of poultry litter with
wood shavings was 4.48 mm (with greater proportion of fines) whereas for poultry litter with straw
was 6.64 mm (with greater proportion of larger particles).
Table 2.4. Ultimate analysis of poultry litter on as received basis.
Table 2.5. Ultimate analysis of poultry litter on as received basis.
Some of the characteristics of poultry litter are summarized below:
• Poultry litter is characterised by high moisture, ash and volatile content and relatively low
fixed carbon content;
• The high moisture and ash content impact negatively on the heating value of the fuel. Too low
heating values can result in ignition and combustion problems;
• The LHV of poultry litter can range between 6 and 13 GJ/t;
Ultimate
analysis:
dry basis
(wt%)
Lynch et al. (2013a) Average (range) Std.dev.
Billen et
al. (2015) Average
(Std. dev.)
Abelha et
al. (2003)
Leahy et al.
(2007)
Poultry litter
with straw
Leahy et al.
(2007)
Poultry litter
with wood
shavings
Peat
Carbon 45.17 (42.02-48.61) 1.55 39.1 (1.8) 28.17 40.36 41.20 52.46
Hydrogen 5.85 (4.97-6.55) 0.49 5.7 (1.7) 3.64 4.98 4.88 5.29
Nitrogen 5.16 (3.83-6.4) 0.57 4.2 (0.7) 3.78 5.41 4.54 2.17
Sulphur 0.45 (0.29-0.6) 0.09 0.7 (0.1) 0.55 0.79 0.42 0.00
Chlorine 0.35 (0.23-0.52) 0.23 0.5 (0.1) 0.63 0.89 0.52 0.00
Oxygen 27.25 (25.08-31.09) 1.41 28.3 34.43 20.20 22.65 32.58
Ultimate analysis:
dry, ash free basis
(wt%)
Lynch et al. (2013a) Average (range) Std. dev.
Leahy et al. (2007)
Poultry litter with
straw
Leahy et al. (2007)
Poultry litter with
wood shavings
Leahy et al.
(2007)
Peat
Carbon 53.45 (49.7-57.52) 1.35 55.50 56.24 56.67
Hydrogen 6.92 (5.88-7.75) 0.55 6.85 6.66 5.71
Nitrogen 6.11 (4.53-7.57) 0.66 7.44 6.25 2.34
Sulphur 0.53 (0.34-0.71) 0.09 1.08 0.57 0.00
Chlorine 0.41 (0.27-0.61) 0.09 1.23 0.71 0.00
Oxygen 32.25 (29.68-36.79) 0.27 27.70 30.90 35.18
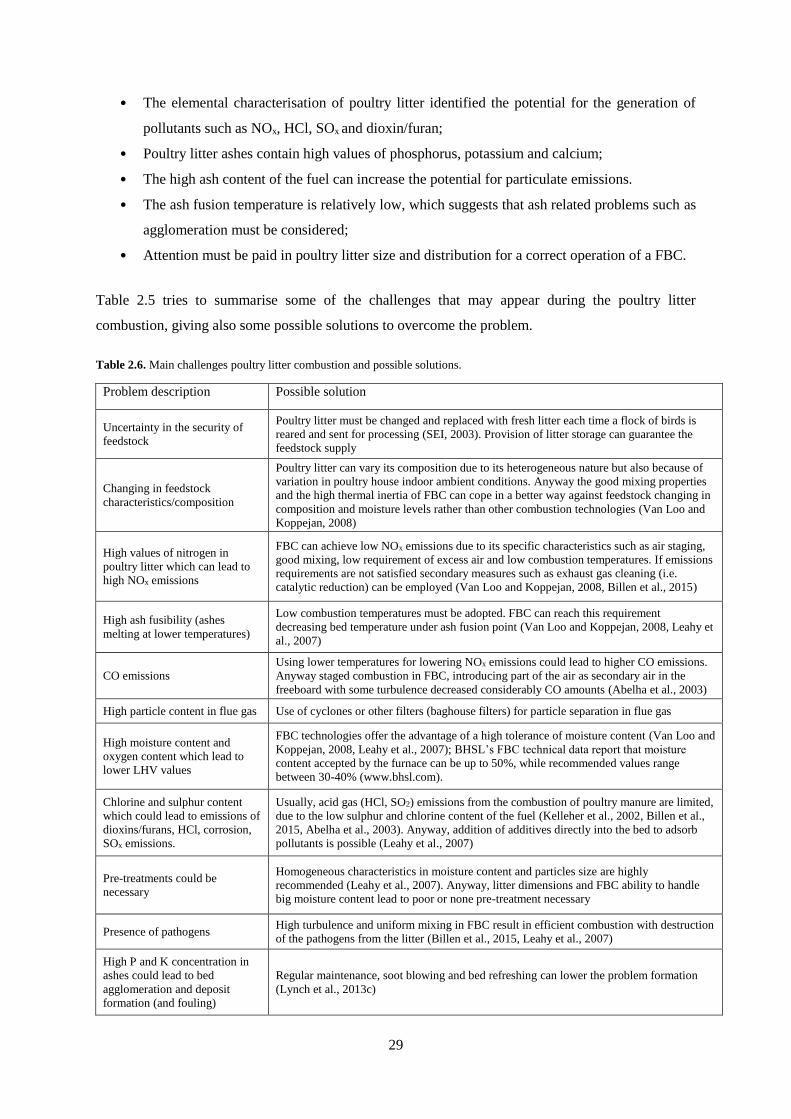
29
• The elemental characterisation of poultry litter identified the potential for the generation of
pollutants such as NOx, HCl, SOx and dioxin/furan;
• Poultry litter ashes contain high values of phosphorus, potassium and calcium;
• The high ash content of the fuel can increase the potential for particulate emissions.
• The ash fusion temperature is relatively low, which suggests that ash related problems such as
agglomeration must be considered;
• Attention must be paid in poultry litter size and distribution for a correct operation of a FBC.
Table 2.5 tries to summarise some of the challenges that may appear during the poultry litter
combustion, giving also some possible solutions to overcome the problem.
Table 2.6. Main challenges poultry litter combustion and possible solutions.
Problem description Possible solution
Uncertainty in the security of
feedstock
Poultry litter must be changed and replaced with fresh litter each time a flock of birds is
reared and sent for processing (SEI, 2003). Provision of litter storage can guarantee the
feedstock supply
Changing in feedstock
characteristics/composition
Poultry litter can vary its composition due to its heterogeneous nature but also because of
variation in poultry house indoor ambient conditions. Anyway the good mixing properties
and the high thermal inertia of FBC can cope in a better way against feedstock changing in
composition and moisture levels rather than other combustion technologies (Van Loo and
Koppejan, 2008)
High values of nitrogen in
poultry litter which can lead to
high NOx emissions
FBC can achieve low NOx emissions due to its specific characteristics such as air staging,
good mixing, low requirement of excess air and low combustion temperatures. If emissions
requirements are not satisfied secondary measures such as exhaust gas cleaning (i.e.
catalytic reduction) can be employed (Van Loo and Koppejan, 2008, Billen et al., 2015)
High ash fusibility (ashes
melting at lower temperatures)
Low combustion temperatures must be adopted. FBC can reach this requirement
decreasing bed temperature under ash fusion point (Van Loo and Koppejan, 2008, Leahy et
al., 2007)
CO emissions
Using lower temperatures for lowering NOx emissions could lead to higher CO emissions.
Anyway staged combustion in FBC, introducing part of the air as secondary air in the
freeboard with some turbulence decreased considerably CO amounts (Abelha et al., 2003)
High particle content in flue gas Use of cyclones or other filters (baghouse filters) for particle separation in flue gas
High moisture content and
oxygen content which lead to
lower LHV values
FBC technologies offer the advantage of a high tolerance of moisture content (Van Loo and
Koppejan, 2008, Leahy et al., 2007); BHSL’s FBC technical data report that moisture
content accepted by the furnace can be up to 50%, while recommended values range
between 30-40% (www.bhsl.com).
Chlorine and sulphur content
which could lead to emissions of
dioxins/furans, HCl, corrosion,
SOx emissions.
Usually, acid gas (HCl, SO2) emissions from the combustion of poultry manure are limited,
due to the low sulphur and chlorine content of the fuel (Kelleher et al., 2002, Billen et al.,
2015, Abelha et al., 2003). Anyway, addition of additives directly into the bed to adsorb
pollutants is possible (Leahy et al., 2007)
Pre-treatments could be
necessary
Homogeneous characteristics in moisture content and particles size are highly
recommended (Leahy et al., 2007). Anyway, litter dimensions and FBC ability to handle
big moisture content lead to poor or none pre-treatment necessary
Presence of pathogens High turbulence and uniform mixing in FBC result in efficient combustion with destruction
of the pathogens from the litter (Billen et al., 2015, Leahy et al., 2007)
High P and K concentration in
ashes could lead to bed
agglomeration and deposit
formation (and fouling)
Regular maintenance, soot blowing and bed refreshing can lower the problem formation
(Lynch et al., 2013c)
30
2.3 Policies and Regulations
In the European context, there are two sets of regulations related to animal manure management and
energy conversion: the Nitrates Directive (Council Directive 91/676/EEC) provides rules for the
usage of animal manure as a fertiliser for farm land in order to avoid environmental pollution, and the
animal by-products regulations (Regulation (EC) No 1069/2009 and its amendments) provides
requirements for the animal by-products management and disposal. In particular the commission
regulation (EU) No 592/2014, amendment of the previous regulation, gives rules for poultry litter
combustion in farm plants. In the Irish context, the regulations mainly follow the guidelines provided
by the European directives. The following subsections describe the major Irish subsidy schemes that
underpin biomass plants within the national territory. This section finishes with relevant framework
directives on energy policy and strategy to better understand the Irish and European context and future
targets.
2.3.1 Council Directive 91/676/EEC (Nitrates Directive) & Good Agricultural Practice
for Protection of Waters Regulations 2014 (S.I. No. 31 of 2014)
This Directive has the objective of reducing and preventing water pollution caused or induced by
nitrates from agricultural sources and by encouraging the use of good agricultural practices.
Water pollution by nitrates has increased with the introduction of intensive farming methods, and
extensive use of chemical fertilisers and higher concentrations of animals in smaller areas. The
Nitrates Directive is an integral part of the Water Framework Directive (Directive 2000/60/EC) which
has the general purpose to establish framework regulations for the protection of inland surface waters,
transitional waters, coastal waters and groundwater.
The Nitrates Directive generally requires Member States to:
Identify surface water and groundwater affected by pollution or at risk of being so, based on
procedures and criteria detailed in the Directive (specifically when the concentration of nitrates in
groundwater or surface water reaches 50 mg/l or when the surface water is eutrophic or is at risk of
being so);
Designate vulnerable zones, which are all known areas of land in their territories which drain into
surface waters and groundwater which are affected by pollution or at risk of being so;
Establish a code of good agricultural practice to be implemented by farmers on a voluntary basis,
which shall include the measures detailed in Annex II to the Directive;
Set up compulsory action programmes to be implemented by all farmers who work in vulnerable
zones. These programmes must contain the measures listed in the good agricultural practice codes,
31
as well as the additional measures listed in Annex III to the Directive, which aim to limit the land
application of mineral and organic fertilisers containing nitrogen, as well as land application of
livestock manure.
In fact the Nitrates Directive imposes a limit on the amount of livestock manure per hectare that can
be applied to land on a farm each year except in certain specified circumstances. The limit is the
amount of livestock manure containing 170 kg of nitrogen.
Furthermore the Directive requires for each member state to draw up an Action Programme which
includes measures such as input regulations and management practices, obliging to review and, if
necessary, revise the Programme at least every four years.
Ireland’s first Nitrates Action Programme (NAP) came into operation in 2006 and was reviewed for
the first time in 2010. This resulted in a revised Nitrates Action Programme (NAP2) and in the
delivery of the Good Agricultural Practice Regulations (also known as the ‘GAP Regulations’ and as
the ‘Nitrates Regulations’). The NAP2 expired on 31 December 2013 and has been replaced by the
third NAP which has been agreed and given legal effect by the Good Agricultural Practice for
Protection of Waters Regulations 2014 (S.I. No. 31 of 2014). The principal elements of the NAP
regime, following the Nitrates Directive guidelines, include:
Limiting the application of fertilisers (limit of 170 kg of nitrogen per hectare of farmland per
year contained in manure and slurry spread);
Maximum fertilisation rates for nitrogen and phosphorus (i.e., organic and chemical fertiliser
combined);
The introduction of ‘prohibited spreading periods’ preventing the application of organic and
chemical fertilisers during environmentally vulnerable parts of the season (nutrient loss to
water);
Minimum storage requirements for livestock manures;
Requirements regarding maintenance of green cover in tillage lands;
Set back distance from waters;
Keep records of the fertilisers that are brought onto the holdings or sent out of them.
2.3.2 Regulation (EC) No 1069/2009 and Commission regulation (EU) No 142/2011
The regulation (EC) No 1069/2009 and its amendment that is the Commission regulation (EU) No
142/2011 lay down on public health and animal health rules for animal by-products and derived
products use and disposal, in order to prevent and minimise risks to public and animal health arising
from those products, and in particular to protect the safety of the food and feed chain.
32
In particular, the regulations provide a classification of the animal by-products based on the potential
risk to animals, public or environment and set requirements and rules regarding:
Animal by-products disposal and use and in particular specifying hygiene and general
requirements for processing methods listed in the Directive, for incineration and co-
incineration, for landfilling, for transformation in biogas and compost;
Animal by-products collection, transport and identification;
Registration and approval of the establishments and plants;
Animal by-products market placement and import and export;
Control operations
2.3.3 Commission regulation (EU) No 592/2014
This commission regulation is an amendment of the Regulation No 142/2011 and is related to the use
of animal by-products and derived products as fuel in combustion plants. The regulation is of
particular relevance as it defines rules and safety requirements for burning poultry manure and litter in
farm plants.
General requirements reported by the Directive include: that the combustion plants must be located on
a well-drained and hard standing surface, and physically separated from the animals including their
feed and bedding; animal by-products intended for combustion and combustion residues must be
stored in a closed and covered dedicated area, or in covered and leak-proof containers and used as
soon as possible in order to prevent contamination. Furthermore cleaning and disinfection procedures
must be established and documented for all parts of the combustion plant.
Combustion plants must be designed, built and operated in such a way that even under the most
unfavourable conditions the animal by-products are treated for at least 2 seconds at a temperature of
850 °C or for at least 0.2 seconds at a temperature of 1100°C and the total organic carbon content of
the slags and bottom ashes is less than 3% or their loss on ignition is less than 5% of the dry weight of
the material.
The on-farm combustion plant must not exceed a total rated thermal input of 5 MW and must be
equipped with: an automatic fuel management system to place the fuel directly in the combustion
chamber without further handling; an auxiliary burner used during start-up and shut-down operations.
The emissions of sulphur dioxide, nitrogen oxides (namely the sum of nitrogen monoxide and
nitrogen dioxide, expressed as nitrogen dioxide) and particulate matter shall not exceed the emission
limit values presented in Table 2.6, expressed in mg/Nm3 at a temperature of 273.15 K, a pressure of
101.3 kPa and an oxygen content of 11%.
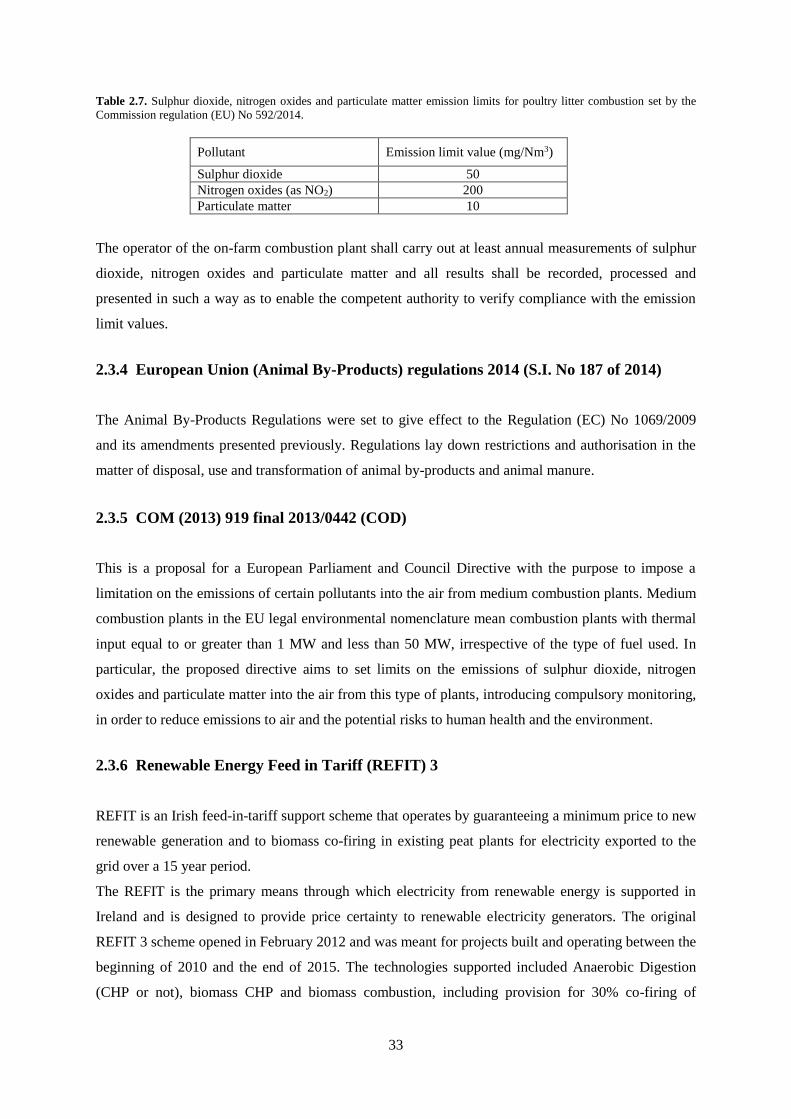
33
Table 2.7. Sulphur dioxide, nitrogen oxides and particulate matter emission limits for poultry litter combustion set by the
Commission regulation (EU) No 592/2014.
Pollutant Emission limit value (mg/Nm3)
Sulphur dioxide 50
Nitrogen oxides (as NO2) 200
Particulate matter 10
The operator of the on-farm combustion plant shall carry out at least annual measurements of sulphur
dioxide, nitrogen oxides and particulate matter and all results shall be recorded, processed and
presented in such a way as to enable the competent authority to verify compliance with the emission
limit values.
2.3.4 European Union (Animal By-Products) regulations 2014 (S.I. No 187 of 2014)
The Animal By-Products Regulations were set to give effect to the Regulation (EC) No 1069/2009
and its amendments presented previously. Regulations lay down restrictions and authorisation in the
matter of disposal, use and transformation of animal by-products and animal manure.
2.3.5 COM (2013) 919 final 2013/0442 (COD)
This is a proposal for a European Parliament and Council Directive with the purpose to impose a
limitation on the emissions of certain pollutants into the air from medium combustion plants. Medium
combustion plants in the EU legal environmental nomenclature mean combustion plants with thermal
input equal to or greater than 1 MW and less than 50 MW, irrespective of the type of fuel used. In
particular, the proposed directive aims to set limits on the emissions of sulphur dioxide, nitrogen
oxides and particulate matter into the air from this type of plants, introducing compulsory monitoring,
in order to reduce emissions to air and the potential risks to human health and the environment.
2.3.6 Renewable Energy Feed in Tariff (REFIT) 3
REFIT is an Irish feed-in-tariff support scheme that operates by guaranteeing a minimum price to new
renewable generation and to biomass co-firing in existing peat plants for electricity exported to the
grid over a 15 year period.
The REFIT is the primary means through which electricity from renewable energy is supported in
Ireland and is designed to provide price certainty to renewable electricity generators. The original
REFIT 3 scheme opened in February 2012 and was meant for projects built and operating between the
beginning of 2010 and the end of 2015. The technologies supported included Anaerobic Digestion
(CHP or not), biomass CHP and biomass combustion, including provision for 30% co-firing of

34
biomass in the three peat-powered stations. The REFIT operates on a sliding scale, acting to ensure a
guaranteed price for each unit of electricity exported to the grid by paying the difference between the
wholesale price for electricity and the REFIT price.
Table 2.8. Reference prices for 2010 and 2015 set by the REFIT 3 scheme for each selected technology (SOURCE:
Department of Communications, Energy and Natural Resources).
REFIT 3 has been designed to incentivise the addition of 310MW of renewable electricity capacity to
the Irish grid, of which185MW were intended for High Efficiency CHP, using both Anaerobic
Digestion (15 MW) and the thermo-chemical conversion of solid biomass (170 MW), while the other
125MW for biomass combustion and biomass co-firing (power capacity were reallocated by the
Department of Communications, Energy and Natural Resources on August 2014). The maximum size
of an individual plant that may be accepted into REFIT 3 is 50 MWel. An exception to this rule applies
to peat co-firing stations which may co-fire peat and biomass up to 30% of the capacity of the plant
(up to a maximum of 50MW) in any single year.
The reference prices for 2010 and for 2015 in euro per megawatt hour are provided in Table 2.7
(tariffs are indexed to Consumer Price Index).
The Department of Communications, Energy and Natural Resources is developing a new support
scheme for renewable electricity to be available from 2016.
2.3.7 EU Directive 2009/28/EC
This Directive established a legislative common framework for the use of energy from renewable
sources in order to limit greenhouse gas emissions and to promote cleaner transport in Europe. The
fields of action defined in the Directive are: energy efficiency, energy consumption from renewable
sources, the improvement of energy supply and the economic stimulation in energy sector.
Two of the most relevant aspects from the legislative framework include the definition of national
targets and the obligation to provide national action plans for 2020.
Technology 2010 reference
price (€/MWh)
2015 reference
price (€/MWh)
AD CHP (units less than or equal to 500 kWel) 150.00 157.613
AD CHP (units of greater than 500 kWel ) 130.00 136.598
AD (non CHP) (less than or equal to 500 kWel) 110.00 115.583
AD (non CHP) (units of greater than 500 kWel) 100.00 105.583
Biomass CHP (units less than or equal to 1500 kWel) 140.00 147.106
Biomass CHP (units of greater than 1500 kWel) 120.00 126.091
Biomass Combustion (non-CHP):
- For using energy crops
- For all other biomass
95.00
85.00
99.822
89.314
35
Each Member State have targets calculated according to the share of energy from renewable sources
in its gross final consumption for 2020 and in line with the overall 20-20-20 goal for the European
Union (EU); this including also a share of renewables in the transport sector of at least 10% of final
energy consumption by 2020.
Ireland’s overall target was set at 16% of gross final energy consumption from renewable sources by
2020 (starting from a share of 3.1%in 2005).
Furthermore, each Member State had to establish a national action plan for 2020in order to set the
share of energy from renewable sources consumed in transport as well as in the production of
electricity and heating. These action plans had also the aim to establish procedures for the reform of
planning and pricing schemes and access to electricity networks, in order to promote energy from
renewable sources implementing energy efficiency measures.
Further aspects embraced by the Directive concern regulations on possible cooperation between
Member States, access and operation of the grids, guarantee of renewable energy origin and
procedures on energy from biofuels and bioliquids.
2.3.8 National Renewable Energy Action Plan (NREAP)
The National Renewable Energy Action Plan (NREAP) was published in 2010 and set out the
Government’s strategic measures to deliver on Ireland’s 16% target under Directive 2009/28/EC.
The NREAP targets can be summarized in:
40% of electricity consumption from renewable sources by 2020
12% renewable heat by 2020
10% share of renewable energy in transport by 2020
In this plan bioenergy is estimated to contribute approximately:
7.2% to the renewable electricity goal (1006 GWh over 13909 GWh expected);
82.2% to the renewable heat goal (486 ktoe over 591 ktoe);
More than 90% to the renewable transport goal.
2.3.9 Decision No 406/2009/EC
Ireland signed the EU’s Effort Sharing Decision (Decision No 406/2009/EC) which set 2020 targets
for EU Member States on greenhouse gas emissions from sectors that are not included in the EU
Emissions Trading Scheme. These sectors cover agriculture, transport, built environment (residential,
commercial/institutional), waste and non-energy intensive industry and Ireland’s target is to achieve a

36
20% reduction by 2020 on 2005 levels. In addition, there are binding annual emission limits for the
period 2013-2020 to ensure a gradual move towards the 2020 target. Any overachievement of the
binding emission limit in a particular year can be banked and used towards compliance in a future
year.
37
References
Dong Leilei, Liu Hao, Riffat Saffa. (2009). Development of small-scale and micro-scale biomass-
fuelled CHP systems - A literature review. Applied Thermal Energy, 29, 2119-2126, Elsevier.
Liu H. (2011). Biomass fuels for small and micro combined heat and power (CHP) systems:
resources, conversion and applications. University of Nottingham, UK. Woodhead Publishing
Limited.
Appels Lise, Lauwers Joost, Degrève Jan, Helsen Lieve, Lievens Bart, Willems Kris, Van Impe Jan,
Dewil Raf. (2011). Anaerobic digestion in global bio-energy production: potential and research
challenges. Renewable and Sustainable Energy Reviews, 15, 4295-4301, Elsevier.
Foged Henning Lyngsø, Flotats Xavier, Bonmati Blasi August, Palatsi Jordi, Magri Albert and
Schelde Karl Martin. (2011). Inventory of manure processing activities in Europe. Technical Report
No. I concerning “Manure Processing Activities in Europe” to the European Commission,
Directorate-General Environment. 138 pp.
Al Seadi T., Lukehurst C. (2012). Quality management of digestate from biogas plants used as
fertilizer. International Energy Agency (IEA) Bioenergy. Task 37.
Zupančič Gregor D., Grilc Viktor. (2012). Anaerobic treatment and biogas production from organic
waste. Management of Organic Waste.
Khalid Azeem, Arshad Muhammad, Anjum Muzammil, Mahmood Tariq, Dawson Lorna. (2011). The
anaerobic digestion of solid organic waste. Waste Management, 38, 1737-1744, Elsevier.
Li Yebo, Park Stephen Y., Zhu Jiying. (2011). Solid state anaerobic digestion for methane production
from organic waste. Renewable and Sustainable Energy Reviews, 15, 821-826, Elsevier.
Department of Agriculture and Rural Development (DARD), AgriFood and Biosciences Institute
(AFBI). (April 2012). The review of alternative technologies to fluidised bed combustion for poultry
litter utilisation.
Luning L., Van Zundert E.H.M., Brinkmann A.J.F. (2003). Comparison of dry and wet digestion for
solid waste. Water Science & Technology, 48, 15-20, IWA Publishing.
Kelleher B.P., Leahy J.J., Henihan A.M., O’Dwyer T.F., Sutton D., Leahy M.J. (2002). Advances in
poultry litter disposal technology – a review. Bioresource Technology, 83, 27-36, Elsevier.
Sustainable Energy Authority Ireland (SEAI), Gas Yields Table, available at:
http://www.seai.ie/Renewables/Bioenergy/Bioenergy_Technologies/Anaerobic_Digestion/The_Proce
ss_and_Techniques_of_Anaerobic_Digestion/Gas_Yields_Table.pdf. (Last access 05/09/2015).
Hamilton Douglas W. (2012). Anaerobic digestion of animal manures: methane production potential
of waste materials. Division of agricultural sciences and natural resources, Oklahoma State
University, BAE-1762.
Leahy M. J., Henihan A. M., Kelleher B. P., Leahy J.J., O’Connor J. (2007). Mitigation of large-scale
organic waste damage incorporating a demonstration of a closed loop conversion of poultry waste to
38
energy at the point of source. Environmental Protection Agency, Environmental RTDI Programme
2000-2006.
Luostarinen Sari (ed.). (2013b). National scenarios, best practices and recommendations for manure
energy use in the Baltic Sea Region. Baltic Forum for Innovative Technologies for Sustainable
Manure Management, Baltic manure WP6 energy potentials.
Zamudio Canas, Esteban Manuel. (2010). Technical Feasibility of Anaerobic Co-digestion of Dairy
Manure with Chicken Litter and Other Wastes. Master's Thesis, University of Tennessee.
Luostarinen Sari (ed.). (2013a). Energy Potential of Manure in the Baltic Sea Region: Biogas
Potential & Incentives and Barriers for Implementation, Baltic Forum for Innovative Technologies for
Sustainable Manure Management, Baltic Manure WP6 Energy potentials.
Nayono Satoto Endar. (2009). Anaerobic Digestion of Organic Solid Waste for Energy Production.
Karlsruher Berichtezur Ingenieurbiologie, Band 46.
Sakar Suleyman, Yetilmezsoy Kaan, Kocak Emel. (2009). Anaerobic digestion technology in poultry
and livestock waste treatment-a literature review. Waste Management & Research, 27, 3-18.
Bijman T. (2014). Biogas from Poultry Waste – a case. Nijhuis Water Technology, Dorset
symposium.
Sustainable Energy Authority Ireland (SEAI), The Process and Techniques of Anaerobic Digestion,
available at:
http://www.seai.ie/Renewables/Bioenergy/Bioenergy_Technologies/Anaerobic_Digestion/The_Proce
ss_and_Techniques_of_Anaerobic_Digestion/. (Last access 25/08/2015).
International Energy Agency (IEA).Task32: biomass combustion and co-firing: an overview,
available at: http://www.ieabcc.nl/. (Last access 01/10/2015).
Zhang Linghong, Xu Chunbao (Charles), Champagne Pascale. (2010). Overview of recent advances
in thermo-chemical conversion of biomass. Energy Conversion and Management, 51, 969-982,
Elsevier.
Van Loo Sjaak, Koppejan Jaap. (2008). The Handbook of Biomass Combustion and Co-firing.
Earthscan, London, Sterling, VA.
Bridgwater A. V., Alcala A. and Gyftopoulou M. E. (2011). Biomass-based small and micro
combined heat and power (CHP) systems: application and status in the United Kingdom. Aston
University, UK. Woodhead Publishing Limited.
Scottish Energy System Group. Westfield Biomass Plant.
http://www.sesg.strath.ac.uk/Reasure/Info_pack/RE_info/biomasscase.htm#Westfield%20Biomass%2
0Plant. (Last access 01/10/2015).
BMC Moerdijk, available at: http://www.bmcmoerdijk.nl/en/home.htm. (Last access 18/09/2015).
Billen Pieter, Costa José, Liza Van der Aa, Van Caneghem Jo, Carlo Vandecasteele. (2015).
Electricity from poultry manure: a cleaner alternative to direct land application. Journal of Cleaner
Production, 96, 467-475, Elsevier.
39
Lynch Deirdre, Henihana Anne Marie, Bowen Barry, Lynch Declan, McDonnell Kevin, Kwapinski
Witold, Leahy J.J. (2013a). Utilisation of poultry litter as an energy feedstock. Biomass and
Bioenergy, 49, 197-204, Elsevier.
Abelha P., Gulyurtlu I., Boavida D., Seabra Barros J., Cabrita I., Leahy J., Kelleher B., Leahy M.
(2003). Combustion of poultry litter in a fluidised bed combustor. Fuel, 82, 687-692, Elsevier.
Lynch Deirdre, Henihan Anne Marie, Kwapinski Witold, Zhang Lian, and Leahy James J. (2013b).
Ash Agglomeration and Deposition during Combustion of Poultry Litter in a Bubbling Fluidized-Bed
Combustor. Energy & Fuels, American Chemical Society.
Sustainable Poultry Production thru’ Environmental Recycling (SUPPER) project.
http://ec.europa.eu/environment/eco-innovation/projects/sites/eco-
innovationprojects/files/projects/documents/af_-_supper.pdf. (Last access 30/08/2015).
BHSL. Uphouse farm case study, Norfolk, UK, BHSL website, available at:
http://www.bhsl.com/portfolio-item/uphouse-farm-norfolk/. (Last access 24/09/2015).
International Energy Agency (IEA).Task 34: pyrolysis, available at: http://www.pyne.co.uk/. (Last
access 01/10/2015).
Serio Michael A., Bassilakis Rosemary, Kroo Erik, Wójtowicz Marek A. (2002). Pyrolysis processing
of animal manure to produce fuel gases. Fuel Chemistry Division Preprints, 47 (2), 592.
Carta Renzo, Cruccu Mario, Desogus Francesco. (2012). Slow, Wet and Catalytic Pyrolysis of Fowl
Manure. World Academy of Science, Engineering and Technology, International Journal of
Environmental, Chemical, Ecological, Geological and Geophysical Engineering, Vol:6, No:12.
Ro Kyoung S., Cantrell Keri B., Hunt Patrick G. (2010). High-Temperature Pyrolysis of Blended
Animal Manures for Producing Renewable Energy and Value-Added Biochar. Ind. Eng. Chem. Res.
49, 10125–10131.
Hollis S., Keener H., Smith M. (2013). Manure processing Technologies, 3.6 Pyrolysis, Manure
Processing Technology Manual, Ohio Composting and Manure management, the Ohio State
University.
Flotats Xavier, Foged Henning Lyngsø, Bonmati Blasi August, Palatsi Jordi, Magri Albert and
Schelde Karl Martin. (2011). Manure processing technologies. Technical Report No.II concerning
“Manure Processing Activities in Europe” to the European Commission, Directorate-General
Environment.184 pp.
Ruiz J.A., Juarez M.C., Morales M.P., Munoz P., Mendıvil M.A. (2013). Biomass gasification for
electricity generation: Review of current technology barriers. Renewable and Sustainable Energy
reviews, 18, 174-183, Elsevier.
Heidenreich Steffen, Foscolo Pier Ugo. (2015). New concepts in biomass gasification. Progress in
Energy and Combustion Science, 46, 72-95, Elsevier.
Balat Mustafa, Balat Mehmet, Kırtay Elif, Balat Havva. (2009). Main routes for the thermo-
conversion of biomass into fuels and chemicals. Part 2: Gasification systems. Energy Conversion and
Management, 50, 3158-3168, Elsevier.
40
Ahrenfeldt Jesper, Thomsen Tobias P., Henriksen Ulrik, Clausen Lasse R. (2013). Biomass
gasification cogeneration - A review of state of the art technology and near future perspectives.
Applied Thermal Engineering, 50, 1407-1417, Elsevier.
Møller Martin. (2014). The Pyroneer gasification technology - An efficient and sustainable method of
converting high alkaline feedstock like straw into gas and fertiliser. DONG Energy, SGC International
Seminar on Gasification, Malmø.
Kuligowski Ksawery, Luostarinen Sari. (2011). Thermal gasification of manure. Baltic Forum for
Innovative Technologies for Sustainable Manure Management, Baltic Manure WP6 Energy
potentials.
Reardon John P., Lilley Art, Browne Kingsbury, Beard Kelly, Wimberly Jim, Avens Jack. (2001).
Demonstration of a Small Modular BioPower System Using Poultry Litter, DOE SBIR Phase-I Final
Report.
COALTEC Energy, available at: http://www.coaltecenergy.com/projects/chicken-manure/. (Last
access June 2015).
Huang Y., Anderson M., McIlveen-Wright D., Lyons G.A., McRoberts W.C., Wang Y.D., Roskilly
A.P., Hewitt N.J. (2015). Biochar and renewable energy generation from poultry litter waste: A
technical and economic analysis based on computational simulations. Applied Energy, Elsevier.
Pandey Daya Shankar, Kwapinska Marzena, Leahy J. J., Kwapinski Witold. (2014). Simulation of
Poultry Litter Gasification – Waste to Energy. 6th GERG Academic Network Event, Copenhagen.
Yoshikawa Kunio, Hara Tsutomu. (2008). Long-term Operation of a Small-scale Gasification and
Power Generation Plant for Chicken Manure. The Second International Energy 2030 Conference, Abu
Dhabi, U.A.E.
Pereira Emanuele Graciosa, Nogueira da Silva Jadir, De Oliveira Jofran L., Machado Cassio S.
(2012). Sustainable energy: A review of gasification technologies. Renewable and Sustainable Energy
Reviews, 16, 4753-4762, Elsevier.
Smith Meghan, Keener Harold. (2012). Manure processing Technologies, 3.7 Hydrothermal
Liquefaction, Manure Processing Technology Manual, Ohio Composting and Manure management,
the Ohio State University.
Font-Palma Carolina. (2012). Characterisation, kinetics and modelling of gasification of poultry
manure and litter: An overview. Energy Conversion and Management, 53, 92-98, Elsevier.
Dávalos Juan Z., Roux Maria Victoria, Jiménez Pilar. (2002). Evaluation of poultry litter as a feasible
fuel. Thermochimica Acta, 394, 261-266, Elsevier.
Sustainable Energy Ireland (SEI). (2003). An Assessment of the Renewable Energy Resource
Potential of Dry Agricultural Residues in Ireland.
Lynch D., Henihan A.M., Kwapinski W., Leahy J.J. (2013c). Closing the loop – on-farm fluidised bed
combustion of poultry litter , 9th International Conference on Renewable Resources and
Biorefineries, Antwerp, Belgium.
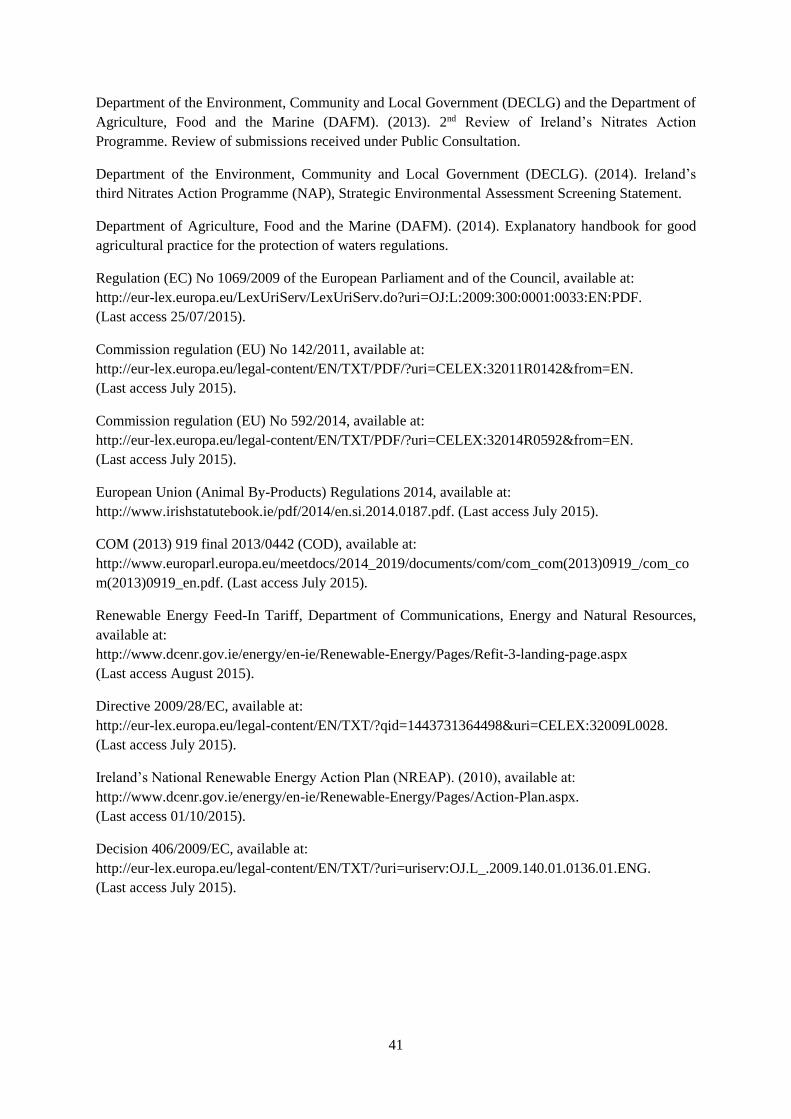
41
Department of the Environment, Community and Local Government (DECLG) and the Department of
Agriculture, Food and the Marine (DAFM). (2013). 2nd Review of Ireland’s Nitrates Action
Programme. Review of submissions received under Public Consultation.
Department of the Environment, Community and Local Government (DECLG). (2014). Ireland’s
third Nitrates Action Programme (NAP), Strategic Environmental Assessment Screening Statement.
Department of Agriculture, Food and the Marine (DAFM). (2014). Explanatory handbook for good
agricultural practice for the protection of waters regulations.
Regulation (EC) No 1069/2009 of the European Parliament and of the Council, available at:
http://eur-lex.europa.eu/LexUriServ/LexUriServ.do?uri=OJ:L:2009:300:0001:0033:EN:PDF.
(Last access 25/07/2015).
Commission regulation (EU) No 142/2011, available at:
http://eur-lex.europa.eu/legal-content/EN/TXT/PDF/?uri=CELEX:32011R0142&from=EN.
(Last access July 2015).
Commission regulation (EU) No 592/2014, available at:
http://eur-lex.europa.eu/legal-content/EN/TXT/PDF/?uri=CELEX:32014R0592&from=EN.
(Last access July 2015).
European Union (Animal By-Products) Regulations 2014, available at:
http://www.irishstatutebook.ie/pdf/2014/en.si.2014.0187.pdf. (Last access July 2015).
COM (2013) 919 final 2013/0442 (COD), available at:
http://www.europarl.europa.eu/meetdocs/2014_2019/documents/com/com_com(2013)0919_/com_co
m(2013)0919_en.pdf. (Last access July 2015).
Renewable Energy Feed-In Tariff, Department of Communications, Energy and Natural Resources,
available at:
http://www.dcenr.gov.ie/energy/en-ie/Renewable-Energy/Pages/Refit-3-landing-page.aspx
(Last access August 2015).
Directive 2009/28/EC, available at:
http://eur-lex.europa.eu/legal-content/EN/TXT/?qid=1443731364498&uri=CELEX:32009L0028.
(Last access July 2015).
Ireland’s National Renewable Energy Action Plan (NREAP). (2010), available at:
http://www.dcenr.gov.ie/energy/en-ie/Renewable-Energy/Pages/Action-Plan.aspx.
(Last access 01/10/2015).
Decision 406/2009/EC, available at:
http://eur-lex.europa.eu/legal-content/EN/TXT/?uri=uriserv:OJ.L_.2009.140.01.0136.01.ENG.
(Last access July 2015).

42
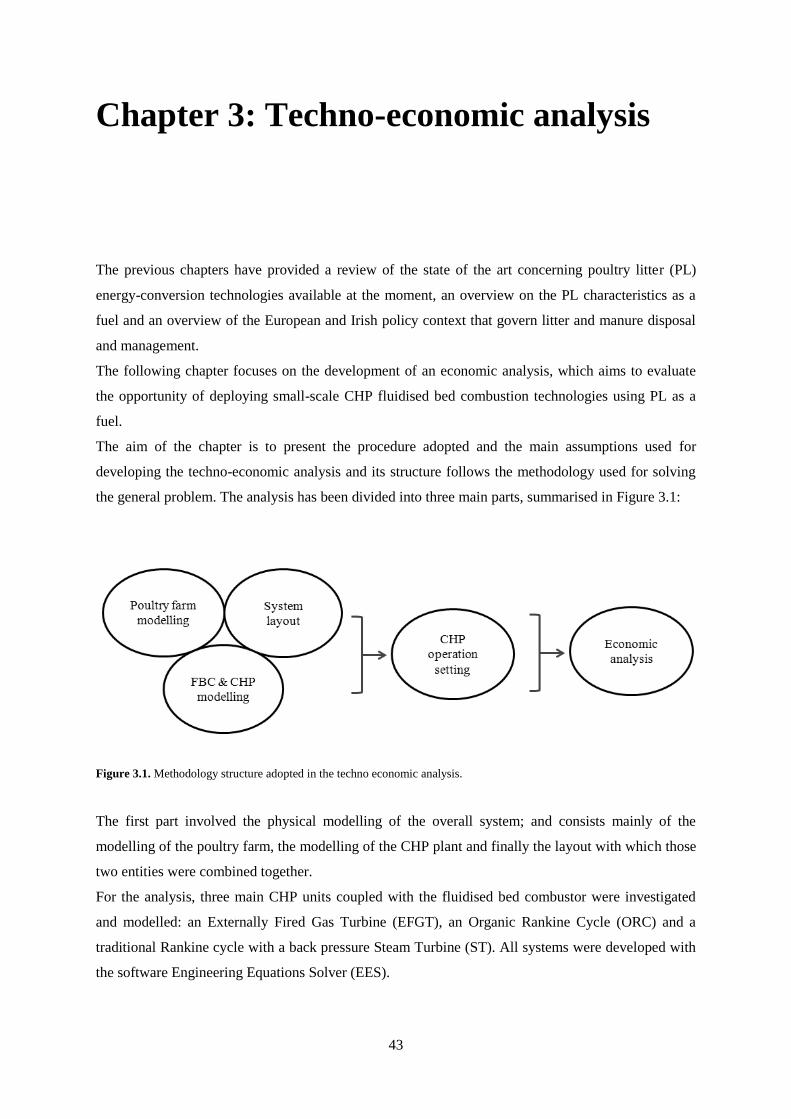
43
Chapter 3: Techno-economic analysis
The previous chapters have provided a review of the state of the art concerning poultry litter (PL)
energy-conversion technologies available at the moment, an overview on the PL characteristics as a
fuel and an overview of the European and Irish policy context that govern litter and manure disposal
and management.
The following chapter focuses on the development of an economic analysis, which aims to evaluate
the opportunity of deploying small-scale CHP fluidised bed combustion technologies using PL as a
fuel.
The aim of the chapter is to present the procedure adopted and the main assumptions used for
developing the techno-economic analysis and its structure follows the methodology used for solving
the general problem. The analysis has been divided into three main parts, summarised in Figure 3.1:
Figure 3.1. Methodology structure adopted in the techno economic analysis.
The first part involved the physical modelling of the overall system; and consists mainly of the
modelling of the poultry farm, the modelling of the CHP plant and finally the layout with which those
two entities were combined together.
For the analysis, three main CHP units coupled with the fluidised bed combustor were investigated
and modelled: an Externally Fired Gas Turbine (EFGT), an Organic Rankine Cycle (ORC) and a
traditional Rankine cycle with a back pressure Steam Turbine (ST). All systems were developed with
the software Engineering Equations Solver (EES).

44
The poultry farm, together with the overall system layout, was modelled with the aid of the software
Energy+ and allowed to obtain the heat and the electrical demand of the farm on an hourly basis for
one year. Those output values were then re-elaborated in the second part by a Matlab program and
used for setting the CHP operation in every single hour of the year.
The third part is the economic analysis obtained with the recast of the outputs from the annual
simulation. In the following, each of those parts will be described in detail, displaying the
assumptions and the hypothesis adopted.
3.1 Poultry farm & plant layout
As reported in the introduction, the first step undertaken in the model building was characterising the
structure of the poultry house and the size of the poultry farm in order to evaluate the heat and the
electric demand for this type of building. For this purpose the software Energy+ was used.
The following chapter will report the main assumptions adopted for the building structure, the heat
gains, the ventilation requirements and the plant layout.
3.1.1 Building characteristics
The location chosen for the poultry farm installation is Kilkenny, Ireland (Figure 3.2). This was
mainly due to the availability of weather and climate data for the selected site which were provided by
the software Energy+, taken from the International Weather for Energy Calculations (IWEC) data set.
Figure3.2. Poultry farm location – Kilkenny, Ireland (denoted by the red marker).
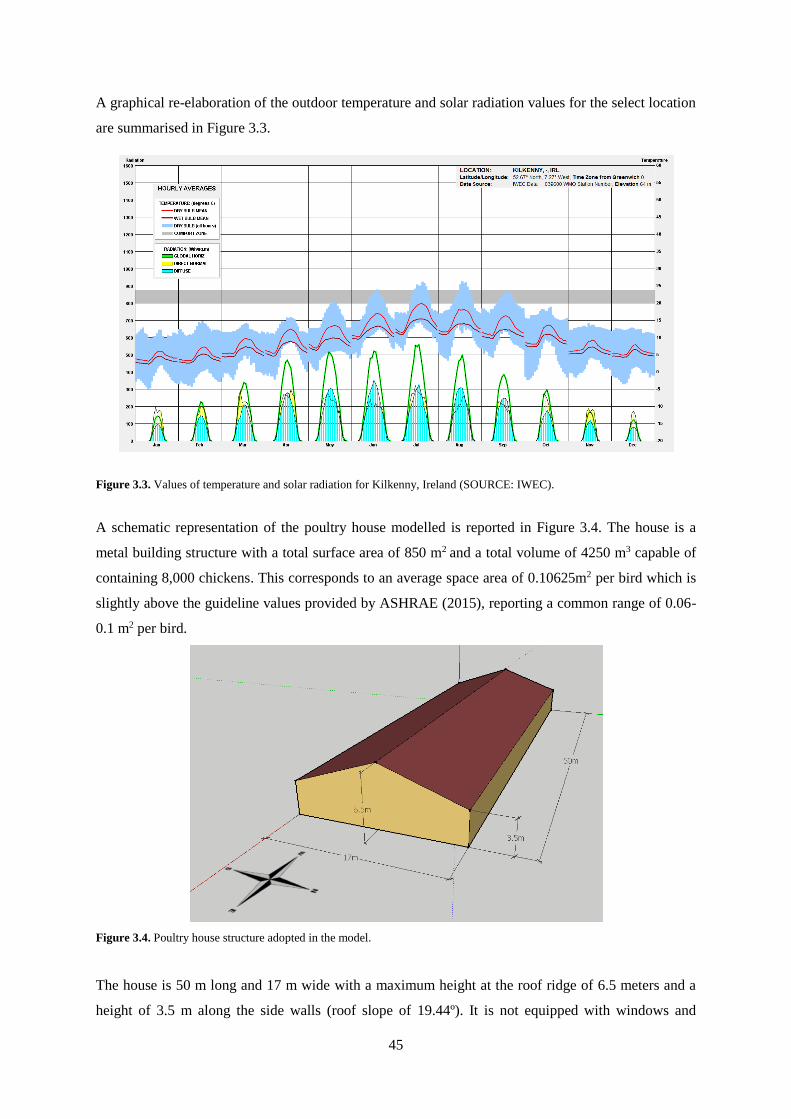
45
A graphical re-elaboration of the outdoor temperature and solar radiation values for the select location
are summarised in Figure 3.3.
Figure 3.3. Values of temperature and solar radiation for Kilkenny, Ireland (SOURCE: IWEC).
A schematic representation of the poultry house modelled is reported in Figure 3.4. The house is a
metal building structure with a total surface area of 850 m2 and a total volume of 4250 m3 capable of
containing 8,000 chickens. This corresponds to an average space area of 0.10625m2 per bird which is
slightly above the guideline values provided by ASHRAE (2015), reporting a common range of 0.06-
0.1 m2 per bird.
Figure 3.4. Poultry house structure adopted in the model.
The house is 50 m long and 17 m wide with a maximum height at the roof ridge of 6.5 meters and a
height of 3.5 m along the side walls (roof slope of 19.44º). It is not equipped with windows and
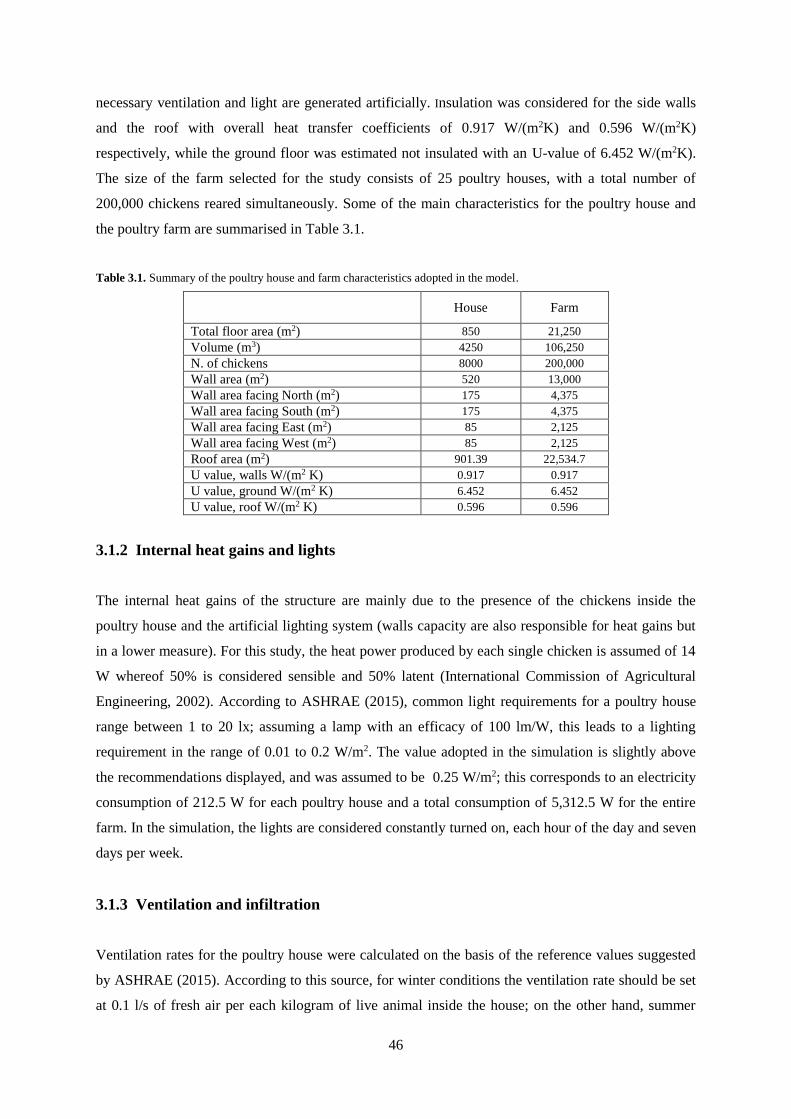
46
necessary ventilation and light are generated artificially. Insulation was considered for the side walls
and the roof with overall heat transfer coefficients of 0.917 W/(m2K) and 0.596 W/(m2K)
respectively, while the ground floor was estimated not insulated with an U-value of 6.452 W/(m2K).
The size of the farm selected for the study consists of 25 poultry houses, with a total number of
200,000 chickens reared simultaneously. Some of the main characteristics for the poultry house and
the poultry farm are summarised in Table 3.1.
Table 3.1. Summary of the poultry house and farm characteristics adopted in the model.
House Farm
Total floor area (m2) 850 21,250
Volume (m3) 4250 106,250
N. of chickens 8000 200,000
Wall area (m2) 520 13,000
Wall area facing North (m2) 175 4,375
Wall area facing South (m2) 175 4,375
Wall area facing East (m2) 85 2,125
Wall area facing West (m2) 85 2,125
Roof area (m2) 901.39 22,534.7
U value, walls W/(m2 K) 0.917 0.917
U value, ground W/(m2 K) 6.452 6.452
U value, roof W/(m2 K) 0.596 0.596
3.1.2 Internal heat gains and lights
The internal heat gains of the structure are mainly due to the presence of the chickens inside the
poultry house and the artificial lighting system (walls capacity are also responsible for heat gains but
in a lower measure). For this study, the heat power produced by each single chicken is assumed of 14
W whereof 50% is considered sensible and 50% latent (International Commission of Agricultural
Engineering, 2002). According to ASHRAE (2015), common light requirements for a poultry house
range between 1 to 20 lx; assuming a lamp with an efficacy of 100 lm/W, this leads to a lighting
requirement in the range of 0.01 to 0.2 W/m2. The value adopted in the simulation is slightly above
the recommendations displayed, and was assumed to be 0.25 W/m2; this corresponds to an electricity
consumption of 212.5 W for each poultry house and a total consumption of 5,312.5 W for the entire
farm. In the simulation, the lights are considered constantly turned on, each hour of the day and seven
days per week.
3.1.3 Ventilation and infiltration
Ventilation rates for the poultry house were calculated on the basis of the reference values suggested
by ASHRAE (2015). According to this source, for winter conditions the ventilation rate should be set
at 0.1 l/s of fresh air per each kilogram of live animal inside the house; on the other hand, summer
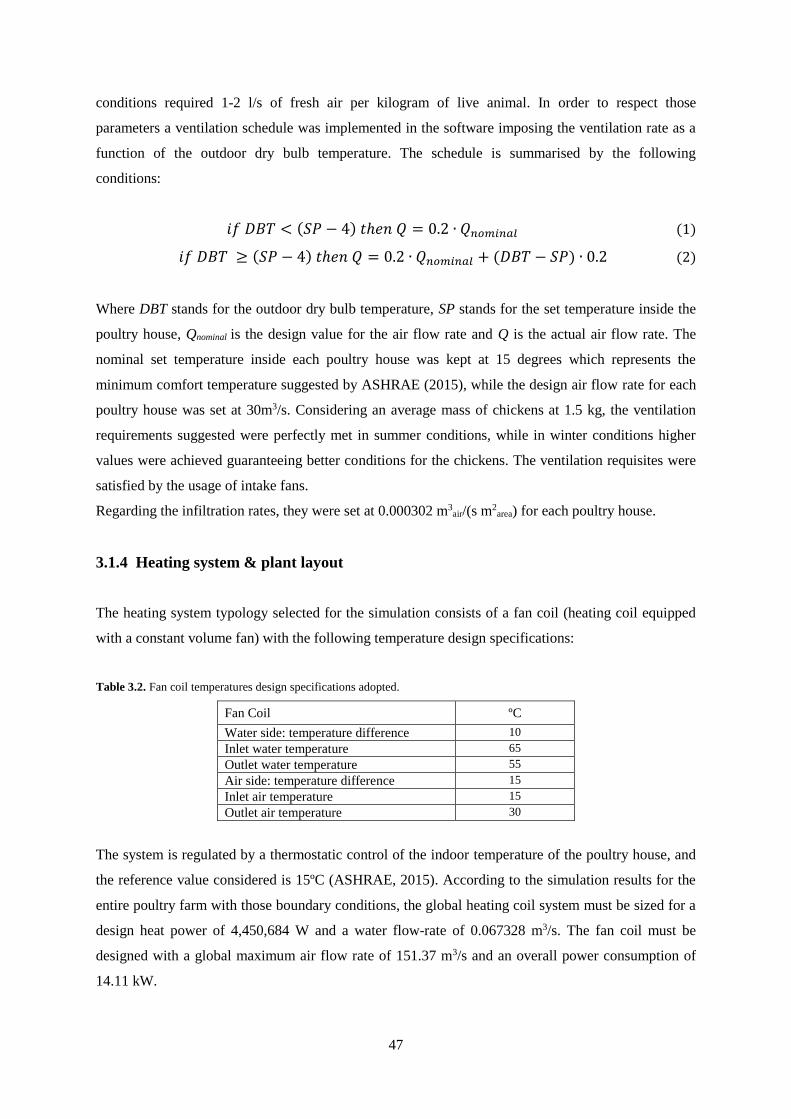
47
conditions required 1-2 l/s of fresh air per kilogram of live animal. In order to respect those
parameters a ventilation schedule was implemented in the software imposing the ventilation rate as a
function of the outdoor dry bulb temperature. The schedule is summarised by the following
conditions:
𝑖𝑓 𝐷𝐵𝑇 < (𝑆𝑃 − 4) 𝑡ℎ𝑒𝑛 𝑄 = 0.2 ∙ 𝑄𝑛𝑜𝑚𝑖𝑛𝑎𝑙 (1)
𝑖𝑓 𝐷𝐵𝑇 ≥ (𝑆𝑃 − 4) 𝑡ℎ𝑒𝑛 𝑄 = 0.2 ∙ 𝑄𝑛𝑜𝑚𝑖𝑛𝑎𝑙 + (𝐷𝐵𝑇 − 𝑆𝑃) ∙ 0.2 (2)
Where DBT stands for the outdoor dry bulb temperature, SP stands for the set temperature inside the
poultry house, Qnominal is the design value for the air flow rate and Q is the actual air flow rate. The
nominal set temperature inside each poultry house was kept at 15 degrees which represents the
minimum comfort temperature suggested by ASHRAE (2015), while the design air flow rate for each
poultry house was set at 30m3/s. Considering an average mass of chickens at 1.5 kg, the ventilation
requirements suggested were perfectly met in summer conditions, while in winter conditions higher
values were achieved guaranteeing better conditions for the chickens. The ventilation requisites were
satisfied by the usage of intake fans.
Regarding the infiltration rates, they were set at 0.000302 m3air/(s m2
area) for each poultry house.
3.1.4 Heating system & plant layout
The heating system typology selected for the simulation consists of a fan coil (heating coil equipped
with a constant volume fan) with the following temperature design specifications:
Table 3.2. Fan coil temperatures design specifications adopted.
Fan Coil ºC
Water side: temperature difference 10
Inlet water temperature 65
Outlet water temperature 55
Air side: temperature difference 15
Inlet air temperature 15
Outlet air temperature 30
The system is regulated by a thermostatic control of the indoor temperature of the poultry house, and
the reference value considered is 15ºC (ASHRAE, 2015). According to the simulation results for the
entire poultry farm with those boundary conditions, the global heating coil system must be sized for a
design heat power of 4,450,684 W and a water flow-rate of 0.067328 m3/s. The fan coil must be
designed with a global maximum air flow rate of 151.37 m3/s and an overall power consumption of
14.11 kW.
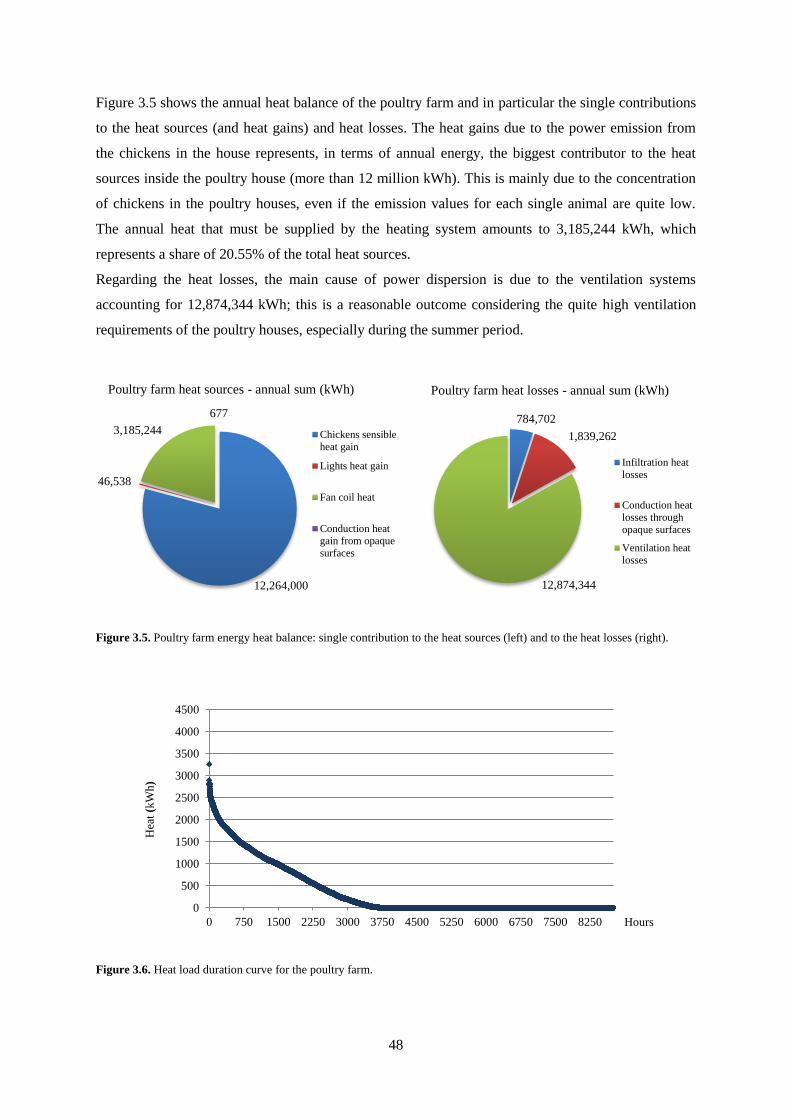
48
Figure 3.5 shows the annual heat balance of the poultry farm and in particular the single contributions
to the heat sources (and heat gains) and heat losses. The heat gains due to the power emission from
the chickens in the house represents, in terms of annual energy, the biggest contributor to the heat
sources inside the poultry house (more than 12 million kWh). This is mainly due to the concentration
of chickens in the poultry houses, even if the emission values for each single animal are quite low.
The annual heat that must be supplied by the heating system amounts to 3,185,244 kWh, which
represents a share of 20.55% of the total heat sources.
Regarding the heat losses, the main cause of power dispersion is due to the ventilation systems
accounting for 12,874,344 kWh; this is a reasonable outcome considering the quite high ventilation
requirements of the poultry houses, especially during the summer period.
Figure 3.5. Poultry farm energy heat balance: single contribution to the heat sources (left) and to the heat losses (right).
Figure 3.6. Heat load duration curve for the poultry farm.
0
500
1000
1500
2000
2500
3000
3500
4000
4500
0 750 1500 2250 3000 3750 4500 5250 6000 6750 7500 8250
Hea
t(k
Wh
)
Hours
12,264,000
46,538
3,185,244
677
Poultry farm heat sources - annual sum (kWh)
Chickens sensible
heat gain
Lights heat gain
Fan coil heat
Conduction heat
gain from opaque
surfaces
784,702
1,839,262
12,874,344
Poultry farm heat losses - annual sum (kWh)
Infiltration heat
losses
Conduction heat
losses through
opaque surfaces
Ventilation heat
losses
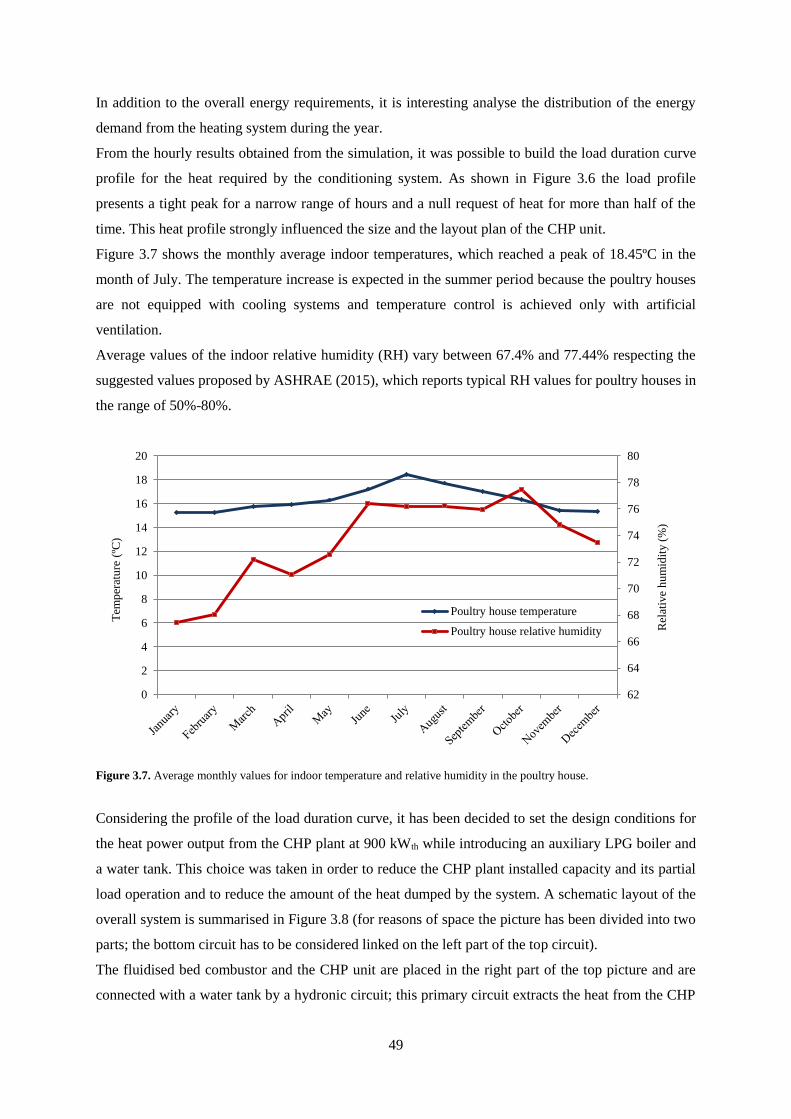
49
In addition to the overall energy requirements, it is interesting analyse the distribution of the energy
demand from the heating system during the year.
From the hourly results obtained from the simulation, it was possible to build the load duration curve
profile for the heat required by the conditioning system. As shown in Figure 3.6 the load profile
presents a tight peak for a narrow range of hours and a null request of heat for more than half of the
time. This heat profile strongly influenced the size and the layout plan of the CHP unit.
Figure 3.7 shows the monthly average indoor temperatures, which reached a peak of 18.45ºC in the
month of July. The temperature increase is expected in the summer period because the poultry houses
are not equipped with cooling systems and temperature control is achieved only with artificial
ventilation.
Average values of the indoor relative humidity (RH) vary between 67.4% and 77.44% respecting the
suggested values proposed by ASHRAE (2015), which reports typical RH values for poultry houses in
the range of 50%-80%.
Figure 3.7. Average monthly values for indoor temperature and relative humidity in the poultry house.
Considering the profile of the load duration curve, it has been decided to set the design conditions for
the heat power output from the CHP plant at 900 kWth while introducing an auxiliary LPG boiler and
a water tank. This choice was taken in order to reduce the CHP plant installed capacity and its partial
load operation and to reduce the amount of the heat dumped by the system. A schematic layout of the
overall system is summarised in Figure 3.8 (for reasons of space the picture has been divided into two
parts; the bottom circuit has to be considered linked on the left part of the top circuit).
The fluidised bed combustor and the CHP unit are placed in the right part of the top picture and are
connected with a water tank by a hydronic circuit; this primary circuit extracts the heat from the CHP
62
64
66
68
70
72
74
76
78
80
0
2
4
6
8
10
12
14
16
18
20
Rel
ativ
e h
um
idit
y (
%)
Tem
per
atu
re (
ºC)
Poultry house temperature
Poultry house relative humidity
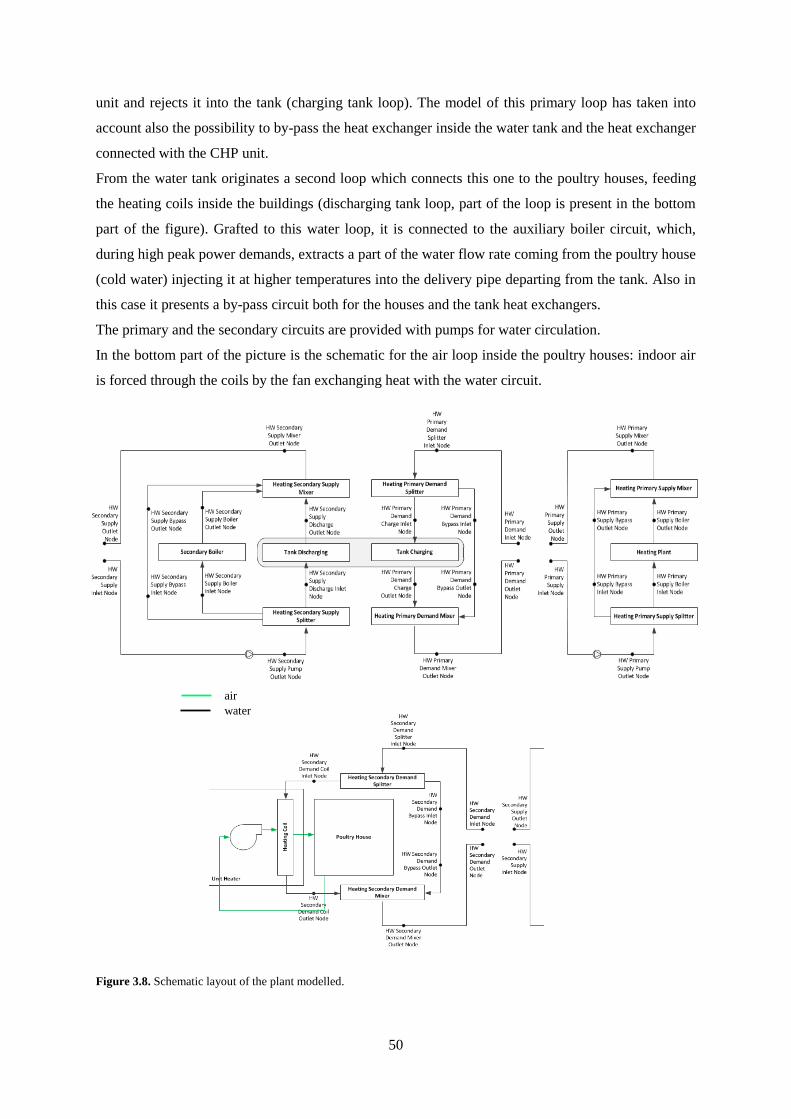
50
unit and rejects it into the tank (charging tank loop). The model of this primary loop has taken into
account also the possibility to by-pass the heat exchanger inside the water tank and the heat exchanger
connected with the CHP unit.
From the water tank originates a second loop which connects this one to the poultry houses, feeding
the heating coils inside the buildings (discharging tank loop, part of the loop is present in the bottom
part of the figure). Grafted to this water loop, it is connected to the auxiliary boiler circuit, which,
during high peak power demands, extracts a part of the water flow rate coming from the poultry house
(cold water) injecting it at higher temperatures into the delivery pipe departing from the tank. Also in
this case it presents a by-pass circuit both for the houses and the tank heat exchangers.
The primary and the secondary circuits are provided with pumps for water circulation.
In the bottom part of the picture is the schematic for the air loop inside the poultry houses: indoor air
is forced through the coils by the fan exchanging heat with the water circuit.
Figure 3.8. Schematic layout of the plant modelled.
water air
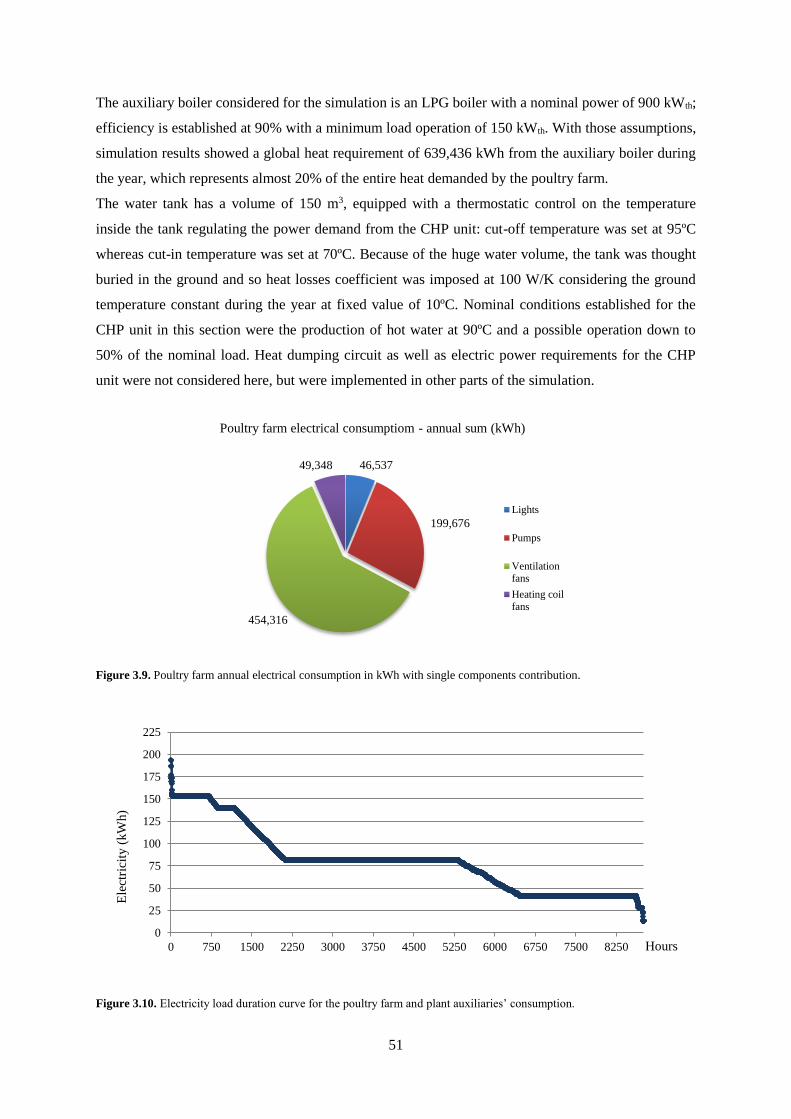
51
The auxiliary boiler considered for the simulation is an LPG boiler with a nominal power of 900 kWth;
efficiency is established at 90% with a minimum load operation of 150 kWth. With those assumptions,
simulation results showed a global heat requirement of 639,436 kWh from the auxiliary boiler during
the year, which represents almost 20% of the entire heat demanded by the poultry farm.
The water tank has a volume of 150 m3, equipped with a thermostatic control on the temperature
inside the tank regulating the power demand from the CHP unit: cut-off temperature was set at 95ºC
whereas cut-in temperature was set at 70ºC. Because of the huge water volume, the tank was thought
buried in the ground and so heat losses coefficient was imposed at 100 W/K considering the ground
temperature constant during the year at fixed value of 10ºC. Nominal conditions established for the
CHP unit in this section were the production of hot water at 90ºC and a possible operation down to
50% of the nominal load. Heat dumping circuit as well as electric power requirements for the CHP
unit were not considered here, but were implemented in other parts of the simulation.
Figure 3.9. Poultry farm annual electrical consumption in kWh with single components contribution.
Figure 3.10. Electricity load duration curve for the poultry farm and plant auxiliaries’ consumption.
46,537
199,676
454,316
49,348
Poultry farm electrical consumptiom - annual sum (kWh)
Lights
Pumps
Ventilation
fans
Heating coil
fans
0
25
50
75
100
125
150
175
200
225
0 750 1500 2250 3000 3750 4500 5250 6000 6750 7500 8250
Ele
ctri
city
(kW
h)
Hours
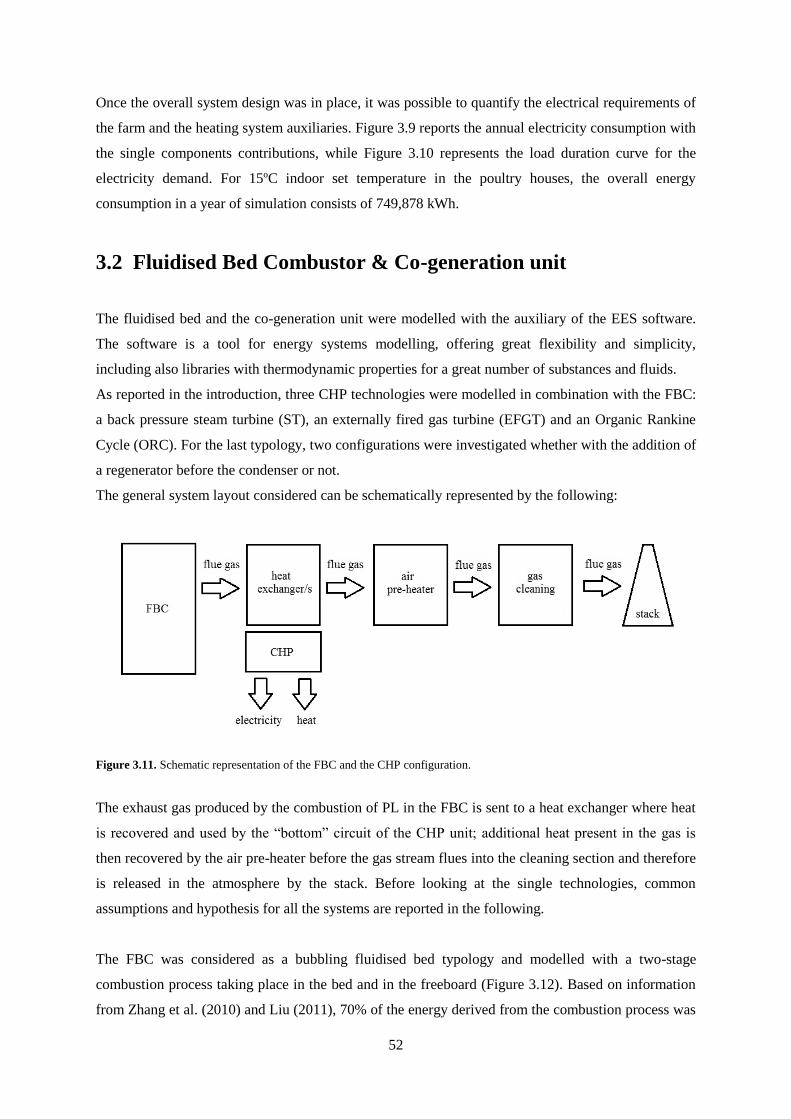
52
Once the overall system design was in place, it was possible to quantify the electrical requirements of
the farm and the heating system auxiliaries. Figure 3.9 reports the annual electricity consumption with
the single components contributions, while Figure 3.10 represents the load duration curve for the
electricity demand. For 15ºC indoor set temperature in the poultry houses, the overall energy
consumption in a year of simulation consists of 749,878 kWh.
3.2 Fluidised Bed Combustor & Co-generation unit
The fluidised bed and the co-generation unit were modelled with the auxiliary of the EES software.
The software is a tool for energy systems modelling, offering great flexibility and simplicity,
including also libraries with thermodynamic properties for a great number of substances and fluids.
As reported in the introduction, three CHP technologies were modelled in combination with the FBC:
a back pressure steam turbine (ST), an externally fired gas turbine (EFGT) and an Organic Rankine
Cycle (ORC). For the last typology, two configurations were investigated whether with the addition of
a regenerator before the condenser or not.
The general system layout considered can be schematically represented by the following:
Figure 3.11. Schematic representation of the FBC and the CHP configuration.
The exhaust gas produced by the combustion of PL in the FBC is sent to a heat exchanger where heat
is recovered and used by the “bottom” circuit of the CHP unit; additional heat present in the gas is
then recovered by the air pre-heater before the gas stream flues into the cleaning section and therefore
is released in the atmosphere by the stack. Before looking at the single technologies, common
assumptions and hypothesis for all the systems are reported in the following.
The FBC was considered as a bubbling fluidised bed typology and modelled with a two-stage
combustion process taking place in the bed and in the freeboard (Figure 3.12). Based on information
from Zhang et al. (2010) and Liu (2011), 70% of the energy derived from the combustion process was
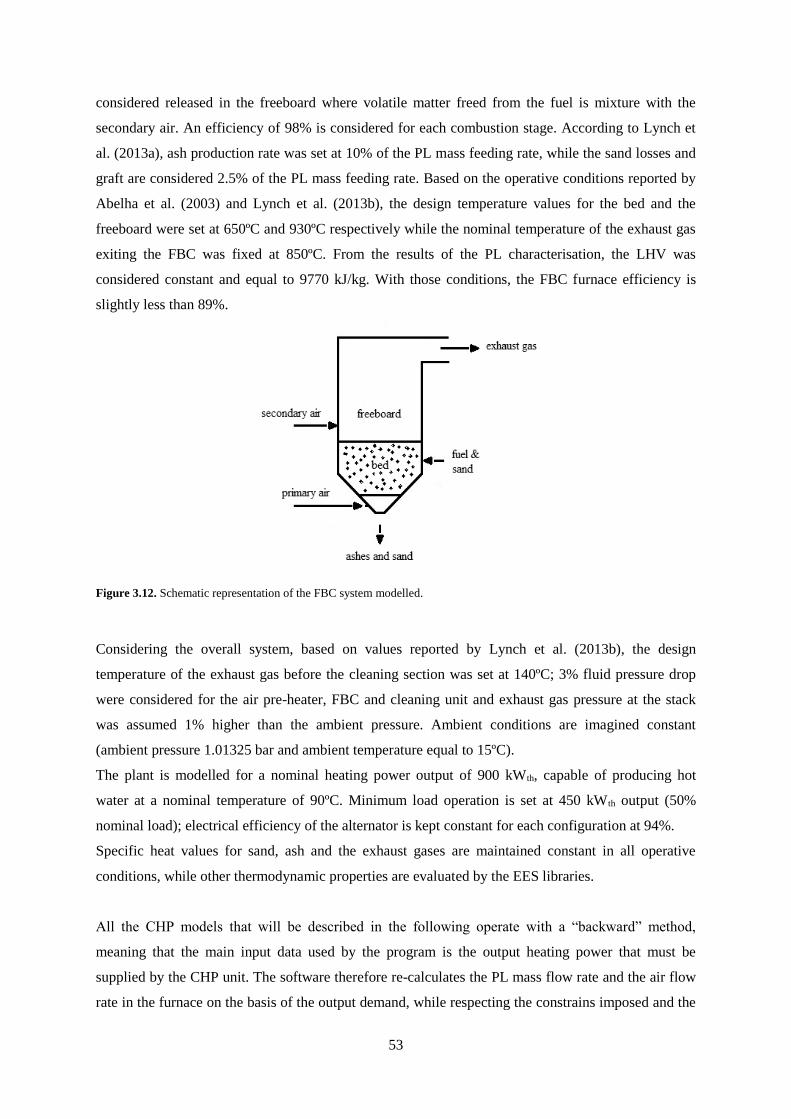
53
considered released in the freeboard where volatile matter freed from the fuel is mixture with the
secondary air. An efficiency of 98% is considered for each combustion stage. According to Lynch et
al. (2013a), ash production rate was set at 10% of the PL mass feeding rate, while the sand losses and
graft are considered 2.5% of the PL mass feeding rate. Based on the operative conditions reported by
Abelha et al. (2003) and Lynch et al. (2013b), the design temperature values for the bed and the
freeboard were set at 650ºC and 930ºC respectively while the nominal temperature of the exhaust gas
exiting the FBC was fixed at 850ºC. From the results of the PL characterisation, the LHV was
considered constant and equal to 9770 kJ/kg. With those conditions, the FBC furnace efficiency is
slightly less than 89%.
Figure 3.12. Schematic representation of the FBC system modelled.
Considering the overall system, based on values reported by Lynch et al. (2013b), the design
temperature of the exhaust gas before the cleaning section was set at 140ºC; 3% fluid pressure drop
were considered for the air pre-heater, FBC and cleaning unit and exhaust gas pressure at the stack
was assumed 1% higher than the ambient pressure. Ambient conditions are imagined constant
(ambient pressure 1.01325 bar and ambient temperature equal to 15ºC).
The plant is modelled for a nominal heating power output of 900 kWth, capable of producing hot
water at a nominal temperature of 90ºC. Minimum load operation is set at 450 kWth output (50%
nominal load); electrical efficiency of the alternator is kept constant for each configuration at 94%.
Specific heat values for sand, ash and the exhaust gases are maintained constant in all operative
conditions, while other thermodynamic properties are evaluated by the EES libraries.
All the CHP models that will be described in the following operate with a “backward” method,
meaning that the main input data used by the program is the output heating power that must be
supplied by the CHP unit. The software therefore re-calculates the PL mass flow rate and the air flow
rate in the furnace on the basis of the output demand, while respecting the constrains imposed and the
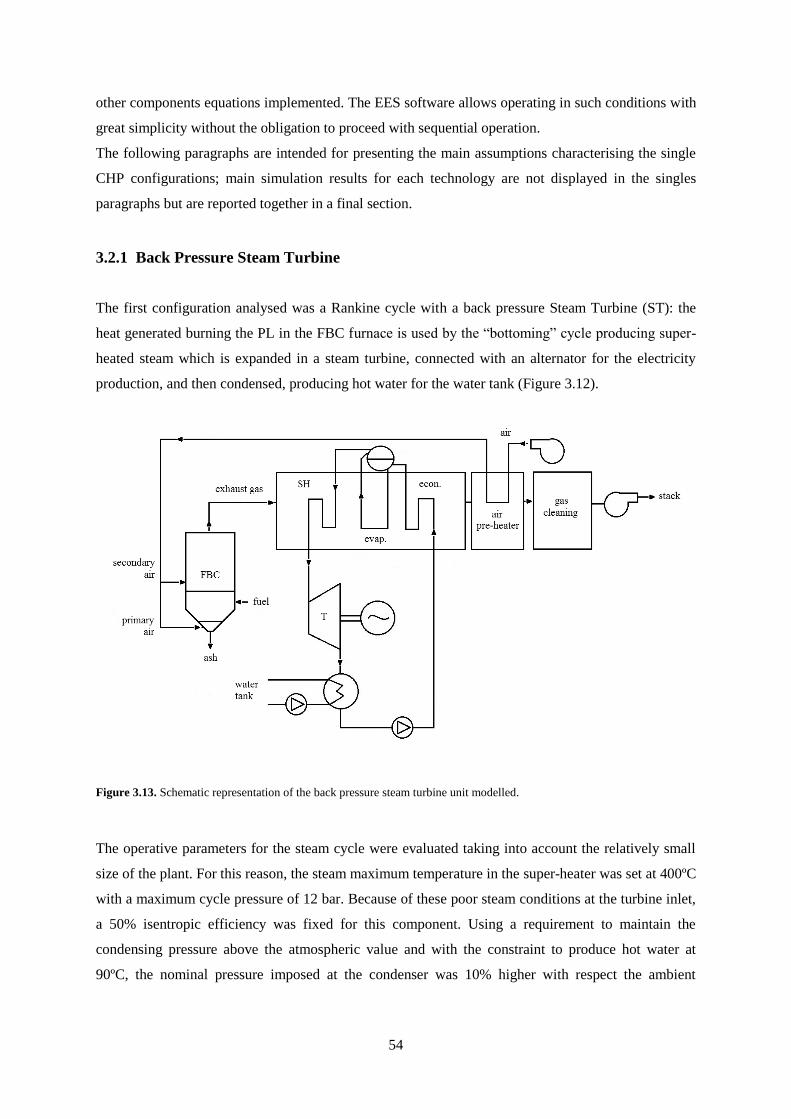
54
other components equations implemented. The EES software allows operating in such conditions with
great simplicity without the obligation to proceed with sequential operation.
The following paragraphs are intended for presenting the main assumptions characterising the single
CHP configurations; main simulation results for each technology are not displayed in the singles
paragraphs but are reported together in a final section.
3.2.1 Back Pressure Steam Turbine
The first configuration analysed was a Rankine cycle with a back pressure Steam Turbine (ST): the
heat generated burning the PL in the FBC furnace is used by the “bottoming” cycle producing super-
heated steam which is expanded in a steam turbine, connected with an alternator for the electricity
production, and then condensed, producing hot water for the water tank (Figure 3.12).
Figure 3.13. Schematic representation of the back pressure steam turbine unit modelled.
The operative parameters for the steam cycle were evaluated taking into account the relatively small
size of the plant. For this reason, the steam maximum temperature in the super-heater was set at 400ºC
with a maximum cycle pressure of 12 bar. Because of these poor steam conditions at the turbine inlet,
a 50% isentropic efficiency was fixed for this component. Using a requirement to maintain the
condensing pressure above the atmospheric value and with the constraint to produce hot water at
90ºC, the nominal pressure imposed at the condenser was 10% higher with respect the ambient
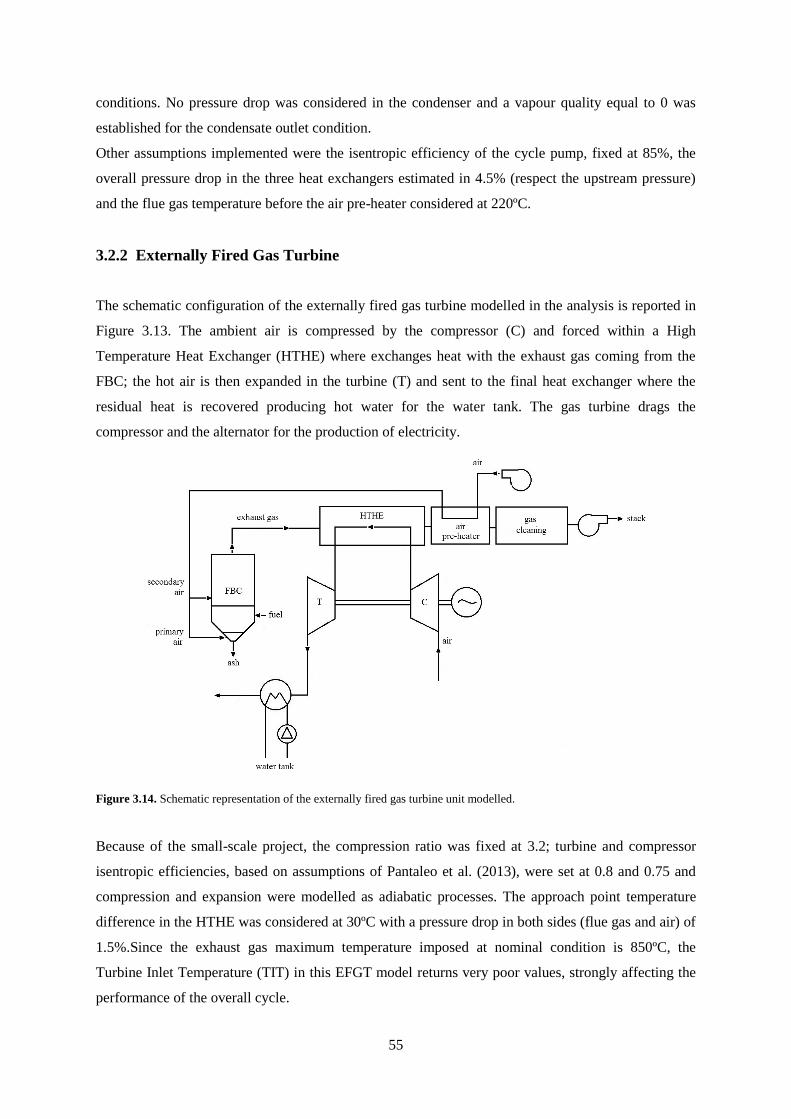
55
conditions. No pressure drop was considered in the condenser and a vapour quality equal to 0 was
established for the condensate outlet condition.
Other assumptions implemented were the isentropic efficiency of the cycle pump, fixed at 85%, the
overall pressure drop in the three heat exchangers estimated in 4.5% (respect the upstream pressure)
and the flue gas temperature before the air pre-heater considered at 220ºC.
3.2.2 Externally Fired Gas Turbine
The schematic configuration of the externally fired gas turbine modelled in the analysis is reported in
Figure 3.13. The ambient air is compressed by the compressor (C) and forced within a High
Temperature Heat Exchanger (HTHE) where exchanges heat with the exhaust gas coming from the
FBC; the hot air is then expanded in the turbine (T) and sent to the final heat exchanger where the
residual heat is recovered producing hot water for the water tank. The gas turbine drags the
compressor and the alternator for the production of electricity.
Figure 3.14. Schematic representation of the externally fired gas turbine unit modelled.
Because of the small-scale project, the compression ratio was fixed at 3.2; turbine and compressor
isentropic efficiencies, based on assumptions of Pantaleo et al. (2013), were set at 0.8 and 0.75 and
compression and expansion were modelled as adiabatic processes. The approach point temperature
difference in the HTHE was considered at 30ºC with a pressure drop in both sides (flue gas and air) of
1.5%.Since the exhaust gas maximum temperature imposed at nominal condition is 850ºC, the
Turbine Inlet Temperature (TIT) in this EFGT model returns very poor values, strongly affecting the
performance of the overall cycle.
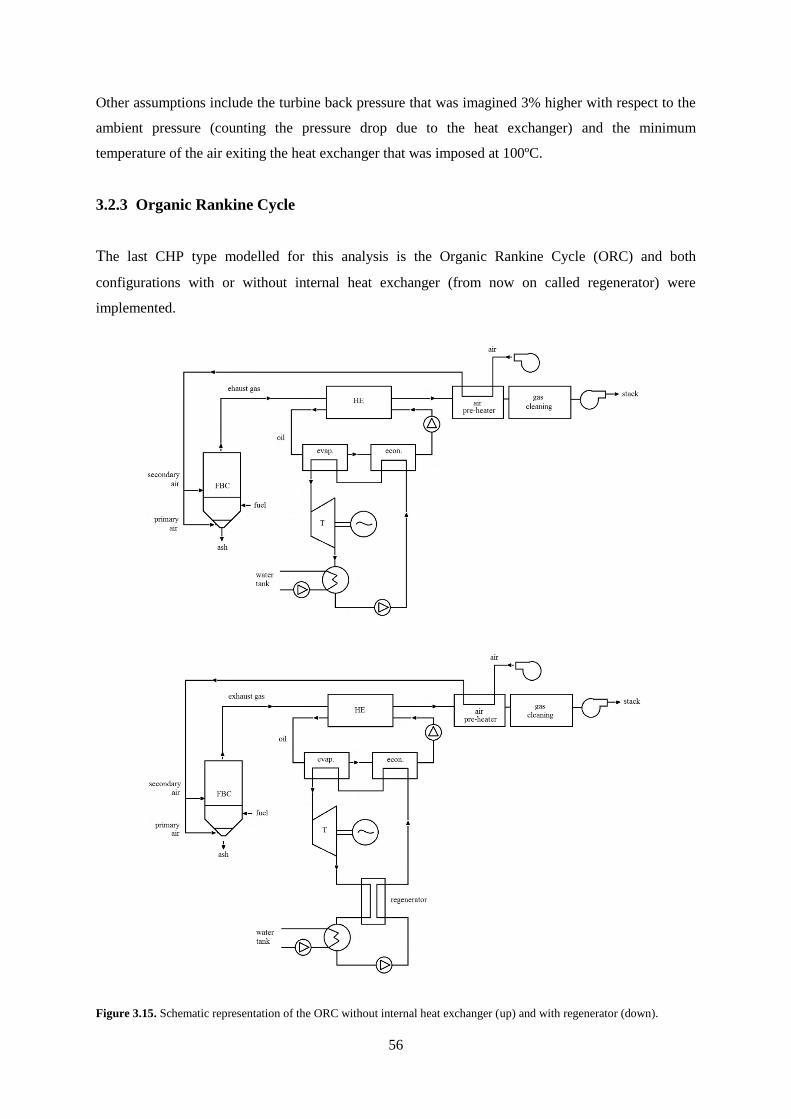
56
Other assumptions include the turbine back pressure that was imagined 3% higher with respect to the
ambient pressure (counting the pressure drop due to the heat exchanger) and the minimum
temperature of the air exiting the heat exchanger that was imposed at 100ºC.
3.2.3 Organic Rankine Cycle
The last CHP type modelled for this analysis is the Organic Rankine Cycle (ORC) and both
configurations with or without internal heat exchanger (from now on called regenerator) were
implemented.
Figure 3.15. Schematic representation of the ORC without internal heat exchanger (up) and with regenerator (down).
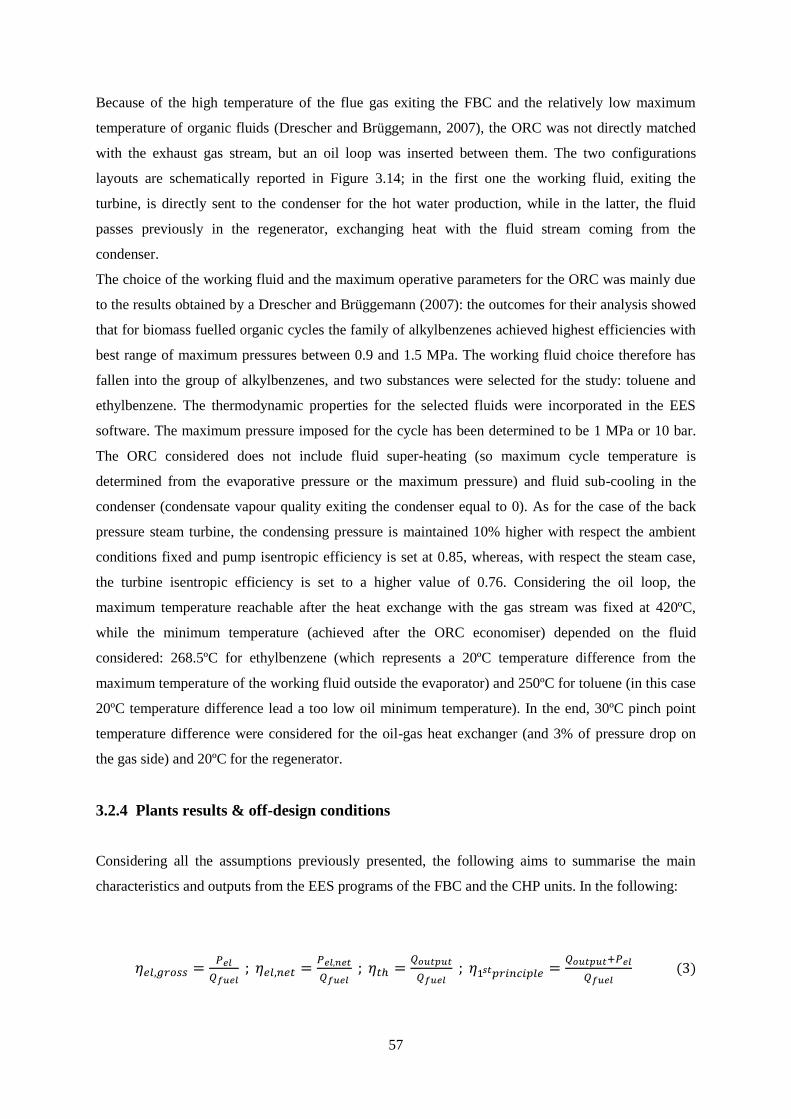
57
Because of the high temperature of the flue gas exiting the FBC and the relatively low maximum
temperature of organic fluids (Drescher and Brüggemann, 2007), the ORC was not directly matched
with the exhaust gas stream, but an oil loop was inserted between them. The two configurations
layouts are schematically reported in Figure 3.14; in the first one the working fluid, exiting the
turbine, is directly sent to the condenser for the hot water production, while in the latter, the fluid
passes previously in the regenerator, exchanging heat with the fluid stream coming from the
condenser.
The choice of the working fluid and the maximum operative parameters for the ORC was mainly due
to the results obtained by a Drescher and Brüggemann (2007): the outcomes for their analysis showed
that for biomass fuelled organic cycles the family of alkylbenzenes achieved highest efficiencies with
best range of maximum pressures between 0.9 and 1.5 MPa. The working fluid choice therefore has
fallen into the group of alkylbenzenes, and two substances were selected for the study: toluene and
ethylbenzene. The thermodynamic properties for the selected fluids were incorporated in the EES
software. The maximum pressure imposed for the cycle has been determined to be 1 MPa or 10 bar.
The ORC considered does not include fluid super-heating (so maximum cycle temperature is
determined from the evaporative pressure or the maximum pressure) and fluid sub-cooling in the
condenser (condensate vapour quality exiting the condenser equal to 0). As for the case of the back
pressure steam turbine, the condensing pressure is maintained 10% higher with respect the ambient
conditions fixed and pump isentropic efficiency is set at 0.85, whereas, with respect the steam case,
the turbine isentropic efficiency is set to a higher value of 0.76. Considering the oil loop, the
maximum temperature reachable after the heat exchange with the gas stream was fixed at 420ºC,
while the minimum temperature (achieved after the ORC economiser) depended on the fluid
considered: 268.5ºC for ethylbenzene (which represents a 20ºC temperature difference from the
maximum temperature of the working fluid outside the evaporator) and 250ºC for toluene (in this case
20ºC temperature difference lead a too low oil minimum temperature). In the end, 30ºC pinch point
temperature difference were considered for the oil-gas heat exchanger (and 3% of pressure drop on
the gas side) and 20ºC for the regenerator.
3.2.4 Plants results & off-design conditions
Considering all the assumptions previously presented, the following aims to summarise the main
characteristics and outputs from the EES programs of the FBC and the CHP units. In the following:
𝜂𝑒𝑙,𝑔𝑟𝑜𝑠𝑠 =𝑃𝑒𝑙
𝑄𝑓𝑢𝑒𝑙 ; 𝜂𝑒𝑙,𝑛𝑒𝑡 =
𝑃𝑒𝑙,𝑛𝑒𝑡
𝑄𝑓𝑢𝑒𝑙 ; 𝜂𝑡ℎ =
𝑄𝑜𝑢𝑡𝑝𝑢𝑡
𝑄𝑓𝑢𝑒𝑙 ; 𝜂1𝑠𝑡𝑝𝑟𝑖𝑛𝑐𝑖𝑝𝑙𝑒 =
𝑄𝑜𝑢𝑡𝑝𝑢𝑡+𝑃𝑒𝑙
𝑄𝑓𝑢𝑒𝑙 (3)
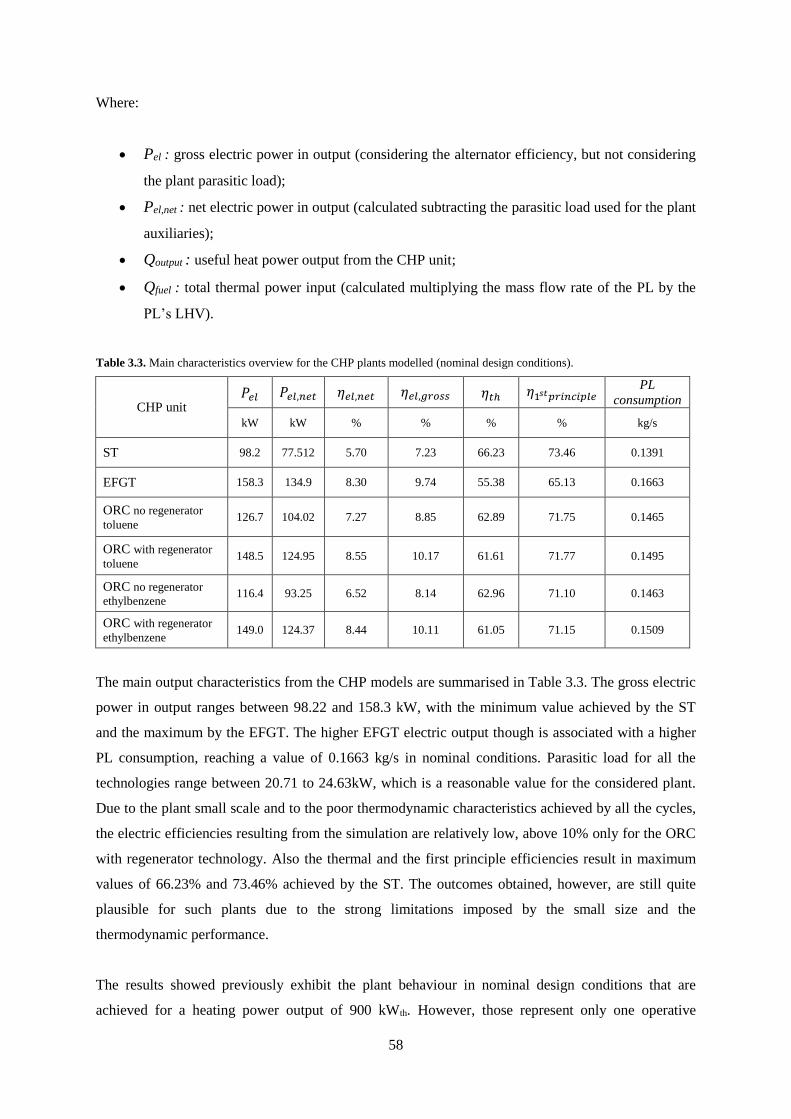
58
Where:
Pel : gross electric power in output (considering the alternator efficiency, but not considering
the plant parasitic load);
Pel,net : net electric power in output (calculated subtracting the parasitic load used for the plant
auxiliaries);
Qoutput : useful heat power output from the CHP unit;
Qfuel : total thermal power input (calculated multiplying the mass flow rate of the PL by the
PL’s LHV).
Table 3.3. Main characteristics overview for the CHP plants modelled (nominal design conditions).
CHP unit 𝑃𝑒𝑙 𝑃𝑒𝑙,𝑛𝑒𝑡 𝜂𝑒𝑙,𝑛𝑒𝑡 𝜂𝑒𝑙,𝑔𝑟𝑜𝑠𝑠 𝜂𝑡ℎ 𝜂1𝑠𝑡𝑝𝑟𝑖𝑛𝑐𝑖𝑝𝑙𝑒
PL
consumption
kW kW % % % % kg/s
ST 98.2 77.512 5.70 7.23 66.23 73.46 0.1391
EFGT 158.3 134.9 8.30 9.74 55.38 65.13 0.1663
ORC no regenerator
toluene 126.7 104.02 7.27 8.85 62.89 71.75 0.1465
ORC with regenerator
toluene 148.5 124.95 8.55 10.17 61.61 71.77 0.1495
ORC no regenerator
ethylbenzene 116.4 93.25 6.52 8.14 62.96 71.10 0.1463
ORC with regenerator
ethylbenzene 149.0 124.37 8.44 10.11 61.05 71.15 0.1509
The main output characteristics from the CHP models are summarised in Table 3.3. The gross electric
power in output ranges between 98.22 and 158.3 kW, with the minimum value achieved by the ST
and the maximum by the EFGT. The higher EFGT electric output though is associated with a higher
PL consumption, reaching a value of 0.1663 kg/s in nominal conditions. Parasitic load for all the
technologies range between 20.71 to 24.63kW, which is a reasonable value for the considered plant.
Due to the plant small scale and to the poor thermodynamic characteristics achieved by all the cycles,
the electric efficiencies resulting from the simulation are relatively low, above 10% only for the ORC
with regenerator technology. Also the thermal and the first principle efficiencies result in maximum
values of 66.23% and 73.46% achieved by the ST. The outcomes obtained, however, are still quite
plausible for such plants due to the strong limitations imposed by the small size and the
thermodynamic performance.
The results showed previously exhibit the plant behaviour in nominal design conditions that are
achieved for a heating power output of 900 kWth. However, those represent only one operative
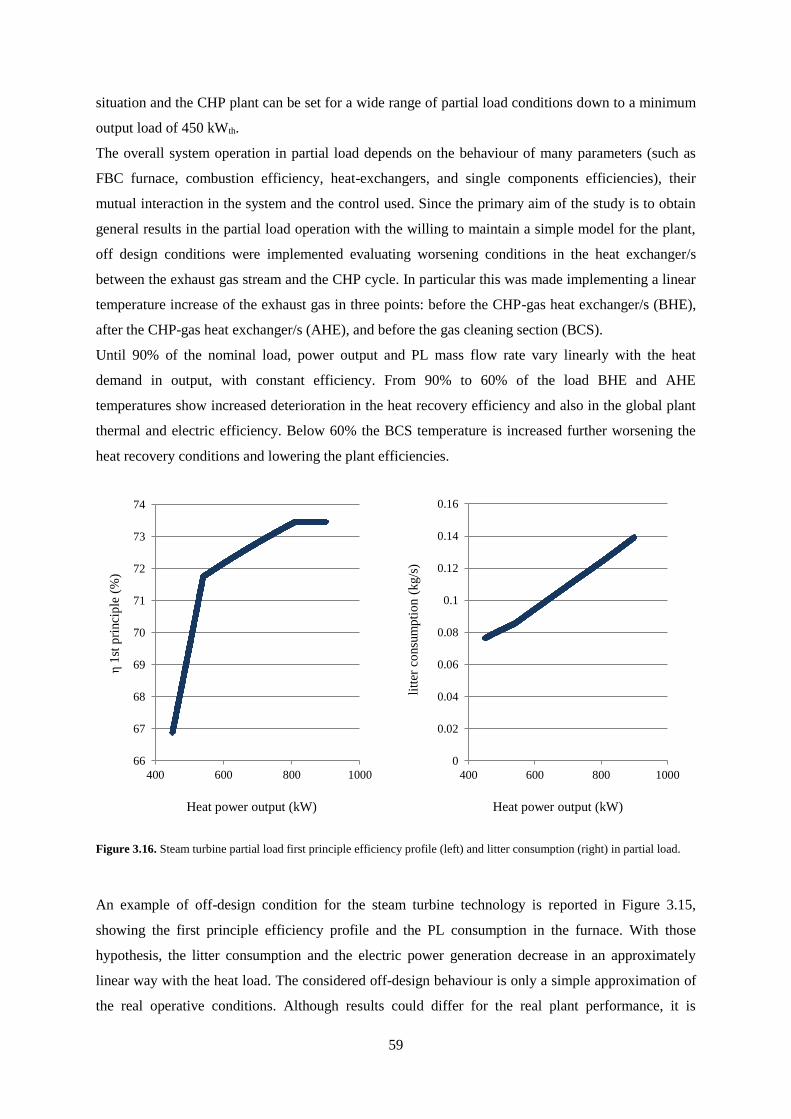
59
situation and the CHP plant can be set for a wide range of partial load conditions down to a minimum
output load of 450 kWth.
The overall system operation in partial load depends on the behaviour of many parameters (such as
FBC furnace, combustion efficiency, heat-exchangers, and single components efficiencies), their
mutual interaction in the system and the control used. Since the primary aim of the study is to obtain
general results in the partial load operation with the willing to maintain a simple model for the plant,
off design conditions were implemented evaluating worsening conditions in the heat exchanger/s
between the exhaust gas stream and the CHP cycle. In particular this was made implementing a linear
temperature increase of the exhaust gas in three points: before the CHP-gas heat exchanger/s (BHE),
after the CHP-gas heat exchanger/s (AHE), and before the gas cleaning section (BCS).
Until 90% of the nominal load, power output and PL mass flow rate vary linearly with the heat
demand in output, with constant efficiency. From 90% to 60% of the load BHE and AHE
temperatures show increased deterioration in the heat recovery efficiency and also in the global plant
thermal and electric efficiency. Below 60% the BCS temperature is increased further worsening the
heat recovery conditions and lowering the plant efficiencies.
Figure 3.16. Steam turbine partial load first principle efficiency profile (left) and litter consumption (right) in partial load.
An example of off-design condition for the steam turbine technology is reported in Figure 3.15,
showing the first principle efficiency profile and the PL consumption in the furnace. With those
hypothesis, the litter consumption and the electric power generation decrease in an approximately
linear way with the heat load. The considered off-design behaviour is only a simple approximation of
the real operative conditions. Although results could differ for the real plant performance, it is
0
0.02
0.04
0.06
0.08
0.1
0.12
0.14
0.16
400 600 800 1000
litt
er c
onsu
mp
tio
n (
kg/s
)
Heat power output (kW)
66
67
68
69
70
71
72
73
74
400 600 800 1000
η1
st p
rinci
ple
(%
)
Heat power output (kW)
60
appropriate to remember at this point that the main aim of the entire model is to evaluate the
economic opportunity for the whole system which is affected by all the assumptions made in the
entire methodology process.
For this reason possible discrepancies are evaluated in a sensibility analysis at the end of the study, in
order to take into account possible incongruities present in all the model-building process.
3.3 CHP operation setting
Once the heat and electricity demand were determined and the relevant CHP configurations were
modelled, the following discussion shows how to operate the plant in order to satisfy the energy
requests from the poultry house. In general the configuration setting of a CHP plant depends on an
economic balance which aims to minimize the generation cost function and maximize the income
from the CHP operation. This means that in each instant the heat and electricity demand are matched
at the lowest marginal cost, including the possibility to buy electricity from the grid when it is
particularly convenient or the opportunity to “dump” heat for higher electricity production (when the
electricity tariff is particularly high).
The plant in consideration slightly differs from the general behaviour. In this particular case the CHP
unit is mainly implemented for satisfying the self-consumption requirements derived from the poultry
farm (above all the heating requirements) and furthermore the cost of the biomass used as a fuel for
the plant can be considered a null value (at least the litter necessary for the farm duties).
Since heat production for the poultry farm has been considered the most important target for the CHP
unit, the CHP operation setting has been developed following two cases. In the first one (from here on
called heat driven scenario), the CHP operation follows exactly the heat demand requested by the
poultry house (practically by the water tank); since the electric output in the configurations modelled
with the EES software is linked to the heat output, the electricity production in those conditions is
imposed by the heating constraint and does not take into account the electricity requirements. In this
modality, heat dumping occurs only when the heat demand is below the minimum load set for the
CHP and its maximum value cannot overcome 450 kW, condition when there is no heat requirement.
The second case implemented (from now on called choice scenario), is a more complicated modality
and is based on a simplified economic comparison. Whenever the heat demand is met by the CHP
plant, but the electricity output is lower with respect the electricity request, the model implements an
economic evaluation and determines on a cost basis if it is better fill the electricity gap through buying
electricity from the grid or matching the electric demand, thus increasing the electric output but
consuming more fuel and dumping more heat. In this scenario, the heat dumped can reach values up
to 900 kW, occurring when there are high electricity requirements and null heat demand (summer
period).
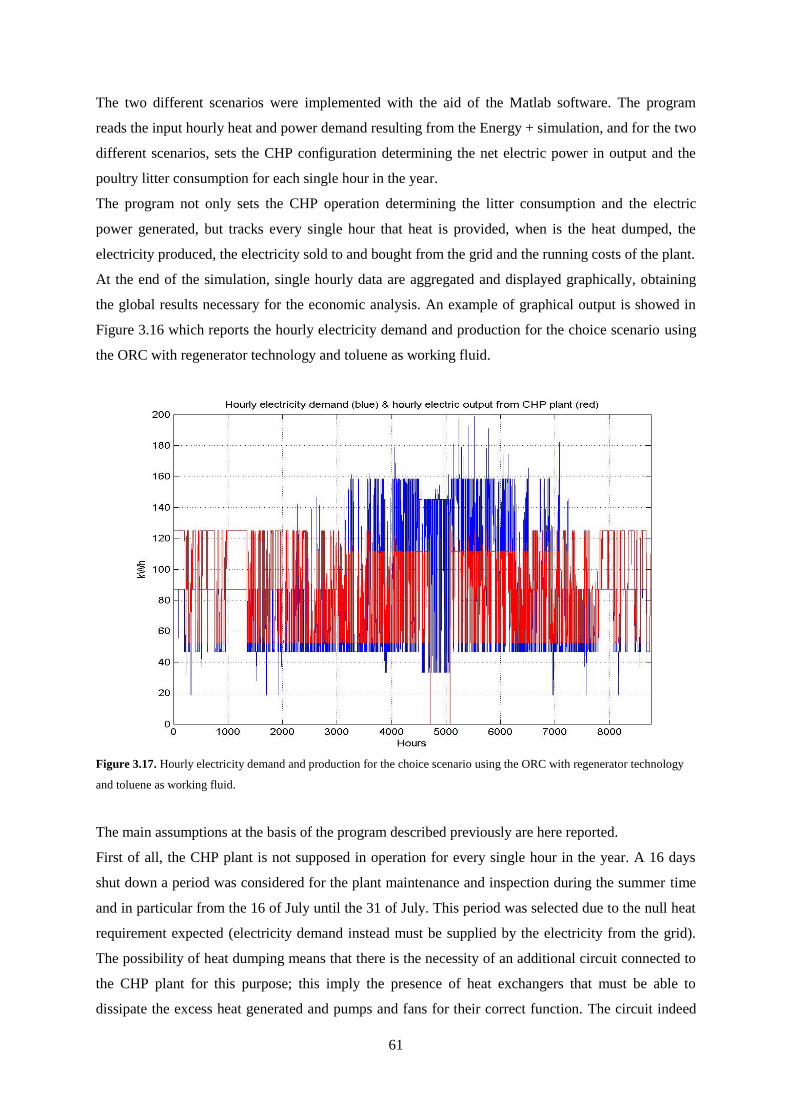
61
The two different scenarios were implemented with the aid of the Matlab software. The program
reads the input hourly heat and power demand resulting from the Energy + simulation, and for the two
different scenarios, sets the CHP configuration determining the net electric power in output and the
poultry litter consumption for each single hour in the year.
The program not only sets the CHP operation determining the litter consumption and the electric
power generated, but tracks every single hour that heat is provided, when is the heat dumped, the
electricity produced, the electricity sold to and bought from the grid and the running costs of the plant.
At the end of the simulation, single hourly data are aggregated and displayed graphically, obtaining
the global results necessary for the economic analysis. An example of graphical output is showed in
Figure 3.16 which reports the hourly electricity demand and production for the choice scenario using
the ORC with regenerator technology and toluene as working fluid.
Figure 3.17. Hourly electricity demand and production for the choice scenario using the ORC with regenerator technology
and toluene as working fluid.
The main assumptions at the basis of the program described previously are here reported.
First of all, the CHP plant is not supposed in operation for every single hour in the year. A 16 days
shut down a period was considered for the plant maintenance and inspection during the summer time
and in particular from the 16 of July until the 31 of July. This period was selected due to the null heat
requirement expected (electricity demand instead must be supplied by the electricity from the grid).
The possibility of heat dumping means that there is the necessity of an additional circuit connected to
the CHP plant for this purpose; this imply the presence of heat exchangers that must be able to
dissipate the excess heat generated and pumps and fans for their correct function. The circuit indeed
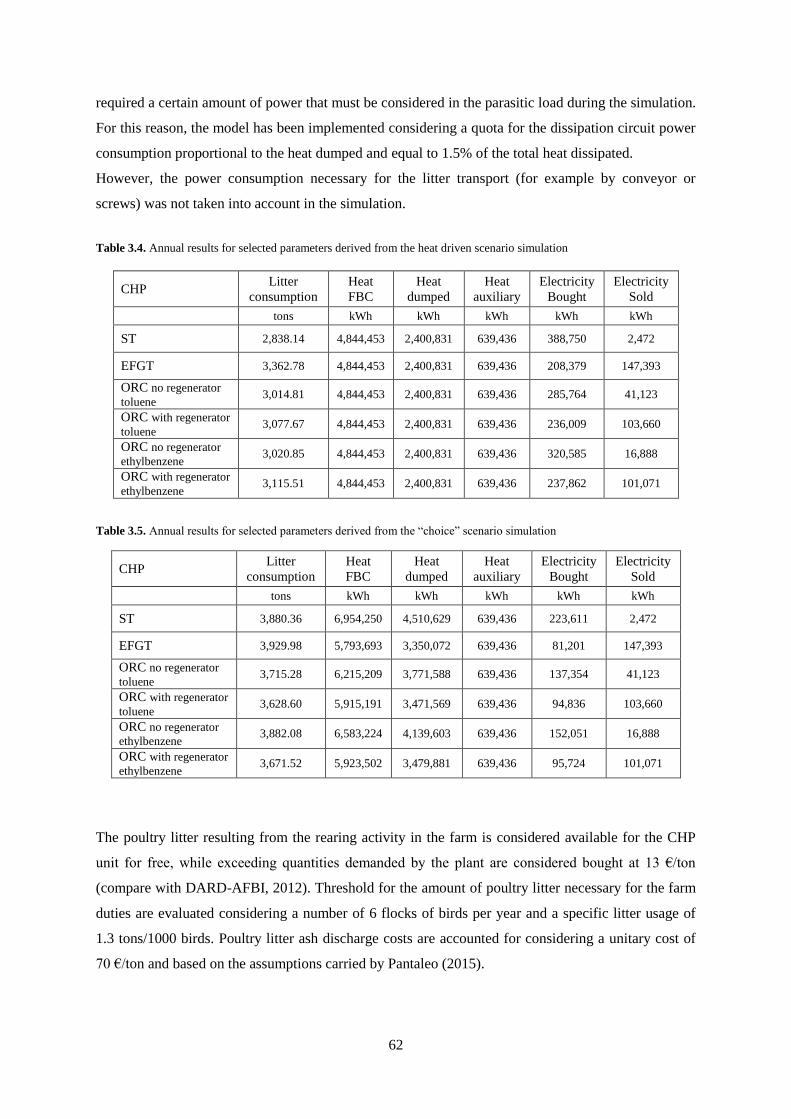
62
required a certain amount of power that must be considered in the parasitic load during the simulation.
For this reason, the model has been implemented considering a quota for the dissipation circuit power
consumption proportional to the heat dumped and equal to 1.5% of the total heat dissipated.
However, the power consumption necessary for the litter transport (for example by conveyor or
screws) was not taken into account in the simulation.
Table 3.4. Annual results for selected parameters derived from the heat driven scenario simulation
Table 3.5. Annual results for selected parameters derived from the “choice” scenario simulation
The poultry litter resulting from the rearing activity in the farm is considered available for the CHP
unit for free, while exceeding quantities demanded by the plant are considered bought at 13 €/ton
(compare with DARD-AFBI, 2012). Threshold for the amount of poultry litter necessary for the farm
duties are evaluated considering a number of 6 flocks of birds per year and a specific litter usage of
1.3 tons/1000 birds. Poultry litter ash discharge costs are accounted for considering a unitary cost of
70 €/ton and based on the assumptions carried by Pantaleo (2015).
CHP Litter
consumption
Heat
FBC
Heat
dumped
Heat
auxiliary
Electricity
Bought
Electricity
Sold
tons kWh kWh kWh kWh kWh
ST 2,838.14 4,844,453 2,400,831 639,436 388,750 2,472
EFGT 3,362.78 4,844,453 2,400,831 639,436 208,379 147,393
ORC no regenerator
toluene 3,014.81 4,844,453 2,400,831 639,436 285,764 41,123
ORC with regenerator
toluene 3,077.67 4,844,453 2,400,831 639,436 236,009 103,660
ORC no regenerator
ethylbenzene 3,020.85 4,844,453 2,400,831 639,436 320,585 16,888
ORC with regenerator
ethylbenzene 3,115.51 4,844,453 2,400,831 639,436 237,862 101,071
CHP Litter
consumption
Heat
FBC
Heat
dumped
Heat
auxiliary
Electricity
Bought
Electricity
Sold
tons kWh kWh kWh kWh kWh
ST 3,880.36 6,954,250 4,510,629 639,436 223,611 2,472
EFGT 3,929.98 5,793,693 3,350,072 639,436 81,201 147,393
ORC no regenerator
toluene 3,715.28 6,215,209 3,771,588 639,436 137,354 41,123
ORC with regenerator
toluene 3,628.60 5,915,191 3,471,569 639,436 94,836 103,660
ORC no regenerator
ethylbenzene 3,882.08 6,583,224 4,139,603 639,436 152,051 16,888
ORC with regenerator
ethylbenzene 3,671.52 5,923,502 3,479,881 639,436 95,724 101,071
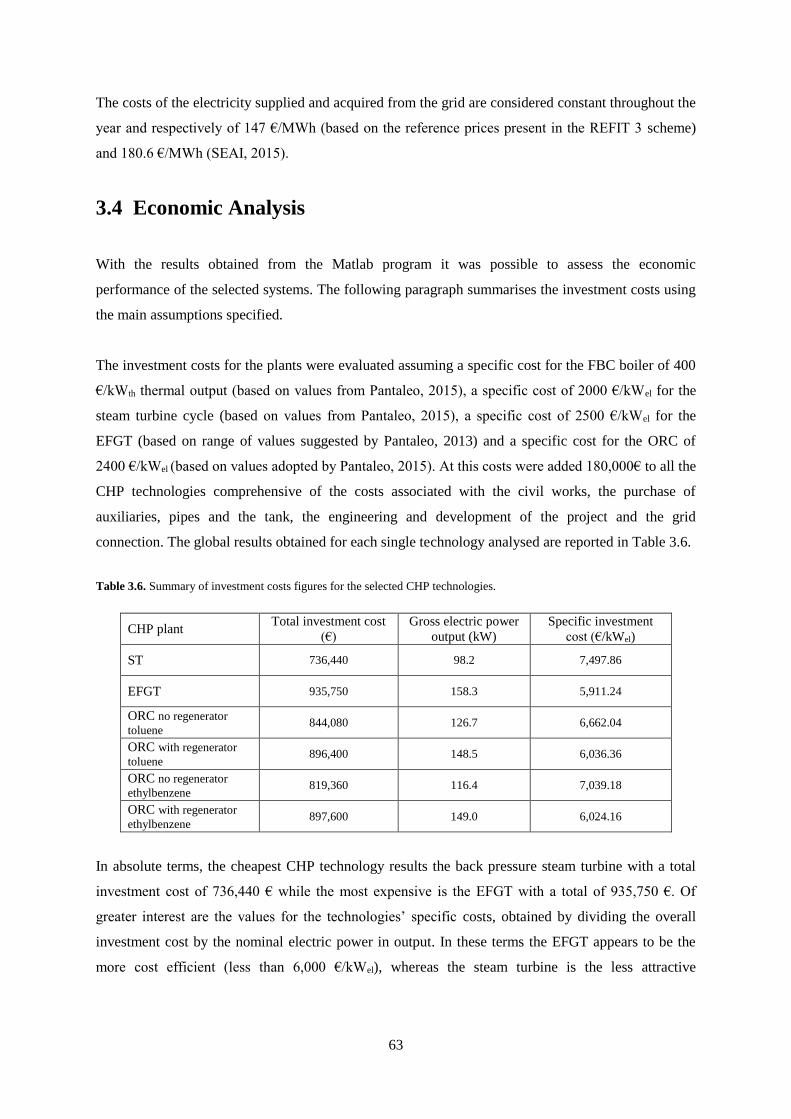
63
The costs of the electricity supplied and acquired from the grid are considered constant throughout the
year and respectively of 147 €/MWh (based on the reference prices present in the REFIT 3 scheme)
and 180.6 €/MWh (SEAI, 2015).
3.4 Economic Analysis
With the results obtained from the Matlab program it was possible to assess the economic
performance of the selected systems. The following paragraph summarises the investment costs using
the main assumptions specified.
The investment costs for the plants were evaluated assuming a specific cost for the FBC boiler of 400
€/kWth thermal output (based on values from Pantaleo, 2015), a specific cost of 2000 €/kWel for the
steam turbine cycle (based on values from Pantaleo, 2015), a specific cost of 2500 €/kWel for the
EFGT (based on range of values suggested by Pantaleo, 2013) and a specific cost for the ORC of
2400 €/kWel (based on values adopted by Pantaleo, 2015). At this costs were added 180,000€ to all the
CHP technologies comprehensive of the costs associated with the civil works, the purchase of
auxiliaries, pipes and the tank, the engineering and development of the project and the grid
connection. The global results obtained for each single technology analysed are reported in Table 3.6.
Table 3.6. Summary of investment costs figures for the selected CHP technologies.
In absolute terms, the cheapest CHP technology results the back pressure steam turbine with a total
investment cost of 736,440 € while the most expensive is the EFGT with a total of 935,750 €. Of
greater interest are the values for the technologies’ specific costs, obtained by dividing the overall
investment cost by the nominal electric power in output. In these terms the EFGT appears to be the
more cost efficient (less than 6,000 €/kWel), whereas the steam turbine is the less attractive
CHP plant Total investment cost
(€)
Gross electric power
output (kW)
Specific investment
cost (€/kWel)
ST 736,440 98.2 7,497.86
EFGT 935,750 158.3 5,911.24
ORC no regenerator
toluene 844,080 126.7 6,662.04
ORC with regenerator
toluene 896,400 148.5 6,036.36
ORC no regenerator
ethylbenzene 819,360 116.4 7,039.18
ORC with regenerator
ethylbenzene 897,600 149.0 6,024.16
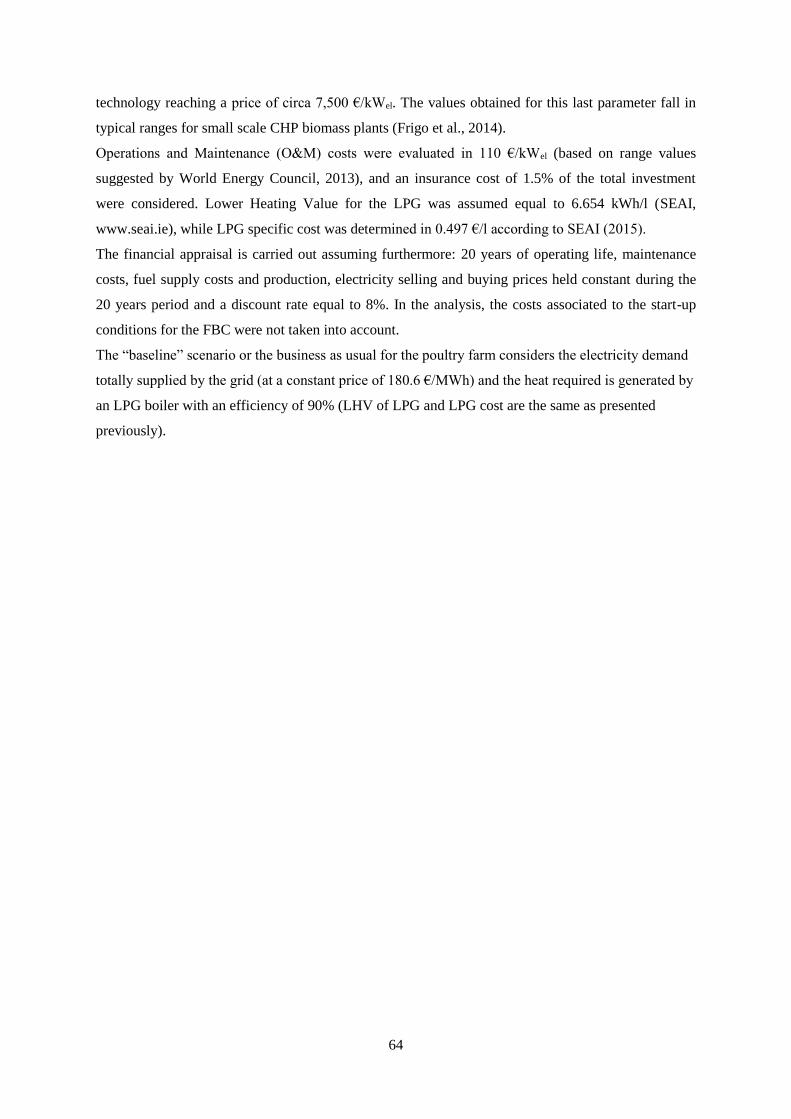
64
technology reaching a price of circa 7,500 €/kWel. The values obtained for this last parameter fall in
typical ranges for small scale CHP biomass plants (Frigo et al., 2014).
Operations and Maintenance (O&M) costs were evaluated in 110 €/kWel (based on range values
suggested by World Energy Council, 2013), and an insurance cost of 1.5% of the total investment
were considered. Lower Heating Value for the LPG was assumed equal to 6.654 kWh/l (SEAI,
www.seai.ie), while LPG specific cost was determined in 0.497 €/l according to SEAI (2015).
The financial appraisal is carried out assuming furthermore: 20 years of operating life, maintenance
costs, fuel supply costs and production, electricity selling and buying prices held constant during the
20 years period and a discount rate equal to 8%. In the analysis, the costs associated to the start-up
conditions for the FBC were not taken into account.
The “baseline” scenario or the business as usual for the poultry farm considers the electricity demand
totally supplied by the grid (at a constant price of 180.6 €/MWh) and the heat required is generated by
an LPG boiler with an efficiency of 90% (LHV of LPG and LPG cost are the same as presented
previously).
65
References
American Society of Heating Refrigerating and Air-conditioning Engineers (ASHRAE). (2015).
HVAC applications, handbook, SI Edition.
International Commission of Agricultural Engineering. (2002). 4th Report of Working Group on
Climatization of Animal Houses Heat and moisture production at animal and house levels, Pedersen,
S. & Sällvik, K editors.
Zhang Linghong, Xu Chunbao (Charles), Champagne Pascale. (2010). Overview of recent advances
in thermo-chemical conversion of biomass. Energy Conversion and Management, 51, 969-982,
Elsevier.
Liu H. (2011). Biomass fuels for small and micro combined heat and power (CHP) systems: resources,
conversion and applications. University of Nottingham, UK. Woodhead Publishing Limited.
Lynch Deirdre, Henihana Anne Marie, Bowen Barry, Lynch Declan, McDonnell Kevin, Kwapinski
Witold, Leahy J.J. (2013a). Utilisation of poultry litter as an energy feedstock. Biomass and
Bioenergy, 49, 197-204, Elsevier.
Abelha P., Gulyurtlu I., Boavida D., Seabra Barros J., Cabrita I., Leahy J., Kelleher B., Leahy M.
(2003). Combustion of poultry litter in a fluidised bed combustor. Fuel, 82, 687-692, Elsevier.
Lynch Deirdre, Henihan Anne Marie, Kwapinski Witold, Zhang Lian, and Leahy James J. (2013b).
Ash Agglomeration and Deposition during Combustion of Poultry Litter in a Bubbling Fluidized-Bed
Combustor. Energy & Fuels, American Chemical Society.
Pantaleo A.M., Camporeale S.M., Shah N. (2013). Thermo-economic assessment of externally fired
micro-gas turbine fired by natural gas and biomass: Applications in Italy. Energy Conversion and
Management, 75, 202-213, Elsevier.
Drescher Ulli, Brüggemann Dieter. (2007). Fluid selection for the Organic Rankine Cycle (ORC) in
biomass power and heat plants. Applied thermal engineering, 27, 223-228, Elsevier.
Department of Agriculture and Rural Development (DARD), AgriFood and Biosciences Institute
(AFBI). (April 2012). The review of alternative technologies to fluidised bed combustion for poultry
litter utilisation.
Pantaleo Antonio M., Ciliberti Patrizia, Camporeale Sergio, Shah Nilay. (2015). Thermo-economic
assessment of small scale biomass CHP: steam turbines vs ORC in different energy demand segments.
The 7th International Conference on Applied Energy – ICAE, Energy Procedia, Elsevier.
Frigo S., Gabbrielli R., Puccini M., Seggiani M., Vitolo S. (2014). Small-scale wood-fuelled CHP
plants: a comparative evaluation of the available technologies. Chemical Engineering Transactions,
37, 847-852, DOI: 10.3303/CET1437142.
Sustainable Energy Authority Ireland (SEAI). (2015). Commercial Fuel Cost Comparison, available
at:http://www.seai.ie/Publications/Statistics_Publications/Fuel_Cost_Comparison/Commercial_Fuel_
Cost_Comparison.pdf, (Last access 19/09/2015).

66
World Energy Council and Bloomberg New Energy Finance. (2013). World Energy Perspective: Cost
of Energy Technologies, available at:
http://www.worldenergy.org/publications/2013/world-energy-perspective-cost-of-energy-
technologies/ (Last access 20/09/2015).
Sustainable Energy Authority of Ireland (SEAI), Public Sector Programme, What units do we use to
submit energy data? What are the conversion factors used?, available at:
http://www.seai.ie/Your_Business/Public_Sector/FAQ/Energy_Reporting_Overview/What_units_do_
we_use_to_submit_energy_data_What_are_the_conversion_factors_used_.html.
(Last access 20/09/2015).
67
Chapter 4: Results and Discussion
The aim of this chapter is present the economic results obtained for the overall model. The economic
parameters selected as the target of the economic analysis were the Internal Rate of Return (IRR), the
Net Present Value (NPV) and the simple Pay Back (PB) period for the investment. The assumptions at
the basis of the study were examined in detail in Chapter 3. Because of the high number of
assumptions made in all the analysis process, an investigation over the results sensitivity has been
carried out and the results are shown in the latter part of this chapter. In particular the influence of
three particular parameters was investigated: the set temperature inside the poultry house, the cost of
the poultry litter and the investment cost. Additionally, the chapter also presents the results on CO2
savings achievable with the plant installation.
In the following the acronym HD refers to the Heat Driven scenario, while the acronym CH is used
for the “choice” scenario described previously.
4.1 Net Present Value
The NPV is defined as the sum of the present values of incoming and outgoing cash flows over a
certain period of time. It can be evaluated with the following:
𝑁𝑃𝑉 = ∑𝐶𝐹𝑗
(1 + 𝑖)𝑗
𝑛
𝑗=0
(4)
Where 𝐶𝐹𝑗 is the j-th total annual cash flow, 𝑖 is the discount rate (evaluated at 8%) and 𝑛 is the
operating life period estimated for the plant (20 years).It is important clarify that the cash flow rate at
the 0-th year is the total investment cost for the plant (negative cash flow). Figure 4.1 shows that the
NPV is positive for all the technologies, reaching values above 1.3 million euro for each scenario
analysed. The interesting outcome is that NPV is not strongly affected by the typology of CHP unit
adopted. This could be in part explained by:
The majority of the annual revenue stream depends on the “consumption avoided” that is
common for all the technologies; this refers to the revenue generated by the heat and
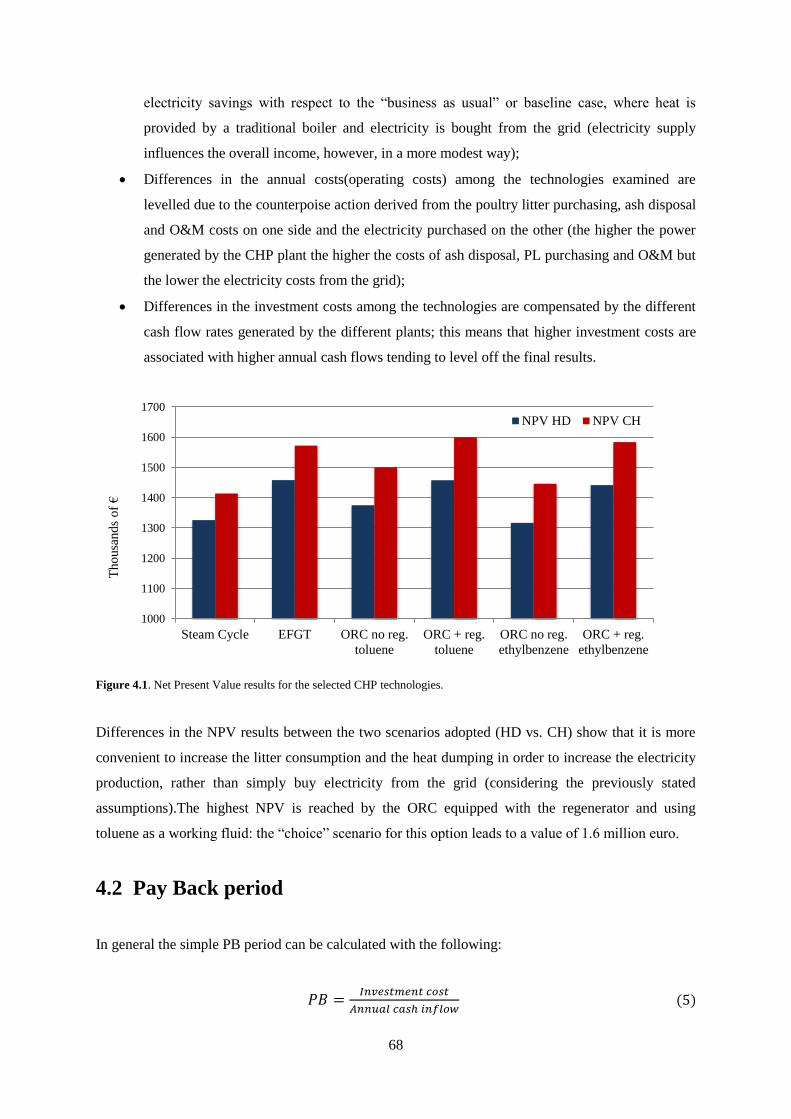
68
electricity savings with respect to the “business as usual” or baseline case, where heat is
provided by a traditional boiler and electricity is bought from the grid (electricity supply
influences the overall income, however, in a more modest way);
Differences in the annual costs(operating costs) among the technologies examined are
levelled due to the counterpoise action derived from the poultry litter purchasing, ash disposal
and O&M costs on one side and the electricity purchased on the other (the higher the power
generated by the CHP plant the higher the costs of ash disposal, PL purchasing and O&M but
the lower the electricity costs from the grid);
Differences in the investment costs among the technologies are compensated by the different
cash flow rates generated by the different plants; this means that higher investment costs are
associated with higher annual cash flows tending to level off the final results.
Figure 4.1. Net Present Value results for the selected CHP technologies.
Differences in the NPV results between the two scenarios adopted (HD vs. CH) show that it is more
convenient to increase the litter consumption and the heat dumping in order to increase the electricity
production, rather than simply buy electricity from the grid (considering the previously stated
assumptions).The highest NPV is reached by the ORC equipped with the regenerator and using
toluene as a working fluid: the “choice” scenario for this option leads to a value of 1.6 million euro.
4.2 Pay Back period
In general the simple PB period can be calculated with the following:
𝑃𝐵 =𝐼𝑛𝑣𝑒𝑠𝑡𝑚𝑒𝑛𝑡 𝑐𝑜𝑠𝑡
𝐴𝑛𝑛𝑢𝑎𝑙 𝑐𝑎𝑠ℎ 𝑖𝑛𝑓𝑙𝑜𝑤 (5)
1000
1100
1200
1300
1400
1500
1600
1700
Steam Cycle EFGT ORC no reg.
toluene
ORC + reg.
toluene
ORC no reg.
ethylbenzene
ORC + reg.
ethylbenzene
Tho
usa
nd
s o
f €
NPV HD NPV CH
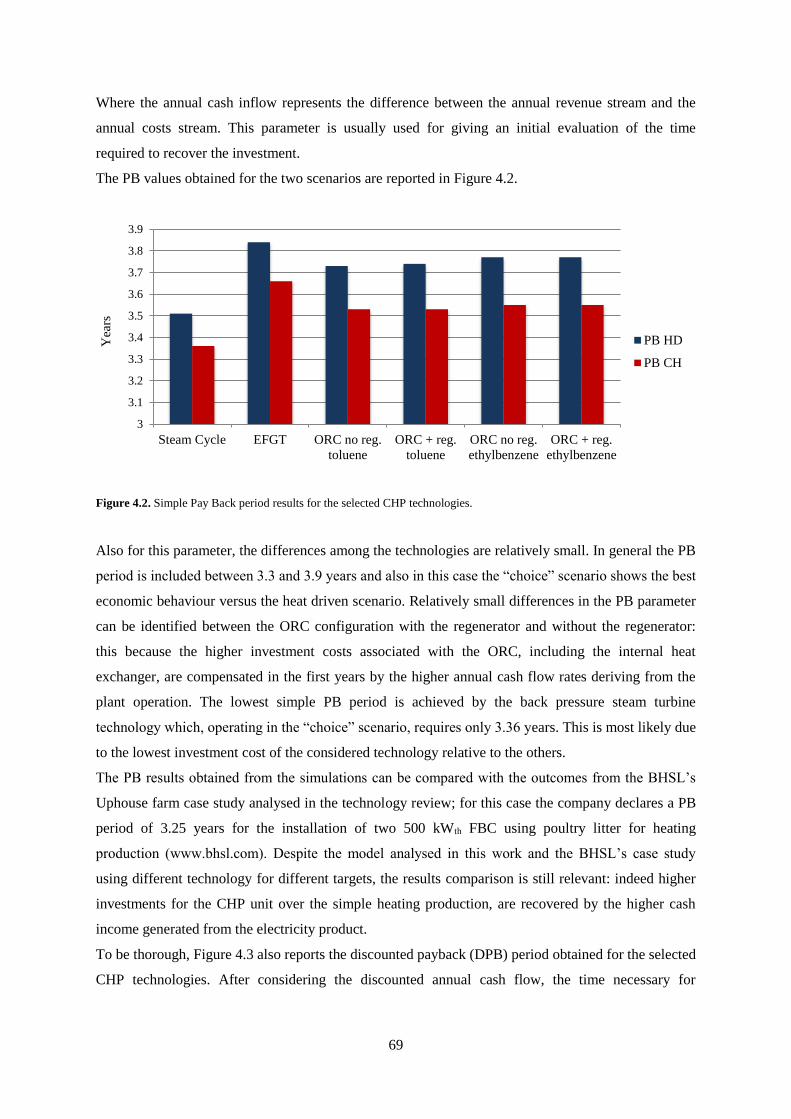
69
Where the annual cash inflow represents the difference between the annual revenue stream and the
annual costs stream. This parameter is usually used for giving an initial evaluation of the time
required to recover the investment.
The PB values obtained for the two scenarios are reported in Figure 4.2.
Figure 4.2. Simple Pay Back period results for the selected CHP technologies.
Also for this parameter, the differences among the technologies are relatively small. In general the PB
period is included between 3.3 and 3.9 years and also in this case the “choice” scenario shows the best
economic behaviour versus the heat driven scenario. Relatively small differences in the PB parameter
can be identified between the ORC configuration with the regenerator and without the regenerator:
this because the higher investment costs associated with the ORC, including the internal heat
exchanger, are compensated in the first years by the higher annual cash flow rates deriving from the
plant operation. The lowest simple PB period is achieved by the back pressure steam turbine
technology which, operating in the “choice” scenario, requires only 3.36 years. This is most likely due
to the lowest investment cost of the considered technology relative to the others.
The PB results obtained from the simulations can be compared with the outcomes from the BHSL’s
Uphouse farm case study analysed in the technology review; for this case the company declares a PB
period of 3.25 years for the installation of two 500 kWth FBC using poultry litter for heating
production (www.bhsl.com). Despite the model analysed in this work and the BHSL’s case study
using different technology for different targets, the results comparison is still relevant: indeed higher
investments for the CHP unit over the simple heating production, are recovered by the higher cash
income generated from the electricity product.
To be thorough, Figure 4.3 also reports the discounted payback (DPB) period obtained for the selected
CHP technologies. After considering the discounted annual cash flow, the time necessary for
3
3.1
3.2
3.3
3.4
3.5
3.6
3.7
3.8
3.9
Steam Cycle EFGT ORC no reg.
toluene
ORC + reg.
toluene
ORC no reg.
ethylbenzene
ORC + reg.
ethylbenzene
Yea
rs
PB HD
PB CH
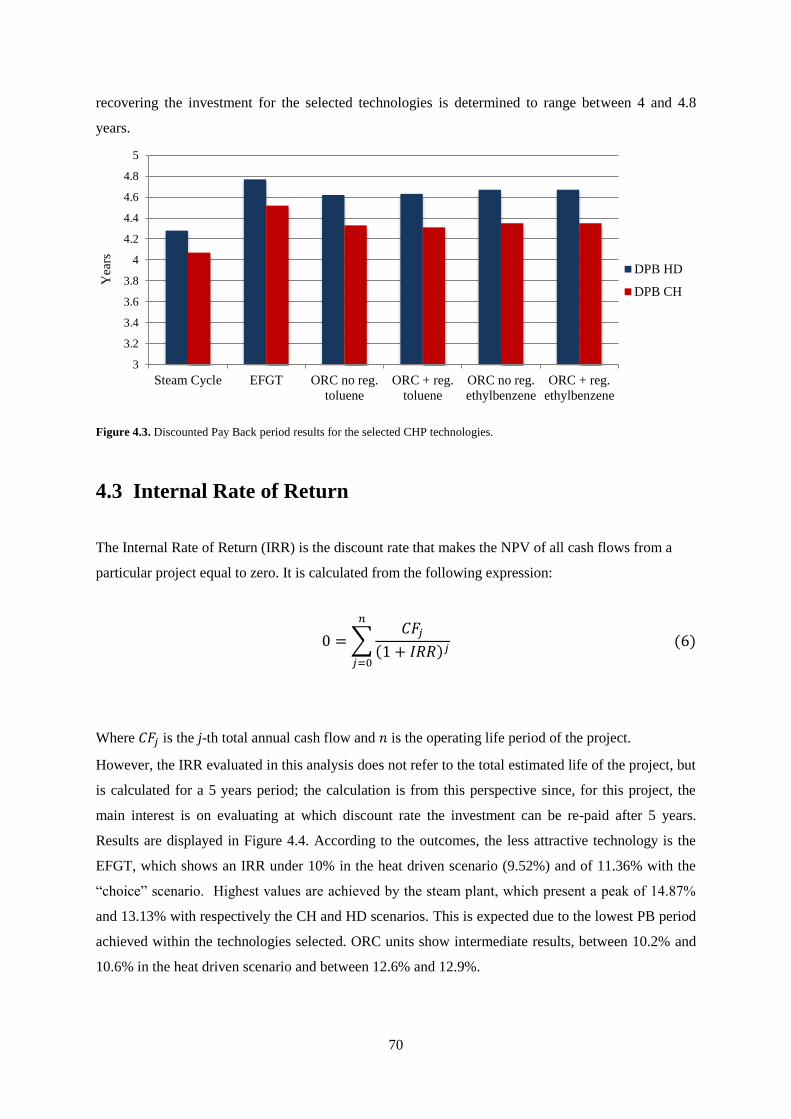
70
recovering the investment for the selected technologies is determined to range between 4 and 4.8
years.
Figure 4.3. Discounted Pay Back period results for the selected CHP technologies.
4.3 Internal Rate of Return
The Internal Rate of Return (IRR) is the discount rate that makes the NPV of all cash flows from a
particular project equal to zero. It is calculated from the following expression:
0 = ∑𝐶𝐹𝑗
(1 + 𝐼𝑅𝑅)𝑗 (6)
𝑛
𝑗=0
Where 𝐶𝐹𝑗 is the j-th total annual cash flow and 𝑛 is the operating life period of the project.
However, the IRR evaluated in this analysis does not refer to the total estimated life of the project, but
is calculated for a 5 years period; the calculation is from this perspective since, for this project, the
main interest is on evaluating at which discount rate the investment can be re-paid after 5 years.
Results are displayed in Figure 4.4. According to the outcomes, the less attractive technology is the
EFGT, which shows an IRR under 10% in the heat driven scenario (9.52%) and of 11.36% with the
“choice” scenario. Highest values are achieved by the steam plant, which present a peak of 14.87%
and 13.13% with respectively the CH and HD scenarios. This is expected due to the lowest PB period
achieved within the technologies selected. ORC units show intermediate results, between 10.2% and
10.6% in the heat driven scenario and between 12.6% and 12.9%.
3
3.2
3.4
3.6
3.8
4
4.2
4.4
4.6
4.8
5
Steam Cycle EFGT ORC no reg.
toluene
ORC + reg.
toluene
ORC no reg.
ethylbenzene
ORC + reg.
ethylbenzene
Yea
rs
DPB HD
DPB CH

71
4.4 CO2 emissions avoided
One objective of the simulation was to evaluate in a simple way the total CO2 emissions avoided by
running the CHP plant rather than fulfilling the poultry farm energy demands in the conventional way.
Figure 4.4. 5-years Internal Rate of Return results for the selected CHP technologies.
As reported in previous sections, the baseline scenario consists of using LPG for the poultry farm heat
demand supply and electricity from the grid for the electrical requirements.
CO2savings deriving from the heat side depend on the quantity of LPG not burnt and replaced by the
poultry litter combustion (this process still produces CO2 emissions but they are derived from the
combustion of a biomass source and can be related to the natural carbon cycle). It is important though
to note that consumption of LPG is also required within the hypothesis to install the CHP unit (by the
auxiliary boiler) which reduces the amount of total CO2 emissions avoided. It is furthermore
necessary to state that for this analysis the CO2 emissions derived from the fuel combustion by an
auxiliary boiler necessary during FBC start-up operations and CO2 emissions derived from transport
of poultry litter in the farm are not taken into account.
The carbon emission factor for the LPG burning operation is assumed to be0.229 kgCO2/kWh (SEAI).
With the above-mentioned considerations, the CO2 savings derived from the poultry litter burning
amounts to 621.77 tons/year.
Furthermore, the major part of the poultry farm electricity demand is provided by the litter
combustion and is not purchased from the grid; obviously the electricity drawn involves fuel
consumption from the grid power suppliers and therefore CO2 emissions into atmosphere. According
to SEAI (2014), in 2013, the carbon intensity of the Irish electricity supplied to the grid consisted of
0.469 kgCO2/kWh. Considering the total electrical energy demanded by the poultry house and
6
7
8
9
10
11
12
13
14
15
16
Steam Cycle EFGT ORC no reg.
toluene
ORC + reg.
toluene
ORC no reg.
ethylbenzene
ORC + reg.
ethylbenzene
%
IRR (5 years) HD IRR (5 years) CH
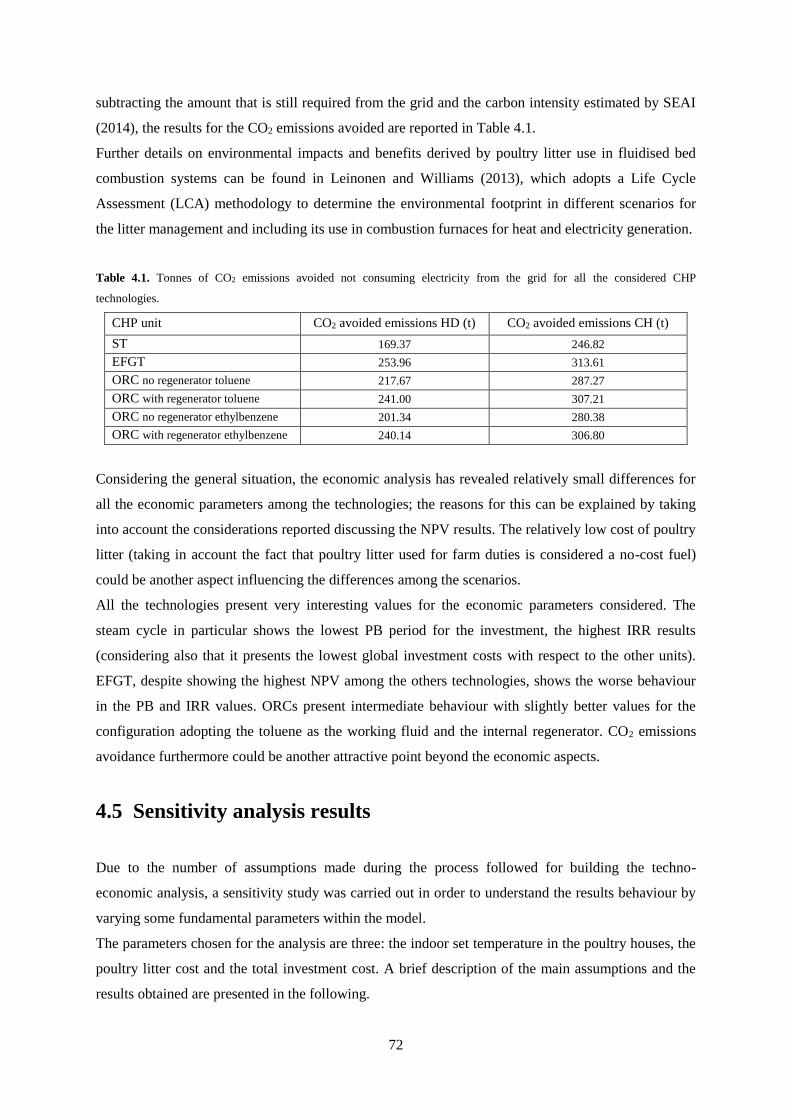
72
subtracting the amount that is still required from the grid and the carbon intensity estimated by SEAI
(2014), the results for the CO2 emissions avoided are reported in Table 4.1.
Further details on environmental impacts and benefits derived by poultry litter use in fluidised bed
combustion systems can be found in Leinonen and Williams (2013), which adopts a Life Cycle
Assessment (LCA) methodology to determine the environmental footprint in different scenarios for
the litter management and including its use in combustion furnaces for heat and electricity generation.
Table 4.1. Tonnes of CO2 emissions avoided not consuming electricity from the grid for all the considered CHP
technologies.
CHP unit CO2 avoided emissions HD (t) CO2 avoided emissions CH (t)
ST 169.37 246.82
EFGT 253.96 313.61
ORC no regenerator toluene 217.67 287.27
ORC with regenerator toluene 241.00 307.21
ORC no regenerator ethylbenzene 201.34 280.38
ORC with regenerator ethylbenzene 240.14 306.80
Considering the general situation, the economic analysis has revealed relatively small differences for
all the economic parameters among the technologies; the reasons for this can be explained by taking
into account the considerations reported discussing the NPV results. The relatively low cost of poultry
litter (taking in account the fact that poultry litter used for farm duties is considered a no-cost fuel)
could be another aspect influencing the differences among the scenarios.
All the technologies present very interesting values for the economic parameters considered. The
steam cycle in particular shows the lowest PB period for the investment, the highest IRR results
(considering also that it presents the lowest global investment costs with respect to the other units).
EFGT, despite showing the highest NPV among the others technologies, shows the worse behaviour
in the PB and IRR values. ORCs present intermediate behaviour with slightly better values for the
configuration adopting the toluene as the working fluid and the internal regenerator. CO2 emissions
avoidance furthermore could be another attractive point beyond the economic aspects.
4.5 Sensitivity analysis results
Due to the number of assumptions made during the process followed for building the techno-
economic analysis, a sensitivity study was carried out in order to understand the results behaviour by
varying some fundamental parameters within the model.
The parameters chosen for the analysis are three: the indoor set temperature in the poultry houses, the
poultry litter cost and the total investment cost. A brief description of the main assumptions and the
results obtained are presented in the following.
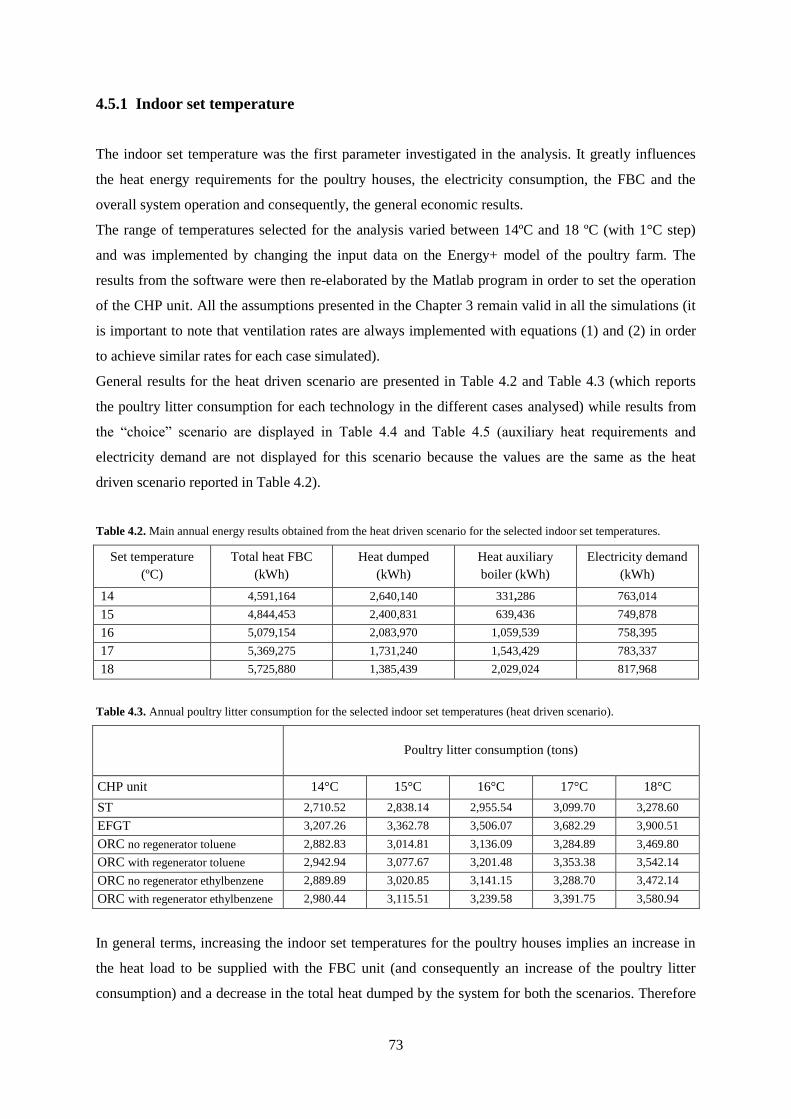
73
4.5.1 Indoor set temperature
The indoor set temperature was the first parameter investigated in the analysis. It greatly influences
the heat energy requirements for the poultry houses, the electricity consumption, the FBC and the
overall system operation and consequently, the general economic results.
The range of temperatures selected for the analysis varied between 14ºC and 18 ºC (with 1°C step)
and was implemented by changing the input data on the Energy+ model of the poultry farm. The
results from the software were then re-elaborated by the Matlab program in order to set the operation
of the CHP unit. All the assumptions presented in the Chapter 3 remain valid in all the simulations (it
is important to note that ventilation rates are always implemented with equations (1) and (2) in order
to achieve similar rates for each case simulated).
General results for the heat driven scenario are presented in Table 4.2 and Table 4.3 (which reports
the poultry litter consumption for each technology in the different cases analysed) while results from
the “choice” scenario are displayed in Table 4.4 and Table 4.5 (auxiliary heat requirements and
electricity demand are not displayed for this scenario because the values are the same as the heat
driven scenario reported in Table 4.2).
Table 4.2. Main annual energy results obtained from the heat driven scenario for the selected indoor set temperatures.
Set temperature
(ºC)
Total heat FBC
(kWh)
Heat dumped
(kWh)
Heat auxiliary
boiler (kWh)
Electricity demand
(kWh)
14 4,591,164 2,640,140 331,286 763,014
15 4,844,453 2,400,831 639,436 749,878
16 5,079,154 2,083,970 1,059,539 758,395
17 5,369,275 1,731,240 1,543,429 783,337
18 5,725,880 1,385,439 2,029,024 817,968
Table 4.3. Annual poultry litter consumption for the selected indoor set temperatures (heat driven scenario).
Poultry litter consumption (tons)
CHP unit 14°C 15°C 16°C 17°C 18°C
ST 2,710.52 2,838.14 2,955.54 3,099.70 3,278.60
EFGT 3,207.26 3,362.78 3,506.07 3,682.29 3,900.51
ORC no regenerator toluene 2,882.83 3,014.81 3,136.09 3,284.89 3,469.80
ORC with regenerator toluene 2,942.94 3,077.67 3,201.48 3,353.38 3,542.14
ORC no regenerator ethylbenzene 2,889.89 3,020.85 3,141.15 3,288.70 3,472.14
ORC with regenerator ethylbenzene 2,980.44 3,115.51 3,239.58 3,391.75 3,580.94
In general terms, increasing the indoor set temperatures for the poultry houses implies an increase in
the heat load to be supplied with the FBC unit (and consequently an increase of the poultry litter
consumption) and a decrease in the total heat dumped by the system for both the scenarios. Therefore
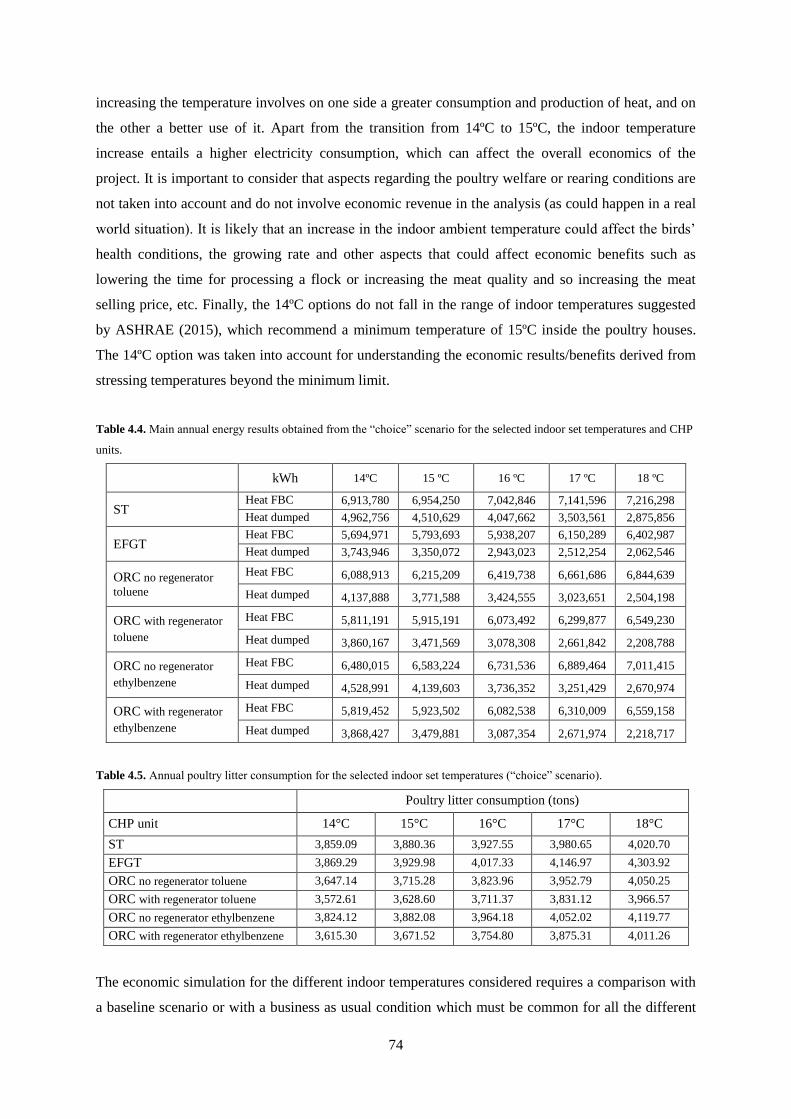
74
increasing the temperature involves on one side a greater consumption and production of heat, and on
the other a better use of it. Apart from the transition from 14ºC to 15ºC, the indoor temperature
increase entails a higher electricity consumption, which can affect the overall economics of the
project. It is important to consider that aspects regarding the poultry welfare or rearing conditions are
not taken into account and do not involve economic revenue in the analysis (as could happen in a real
world situation). It is likely that an increase in the indoor ambient temperature could affect the birds’
health conditions, the growing rate and other aspects that could affect economic benefits such as
lowering the time for processing a flock or increasing the meat quality and so increasing the meat
selling price, etc. Finally, the 14ºC options do not fall in the range of indoor temperatures suggested
by ASHRAE (2015), which recommend a minimum temperature of 15ºC inside the poultry houses.
The 14ºC option was taken into account for understanding the economic results/benefits derived from
stressing temperatures beyond the minimum limit.
Table 4.4. Main annual energy results obtained from the “choice” scenario for the selected indoor set temperatures and CHP
units.
kWh 14ºC 15 ºC 16 ºC 17 ºC 18 ºC
ST Heat FBC 6,913,780 6,954,250 7,042,846 7,141,596 7,216,298
Heat dumped 4,962,756 4,510,629 4,047,662 3,503,561 2,875,856
EFGT Heat FBC 5,694,971 5,793,693 5,938,207 6,150,289 6,402,987
Heat dumped 3,743,946 3,350,072 2,943,023 2,512,254 2,062,546
ORC no regenerator
toluene
Heat FBC 6,088,913 6,215,209 6,419,738 6,661,686 6,844,639
Heat dumped 4,137,888 3,771,588 3,424,555 3,023,651 2,504,198
ORC with regenerator
toluene
Heat FBC 5,811,191 5,915,191 6,073,492 6,299,877 6,549,230
Heat dumped 3,860,167 3,471,569 3,078,308 2,661,842 2,208,788
ORC no regenerator
ethylbenzene
Heat FBC 6,480,015 6,583,224 6,731,536 6,889,464 7,011,415
Heat dumped 4,528,991 4,139,603 3,736,352 3,251,429 2,670,974
ORC with regenerator
ethylbenzene
Heat FBC 5,819,452 5,923,502 6,082,538 6,310,009 6,559,158
Heat dumped 3,868,427 3,479,881 3,087,354 2,671,974 2,218,717
Table 4.5. Annual poultry litter consumption for the selected indoor set temperatures (“choice” scenario).
The economic simulation for the different indoor temperatures considered requires a comparison with
a baseline scenario or with a business as usual condition which must be common for all the different
Poultry litter consumption (tons)
CHP unit 14°C 15°C 16°C 17°C 18°C
ST 3,859.09 3,880.36 3,927.55 3,980.65 4,020.70
EFGT 3,869.29 3,929.98 4,017.33 4,146.97 4,303.92
ORC no regenerator toluene 3,647.14 3,715.28 3,823.96 3,952.79 4,050.25
ORC with regenerator toluene 3,572.61 3,628.60 3,711.37 3,831.12 3,966.57
ORC no regenerator ethylbenzene 3,824.12 3,882.08 3,964.18 4,052.02 4,119.77
ORC with regenerator ethylbenzene 3,615.30 3,671.52 3,754.80 3,875.31 4,011.26
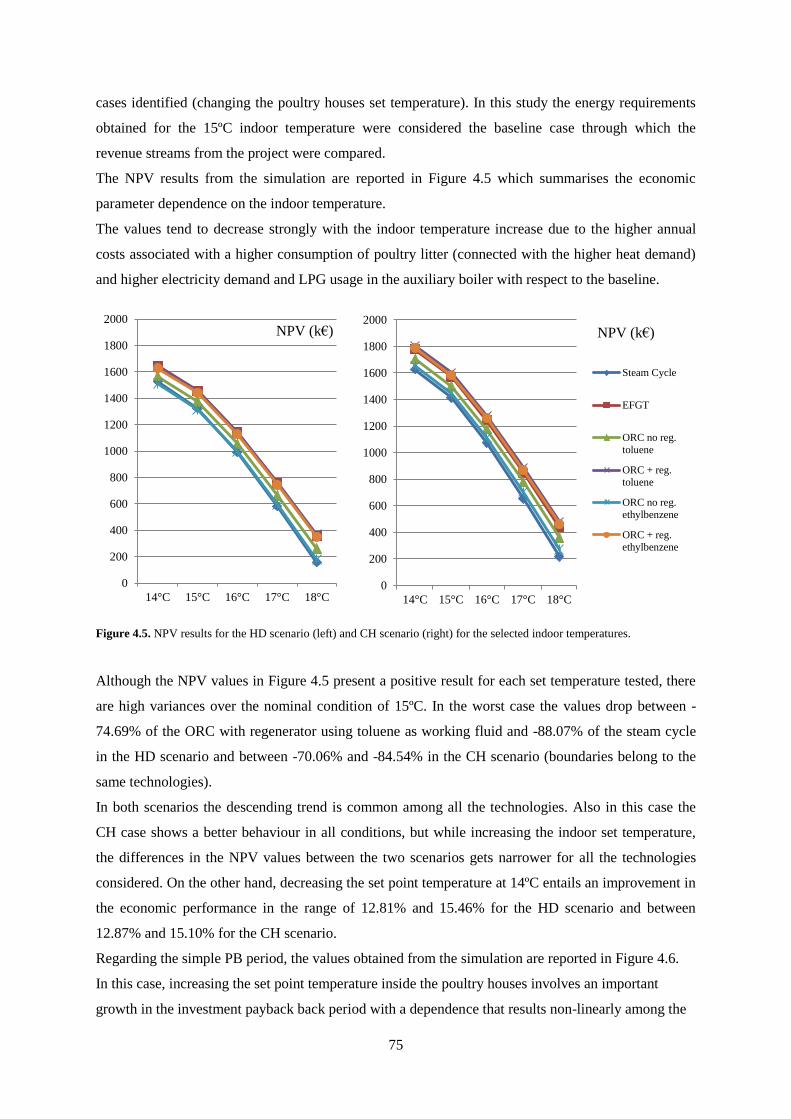
75
cases identified (changing the poultry houses set temperature). In this study the energy requirements
obtained for the 15ºC indoor temperature were considered the baseline case through which the
revenue streams from the project were compared.
The NPV results from the simulation are reported in Figure 4.5 which summarises the economic
parameter dependence on the indoor temperature.
The values tend to decrease strongly with the indoor temperature increase due to the higher annual
costs associated with a higher consumption of poultry litter (connected with the higher heat demand)
and higher electricity demand and LPG usage in the auxiliary boiler with respect to the baseline.
Figure 4.5. NPV results for the HD scenario (left) and CH scenario (right) for the selected indoor temperatures.
Although the NPV values in Figure 4.5 present a positive result for each set temperature tested, there
are high variances over the nominal condition of 15ºC. In the worst case the values drop between -
74.69% of the ORC with regenerator using toluene as working fluid and -88.07% of the steam cycle
in the HD scenario and between -70.06% and -84.54% in the CH scenario (boundaries belong to the
same technologies).
In both scenarios the descending trend is common among all the technologies. Also in this case the
CH case shows a better behaviour in all conditions, but while increasing the indoor set temperature,
the differences in the NPV values between the two scenarios gets narrower for all the technologies
considered. On the other hand, decreasing the set point temperature at 14ºC entails an improvement in
the economic performance in the range of 12.81% and 15.46% for the HD scenario and between
12.87% and 15.10% for the CH scenario.
Regarding the simple PB period, the values obtained from the simulation are reported in Figure 4.6.
In this case, increasing the set point temperature inside the poultry houses involves an important
growth in the investment payback back period with a dependence that results non-linearly among the
0
200
400
600
800
1000
1200
1400
1600
1800
2000
14°C 15°C 16°C 17°C 18°C
NPV (k€)
0
200
400
600
800
1000
1200
1400
1600
1800
2000
14°C 15°C 16°C 17°C 18°C
NPV (k€)
Steam Cycle
EFGT
ORC no reg.
toluene
ORC + reg.
toluene
ORC no reg.
ethylbenzene
ORC + reg.
ethylbenzene

76
variables. Indeed the PB period in nominal conditions ranges between 3.51 and 3.84 years in the HD
scenario reaches values in the range of 6.95 and 8.08 years; also for the CH scenario, nominal values
between 3.36 and 3.66 years grow to 6.54 and 7.57 years. It is interesting to consider that the steam
cycle technology which in nominal conditions presents the lowest PB period in both scenarios, when
considering the 17ºC and the 18ºC case shows the worst results among the other technologies.
Decreasing the temperature down to 14°C, involves on the other hand a reduction between 7.29 and
9.12% in the HD case and between 7.61 and 8.93% in the CH case.
Figure 4.6. PB period results for the HD scenario (left) and CH scenario (right) for the selected indoor temperatures.
Figure 4.7 shows instead the IRR behaviour with the different set point temperatures.
Figure 4.7. IRR (5-years) results for the HD scenario (left) and CH scenario (right) for the selected indoor temperatures.
0
1
2
3
4
5
6
7
8
9
14°C 15°C 16°C 17°C 18°C
PB (years)
0
1
2
3
4
5
6
7
8
9
14°C 15°C 16°C 17°C 18°C
PB (years)
Steam Cycle
EFGT
ORC no reg.
toluene
ORC + reg.
toluene
ORC no reg.
ethylbenzene
ORC + reg.
ethylbenzene
-20
-15
-10
-5
0
5
10
15
20
25
14°C 15°C 16°C 17°C 18°C
IRR (%)
-20
-15
-10
-5
0
5
10
15
20
25
14°C 15°C 16°C 17°C 18°C
IRR (%)
Steam Cycle
EFGT
ORC no reg.
toluene
ORC + reg.
toluene
ORC no reg.
ethylbenzene
ORC + reg.
ethylbenzene
77
Also in this case, the temperature affects greatly the values of the parameter, and the more the indoor
temperature increases the more the IRR factor decreases, again without linear dependence between
the variables. Negative (HD scenario) or almost null (CH scenario) IRR values are reached for the
17°C case, while the 18°C shows negative results for each technology in both scenarios (those results
are explainable considering the results obtained for the PB period in those cases).
In this latter condition, the IRR values drop in the range between -195.55% and -236.84% in the HD
scenario and between -159.69% and -183.46% in the CH scenario with respect the nominal situation.
On the other side, reducing the temperature to14°C results in the IRR value ranges of 29.19% and
34.60% (HD) and 25.81% and 29.16% (CH), respectively.
Some general considerations about the economic parameters dependence on the indoor set
temperature variation:
The temperature variation inside the poultry houses entails significant differences in the
electricity and heat demand that affect strongly the economics of the entire system;
With the assumptions made, all the technologies achieve worsening economic performances
as the inside temperature in the poultry houses increase and show common trends in all the
parameters observed;
The steam cycle technology which showed the best behaviour regarding the IRR and PB
period in nominal conditions, presents among the CHP technologies the highest values-
degradation with the temperature variation (excluding the 14ºC case);
The baseline scenario, to which the economic results refer, can affect greatly the economic
results;
The economic simulation has been carried out keeping the system/plant size constant for each
value of temperature considered. This hypothesis however tends to penalise the plant
operation with higher temperatures. Indeed for such conditions the plant capacity might be
undersized for dealing with higher heat power demands causing increasing usage of the
auxiliary boiler.
4.5.2 Poultry litter cost
The other parameter investigated in the sensitivity analysis is the poultry litter cost. This can strongly
affect the CHP operational setting in the different situations and eventually the overall economic
performance of the plant.
Three main cases were taken into account for the analysis:
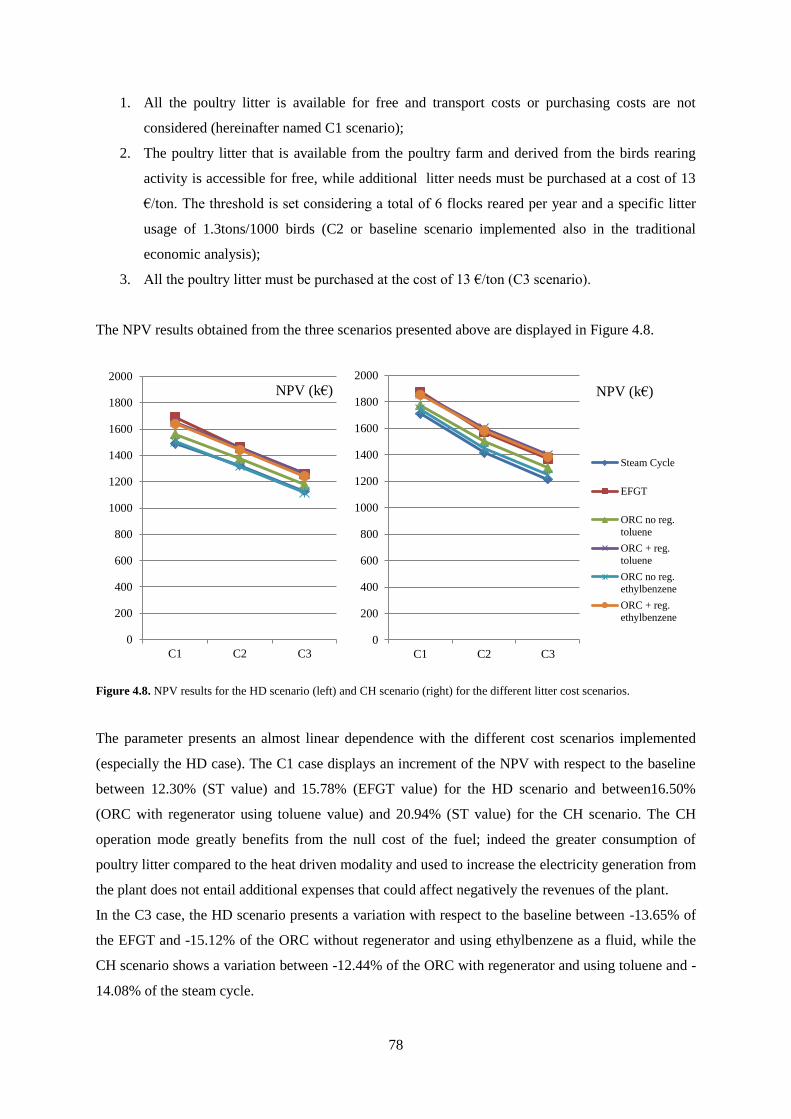
78
1. All the poultry litter is available for free and transport costs or purchasing costs are not
considered (hereinafter named C1 scenario);
2. The poultry litter that is available from the poultry farm and derived from the birds rearing
activity is accessible for free, while additional litter needs must be purchased at a cost of 13
€/ton. The threshold is set considering a total of 6 flocks reared per year and a specific litter
usage of 1.3tons/1000 birds (C2 or baseline scenario implemented also in the traditional
economic analysis);
3. All the poultry litter must be purchased at the cost of 13 €/ton (C3 scenario).
The NPV results obtained from the three scenarios presented above are displayed in Figure 4.8.
Figure 4.8. NPV results for the HD scenario (left) and CH scenario (right) for the different litter cost scenarios.
The parameter presents an almost linear dependence with the different cost scenarios implemented
(especially the HD case). The C1 case displays an increment of the NPV with respect to the baseline
between 12.30% (ST value) and 15.78% (EFGT value) for the HD scenario and between16.50%
(ORC with regenerator using toluene value) and 20.94% (ST value) for the CH scenario. The CH
operation mode greatly benefits from the null cost of the fuel; indeed the greater consumption of
poultry litter compared to the heat driven modality and used to increase the electricity generation from
the plant does not entail additional expenses that could affect negatively the revenues of the plant.
In the C3 case, the HD scenario presents a variation with respect to the baseline between -13.65% of
the EFGT and -15.12% of the ORC without regenerator and using ethylbenzene as a fluid, while the
CH scenario shows a variation between -12.44% of the ORC with regenerator and using toluene and -
14.08% of the steam cycle.
0
200
400
600
800
1000
1200
1400
1600
1800
2000
C1 C2 C3
NPV (k€)
0
200
400
600
800
1000
1200
1400
1600
1800
2000
C1 C2 C3
NPV (k€)
Steam Cycle
EFGT
ORC no reg.
toluene
ORC + reg.
toluene
ORC no reg.
ethylbenzene
ORC + reg.
ethylbenzene
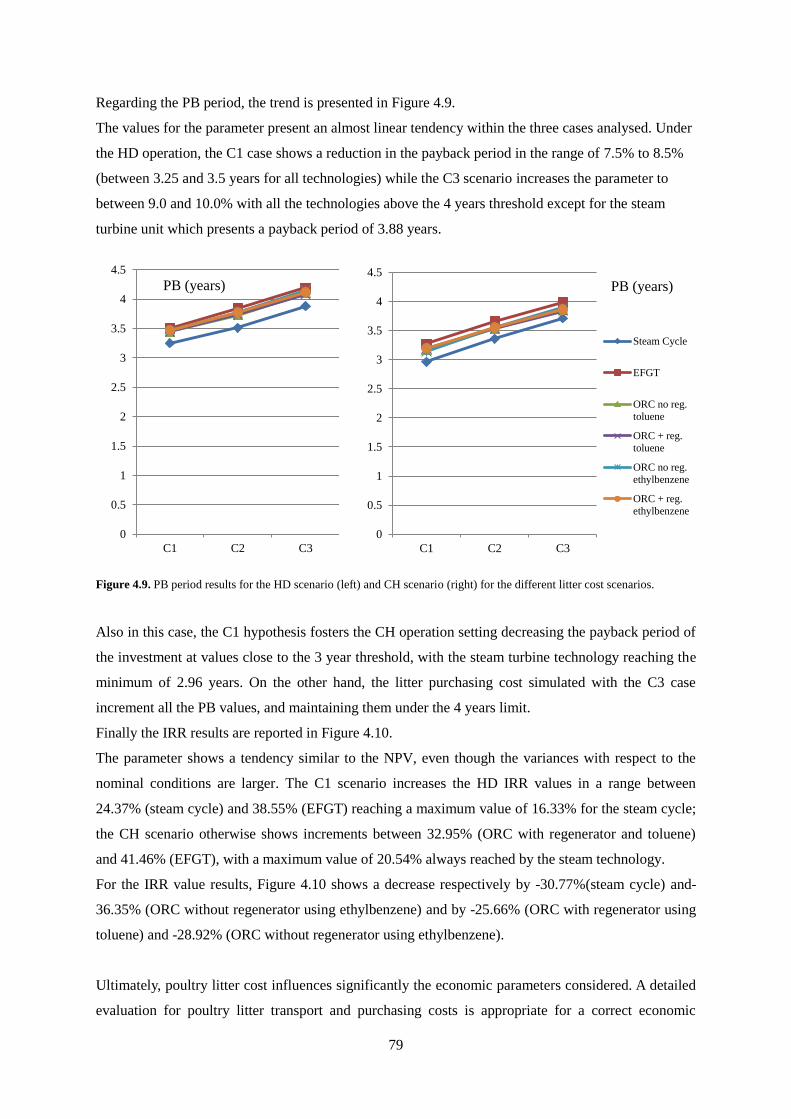
79
Regarding the PB period, the trend is presented in Figure 4.9.
The values for the parameter present an almost linear tendency within the three cases analysed. Under
the HD operation, the C1 case shows a reduction in the payback period in the range of 7.5% to 8.5%
(between 3.25 and 3.5 years for all technologies) while the C3 scenario increases the parameter to
between 9.0 and 10.0% with all the technologies above the 4 years threshold except for the steam
turbine unit which presents a payback period of 3.88 years.
Figure 4.9. PB period results for the HD scenario (left) and CH scenario (right) for the different litter cost scenarios.
Also in this case, the C1 hypothesis fosters the CH operation setting decreasing the payback period of
the investment at values close to the 3 year threshold, with the steam turbine technology reaching the
minimum of 2.96 years. On the other hand, the litter purchasing cost simulated with the C3 case
increment all the PB values, and maintaining them under the 4 years limit.
Finally the IRR results are reported in Figure 4.10.
The parameter shows a tendency similar to the NPV, even though the variances with respect to the
nominal conditions are larger. The C1 scenario increases the HD IRR values in a range between
24.37% (steam cycle) and 38.55% (EFGT) reaching a maximum value of 16.33% for the steam cycle;
the CH scenario otherwise shows increments between 32.95% (ORC with regenerator and toluene)
and 41.46% (EFGT), with a maximum value of 20.54% always reached by the steam technology.
For the IRR value results, Figure 4.10 shows a decrease respectively by -30.77%(steam cycle) and-
36.35% (ORC without regenerator using ethylbenzene) and by -25.66% (ORC with regenerator using
toluene) and -28.92% (ORC without regenerator using ethylbenzene).
Ultimately, poultry litter cost influences significantly the economic parameters considered. A detailed
evaluation for poultry litter transport and purchasing costs is appropriate for a correct economic
0
0.5
1
1.5
2
2.5
3
3.5
4
4.5
C1 C2 C3
PB (years)
0
0.5
1
1.5
2
2.5
3
3.5
4
4.5
C1 C2 C3
PB (years)
Steam Cycle
EFGT
ORC no reg.
toluene
ORC + reg.
toluene
ORC no reg.
ethylbenzene
ORC + reg.
ethylbenzene
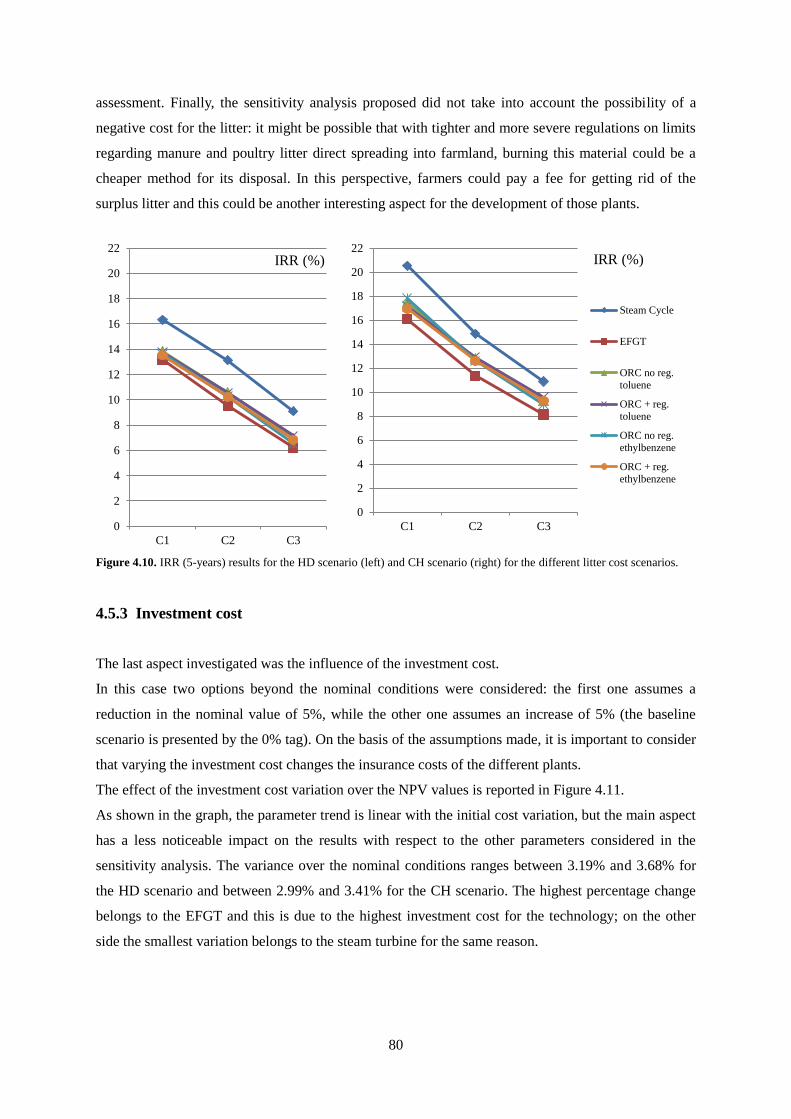
80
assessment. Finally, the sensitivity analysis proposed did not take into account the possibility of a
negative cost for the litter: it might be possible that with tighter and more severe regulations on limits
regarding manure and poultry litter direct spreading into farmland, burning this material could be a
cheaper method for its disposal. In this perspective, farmers could pay a fee for getting rid of the
surplus litter and this could be another interesting aspect for the development of those plants.
Figure 4.10. IRR (5-years) results for the HD scenario (left) and CH scenario (right) for the different litter cost scenarios.
4.5.3 Investment cost
The last aspect investigated was the influence of the investment cost.
In this case two options beyond the nominal conditions were considered: the first one assumes a
reduction in the nominal value of 5%, while the other one assumes an increase of 5% (the baseline
scenario is presented by the 0% tag). On the basis of the assumptions made, it is important to consider
that varying the investment cost changes the insurance costs of the different plants.
The effect of the investment cost variation over the NPV values is reported in Figure 4.11.
As shown in the graph, the parameter trend is linear with the initial cost variation, but the main aspect
has a less noticeable impact on the results with respect to the other parameters considered in the
sensitivity analysis. The variance over the nominal conditions ranges between 3.19% and 3.68% for
the HD scenario and between 2.99% and 3.41% for the CH scenario. The highest percentage change
belongs to the EFGT and this is due to the highest investment cost for the technology; on the other
side the smallest variation belongs to the steam turbine for the same reason.
0
2
4
6
8
10
12
14
16
18
20
22
C1 C2 C3
IRR (%)
0
2
4
6
8
10
12
14
16
18
20
22
C1 C2 C3
IRR (%)
Steam Cycle
EFGT
ORC no reg.
toluene
ORC + reg.
toluene
ORC no reg.
ethylbenzene
ORC + reg.
ethylbenzene
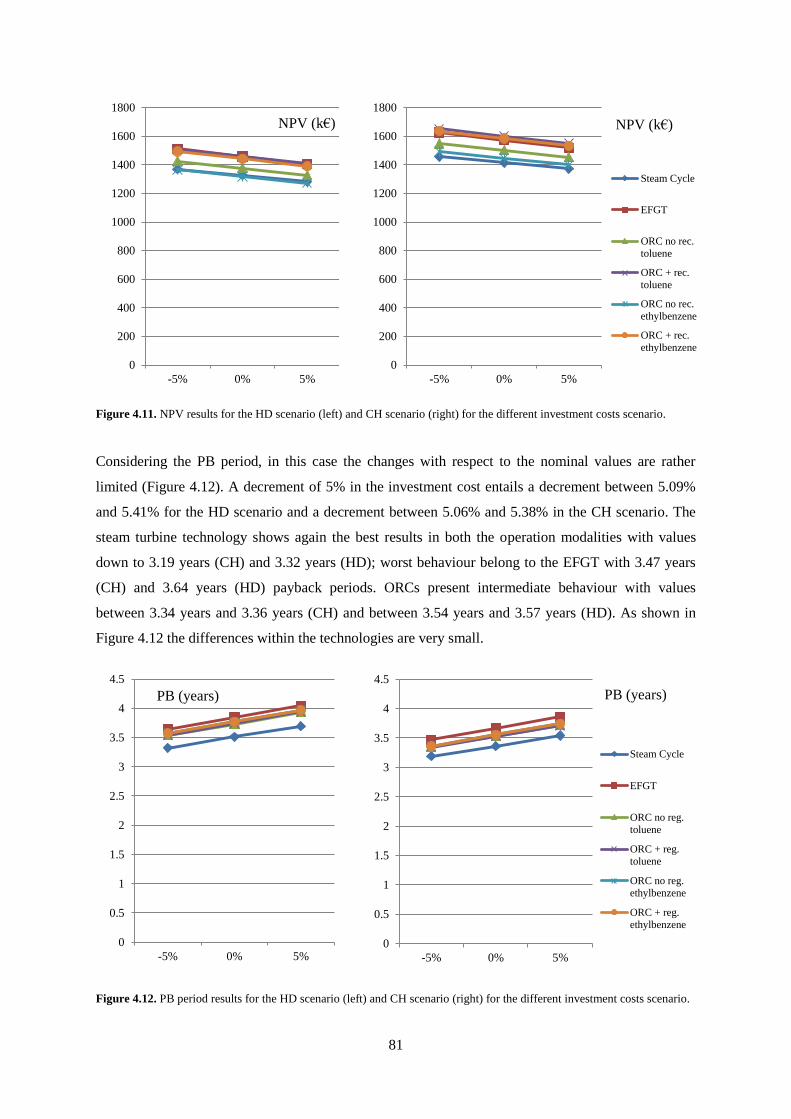
81
Figure 4.11. NPV results for the HD scenario (left) and CH scenario (right) for the different investment costs scenario.
Considering the PB period, in this case the changes with respect to the nominal values are rather
limited (Figure 4.12). A decrement of 5% in the investment cost entails a decrement between 5.09%
and 5.41% for the HD scenario and a decrement between 5.06% and 5.38% in the CH scenario. The
steam turbine technology shows again the best results in both the operation modalities with values
down to 3.19 years (CH) and 3.32 years (HD); worst behaviour belong to the EFGT with 3.47 years
(CH) and 3.64 years (HD) payback periods. ORCs present intermediate behaviour with values
between 3.34 years and 3.36 years (CH) and between 3.54 years and 3.57 years (HD). As shown in
Figure 4.12 the differences within the technologies are very small.
Figure 4.12. PB period results for the HD scenario (left) and CH scenario (right) for the different investment costs scenario.
0
200
400
600
800
1000
1200
1400
1600
1800
-5% 0% 5%
NPV (k€)
0
200
400
600
800
1000
1200
1400
1600
1800
-5% 0% 5%
NPV (k€)
Steam Cycle
EFGT
ORC no rec.
toluene
ORC + rec.
toluene
ORC no rec.
ethylbenzene
ORC + rec.
ethylbenzene
0
0.5
1
1.5
2
2.5
3
3.5
4
4.5
-5% 0% 5%
PB (years)
0
0.5
1
1.5
2
2.5
3
3.5
4
4.5
-5% 0% 5%
PB (years)
Steam Cycle
EFGT
ORC no reg.
toluene
ORC + reg.
toluene
ORC no reg.
ethylbenzene
ORC + reg.
ethylbenzene
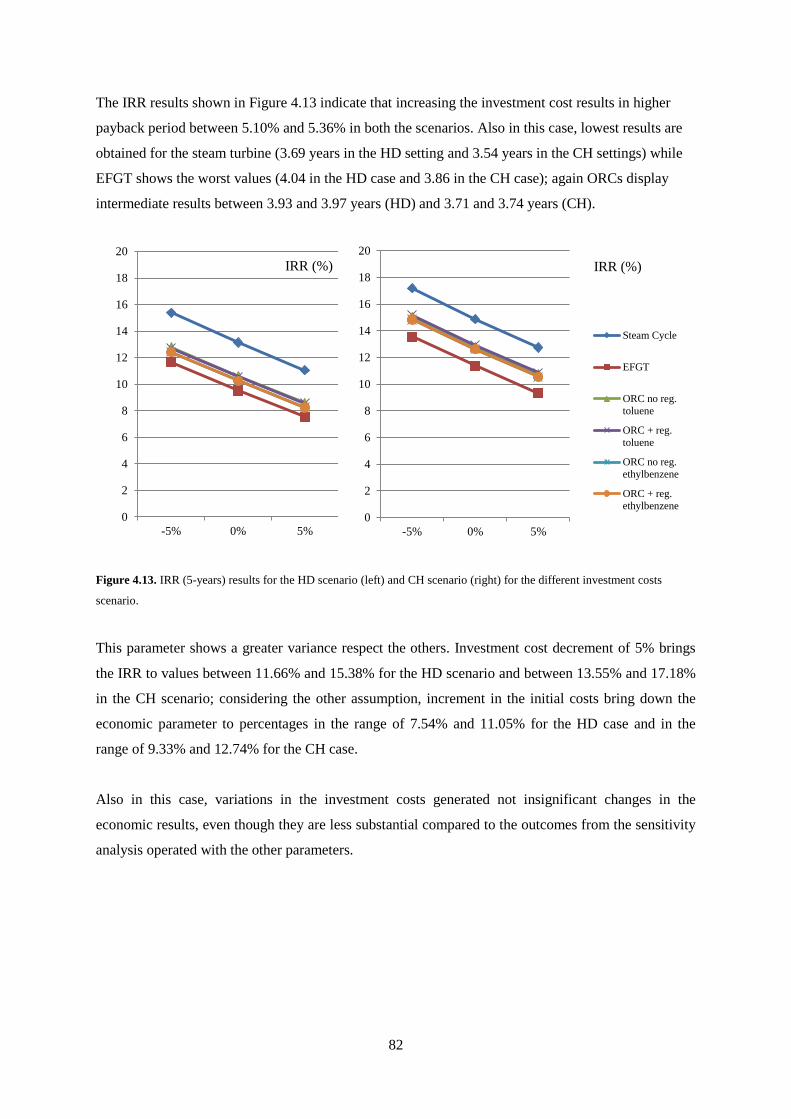
82
The IRR results shown in Figure 4.13 indicate that increasing the investment cost results in higher
payback period between 5.10% and 5.36% in both the scenarios. Also in this case, lowest results are
obtained for the steam turbine (3.69 years in the HD setting and 3.54 years in the CH settings) while
EFGT shows the worst values (4.04 in the HD case and 3.86 in the CH case); again ORCs display
intermediate results between 3.93 and 3.97 years (HD) and 3.71 and 3.74 years (CH).
Figure 4.13. IRR (5-years) results for the HD scenario (left) and CH scenario (right) for the different investment costs
scenario.
This parameter shows a greater variance respect the others. Investment cost decrement of 5% brings
the IRR to values between 11.66% and 15.38% for the HD scenario and between 13.55% and 17.18%
in the CH scenario; considering the other assumption, increment in the initial costs bring down the
economic parameter to percentages in the range of 7.54% and 11.05% for the HD case and in the
range of 9.33% and 12.74% for the CH case.
Also in this case, variations in the investment costs generated not insignificant changes in the
economic results, even though they are less substantial compared to the outcomes from the sensitivity
analysis operated with the other parameters.
0
2
4
6
8
10
12
14
16
18
20
-5% 0% 5%
IRR (%)
Steam Cycle
EFGT
ORC no reg.
toluene
ORC + reg.
toluene
ORC no reg.
ethylbenzene
ORC + reg.
ethylbenzene0
2
4
6
8
10
12
14
16
18
20
-5% 0% 5%
IRR (%)

83
References
BHSL. Uphouse farm case study, Norfolk, UK, BHSL website, available at:
http://www.bhsl.com/portfolio-item/uphouse-farm-norfolk/. (Last access 24/09/2015).
Sustainable Energy Authority of Ireland (SEAI). Energy reporting overview. What are the carbon
emissions factors used?, available at:
http://www.seai.ie/Your_Business/Public_Sector/FAQ/Energy_Reporting_Overview/What_are_the_c
arbon_emission_factors_used.html. (Last access 24/09/2015).
Sustainable Energy Authority of Ireland (SEAI). (2014). Energy in Ireland 1990-2013, 2014 Report.
Leinonen Ilkka, Williams Adrian. (2013). Environmental impacts of poultry production when using
poultry manure as a fuel on broiler farms, project report for BHSL, Newcastle University, Cranfield
University.
American Society of Heating Refrigerating and Air-conditioning Engineers (ASHRAE). (2015).
HVAC applications, handbook, SI Edition.

84
85
Chapter 5: Conclusions
The main objectives of this thesis work were: providing a literature review on poultry litter energy
conversion processes and technologies; and performing a techno-economic analysis for a small scale
co-generative FBC fuelled by poultry litter, in order to understand the economic feasibility for
deploying such technology within poultry farm context.
Regarding the first objective, an ample overview has been carried out among the common energy
conversion processes for biomass substances, revealing that, within a set of relevant constraints,
combustion seems the most interesting and attractive technology for poultry litter treatment.
Anaerobic digestion, while showing to be a feasible process using poultry litter and is a commercial
technology, has some major drawbacks using the litter as feedstock. Issues include high dilution
requirements, high ammonia production and high retention times. Furthermore, other processes
investigated in the study were only at a test pilot status like gasification or pyrolysis and for others, no
literature or minimal literature was found. Combustion of poultry litter is well documented in the
current literature for both test and trials and by the fact that currently, commercial plants in both
small-scale and large-scale for power generation or heat generation exist and are operating. In
particular FBC technology due to its intrinsic characteristics appears an interesting solution for
poultry litter combustion, being able to cope with issues and challenges connected with the poultry
litter combustion.
The techno-economic analysis required to build an articulated model to simulate the poultry farm
energy requirements, the FBC and the CHP characteristics, the overall system layout and the single
hour operation settings during the year. In particular for the latter, two scenarios were considered: the
Heat Driven (HD) case where the CHP plant is regulated in order to follow exactly the poultry farm
heat demand and the “Choice” case (CH) where priority is still given to the heat demand but it is
possible to increase the electricity generation if economically favoured.
The results obtained from the simulation have highlighted some interesting economic outputs: the
NPV has resulted in a positive value for all the reviewed CHP technologies at the end of the 20 years
period considered for the investment and above 1.3 million euro in all the operative methods; the PB
period and the DPB period results obtained were economically appealing, ranging between 3.3 and
3.9 years and 4 and 4.8 years in both the scenarios analysed, respectively; the IRR (considered for a
86
five years period) reached values between 9.52% and13.13% in the HD scenario and between 11.36%
and 14.87% in the CH scenario.
Benefits from the plant operation are also derived from the evaluation of the environmental impacts.
The analysis has taken into account only the CO2 emissions avoided (studies regarding additional
impacting categories can be found in literature). CO2 savings achieved by burning a biomass source
instead of LPG reached values of 621.77 tons/year for the model considered; furthermore, reduced
electricity dependence from the grid entailed additional savings, which depending on the CHP unit
and the scenario adopted, ranged between 169.37 to 313.61 tons per year.
Dependences of economic parameters with the variation of the set temperature inside the poultry
houses, the litter cost and the investment costs were also assessed in order to understand their
influence on the economics of the system: all of the cases showed non-negligible impact on the
economic results. For this reason and for the number of hypothesis adopted in all the analysis
procedure, in order to improve the model adherence to real conditions, it is suggested to:
Implement real data for the poultry farm model: this include among other things upgrade
structure characteristics, ventilation requirements, control systems, lighting requirements,
birds density and poultry litter production; in this way it is possible evaluating with more
accuracy the heat and electricity demand for the poultry houses;
Establish a properly baseline scenario or business as usual conditions for the farm energy
requirements;
Incorporate parameters taking into account health and comfort conditions for the birds (which
can affect the economic results of the analysis);
Implement real data for the FBC system from the existing and operative small-scale plants
and improve CHP units configuration in off-design operation;
Analyse in more detail the parasitic energy consumption (derived from the dissipative circuit,
from the fuel feeding system, etc.) and the system configuration between the co-generative
unit and the poultry farm;
Implement more accurate data for the investment costs and the operative costs (integrate LPG
consumption in start-up operation for example) and integrate the assumptions with real trend
in electricity tariffs and LPG costs;
Evaluate poultry litter costs with accuracy in case of import necessities;
Consider the opportunity of selling ashes as fertilizer (in this case ashes could represent
another source of revenue).

87
In the end, the results from the techno-economic analysis and the technology review show that small-
scale FBC systems for producing heat and electricity based on poultry litter are feasible projects,
attractive considering both the economic and the environmental aspects. Further research must be
carried out in order to further understand the technical and economic aspects of the overall benefits
achievable with this technology deployment.
It is furthermore fundamental to monitor the development of relevant policies and regulations
including: tighter restrictions on manure spreading limits, CO2 and pollutant emissions. More severe
regulations on manure management for environmental and health safety reasons can play a primary
role in this technology development.