controlling cascading failures in interdependent networks...
TRANSCRIPT
Controlling Cascading Failures in Interdependent Networks
under Incomplete Knowledge
Diman Zad Tootaghaj1
Novella Bartolini2Hana Khamfroush1
Thomas La Porta1
1 The Pennsylvania State University (US)2 Sapienza University (Italy)
I N
S R

Outline
2
• Motivation
• Problem Definition
• Proposed Algorithms
• Evaluation
• Conclusion

3
Natural disaster Malicious
attacks
Hurricane Random Failures

4
Natural disaster Malicious
attacks
Hurricane Random Failures
Recovery approaches may not work as they should due to lack of knowledge and uncertainty
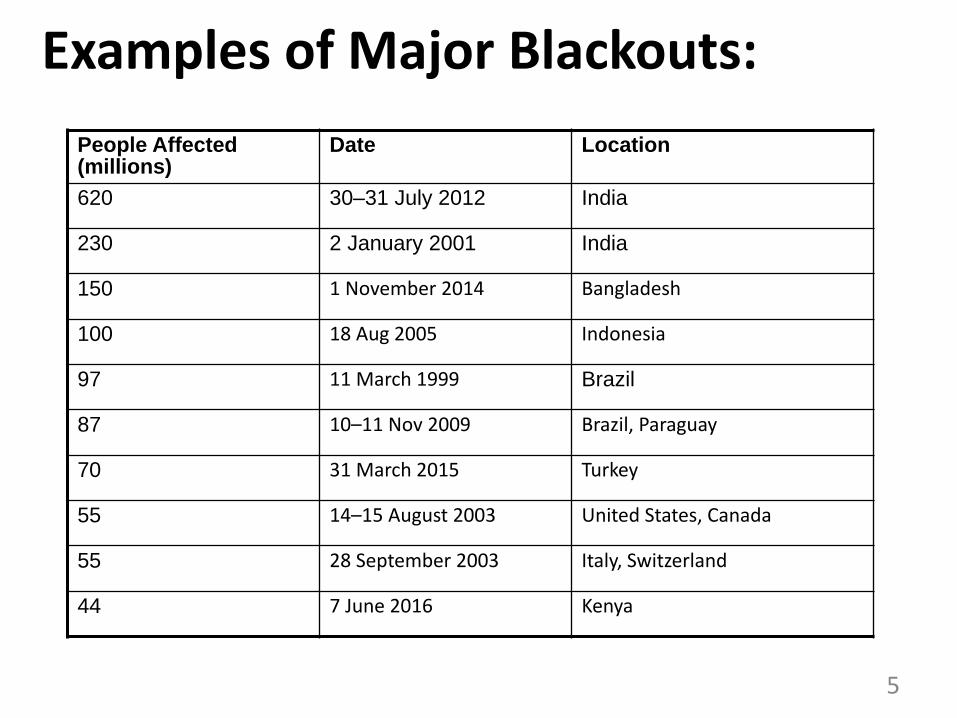
Examples of Major Blackouts:
5
People Affected (millions)
Date Location
620 30–31 July 2012 India
230 2 January 2001 India
150 1 November 2014 Bangladesh
100 18 Aug 2005 Indonesia
97 11 March 1999 Brazil
87 10–11 Nov 2009 Brazil, Paraguay
70 31 March 2015 Turkey
55 14–15 August 2003 United States, Canada
55 28 September 2003 Italy, Switzerland
44 7 June 2016 Kenya

Disruption in Multiple Networks
6
• Failures in multiple networks:
– Critical infrastructures are highly correlated and dependent• Power grid, Communication
network.
• Transportation network and food supply.
– Failure in one network causes failure in the other network.
– Recovery plan can be complicated without complete knowledge
p7
p1
p2
p3
p5
c4
p6
c2
c1
Power Grid
Communication Network
Failure
Uncontrollable nodes
Failure
Losing power
Uncontrollable
p4
p8
c3
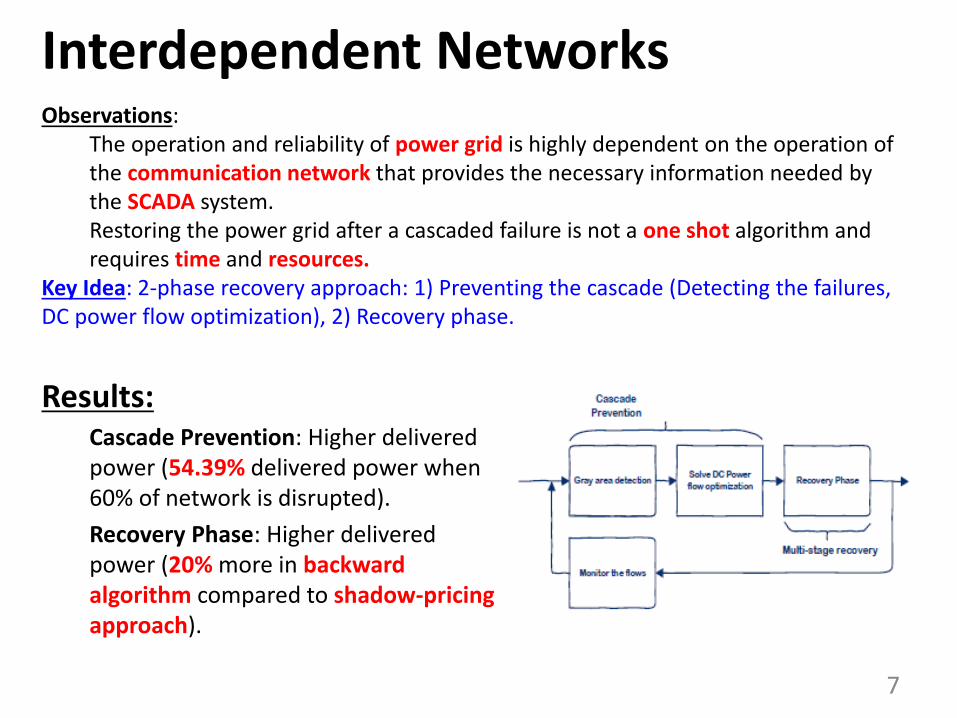
Interdependent Networks
7
Observations: The operation and reliability of power grid is highly dependent on the operation of the communication network that provides the necessary information needed by the SCADA system.Restoring the power grid after a cascaded failure is not a one shot algorithm and requires time and resources.
Key Idea: 2-phase recovery approach: 1) Preventing the cascade (Detecting the failures, DC power flow optimization), 2) Recovery phase.
Results:Cascade Prevention: Higher delivered power (54.39% delivered power when 60% of network is disrupted).
Recovery Phase: Higher delivered power (20% more in backward algorithm compared to shadow-pricing approach).

Outline
8
• Motivation
• Problem Definition
• Proposed Algorithms
• Evaluation
• Conclusion

(1) Preventing the Cascade
9
Key idea:Minimum Cost Flow Assignment
(Min-CFA): Re-distribute the power to
find a minimum cost feasible solution
without overloading other lines.
1) Solution is found using Linear
programming (LP) optimization.
2) What if the exact location of failure
is unknown or partially known?1) Consistent Failure set (CFS)
algorithm
2) Finds the exact location of failure if
the unknown graph is cycle-free.
3) If multiple consistent failure sets:
choose one using local inspection.

(1) Preventing the Cascade
All lines working:
10
P2 = 1.5
P3 = -2.0
P1 = 0.5
x12 = 1/3 P21=0.375

(1) Preventing the Cascade
11
P2 = 1.5
P3 = -2.0
P1 = 0.5
x12 = 1/3P21=1.5

(1) Detecting the failures
12
1 2
4
6
3
5
P1 =0.9
P4 =-1
P4 =-0.5
P5 =-0.1
P2 =1.2 P5 =-0.5
1 2
4
6
3
5
P1 =0.9
P4 =-1
P4 =-0.5
P5 =-0.1
P2 =1.2 P5 =-0.5
Key idea:Detecting the gray area by finding consistent failure sets.
If more than one consistent failure set: Use local inspection
1) If the gray area does not contain any cycles, the detection is easy
2) If the gray area consists of cycles: Use a decision tree and solve the DC power flow model to find consistent sets.

(1) Detecting the failures
13
Key idea:Detecting the gray area by finding consistent failure sets.
If more than one consistent failure set: Use local inspection
1) If the gray area does not contain any cycles, the detection is easy
2) If the gray area consists of cycles: Use a decision tree and solve the DC power flow model to find consistent sets.
23 ?
Consistent Inconsistent
1 2
4
6
3
5
P4 =-1
P4 =-0.5
P5 =-0.1
P2 =1.2 P3 =-0.5
F23 =0.6P1 =0.9Decision Tree

(2) Recovery phase
Key idea:
Maximum Recovery (Max-R): Recover the lines in k steps such the total delivered power during k steps is maximized.
Max-R is NP-Hard and intractable.
Recovery Heuristics:
1. Shadow pricing approach: Greedily recover power lines that add more to the total delivered power per unit of cost using Min-CFA.
2. Backward approach: Solve a single-stage assuming 𝑅1 + 𝑅2 + …+ 𝑅𝑘resources are available, and then solve for 𝑅1 + …+ 𝑅𝑘−1 to find the solution for step 𝑘
14
Outline
15
• Motivation
• Problem Definition
• Proposed Algorithms
• Evaluation
• Conclusion

Evaluation (Methodology)
Implementation:
• Python, Networkx, Gurobi optimization toolkitSolving LP optimization: gurobi optimization toolkit.Detection: CFS algorithm.Multiple consistent failure sets: local inspection.
16[1] V. Rosato et al. Modelling interdependent infrastructures using interacting dynamical models. International Journal of Critical Infrastructures, 2008.
Power grid (hviet) Communication network (garr)
Datasets used in our evaluation:
Italian high voltage power grid (hviet) [1],
Communication network (garr) [1].

Impact of Dependency Model
17
• Three types of dependency:
– Location-based
• Each power node is monitored and controlled by the closest power node and each communication node gets power from the closest power node.
– Random
• Each power node is monitored and controlled by a random communication node and each communication node gets power from a random power node
– One-way
• Communication nodes get power from an external source.
p7
p1
p2
p3
p5
c4
p6
c2
c1
Power Grid
Communication Network
Failure
Uncontrollable nodes
Failure
Losing power
Uncontrollable
p4
p8
c3
Location-based Dependency Model
Impact of Dependency Model
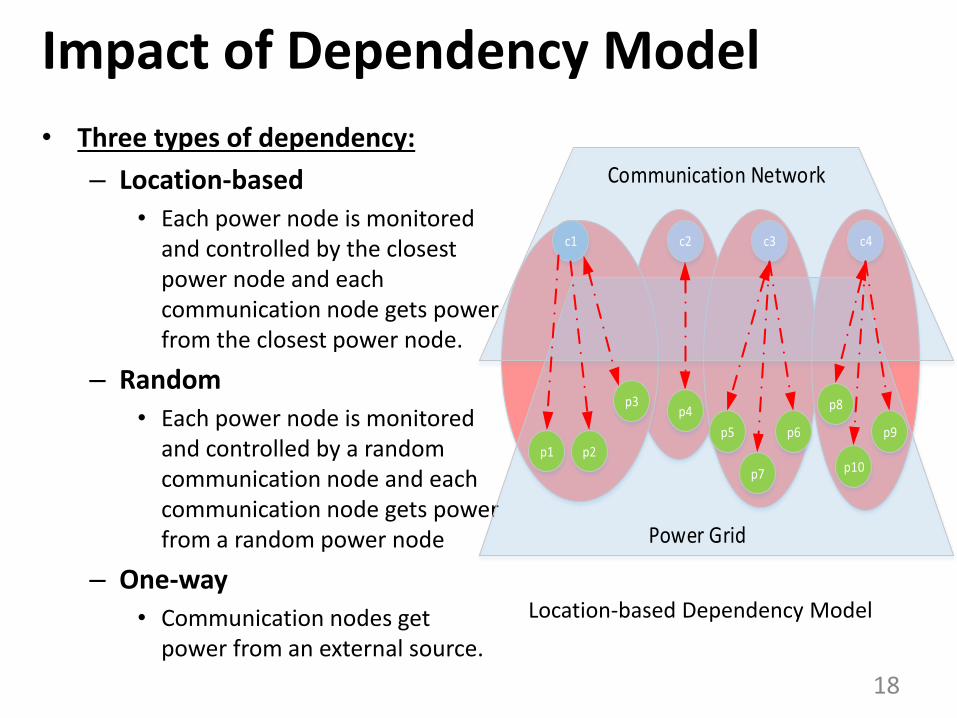
18
• Three types of dependency:
– Location-based
• Each power node is monitored and controlled by the closest power node and each communication node gets power from the closest power node.
– Random
• Each power node is monitored and controlled by a random communication node and each communication node gets power from a random power node
– One-way
• Communication nodes get power from an external source.
Location-based Dependency Model
p9
p1 p2
p3
p5
c4
p6
c2c1
Power Grid
Communication Network
p4 p8
c3
p7 p10

Impact of Dependency Model
19
• Three types of dependency:
– Location-based
• Each power node is monitored and controlled by the closest power node and each communication node gets power from the closest power node.
– Random
• Each power node is monitored and controlled by a random communication node and each communication node gets power from a random power node
– One-way
• Communication nodes get power from an external source.
p9p1 p2 p3 p5
c4
p6
c2c1
Power Grid
Communication Network
p4 p8
c3
p7 p10
Random Dependency Model

Impact of Dependency Model
Percentage of uncontrollable/disrupted nodes
20
In a random dependency model the disruption spreadsmore in the two networks while in a location-based
dependency model the disruption is limited to the initial failed area
Location-based Random
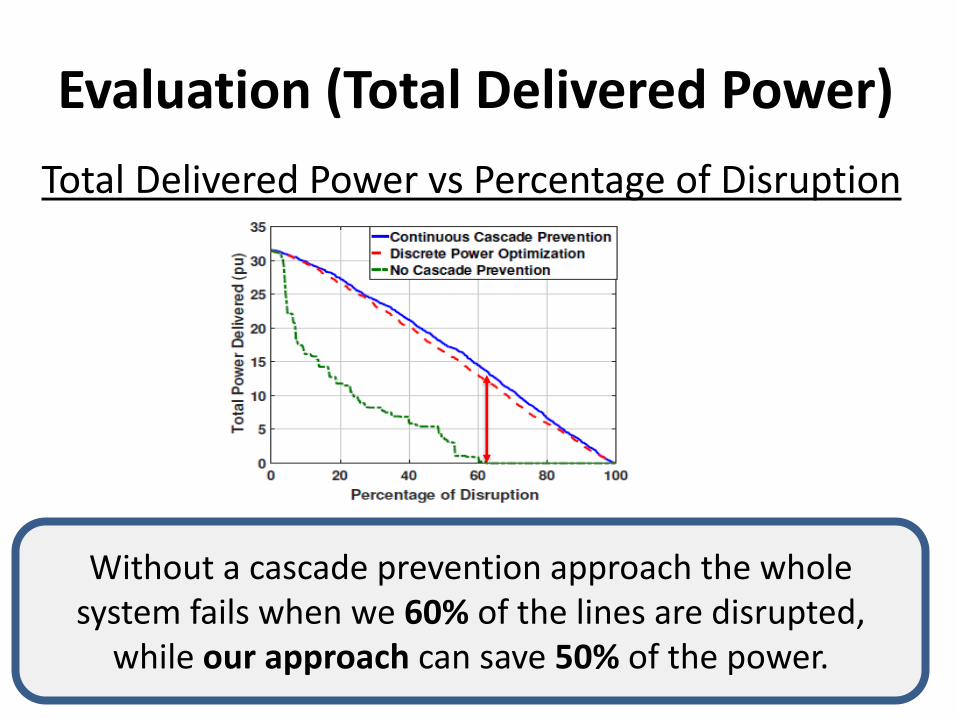
Evaluation (Total Delivered Power)
Total Delivered Power vs Percentage of Disruption
21
Without a cascade prevention approach the whole system fails when we 60% of the lines are disrupted,
while our approach can save 50% of the power.
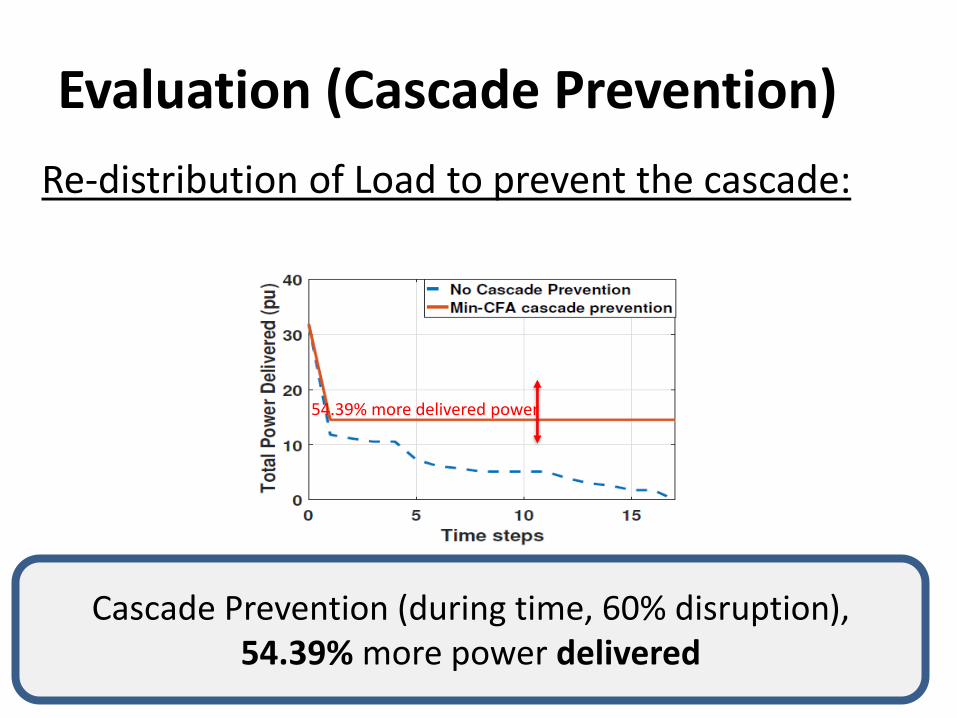
Evaluation (Cascade Prevention)
Re-distribution of Load to prevent the cascade:
22
Cascade Prevention (during time, 60% disruption), 54.39% more power delivered
54.39% more delivered power

Evaluation (Recovery Phase)
Comparison between backward and shadow-pricing
23
Recovery Phase: Backward Algorithm restores 20% more power with respect to shadow-pricing approach
20% more delivered power
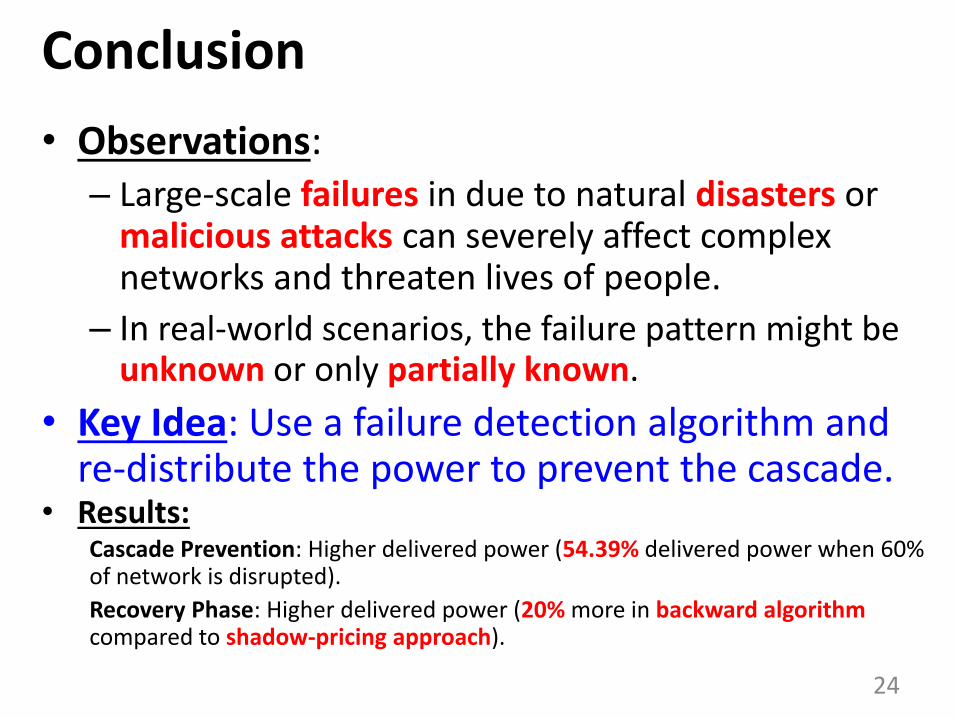
Conclusion
24
• Observations: – Large-scale failures in due to natural disasters or
malicious attacks can severely affect complex networks and threaten lives of people.
– In real-world scenarios, the failure pattern might be unknown or only partially known.
• Key Idea: Use a failure detection algorithm and re-distribute the power to prevent the cascade.
• Results:Cascade Prevention: Higher delivered power (54.39% delivered power when 60% of network is disrupted).
Recovery Phase: Higher delivered power (20% more in backward algorithmcompared to shadow-pricing approach).

Questions?
25

Hidden Slides
26

EvaluationDataset:
Italian high voltage power grid (hviet),
Communication network (garr) [1].
Solving LP optimization: gurobioptimization toolkit.
Detection: CFS algorithm.
Multiple consistent failure sets: local inspection.
Power grid (hviet) Communication network (garr)
Cascade Prevention (during
time, 60% disruption)Cascade Prevention
(Percentage of disruption)
Recovery Phase
[1] V. Rosato et al. Modelling interdependent infrastructures using interacting dynamical models. International Journal of Critical Infrastructures, 2008.27
54.39% more delivered power20% more delivered power